Embed Size (px)
Citation preview

Journal of Engineering Science and Technology 6
th EURECA 2016 Special Issue May (2017) 15 - 28
© School of Engineering, Taylor’s University
15
DIAGNOSIS OF LUNG RELATED DISEASES BY ASSESSING VIBRATION PATTERNS OF STRUCTURES AT
THE THORACIC CAVITY
SITI SARAH BT MOHD. ARIFF1, MOHAMMAD HOSSEINI FOULADI
1,*,
NARENDIRAN KRISHNASAMY2, SATESH NARAYANA NAMASIVAYAM
1,
MOHSEN NABI POOR1, PRIYA MADHAVAN
2, WONG ENG HWA
2
1School of Engineering, Taylor’s University, Taylor's Lakeside Campus, 2School of Medicine, Taylor’s University, Taylor's Lakeside Campus,
*Corresponding Author: [email protected]
Abstract
This paper aims to investigate the vibration measurements of the human chest
wall of non-smokers, cigarette smokers, and electrical cigarette smokers in
conducting human health diagnosis. Measurements were taken from 6 non-
smokers, 5 cigarette smokers, and 5 electrical cigarette smokers using an
accelerometer, a Data Acquisition (DAQ) hardware, a LabVIEW software for
collecting data and a Matlab software for spectral analysis. The accelerometer
was secured directly below the left nipple of chest wall. Time-domain signals
were then converted into frequency-domain through spectral analyses, which
include Fast Fourier Transform (FFT) analysis and Power Spectral Density
(PSD) analysis. Based on the FFT spectrum results, 90% of smokers show Amax
values of less than 1 x 10⁻⁵ G2, whereas 50% of non-smokers show Amax values
of more than 1 x 10⁻⁵ G2. The PSD graphs show 100% of non-smokers show no
noticeable frequency contents above 14 Hz, whereas 80% of smokers show
noticeable frequency contents after this point. There is definitely a correlation
between smokers and other respiratory diseases in terms of chest wall intensity
and frequency of vibration using spectral analyses.
Keywords: Chest wall, vibration, human health diagnosis, FFT, PSD.
1. Introduction
Vibration is known to be a dynamic phenomenon where it moves to-and-fro about
equilibrium position. When taking vibration measurements, it can either be
represented in the time domain or the frequency domain; the former shows the
change in amplitude of vibration with time, whereas the latter describes it with the

16 S. S. Mohd. Ariff et al.
Journal of Engineering Science and Technology Special Issue 5/2017
Nomenclatures
Amax Amplitude reading of the highest frequency peak, G2
Fmax Maximum frequency value with an amplitude reading of at least
5% of Amax, Hz
Abbreviations
AP Anterior-Posterior
DAQ Data Acquisition
DFT Discrete Fourier Transform
FFT Fast Fourier Transform
PC Personal Computer
PSD Power Spectral Density
frequency spectrum [1]. These two domains are mathematically related via the
Fourier Transform.
In the engineering field, machine fault diagnosis and health monitoring is one
of the main reasons vibration is measured. By conducting frequency analysis
through measuring a machine’s vibration, it can be tested to determine its lifespan
as well as predicting any impending problems [1]. For instance, an evaluation of
vehicle vibration on different types of roads was done to determine the ride
comfort of the passenger [2]. The vibration readings can show indications of
possible problems, if any, thus allowing preventive steps to be taken.
By taking that same principle, theoretically, it can be applied in the human
health diagnosis whereby chest wall vibration measurements of smoking and
non-smoking subjects are obtained. The frequency content in the smoking
subjects might show some sort of an indicator of impending problems. The
vibrational energy of these test subjects is to be studied to perform an educated
human health diagnosis.
The human chest wall, which consists of structures such as the diaphragm, the
ribcage and the abdomen, undergoes a vibrational energy during respiration [3].
Data on the chest wall vibration between different types of people have not yet
been greatly quantified, especially between smoking and non-smoking subjects.
Looking at it from a medical point of view, assessing the chest wall motion and
its behaviour is a common medical practice. Medical students were taught to
evaluate the chest wall expansion by placing their hands on the back of the patient;
the thumb being on the midline section [4]. However, it is crucial to quantify these
chest wall motions. Konno and Mead [5] were the firsts who attempted a
measurement and mathematical analysis of chest wall motion by demonstrating that
it is possible to obtain accurate volume changes by measuring anterior-posterior
(AP) diameter changes at the abdomen and ribcage. Another study was done to
determine the effects of smoking on the heart rate of people between the age of 20 -
29 years old when they were at rest and during exercise [6].
It is said that a more solid structure has higher pitch (higher frequency) and a
softer intensity (lower amplitude), whereas a more air-filled structure has lower
pitch (lower frequency) and a louder intensity (higher amplitude) [7]. Therefore,

Diagnosis of Lung Related Diseases by Assessing Vibration Patterns of . . . . 17
Journal of Engineering Science and Technology Special Issue 5/2017
the frequency content and amplitude depend on the air content and nature of the
structures present at the location of percussion.
The main objective of this study is to investigate the frequency content of the
human chest wall vibration in non-smokers, cigarette smokers and electrical
cigarette smokers, and use the frequency component of measuring signals for
health diagnosis. Malaysia is currently facing challenges due to long waiting time
for radiological diagnostic services. The conventional approach for detecting lung
related diseases is to capture the x-ray image of chest and examine for lungs
deformations. This research is proposing a new technique for preliminary
diagnosis of lung related diseases based on processing the vibration patterns of
structures from the thoracic cavity. It is worth highlighting that the source of
vibration from the outer chest wall are from both heart and lungs, even though the
preliminary assessment is for lung related disease.
2. Research Methodology
2.1. Design of experiment
The experiment aims to measure the chest wall vibration of smoking and non-
smoking subjects using a physical device. Note that the smoking subjects will
further consist of normal cigarette smokers and electrical cigarette smokers. The
physical device used is called the DAQ system, which includes the accelerometer,
the data acquisition (DAQ) measurement hardware, and the LabVIEW software
installed on a Personal Computer (PC). The accelerometer acts as a sensor, which
is generally known to convert a physical phenomenon (eg. vibration) into
electrical signals [1]. These electrical signals will then be sent to the DAQ
measurement hardware for signal conditioning and analog-to-digital conversion
before they are sent to the PC for visualization of data.
There were 16 test subjects that volunteered in this experiment; 6 non-
smokers, 5 cigarette smokers, and 5 electrical cigarette smokers. It should be
taken into consideration that there was only one female test subject under the
cigarette-smoking category. The other 15 test subjects were all males. All test
subjects were aged between 22 - 27 years old. A short survey was conducted at
the end of every experiment to find out about the test subject smoking habits and
whether they have any other health issues, allowing the author to observe any
correlation with the experimental results. It is noted that all test subjects were
considered “healthy” and did not have any other health issues. Also, 2 out of 10 of
the smokers have only been smoking for only 2-4 years, whereas the rest of them
have been smoking for 5 years or more.
The experiment was conducted at the Clinical Theatre, Taylor’s University.
The accelerometer was attached on the patient’s chest, below the left nipple, with
a double sided medical tape, designed to be gentle as well as secure enough on
human skin. Typically, doctors are trained to assess the heart beat sounds by
placing the stethoscope at four primary areas [7]; the second rib of the left and
right sternum, left sternum of the fourth rib, and at the fifth rib level right below
the left nipple line.

18 S. S. Mohd. Ariff et al.
Journal of Engineering Science and Technology Special Issue 5/2017
These four primary areas are all located below the two nipples, more so on the
left nipple, proving that they are the optimal places to listen to heart sounds
because both lung and heart movements can clearly be detected. Based on this,
the point of detecting vibration for this study was below the left nipple area. The
placement of the accelerometer was done by a trained lecturer from School of
Medicine. Fig. 1 shows one of the test subjects in supine position while vibration
measurements were taken.
Fig. 1. Taking of measurements of a test subject in a supine position.
Referring to Fig. 2, the sensor used was a Bruel & Kjaer DeltaTron
Accelerometer Type 4507 B with a frequency range of 0.3 Hz - 6 kHz. The DAQ
measurement hardware used for this study is NI 9234 Module with 1-slot NI
CompactDAQ Chassis with a maximum bandwidth of 23 kHz, which would be
sufficient for the study of the human chest wall vibration. LabVIEW and Matlab
will be used for data collection and data analysis respectively.
(a) (b)
Fig. 2. (a) Bruel & Kjaer DeltaTron Accelerometer Type 4507 B,
(b) DAQ Hardware used in the experiment.

Diagnosis of Lung Related Diseases by Assessing Vibration Patterns of . . . . 19
Journal of Engineering Science and Technology Special Issue 5/2017
This accelerometer was connected to the DAQ measurement hardware which
is connected to the PC. During the collection of data, the patient will be in supine
position in a relaxed state, while making no sudden movement as that might affect
the data. Data collected from each patient will be stored into the PC.
2.2. Data collection parameters
Fekr et al. used a sampling rate of 50 Hz to measure respiration rate [8], Kikhia et
al. [9] used 10 Hz to measure body movement, and Dehkordi et al. used 500 Hz to
record upper-body acceleration and the movement of chest and abdomen wall
[10]. The author decided to use 500 Hz as a sampling rate to be safe, as too low of
a sampling rate will cause aliasing. The signals were collected at 15000 samples
with a sampling frequency of 500 Hz. The amplitude unit was set as G, which
equates to approximately 9.81 m/s2. It is noted that results and discussions will be
expressed in terms of the unit G.
2.3. Pre-processing of Data
Before conducting the data analysis, a pre-processing stage was added. This pre-
processing stage was necessary because it was seen that the time-domain signals were
rather noisy, which might bury the desired frequency contents after signal processing.
Therefore, a filter was needed to minimize or even eliminate this unwanted noise, thus
achieving clearer results for the post-processing stage. A 2nd
order Butterworth low-
pass filter was used with a cut-off frequency of 20 Hz.
2.4. Post-Processing & Analysis of Data
Figure 3 shows the signal analysis and measurement workflow of this study. After
obtaining the results in LabVIEW, the data will be presented in the time domain.
Data will then be converted into frequency domain through spectral analyses used
in this experiment; Fast Fourier Transform (FFT) spectrum and Power Spectral
Density (PSD) analyses. This conversion can be done using Matlab software. To
do this, the raw signals in time-domain collected in LabVIEW must first be
imported into Matlab software in the form of excel files.
Fig. 3. Signal analysis and measurement workflow.

20 S. S. Mohd. Ariff et al.
Journal of Engineering Science and Technology Special Issue 5/2017
3. Results
The graphs for FFT and PSD were all obtained using Matlab Signal Processing
Toolbox. The results were first visually analyzed by observing any difference or
repeating patterns between the non-smokers, cigarette smokers, and electrical
cigarette smokers. The main points to look for would be the amplitude readings,
the frequency contents, as well as the shape of the graph. Note that the amplitude
units for FFT and PSD graphs are G2 and G
2/Hz respectively; whereas the
frequency unit for all graphs is in Hz.
Referring to Fig. 4, the FFT graphs were analyzed by observing the
amplitude reading (Amax) of the highest frequency peak. In addition, the
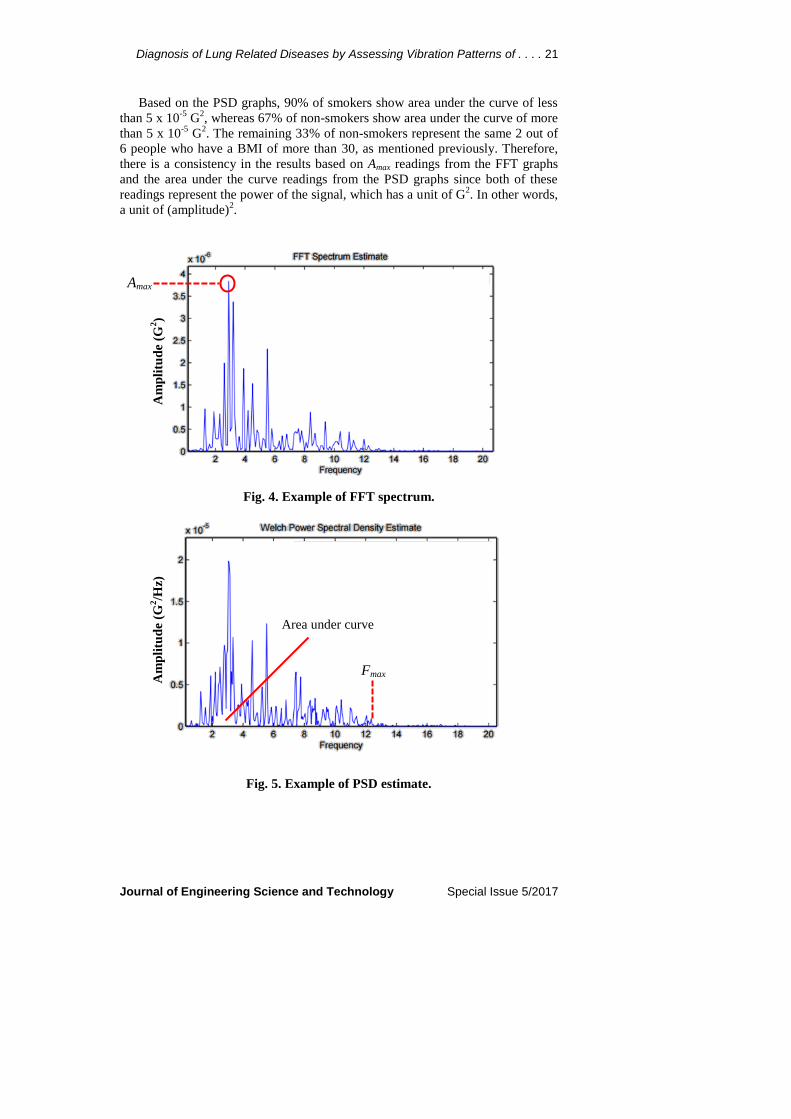
frequency content is observed by determining the Fmax value based on the PSD
graphs; whereby Fmax is the maximum frequency value with an amplitude
reading of at least 5% of Amax (as shown in Fig. 5). Moreover, the area under the
curve of the PSD graphs were obtained by using the Matlab function Trapz to
obtain more information about the power content of the graphs between the test
subjects. All these results were then tabulated.
The first thing to note is that the all of the signals seem to be harmonic signals.
In other words, the frequency components that were obtained in the graphs were
multiples of the fundamental frequency. These frequency components are known
to be harmonics. Considering that the signals are heartbeat signals, this would
make sense as a heartbeat motion consists of a highly repeatable series of sine and
cosine waveform. It is known that all harmonic signals are periodic as well.
First and foremost, the Amax, Fmax, and area under the curve readings between
the cigarette and electrical cigarette smokers showed no difference during the
research. This can be explained with the fact that all electrical cigarette smokers
started with the conventional cigarette before switching to electrical cigarette.
Moreover, the market of electrical cigarette is rather new, so there might not be
enough time for it to show any significant effects towards the human body. For
ease of discussion, the author will refer to both categories cigarette and electrical
cigarette smokers as “smokers”. Referring to the FFT spectrum graphs in Figs. 6
and 7, it can be seen visually that the Amax values of non-smokers are higher than
that of smokers. PSD analyses in Figs. 8 and 9 reveal that most of non-smokers
show Fmax of no more than 14 Hz whereas most smokers do show Fmax reading of
more than 14 Hz. It is also seen that the frequency peak with highest amplitude
for both smokers and non-smokers range between of 1 - 6 Hz. The data is
tabulated in Table 1 to have a better overview of the findings.
It is important to take note of the exception cases in the data obtained from the
16 test subjects. Based on all the FFT spectrum results, 90% of the smokers show
Amax values of less than 1 x 10⁻⁵
G2, whereas 50% of non-smokers show Amax
values of more than 1 x 10⁻⁵
G2. However, this low percentage of non-smokers
might be contributed to two things; the number of non-smoker test subjects are
much less than that of smokers, and that 2 out of the 6 non-smokers have a BMI
of more than 30, which by the standards equate to being obese [11]. The thicker
layer of the chest wall due to the fat causes the sound transmission to be
diminished, thus resulting in lower amplitude.
Diagnosis of Lung Related Diseases by Assessing Vibration Patterns of . . . . 21
Journal of Engineering Science and Technology Special Issue 5/2017
Based on the PSD graphs, 90% of smokers show area under the curve of less
than 5 x 10⁻⁵
G2, whereas 67% of non-smokers show area under the curve of more
than 5 x 10⁻⁵
G2. The remaining 33% of non-smokers represent the same 2 out of
6 people who have a BMI of more than 30, as mentioned previously. Therefore,
there is a consistency in the results based on Amax readings from the FFT graphs
and the area under the curve readings from the PSD graphs since both of these
readings represent the power of the signal, which has a unit of G2. In other words,
a unit of (amplitude)2.
Fig. 4. Example of FFT spectrum.
Fig. 5. Example of PSD estimate.
Fmax
Area under curve
Am
pli
tud
e (G
2/H
z)
Amax
Am
pli
tud
e (G
2)

22 S. S. Mohd. Ariff et al.
Journal of Engineering Science and Technology Special Issue 5/2017
(a) (a)
(b) (b)
(c) (c)
Fig. 6. FFT spectrum for non-
smokers.
Fig. 7. FFT spectrum for
smokers.

Diagnosis of Lung Related Diseases by Assessing Vibration Patterns of . . . . 23
Journal of Engineering Science and Technology Special Issue 5/2017
(a) (a)
(b) (b)
(c) (c)
Fig. 8. PSD estimate for
non-smokers.
Fig. 9. PSD estimate for
smokers.

24 S. S. Mohd. Ariff et al.
Journal of Engineering Science and Technology Special Issue 5/2017
Table 1. Data on all test subjects.
Type Age BMI Health Amax (G2)
Area
Under
Curve
(G2)
Fmax
(Hz)
Non-Smoker 23 32.1 Obese 1.8497E-6 1.2119E-5 12.0
Non-Smoker 24 24.2 Normal 2.2804E-5 9.9112E-5 12.0
Non-Smoker 23 26.5 Overweight 2.2997E-5 1.0594E-4 8.0
Non-Smoker 23 35.1 Obese 3.0519E-6 1.1772E-5 8.0
Non-Smoker 25 19.3 Normal 5.9019E-5 1.28E-4 14.0
Non-Smoker 27 23.1 Normal 7.4016E-6 9.1816E-5 14.0
Cigarette Smoker 22 26.6 Overweight 3.5080E-6 1.9653E-5 20.0
Cigarette Smoker 23 29.8 Overweight 7.2635E-6 4.6328E-5 12.2
Cigarette Smoker 24 24.5 Normal 5.0531E-6 4.7289E-5 21.0
Cigarette Smoker 25 25.9 Overweight 6.3290E-6 4.662E-5 20.0
Cigarette Smoker 25 19.7 Normal 3.2736E-5 1.2246E-4 16.0
Electrical
Cigarette Smoker
23 21.5 Normal 4.0804E-6 2.0644E-5 18.0
Electrical
Cigarette Smoker
23 19.0 Normal 4.4767E-6 2.7298E-5 18.0
Electrical
Cigarette Smoker
25 26.1 Overweight 6.4281E-6 4.8181E-5 12.0
Electrical
Cigarette Smoker
23 23.6 Normal 8.9689E-6 3.9817E-5 18.0
Electrical
Cigarette Smoker
23 25.0 Overweight 3.0279E-7 6.5602E-6 21.0
Based on these same PSD graphs, 100% of non-smokers show no noticeable
frequency contents above 14 Hz, whereas 80% of smokers show noticeable
frequency contents after this point. It is important to take note of the exceptions,
as it may be correlated to any health issues. The other 20% of smokers showed
little to no frequency content above 14 Hz, possibly due to the fact that these test
subjects have only smoked for only 2 - 4 years.
4. Discussions
It is said that a more solid structure has higher pitch (higher frequency) and a
softer intensity (lower amplitude), whereas a more air-filled structure has lower
pitch (lower frequency) and a louder intensity (higher amplitude) [7]. Therefore,
the frequency content and amplitude depend on the air content and nature of the
structures present at the location of percussion. Following this same concept,
this would suggest that non-smokers have a more air-filled chest wall structure
when compared to smokers, and smokers have a more solid chest wall structure.
Moreover, the higher frequency readings in smokers would suggest a more
rapid breathing.
In a smoker, some lung tissue would be loss [12]. Lung tissues referred here
would be the air sac and tubular structures that carry the air to the air sacs

Diagnosis of Lung Related Diseases by Assessing Vibration Patterns of . . . . 25
Journal of Engineering Science and Technology Special Issue 5/2017
(alveoli). The loss of these lung tissues will cause a block in the bronchiole, or
may even cause the alveoli to lose its elastic recoiling capacity, which is needed
for gas exchange to happen. Even though smokers can inhale well, the air may not
reach the terminal air sacs due to the blockage at the bronchiole. When compared
to this, non-smokers seem to have better ventilated lungs, which explain why the
results suggest they have more air-filled lung structure.
The inability of air reaching the terminal air sacs for smokers results in no gas
exchange to occur. Consequently, there is more carbon dioxide present than
oxygen. The brain detects this lack of oxygen, which in turn triggers the
respiration action, thus increasing the breathing rate. This would explain why
smokers have higher frequency content. Severe cases would cause the person to
start panting.
The increase in breathing rate in smokers would also mean a higher heart rate.
Papathanasiou et al. conducted a study which proved that smokers have higher
heart rate values than non-smokers [6] at rest among young adults, thus
supporting the results of this experiment. A high resting heart rate may be a sign
of any manifestations of cardiovascular disease and might help in identifying a
person with any risk of this disease.
A study was done to determine the spectral characteristic of sound
transmission of the typical human chest wall [13]. It showed that the sound
vibration of the chest surface is loudest at low frequencies and there is a
decrement in amplitude with increasing frequency, which is a clear pattern among
all of the graphs obtained in this experiment.
The higher amplitude readings (at low frequency) and area under the curve of
the non-smokers suggest higher vibration intensity, which agrees with a study
done by Yigla et al. [14] using a Vibration Response Imaging (VRI) device. VRI
is a technology used to measure the intensity of vibration by producing a grey-
scale image. Darker images represent a higher intensity in vibration whereas
lighter images represent a lower intensity [15]. It was found by Yigla et al. that
non-smokers show a darker and symmetrical images of the lungs, which suggest
they have higher vibration intensity throughout the entire lungs. In contrast,
smokers have a slight inconsistency in vibration intensity throughout the lungs.
Inhaling cigarette smoke has shown to cause changes in respiratory function
that includes coughing, irritation of airways and alterations in resistance to
airflow. There are other studies on the human respiratory systems with people that
have respiratory problems which might have some correlation with the findings
obtained in this experiment. It was found that patients with emphysema, which is
a condition of damaged air sacs of the lungs, showed a lower amplitude readings
at low frequencies [16]. In addition, Yonemaru et al. [17] found that patients with
tracheal stenosis display a rise in power (amplitude reading) at higher frequencies
through frequency analysis. Tracheal stenosis is a condition whereby the trachea
is narrowed, causing difficulty in breathing. These studies show a similar pattern
among the smokers of this experiment.
It is known that there is a strong relationship between lung sound amplitude
and its ventilation, whereby lung sounds were the loudest with best ventilated
lung units [18]. This can be seen in the current study whereby non-smokers show

26 S. S. Mohd. Ariff et al.
Journal of Engineering Science and Technology Special Issue 5/2017
higher vibration intensity, thus suggesting having a better ventilated lung unit.
Moreover, studies using bronchoprovocation challenge testing have shown that
high frequency breathing sounds were obtained in lung analysis as the bronchial
airways get narrowed [19]. This would suggest that smokers might show signs of
having narrower airways.
However, there are no clinical evidences among the smokers of having any
lung abnormalities, apart from them being smokers. Nevertheless, smooth-muscle
hypertrophy, increased fibrosis, inflammation, and goblet cells can be found in
the lungs of smokers that have no clinical evidence of respiratory diseases [20].
These histologic changes may slightly alter the sound vibration transmission
through the lungs and its airways. Our findings show that spectral analysis does in
fact show a promise in detecting these subtle disease changes.
There is definitely a correlation between smokers and other respiratory
diseases in terms of chest wall intensity and frequency of vibration using spectral
analyses. The results obtained throughout this experiment suggest that smokers
experience a decrease in lung function and may have a higher risk of having
respiratory problems in the future. This information may be used to encourage
young people to quit smoking. A medical health screening should be performed
among heavy smokers to monitor how bad it is.
Accelerometers are built into smart phones and there are various possibilities
to use this to our advantage. Even though a microphone is typically used to
measure the human lung vibration, an accelerometer is proven to work just as
well. An app could be built by including algorithms which would display the PSD
and FFT graphs for consumers to visualize their heartbeat reading, using this
experiment as a guideline to distinguish a non-smoker’s and a smoker’s heartbeat.
5. Conclusions
The results showed that the type of smokers (cigarette and electrical cigarette
smokers) does not affect the Amax, Fmax or the area under the curve of the FFT and
PSD graphs. Based on results, there is a significant effect between smokers and
non-smokers on Amax, Fmax or the area under the curve of the FFT and PSD graphs.
Non-smokers show higher Amax, higher area under the curve, and lower Fmax;
whereas smokers show lower Amax, lower area under the curve and higher Fmax.
Based on the FFT spectrum results, 90% of smokers show Amax values of less
than 1 x 10⁻⁵
G2, whereas 50% of non-smokers show Amax values of more than 1 x
10-5
G2. The PSD graphs show 100% of non-smokers show no noticeable
frequency contents above 14 Hz, whereas 80% of smokers show noticeable
frequency contents after this point.
These results have definitely shown a correlation between people who smoke
and people with respiratory diseases, which suggest that smokers would have
higher risk of having respiratory problems in the future. This information should
be used to encourage young people to quit smoking.
Moreover, it can be said that an accelerometer is as good as a microphone to
measure the chest wall vibration, thus creating a potential of measuring the chest wall
vibration with our smartphones since there are built in accelerometers in them already.

Diagnosis of Lung Related Diseases by Assessing Vibration Patterns of . . . . 27
Journal of Engineering Science and Technology Special Issue 5/2017
Smokers can monitor their breathing rate through this app and take preventive
precautions accordingly, such as minimizing the amount of cigarettes smoked within
the day, using a nicotine replacement therapy or even to quit cold turkey.
This experiment has achieved both project objectives which were to conduct
frequency analysis of chest wall vibration between smokers and non-smokers, as
well as to conduct a human health diagnosis based on the results.
References
1. Serridge, M.; and Licht T.R. (1987). Accelerometers piezoelectric and
vibration preamplifiers: Theory and application handbook. Brüel & Kjær,
Denmark.
2. Nahvi, H.; Hosseini Fouladi, M.; and Nor, M. J. M. (2009). Evaluation of
whole-body vibration and ride comfort in a passenger car. International
Journal of Acoustics and Vibraton, 14(3), 143-149.
3. Seddon, P. (2015). Options for assessing and measuring chest wall motion.
Paediatric Respiratory Reviews, 16(1), 3-10.
4. Campbell, R. M. (2016). VEPTR expansion thoracoplasty. In: The growing
spine: Management of spinal disorders in young children. Heidelberg:
Springer Berlin Heidelberg, 669-690.
5. Konno, K.; and Mead, J. (1967) Measurement of the separate volume
changes of ribcage and abdomen during breathing. Journal of Applied
Physiology, 22, 407–422.
6. Papathanasiou, G.; Georgakopoulos, D.; Papageorgiou, E.; Zerva, E.;
Michalis, L.; Kalfakakou, V.; Evangelou, A. (2013). Effects of smoking on
heart rate at rest and during exercise, and on heart rate recovery, in young
adults. Hellenic Journal of Cardiology, 54(3), 168-177.
7. Jensen, S. (2015). Pocket guide for nursing health assessment (2nd ed.).
Philadelphia: Wolters Kluwer Health.
8. Fekr, A.R.; Janidarmian, M.; Radecka, K.; and Zilic, Z. (2014). A medical
cloud-based platform for respiration rate measurement and hierarchical
classification of breath disorders. Sensors (Basel), 14(6), 11204-11224.
9. Kikhia, B.; Gomez, M.; Jimé, L.L. (2014). Analyzing body movements
within the laban effort framework using a single accelerometer. Sensors
(Basel), 14(3), 5725-5741.
10. Dehkordi, P.; Tavakolian, K.; Marzencki, M.; Kaminska, M.; Kaminska, B.
(2014). Assessment of respiratory flow and efforts using upper-body
acceleration. Medical & Biological Engineering & Computing, 52(8), 653-661.
11. NHLBI obesity education initiative expert panel on the identification,
evaluation, and treatment of overweight and obesity in adults (1998). Clinical
guidelines on the identification, evaluation, and treatment of overweight and
obesity in adults: The Evidence Report. National Institutes of Health,
Publication No. 98-4083.
12. Parent, R.A. (2015). Comparative biology of the normal lung (2nd
ed.).
Academic Press.

28 S. S. Mohd. Ariff et al.
Journal of Engineering Science and Technology Special Issue 5/2017
13. Wodicka, G.R.; Stevens, K.N.; Golub, H.L.; and Shannon, D.C. (1990).
Spectral characteristics of sound transmission in the human respiratory
system. IEEE Transactions on Biomedical Engineering, 37(12), 1130-1135.
14. Yigla, M.; Gat, M.; Meyer, J.J.; Friedman, P.J.; Maher, T.M.; and Madison,
J.M. (2008). Vibration response imaging technology in healthy subjects.
American Journal of Roentgenology, 191(3), 845-852.
15. Bartziokas, K.; Daenas, C.; Preau, S.; Zygoulis, P.; Triantaris, A.; Kerenidi,
T.; Makris, D; Gourgoulianis, K.I.; and Daniil, Z. (2010). Vibration response
imaging: Evaluation of rater agreement in healthy subjects and subjects with
pneumonia. BMC Medical Imaging, 10(1), 6.
16. Reichert, S.; Gass, R.; Brandt, C.; and Andrès, E. (2008). Analysis of
respiratory sounds: State of the art. Clinical Medicine Insights: Circulatory,
Respiratory and Pulmonary Medicine, 2, 45-58.
17. Yonemaru, M.; Kikuchi, K.; Mori, M.; Kawai, A.; Abe, T.; Kawashiro, T.;
Ishihara, T.; Yokoyama, T. (2013). Detection of tracheal stenosis by
frequency analysis of tracheal sounds. Journal of Applied Physiology, 75(2),
605-612.
18. Schreur, H.J.; Sterk, P.J.; Vanderschoot, J.; Van Klink, H.C.; Van
Vollenhoven, E.; and Dijkman, J.H. (1992). Lung sound intensity in patients
with emphysema and in normal subjects at standardised airflows. Thorax,
47(9), 674-679.
19. Nagasaka, Y. (2012). Non-invasive monitoring of airway inflammation in
asthma lung sounds in bronchial asthma. Allergology International, 61(3),
353-363.
20. Cosio Piqueras, M.G.; and Cosio, M.G. (2001). Disease of the airways in
chronic obstructive pulmonary disease. The European Respiratory Journal,
18(34), 41S-49S.