Embed Size (px)
Citation preview
Author's Accepted Manuscript
Diagnostic Accuracy of Multiparametric Magnetic Resonance Imaging to IdentifyClear Cell Renal Cell Carcinoma in cT1a Renal Masses
Noah E. Canvasser , Fernando U. Kay , Yin Xi , Daniella F. Pinho , Daniel Costa ,Alberto Diaz de Leon , Gaurav Khatri , John R. Leyendecker , Takeshi Yokoo ,Aaron Lay , Nicholas Kavoussi , Ersin Koseoglu , Jeffrey A. Cadeddu , IvanPedrosa
PII: S0022-5347(17)57863-5DOI: 10.1016/j.juro.2017.04.089Reference: JURO 14722
To appear in: The Journal of UrologyAccepted Date: 18 April 2017
Please cite this article as: Canvasser NE, Kay FU, Xi Y, Pinho DF, Costa D, de Leon AD, KhatriG, Leyendecker JR, Yokoo T, Lay A, Kavoussi N, Koseoglu E, Cadeddu JA, Pedrosa I, DiagnosticAccuracy of Multiparametric Magnetic Resonance Imaging to Identify Clear Cell Renal Cell Carcinoma incT1a Renal Masses, The Journal of Urology® (2017), doi: 10.1016/j.juro.2017.04.089.
DISCLAIMER: This is a PDF file of an unedited manuscript that has been accepted for publication. As aservice to our subscribers we are providing this early version of the article. The paper will be copy editedand typeset, and proof will be reviewed before it is published in its final form. Please note that during theproduction process errors may be discovered which could affect the content, and all legal disclaimersthat apply to The Journal pertain.
Embargo Policy
All article content is under embargo until uncorrected proof of the article becomes availableonline.
We will provide journalists and editors with full-text copies of the articles in question prior to the embargodate so that stories can be adequately researched and written. The standard embargo time is12:01 AM ET on that date. Questions regarding embargo should be directed to [email protected].

MANUSCRIP
T
ACCEPTED
ACCEPTED MANUSCRIPT
Diagnostic Accuracy of Multiparametric Magnetic Resonance Imaging to Identify Clear Cell
Renal Cell Carcinoma in cT1a Renal Masses
Noah E. Canvasser1, Fernando U. Kay
2, Yin Xi
2, Daniella F. Pinho
2, Daniel Costa
2, Alberto Diaz de
Leon2, Gaurav Khatri
2, John R. Leyendecker
2, Takeshi Yokoo
2, Aaron Lay
1, Nicholas Kavoussi
1,
Ersin Koseoglu1, Jeffrey A. Cadeddu
1,2, Ivan Pedrosa
2,3
1Department of Urology, University of Texas Southwestern, Dallas, TX
2Department of Radiology, University of Texas Southwestern, Dallas, TX
3Advanced Imaging Research Center, University of Texas Southwestern, Dallas, TX
* Correspondence:
Jeffrey A. Cadeddu, MD
Department of Urology
University of Texas Southwestern Medical Center
5323 Harry Hines Blvd
Dallas, TX 75390-9110
214-648-2888
FAX: 214-648-8786
Running head: mpMRI identification of clear cell RCC in SRM
Key Words: kidney neoplasms; carcinoma, renal cell; MRI
Abstract words (max 250): 250
Manuscript words (max 2500): 2500
Pages: 21
Tables: 2
Figures: 4
References (max 30): 30
Extra-institutional funding: SPORE grant #P50CA196516; partially funded by grant
#5RO1CA154475
Institutional Review Board approval: Yes

MANUSCRIP
T
ACCEPTED
ACCEPTED MANUSCRIPT 2
Abstract
Purpose
Detection of small renal masses is increasing with the use of cross-sectional imaging, although
many incidental lesions have negligible metastatic potential. Among malignant masses, clear
cell renal cell carcinoma is the most prevalent and aggressive subtype, and a method to identify
such histology would aid in risk stratification. Our goal was to evaluate a likelihood scale for
multiparametric magnetic resonance imaging in the diagnosis of clear cell histology.
Methods
Patients with cT1a masses who underwent MRI and partial or radical nephrectomy from
December 2011 to July 2015 were retrospectively reviewed. Seven radiologists with different
levels of experience and blinded to final pathology independently reviewed studies based on a
predefined algorithm, and applied a clear cell likelihood score: 1) definitely not, 2) probably not,
3) equivocal, 4) probably, and 5) definitely. Binary classification determined the accuracy of
clear cell versus 'all other' histologies, and inter-observer agreement was calculated with a
weighted κ statistic.
Results
In total, 110 patients with 121 masses were identified. Mean tumor size was 2.4 cm and 50%
were clear cell. Defining clear cell as scores ≥4 demonstrated sensitivity and specificity of 78%
and 80%, respectively, while scores ≥3 were 95% and 58%, respectively. Inter-observer
agreement was moderate to good, with a mean κ of 0.53.

MANUSCRIP
T
ACCEPTED
ACCEPTED MANUSCRIPT 3
Conclusions
A clear cell likelihood score with MRI can reasonably identify clear cell histology in small renal
masses, and may reduce the number of diagnostic renal mass biopsies. Standardization of
imaging protocols and reporting criteria are needed to improve inter-observer reliability.
MANUSCRIP
T
ACCEPTED
ACCEPTED MANUSCRIPT 4
Introduction
Approximately one quarter of small renal masses (SRM) less than 4 cm are histologically
benign.1 However, the role of percutaneous biopsy in the management of SRM remains
controversial.2 Recent evidence indicates that while renal mass biopsy (RMB) is highly accurate
in renal cell carcinoma (RCC) diagnosis,3 multiple studies demonstrate underutilization.
4,5
Potential explanations include that RMB is an invasive procedure with a 1.4%-4.7%
complication rate,3 fails to provide diagnostic information for malignancy in 14% of cases,
6 and
is unreliable in tumor grade determination.3
Based on excellent soft-tissue contrast and a combination of qualitative, semi-
quantitative, and quantitative characteristics, multiparametric magnetic resonance imaging
(mpMRI) can histologically subtype renal cell carcinoma (RCC).7-10
As an alternative to
computed tomography, mpMRI could potentially provide both histologic and anatomic
information prior to therapeutic intervention, obviating the need for biopsy or additional
imaging. However, literature pertaining to the clinical applicability of mpMRI to define higher-
risk RCC in SRM is sparse.7,11-13
Furthermore, to our knowledge, the inter-observer
reproducibility between more than three reviewers in mpMRI evaluation of RCC has not been
reported.12-14
Clear cell RCC (ccRCC) is the most common RCC variant and notably potentially
aggressive.15
On MRI it is characterized by heterogeneous high signal intensity on T2-weighted
imaging,10
presence of microscopic fat,16-19
and avid enhancement equal to or greater than
renal cortex.11
Given that the probability of ccRCC diagnosis is proportional to the added effect

MANUSCRIP
T
ACCEPTED
ACCEPTED MANUSCRIPT 5
of individual parameters, a likelihood score based on those MRI parameters might provide a
useful tool for patient management, as has been done with prostate cancer.20,21
Our goal was to evaluate the diagnostic accuracy of a subjective likelihood scale for
mpMRI in the diagnosis of ccRCC in cT1a lesions and to assess the inter-reader reproducibility of
such scale.

MANUSCRIP
T
ACCEPTED
ACCEPTED MANUSCRIPT 6
Materials and Methods
Patients
This retrospective series was performed under Institutional Review Board approval.
Patients with cT1a renal masses who underwent either partial or radical nephrectomy and pre-
surgical mpMRI between December 2011 and July 2015 were identified. Patients with poor
quality or limited MRI examinations (n=3) (i.e. not including the sequences described below)
were excluded from analysis. Patient demographics and clinical findings including age, sex,
tumor size, and final pathology were extracted from chart review. Histologic analysis was
performed by genitourinary pathologists according to the World Health Organization
classification of renal neoplasms.22
Image Acquisition
mpMRI studies were performed on 1.5T and 3.0T scanners from multiple institutions
with diverse parameters, as many patients underwent mpMRI elsewhere and were referred to
the authors’ institution for treatment. In total, 54 patients (49%) had imaging at our institution,
while 56 patients (51%) had imaging obtained elsewhere. An MRI fellowship-trained radiologist
(blinded), who was not involved in imaging interpretation, reviewed all mpMRI exams of
patients in this study to ensure they were of sufficient image quality and basic sequences were
included. At the authors’ institution mpMRI includes the following sequences: T2-weighted
images in coronal and axial (with fat-suppression) planes (4-8mm slice thickness, 256x154 to

MANUSCRIP
T
ACCEPTED
ACCEPTED MANUSCRIPT 7
348x280 matrix, 70-120ms echo time (TE), and 964-4820ms repetition time (TR)), axial chemical
shift T1-weighted images (5-8mm thickness, 193x168 to 500x286 matrix, 2.38/4.87ms (1.5T) or
1.1/2.3ms (3.0T) TE, and 100-216ms TR), and fat-suppressed dynamic contrast-enhanced (DCE)
T1-weighted imaging, including corticomedullary and late nephrographic and/or excretory
phases in either axial or coronal planes (3-6mm slice thickness, 176x149 to 320x259 matrix size,
1.6-2.4ms TE, and 3.4-5.4ms TR). Diffusion weighted images (DWI) were routinely acquired at
the authors’ institution but inconsistently present in mpMRI studies performed elsewhere so
these were not evaluated. Furthermore, given the controversial role of DWI in characterizing
renal masses and the importance of acquisition protocol standardization,23
these images were
not included in the analysis.
Image Analysis
Seven radiologists with fellowship training in body MRI from a single institution with a
busy MRI service (approximately 7,000 abdominopelvic MRIs/year), varying levels of experience
(IP and JRL 15 years, DC 12 years, TY 10 years, GK 7 years, DC 5 years, ADL 1 year), and blinded
to final pathology, independently reviewed each study on a PACS workstation (iSite, Philips
Healthcare, Best, Netherlands). A Likert scale was used to convey the subjective radiologic
impression of the likelihood of encountering ccRCC at surgery. The clear cell likelihood score
(ccLS) was defined as: 1) definitely not ccRCC, 2) probably not ccRCC, 3) equivocal for ccRCC, 4)
probably ccRCC, and 5) definitely ccRCC. “Cannot be assessed” was also allowed if perceived
inadequacy of the MRI protocol. Prior to image analysis, all radiologists received a refresher

MANUSCRIP
T
ACCEPTED
ACCEPTED MANUSCRIPT 8
training session with a slide presentation including examples of the main imaging features
associated with ccRCC histology and other common histologic diagnoses in renal masses. A
detailed review of such features is published elsewhere (figure 1).24
Each reader was allowed to
measure signal intensity using region of interest (ROI) analysis, and quantify the
corticomedullary enhancement11
and arterial-delayed enhancement ratio per individual
judgment.25
For statistical purposes, a composite ccLS was calculated as a mean of the seven
readers when appropriate.
Statistical Analysis
Scoring each renal mass for ccRCC diagnosis was compared to the reference standard,
which was determined by histology (ccRCC vs. ‘all other’ histologies). Receiver operating
characteristic (ROC) analysis was performed to calculate the area under the curve (AUC) and
corresponding 95% confidence interval for each reader. Tumors that could not be assessed
were excluded from ROC analysis. Multiple comparisons in mean AUCs among readers were
performed with a Bonferroni correction. Pairwise inter-observer agreement was assessed by
weighted κ statistics. A p-value of 0.05 or less was considered statistically significant. All
statistical analysis was performed with SAS version 9.4 (SAS Institute Inc., Cary, NC, USA).

MANUSCRIP
T
ACCEPTED
ACCEPTED MANUSCRIPT 9
Results
In total, 110 patients with 121 cT1a renal masses were identified. Patient demographics
and final pathologic findings are shown in table 1. Mean tumor size was 2.4 cm (range 0.5-4.0
cm), and histology was ccRCC in 50% (n=61), non-clear cell RCC in 33% (n=40), and benign
lesions in 17% (n=20).
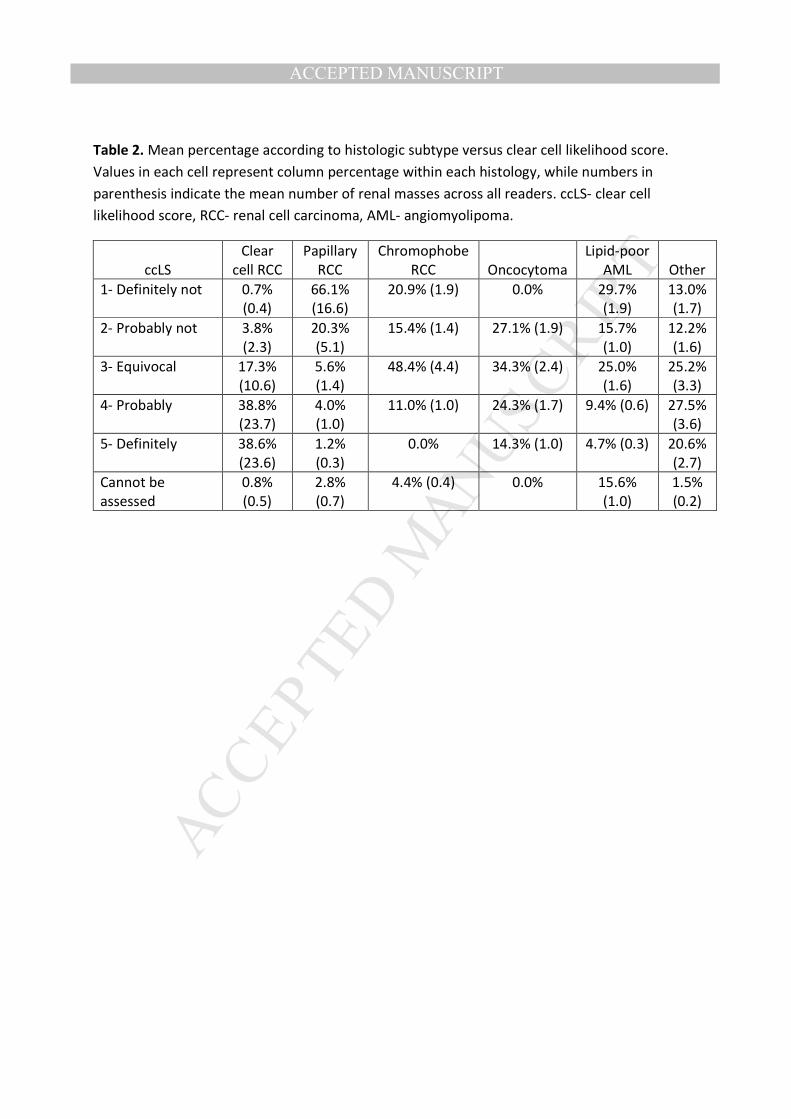
Histologic distribution of the entire cohort by ccRCC versus ‘all other’ histologies and
assigned ccLS is shown in figure 2, while overall comparison of ccLS score to final histology is
shown in table 2. Overall, a mean of 2.8 tumors (2.3%) could not be assessed by reviewers.
Tumors with ccLS 4-5 were categorized as mpMRI-identified ccRCC (MR-ccRCC). Combining all
seven readers gave a mean accuracy of 79%, sensitivity of 78%, specificity of 80%, positive
predictive value (PPV) of 80%, and negative predictive value (NPV) of 80% (figure 3).
Augmenting the MR-ccRCC definition to include ccLS 3 tumors changed the mean accuracy to
77%, sensitivity to 95%, specificity to 58%, PPV to 70%, and NPV to 93%, which inversely gave
ccLS 1-2 a specificity of 95% and PPV of 93% for ‘all other’ histologies.
Among all readers, a mean of 12.2 tumors (10.1%) were false positive ccLS 4-5 lesions.
The most common false positive histology was oncocytoma (mean 2.7 tumors, 22.1%) followed
by papillary RCC (mean 1.3 tumors, 10.7%), chromophobe RCC (mean 1 tumor, 8.2%) and lipid-
poor angiomyolipoma (AML) (mean 0.9 tumors, 7.4%). A mean of 2.7 tumors (2.2%) per reader
were false negative ccRCC tumors graded as ccLS 1-2; 50% without high signal intensity on T2-
weighted imaging, 79% without high contrast avidity, 100% without intravoxel fat, and 84.2%
without central scar, which suggested against higher scoring.
MANUSCRIP
T
ACCEPTED
ACCEPTED MANUSCRIPT 10
ROC curves for the seven readers are shown in figure 4, with AUC ranging from 0.82-
0.92. Comparisons of the highest rated reader (Reader 7, AUC 0.92) compared to all other
readers showed a statistically significant difference between all readers except reader #4, and
years of experience did not correlate with improved diagnostic accuracy (p=0.31). Inter-reader
variability was moderate to good, with a mean weighted κ of 0.53 (range 0.38-0.64).

MANUSCRIP
T
ACCEPTED
ACCEPTED MANUSCRIPT 11
Discussion
Multiparametric MRI is an appealing alternative to RMB, in that it can provide both
pathologic information to direct management and anatomic information required for surgical
planning. To our knowledge, our series is the first to specifically evaluate the diagnostic
accuracy of mpMRI for ccRCC in cT1a lesions. The proposed ccRCC likelihood scoring system
demonstrated a high specificity and PPV for ccRCC in ccLS 4-5 lesions, and a high specificity
(95%) and PPV (93%) for non-ccRCC in ccLS 1-2 lesions, in addition to moderate inter-observer
reliability. Therefore, ccLS could support an algorithm where all ccLS 4-5 are encouraged to
undergo curative interventions, all ccLS 1-2 are placed on active surveillance (especially if they
are less than 3 cm), and only ccLS 3 undergo RMB. This proposal would result in a biopsy rate in
this series of only 20%, unnecessary treatment of oncocytoma and lipid-poor AML in 4.5% and
1.7% of the surgical cohort, respectively, and 4.4% of ccRCC placed on active surveillance. It
should be noted that ccLS was not a good predictor of overall malignancy. This is expected since
it was developed for ccRCC diagnosis. Accordingly, while most ccRCCs received a high score,
most non-clear cell RCCs were assigned a low score.
In one of the first studies to evaluate a comprehensive classification of renal masses
with mpMRI, Pedrosa et al. defined eight distinct qualitative mpMRI patterns of malignant
lesions among T2-, chemical shift T1-, and contrast enhanced T1-weighted sequences.7 They
reported that two radiologists demonstrated a slightly higher sensitivity and specificity of 92%
and 83%, respectively, compared to our series for diagnosing ccRCC. Of these 48 ccRCC tumors
mean tumor size was much larger than the present series (6.0 cm), and they excluded benign

MANUSCRIP
T
ACCEPTED
ACCEPTED MANUSCRIPT 12
lesions, which may explain the slightly higher accuracy. Cornelis and colleagues compared
mpMRI of 100 renal masses to pathologic findings, and noted high specificity for diagnosing
papillary RCC and oncocytomas.12
Differing from our study, they included significant parameters
quantified by two radiologists, and all RCC subtypes were mean >4.0 cm. Recently, Hötker and
colleagues published their evaluation of 124 renal masses by MRI compared to pathologic
findings.13
Although the median tumor size of their ccRCC cohort (n=81) was 8.0 cm, they noted
that the apparent diffusion coefficient, peak enhancement, and downslope of DCE sequence
significantly correlated with ccRCC histology. In addition, after two independent radiologist’s
review they noted significant interreader agreement (r= 0.82-0.99).
Despite other investigators use of mpMRI in large (>4.0 cm) renal tumors, in the context
of clinical practice we feel the most relevant use of mpMRI is in classification of SRM (<4.0 cm).
In a database of over 2700 patients, Frank and colleagues noted that 23% of tumors <4.0 cm
were pathologically benign, compared to only 8% of tumors ≥4.0 cm.26
Therefore, the current
role of RMB is in identifying SRM histology to plan surgical intervention or active surveillance.27
Recent meta-analysis of RMB have demonstrated low false positive and false negative rates of
4.0% and 3.1%, respectively, in addition to low complication rates (4.9% hematoma and 1.2%
pain).6 However, as previously mentioned, this is in the context of a 14% non-diagnostic rate. In
addition, histologic grade concordance between biopsy and final pathology was 52-76%. In
comparison, our mpMRI results demonstrated false-positive and false negative rates of 6.2%
and 4.4%, respectively, no complications, and a 2.3% non-diagnostic rate. As for tumor grade,
we did not analyze grade concordance in this initial series. Prior work has looked at

MANUSCRIP
T
ACCEPTED
ACCEPTED MANUSCRIPT 13
differentiating high grade and low grade ccRCC in large tumors with good success.7 The ability
to do so in smaller tumors is unknown, but likely more difficult.
Additionally, many RMB studies carried selection bias as percutaneous biopsy may not
be easily performed and/or may carry worse outcomes (e.g. lower diagnostic yield, increased
complications) in those patients with SRMs in difficult anatomic locations (e.g. perihilar,
anterior), particularly at centers without expertise in performing these procedures.
Alternatively, mpMRI would potentially avoid additional procedures, and the lack of
invasiveness might encourage provider utilization.
The issue of false-positives was most notable with oncocytomas, emphasizing the
challenge in differentiating it from ccRCC. Similarly, Cornelis and colleagues noted difficulty in
their retrospective evaluation as two radiologists blinded to final pathology had a diagnostic
specificity of 94%, but only 19% sensitivity, in distinguishing ccRCC from oncocytoma.12
Similarly, Rosenkrantz et al. found no MRI features that would allow differentiation of
oncoytoma from chromophobe RCC using a standard clinical MRI protocol similar to the mpMRI
protocols in our study.28
Further studies, specifically with arterial spin labeling (ASL), may have
the potential to separate oncocytomas and ccRCC. Although not currently commercially
available, this technique labels the spin of arterial water allowing, in effect, contrasted imaging
without intravenous tracers.29
Prior work has shown significant differences in mean ASL
perfusion levels of oncocytoma and ccRCC.30
Adding this technique to the mpMRI algorithm
may further improve diagnostic accuracy.

MANUSCRIP
T
ACCEPTED
ACCEPTED MANUSCRIPT 14
As highlighted above, most studies regarding mpMRI involve at most a few reviewing
radiologists.7,12
To our knowledge, we are the first to evaluate inter-reader variability among a
large cohort of radiologists. The seven readers in our series had varying levels experience,
ranging from in-fellowship training to senior faculty (1-15 years) and we found that radiologist
level of experience did not appear to correlate with ccLS accuracy. The reason for this is
speculative, but might be a reflection of more recent emphasis on mpMRI exposure in
residency and fellowship programs. Additionally, the structured algorithm might mitigate some
effects of experience. As for inter-reader variability, we demonstrated good consistency (mean
weighted κ 0.53) among our radiologists when utilizing the algorithm and ccLS scoring.
However, this also highlights opportunity for improvement. Given the multitude of adjustable
parameters with mpMRI, inter-center standardization is needed to specify imaging protocols
that will best characterize SRM.
Our study has limitations that deserve mention. First is the retrospective design. While
our radiologists were blinded to final pathology, this structure has inherent bias. Not all
patients with SRM undergo mpMRI, so there is selection bias that could affect our estimates of
RMB (ccLS 3, 20%) or unnecessary ccLS 4-5 surgery (6.2%) in this series. In addition, not all
patients who had mpMRI underwent surgery. This selection bias limits our ability to capture
benign appearing lesions, which could also affect our accuracy. Therefore, the strength of this
modality will ultimately depend on a prospective analysis to verify that ccLS can accurately
direct SRM management. Second is the single-institution series. As stated previously, all mpMRI
sequences are not equal, and standardization is required to improve inter-center
reproducibility. However, the reasonable diagnostic accuracy of the ccLS considering the

MANUSCRIP
T
ACCEPTED
ACCEPTED MANUSCRIPT 15
multiple mpMRI studies performed at different institutions with different imaging protocols is
encouraging. Future studies should be multi-institutional to ensure stability of results between
various centers. Third, our study is small with a cohort of only 121 SRM, of which 61 were
ccRCC. However, in comparison to other discussed series,7,12,13
we do report the largest SRM
series to date. Larger series are ultimately needed to define the accuracy of this work.
These limitations notwithstanding, we have demonstrated that ccLS can accurately
predict ccRCC in cT1a renal masses. In addition to providing anatomic information for surgical
planning, this could streamline SRM decision-making and obviate the need for additional
procedures prior to definitive management. Moreover, our reported technique has good inter-
reader variability. With future prospective and multi-institutional studies we hope to verify
these initial results and the generalizability of this technique.

MANUSCRIP
T
ACCEPTED
ACCEPTED MANUSCRIPT 16
References
1. Frank I, Blute ML, Cheville JC, et al: Solid renal tumors: an analysis of pathological
features related to tumor size. J Urol 2003; 170: 2217–2220.
2. Kutikov A, Smaldone MC, Uzzo RG, et al: Renal Mass Biopsy: Always, Sometimes, or
Never? Eur Urol 2016; 70: 403–406.
3. Tomaszewski JJ, Uzzo RG and Smaldone MC: Heterogeneity and renal mass biopsy:
a review of its role and reliability. Cancer Biol Med 2014; 11: 162–172.
4. Leppert JT, Hanley J, Wagner TH, et al: Utilization of renal mass biopsy in patients
with renal cell carcinoma. Urology 2014; 83: 774–779.
5. Breau RH, Crispen PL, Jenkins SM, et al: Treatment of patients with small renal
masses: a survey of the American Urological Association. J Urol 2011; 185: 407–
413.
6. Patel HD, Johnson MH, Pierorazio PM, et al: Diagnostic Accuracy and Risks of
Biopsy in the Diagnosis of a Renal Mass Suspicious for Localized Renal Cell
Carcinoma: Systematic Review of the Literature. J Urol 2016; 195: 1340–1347.
7. Pedrosa I, Chou MT, Ngo L, et al: MR classification of renal masses with pathologic
correlation. Eur Radiol 2008; 18: 365–375.
8. Ramamurthy NK, Moosavi B, McInnes MDF, et al: Multiparametric MRI of solid
renal masses: pearls and pitfalls. Clin Radiol 2015; 70: 304–316.
9. Allen BC, Tirman P, Clingan MJ, et al: Characterizing solid renal neoplasms with MRI
in adults. Abdom Imaging 2014; 39: 358–387.
10. Pedrosa I, Sun MR, Spencer M, et al: MR imaging of renal masses: correlation with
findings at surgery and pathologic analysis. Radiographics 2008; 28: 985–1003.
11. Sun MRM, Ngo L, Genega EM, et al: Renal cell carcinoma: dynamic contrast-
enhanced MR imaging for differentiation of tumor subtypes--correlation with
pathologic findings. Radiology 2009; 250: 793–802.
12. Cornelis F, Tricaud E, Lasserre AS, et al: Routinely performed multiparametric
magnetic resonance imaging helps to differentiate common subtypes of renal
tumours. Eur Radiol 2014; 24: 1068–1080.
13. Hötker AM, Mazaheri Y, Wibmer A, et al: Differentiation of Clear Cell Renal Cell
Carcinoma From Other Renal Cortical Tumors by Use of a Quantitative
Multiparametric MRI Approach. AJR Am J Roentgenol 2017; 208: W85–W91.

MANUSCRIP
T
ACCEPTED
ACCEPTED MANUSCRIPT 17
14. Vargas HA, Chaim J, Lefkowitz RA, et al: Renal cortical tumors: use of multiphasic
contrast-enhanced MR imaging to differentiate benign and malignant histologic
subtypes. Radiology 2012; 264: 779–788.
15. Störkel S, Eble JN, Adlakha K, et al: Classification of renal cell carcinoma:
Workgroup No. 1. Union Internationale Contre le Cancer (UICC) and the American
Joint Committee on Cancer (AJCC). Cancer 1997; 80: 987–989.
16. Outwater EK, Bhatia M, Siegelman ES, et al: Lipid in renal clear cell carcinoma:
detection on opposed-phase gradient-echo MR images. Radiology 1997; 205: 103–
107.
17. Jhaveri KS, Elmi A, Hosseini-Nik H, et al: Predictive Value of Chemical-Shift MRI in
Distinguishing Clear Cell Renal Cell Carcinoma From Non-Clear Cell Renal Cell
Carcinoma and Minimal-Fat Angiomyolipoma. AJR Am J Roentgenol 2015; 205:
W79–86.
18. Yoshimitsu K, Honda H, Kuroiwa T, et al: MR detection of cytoplasmic fat in clear
cell renal cell carcinoma utilizing chemical shift gradient-echo imaging. J Magn
Reson Imaging 1999; 9: 579–585.
19. Hindman N, Ngo L, Genega EM, et al: Angiomyolipoma with minimal fat: can it be
differentiated from clear cell renal cell carcinoma by using standard MR
techniques? Radiology 2012; 265: 468–477.
20. Costa DN, Lotan Y, Rofsky NM, et al: Assessment of Prospectively Assigned Likert
Scores for Targeted Magnetic Resonance Imaging-Transrectal Ultrasound Fusion
Biopsies in Patients with Suspected Prostate Cancer. J Urol 2016; 195: 80–87.
21. Park SY, Jung DC, Oh YT, et al: Prostate Cancer: PI-RADS Version 2 Helps
Preoperatively Predict Clinically Significant Cancers. Radiology 2016; 280: 108–116.
22. Moch H, Cubilla AL, Humphrey PA, et al: The 2016 WHO Classification of Tumours
of the Urinary System and Male Genital Organs-Part A: Renal, Penile, and Testicular
Tumours. Eur Urol 2016; 70: 93–105.
23. Kang SK, Zhang A, Pandharipande PV, et al: DWI for Renal Mass Characterization:
Systematic Review and Meta-Analysis of Diagnostic Test Performance. AJR Am J
Roentgenol 2015; 205: 317–324.
24. Kay FU and Pedrosa I: Imaging of Solid Renal Masses. Radiol Clin North Am 2017;
55: 243–258.
25. Sasiwimonphan K, Takahashi N, Leibovich BC, et al: Small (<4 cm) renal mass:
differentiation of angiomyolipoma without visible fat from renal cell carcinoma
utilizing MR imaging. Radiology 2012; 263: 160–168.
MANUSCRIP
T
ACCEPTED
ACCEPTED MANUSCRIPT 18
26. Frank I, Blute ML, Cheville JC, et al: An outcome prediction model for patients with
clear cell renal cell carcinoma treated with radical nephrectomy based on tumor
stage, size, grade and necrosis: the SSIGN score. J Urol 2002; 168: 2395–2400.
27. Halverson SJ, Kunju LP, Bhalla R, et al: Accuracy of Determining Small Renal Mass
Management with Risk Stratified Biopsies: Confirmation by Final Pathology. J Urol
2013; 189: 441–446.
28. Rosenkrantz AB, Hindman N, Fitzgerald EF, et al: MRI features of renal oncocytoma
and chromophobe renal cell carcinoma. AJR Am J Roentgenol 2010; 195: W421–7.
29. Pedrosa I, Rafatzand K, Robson P, et al: Arterial spin labeling MR imaging for
characterisation of renal masses in patients with impaired renal function: initial
experience. Eur Radiol 2012; 22: 484–492.
30. Lanzman RS, Robson PM, Sun MR, et al: Arterial spin-labeling MR imaging of renal
masses: correlation with histopathologic findings. Radiology 2012; 265: 799–808.

MANUSCRIP
T
ACCEPTED
ACCEPTED MANUSCRIPT 19
Figure Legends
Figure 1. Multiparametric MRI algorithm for small renal masses. ccRCC- clear cell renal cell
carcinoma. chrRCC- chromophobe renal cell carcinoma. pRCC- papillary renal cell carcinoma.
ONCO- oncocytoma. AML- angiomyolipoma. SI- signal intensity.
Figure 2. Histologic distribution of the entire cohort by clear cell likelihood score. Tumors that
could not be assessed are not shown.
Figure 3. Binary classification of the seven readers defining clear cell RCC as ccLS 4-5. RCC- renal
cell carcinoma. ccLS- clear cell likelihood score.
Figure 4. Receiver operating characteristic curves of the seven readers defining ccRCC and ccLS
4-5. RCC- renal cell carcinoma. ccLS- clear cell likelihood score.

MANUSCRIP
T
ACCEPTED
ACCEPTED MANUSCRIPT
Table 1. Patient demographics and final pathology. SD= standard deviation, RCC= renal cell
carcinoma.
n= 110 patients (121
tumors)
Age, y (mean ± SD) 57 ± 14
Male/Female (%) 61/39%
Tumor size, cm (mean ± SD) 2.4 ± 0.8
Histology (%)
Clear cell RCC 61 (50%)
Papillary RCC 25 (21%)
Chromophobe RCC 9 (7%)
Other RCC 6 (5%)
Oncocytoma 7 (6%)
Angiomyolipoma 6 (5%)
Other benign 7 (6%)
Final pathology
pT1a 97 (96%)
pT3a 4 (4%)
Fuhrman Grade
1 6 (6%)
2 72 (71%)
3 15 (15%)
4 0
Unknown 8 (8%)
MANUSCRIP
T
ACCEPTED
ACCEPTED MANUSCRIPT
Table 2. Mean percentage according to histologic subtype versus clear cell likelihood score.
Values in each cell represent column percentage within each histology, while numbers in
parenthesis indicate the mean number of renal masses across all readers. ccLS- clear cell
likelihood score, RCC- renal cell carcinoma, AML- angiomyolipoma.
ccLS
Clear
cell RCC
Papillary
RCC
Chromophobe
RCC Oncocytoma
Lipid-poor
AML Other
1- Definitely not 0.7%
(0.4)
66.1%
(16.6)
20.9% (1.9) 0.0% 29.7%
(1.9)
13.0%
(1.7)
2- Probably not 3.8%
(2.3)
20.3%
(5.1)
15.4% (1.4) 27.1% (1.9) 15.7%
(1.0)
12.2%
(1.6)
3- Equivocal 17.3%
(10.6)
5.6%
(1.4)
48.4% (4.4) 34.3% (2.4) 25.0%
(1.6)
25.2%
(3.3)
4- Probably
38.8%
(23.7)
4.0%
(1.0)
11.0% (1.0) 24.3% (1.7) 9.4% (0.6) 27.5%
(3.6)
5- Definitely 38.6%
(23.6)
1.2%
(0.3)
0.0% 14.3% (1.0) 4.7% (0.3) 20.6%
(2.7)
Cannot be
assessed
0.8%
(0.5)
2.8%
(0.7)
4.4% (0.4) 0.0% 15.6%
(1.0)
1.5%
(0.2)

MANUSCRIP
T
ACCEPTED
ACCEPTED MANUSCRIPT

MANUSCRIP
T
ACCEPTED
ACCEPTED MANUSCRIPT

MANUSCRIP
T
ACCEPTED
ACCEPTED MANUSCRIPT

MANUSCRIP
T
ACCEPTED
ACCEPTED MANUSCRIPT

MANUSCRIP
T
ACCEPTED
ACCEPTED MANUSCRIPT
Abbreviations and Acronyms
(mp)MRI = (multiparametric) magnetic resonance imaging
SRM= small renal mass
RMB = renal mass biopsy
(cc)RCC = (clear cell) renal cell carcinoma
TE = echo time
TR = repetition time
DWI = diffusion weighted imaging
ccLS = clear cell likelihood score
ROC = receiver operating characteristic
AUC = area under the curve
PPV = positive predictive value
NPV = negative predictive value
AML = angiomyolipoma
ASL = arterial spin labeling