Embed Size (px)
Citation preview
Article citation info: Białkowski P., Krężel B., Diagnostic of shock absorbers during road test with the use of vibration FFT and cross-spectrum analysis. Diagnostyka, 2017;18(1):79-86
79
DIAGNOSTYKA, 2017, Vol. 18, No. 1 ISSN 1641‐6414e‐ISSN 2449‐5220
DIAGNOSTIC OF SHOCK ABSORBERS DURING ROAD TEST WITH THE USE
OF VIBRATION FFT AND CROSS-SPECTRUM ANALYSIS
Piotr BIAŁKOWSKI, Bogusław KRĘŻEL BOSMAL Automotive Research and Development Institute Ltd
ul. Sarni Stok 93, 43-300 Bielsko-Biała, tel. 338130454 E-mail: [email protected], [email protected]
Abstract
In this article an attempt to diagnose damage to the shock absorbers of a passenger car during road operation with the use of vibration response measurement has been described. Accelerometers were mounted on the body – sprung mass. Based on the recorded signals, FFT and Cross-Spectrum graphs were prepared. The test was performed for several variants shock absorber damage.
The single-number index of vibration amplitude increase, in the range of resonance frequency, was calculated, based on spectrum analysis. The results are shown as graphs and tables, for different damage types. The realization of measurement and adopted method of damage diagnosis are described.
Keywords: Shock absorbers, diagnostic, vibration, fft, cross-spectrum
DIAGNOSTYKA AMORTYZATORÓW PODCZAS PRÓBY DROGOWEJ Z WYKORZYSTANIEM
WIDMA DRGAŃ FFT ORAZ WIDM KRZYŻOWYCH
Streszczenie W pracy przedstawiono i opisano próbę diagnozowania uszkodzenia amortyzatorów w samochodzie
osobowym przy użyciu odpowiedzi z czujników drgań podczas jazdy. Czujniki zamontowane były na nadwoziu – na masie resorowanej. Na podstawie zebranych sygnałów z czujników drgań wyznaczono widma drgań FFT odpowiedzi oraz widma krzyżowe. Badania wykonano dla kilku różnych wariantów uszkodzeń amortyzacji.
Na podstawie analizy widm przyjęto jednoliczbowy wskaźnik obrazujący wielkości wzrostu amplitudy w obszarze częstotliwości rezonansowej. Wyniki przedstawiono w formie wykresów i tabel dla poszczególnych rodzajów uszkodzeń amortyzatorów. Opisano przebieg wykonanych pomiarów oraz przyjętą metodę diagnozowania uszkodzenia amortyzatorów.
Słowa kluczowe: amortyzatory, diagnostyka, drgania, FFT, widmo-krzyżowe
INTRODUCTION
Due to the great increase in the quantity of
vehicles on the world’s roads and despite the fact of continuous expansion of infrastructure, road traffic is denser and denser. Active and passive safety systems are ever more significant for this reason. Active safety systems are at least as important as passive ones, because it is better to prevent accidents altogether, rather than to minimalize their consequences. One of these active safety factors is diagnostics of the most important car subassemblies that affect such parameters as braking effectiveness or traction. There are many electronic systems that improve those parameters. For example, ABS does not allow the wheels to be blocked during braking, allowing the driver to steer even during high deceleration. ESP prevents getting into an uncontrolled skid. But these systems will not help much if mechanical elements of the suspension fail.
One of the most important suspension elements that directly influences active safety are shock absorbers. Damping of vibration is responsible for
ensuring wheel grip to the road during driving. Insufficient damping fosters disconnection of the wheel from surface which can lengthen the brake distance or can even be the reason for losing control of the vehicle.
Damping efficacy testing is usually only performed during vehicle servicing. Testing at diagnostic stations gives sufficient damping estimation results, but is usually performed with the use of the EUSAMA1 stationary method. During recent years, many methods risen to estimate condition of vehicle dampers. But all these test methods need to be carried out on special stands. There is still the problem of rapid drop of airtightness on the damper during for example long travel; most drivers will not be able to notice this problem. That is the reason why a system which would be able to detect damper damage during normal road operation is desirable. It would give the driver information that there is a danger and that the
1 EUSAMA – stationary test method of shock absorbers used in diagnostic stations
DIAGNOSTYKA, Vol. 18, No. 1 (2017)
BIAŁKOWSKI, KRĘŻEL: Diagnostic of shock absorbers during road test with the use of vibration FFT and …
80
speed of car should be decreased, as well as that
extreme caution should be exercised.
This paper concerns the results of research
performed on a passenger car that was carried out to
detect damping loss of damaged shock absorbers
with the use of sprung mass vibration measurements.
1. TESTING METHOD
To detect any loss of damping in a suspension
system, measurement of vibration is necessary.
Where possible, the object is excited with a known
or measured force and then the response is measured
at defined points. The frequency and shape of all
modes in the range of interest are calculated with the
use of formula (1) FRF - magnitude and phase
graphs. The damping factor is calculated with the
use of half power method (4). This kind of analysis
is called experimental modal analysis.
Unfortunately, this method is not always suitable.
During normal road operation only response
measurement is possible without the use of
complicated and expensive systems.
1.1 FRF - Transfer function
The transfer function, in other words frequency
response, is defined as a complex ratio of the output
signal spectrum to the input signal spectrum as a
function of the frequency [2]:
, (1)
where Hxy(f) is the transfer function from point x to
point y,
Fy(f) – Fourier spectrum on output of the signal
measured at point y,
Fx(f) – Fourier spectrum on input of the signal
measured at point x.
1.2 Cross-spectrum
The cross-spectrum can be obtained from the
individual Fourier spectra Fx(f) and Fy(f) as follows
[2]:
, (2)
where Fxy(f) is a typical cross-spectrum component
and Fx*(f) is the complex conjugate of Fx(f).
1.3. Half power method
Each mode is characterized by three parameters:
frequency, shape and damping. The frequency is
estimated from the FRF characteristic directly after
the measurement. The natural frequency is read as
the maximum (peak) value of the FRF characteristic
[9]:
|α(ω)max|= ωr, (3)
For both values ωa and ωb localized on each side
of the local maximum the amplitude is equal to half
of the power, which equals: (fig.1). The
damping ratio ξ may be calculated from the
following formula [9]:
, (4)
An example of FRF graph and half power method of
damping estimation are shown in fig.1
Fig. 1. FRF graph - half power method of damping
estimation [9]
2. TESTED OBJECT
The measurements were done on the internal
road of the Institute. The track is made of an asphalt
and the structure is comparable to typical local road.
There are some little irregularities typical for local
roads also. The measurements were done at the
range of speed 20 – 50 km/h on first three gears.
Test track is shown in satellite photo – fig. 2. The
drive can be compared to city traveling at increased
traffic density.
Fig. 2 Test track (orange color)
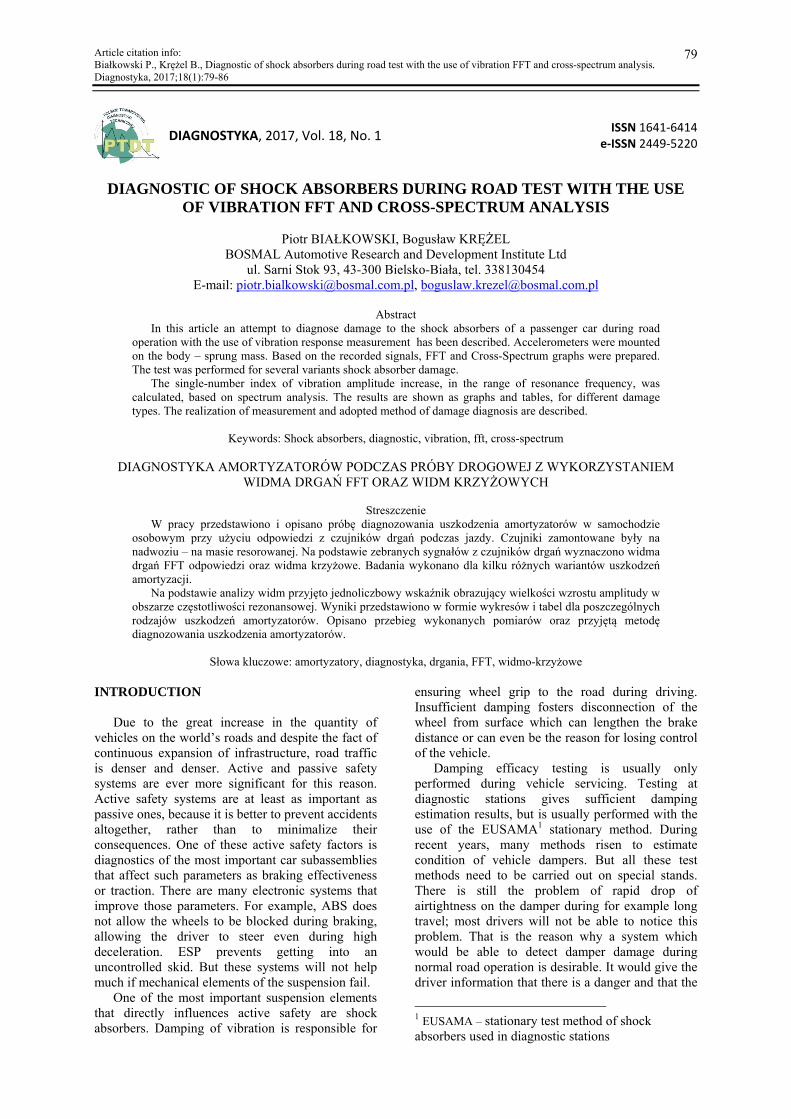
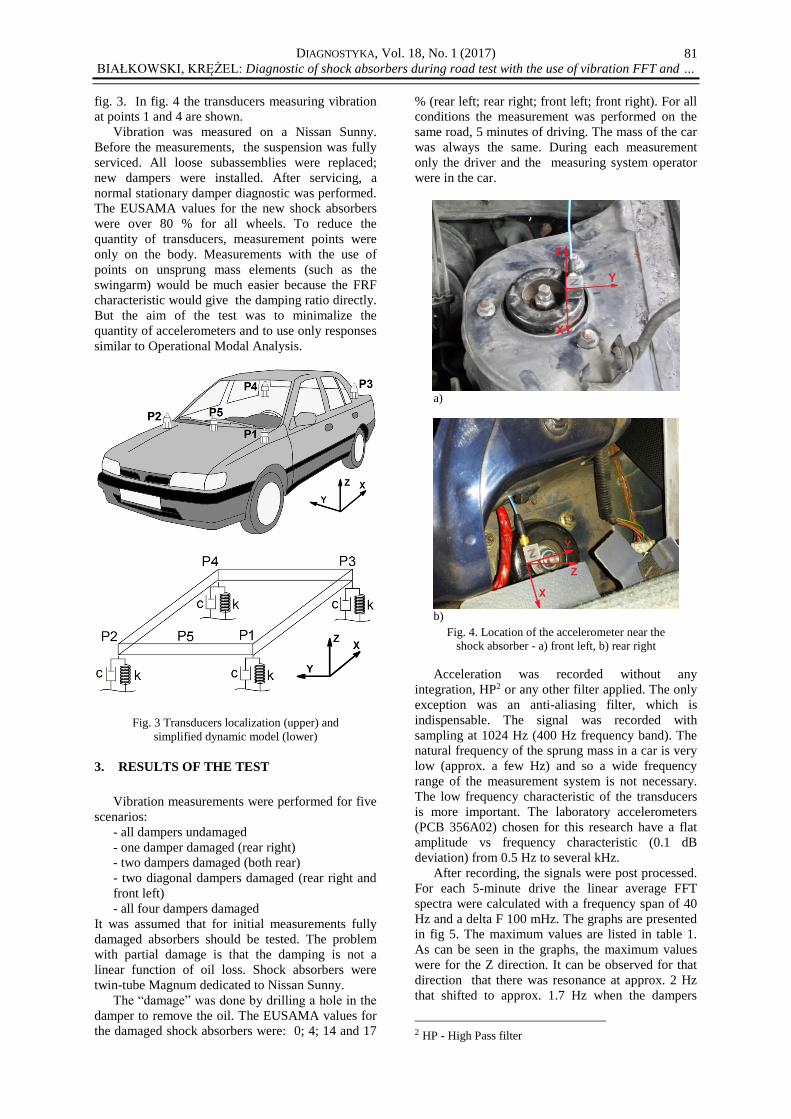
Four points near the absorber fixings were
chosen to measure 3 axial vibration. Additionally, Z
axis vibration was measured at the center of the
bulkhead. Location of the accelerometers with
simplified a dynamic model (without taking into
consideration wheel springiness) are presented in
DIAGNOSTYKA, Vol. 18, No. 1 (2017)
BIAŁKOWSKI, KRĘŻEL: Diagnostic of shock absorbers during road test with the use of vibration FFT and …
81
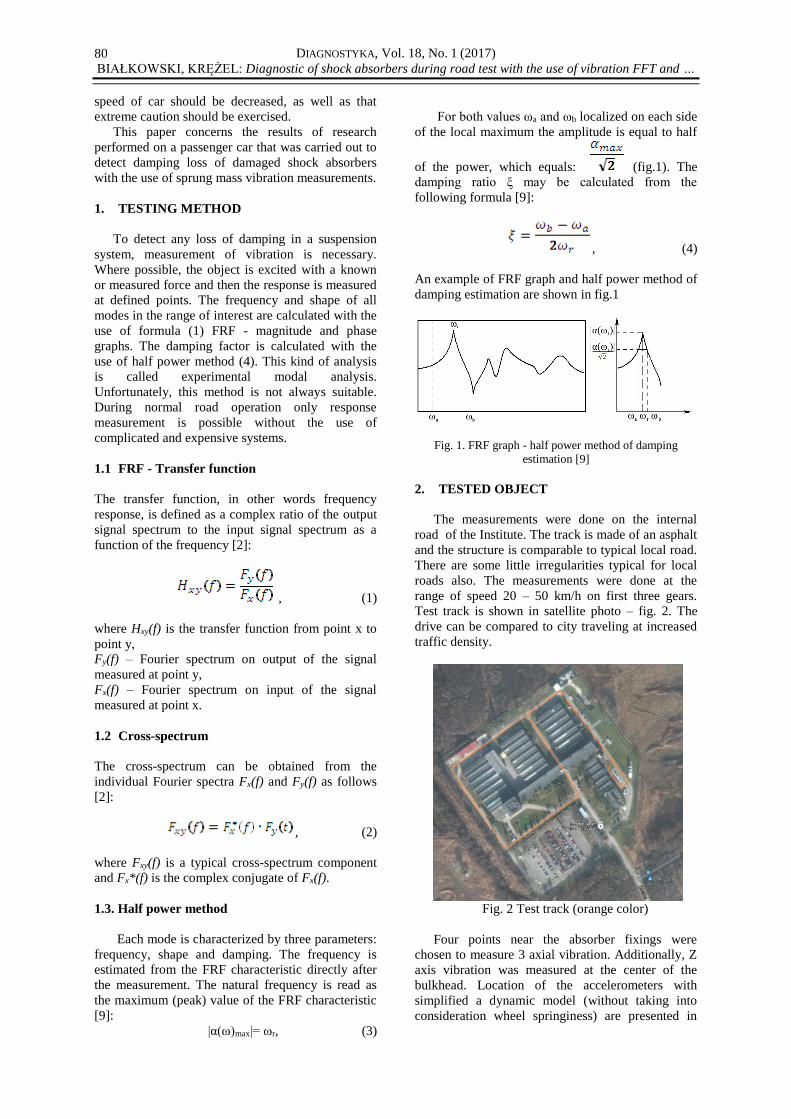
fig. 3. In fig. 4 the transducers measuring vibration
at points 1 and 4 are shown.
Vibration was measured on a Nissan Sunny.
Before the measurements, the suspension was fully
serviced. All loose subassemblies were replaced;
new dampers were installed. After servicing, a
normal stationary damper diagnostic was performed.
The EUSAMA values for the new shock absorbers
were over 80 % for all wheels. To reduce the
quantity of transducers, measurement points were
only on the body. Measurements with the use of
points on unsprung mass elements (such as the
swingarm) would be much easier because the FRF
characteristic would give the damping ratio directly.
But the aim of the test was to minimalize the
quantity of accelerometers and to use only responses
similar to Operational Modal Analysis.
Fig. 3 Transducers localization (upper) and
simplified dynamic model (lower)
3. RESULTS OF THE TEST
Vibration measurements were performed for five
scenarios:
- all dampers undamaged
- one damper damaged (rear right)
- two dampers damaged (both rear)
- two diagonal dampers damaged (rear right and
front left)
- all four dampers damaged
It was assumed that for initial measurements fully
damaged absorbers should be tested. The problem
with partial damage is that the damping is not a
linear function of oil loss. Shock absorbers were
twin-tube Magnum dedicated to Nissan Sunny.
The “damage” was done by drilling a hole in the
damper to remove the oil. The EUSAMA values for
the damaged shock absorbers were: 0; 4; 14 and 17
% (rear left; rear right; front left; front right). For all
conditions the measurement was performed on the
same road, 5 minutes of driving. The mass of the car
was always the same. During each measurement
only the driver and the measuring system operator
were in the car.
a)
b)
Fig. 4. Location of the accelerometer near the
shock absorber - a) front left, b) rear right
Acceleration was recorded without any
integration, HP2 or any other filter applied. The only
exception was an anti-aliasing filter, which is
indispensable. The signal was recorded with
sampling at 1024 Hz (400 Hz frequency band). The
natural frequency of the sprung mass in a car is very
low (approx. a few Hz) and so a wide frequency
range of the measurement system is not necessary.
The low frequency characteristic of the transducers
is more important. The laboratory accelerometers
(PCB 356A02) chosen for this research have a flat
amplitude vs frequency characteristic (0.1 dB
deviation) from 0.5 Hz to several kHz.
After recording, the signals were post processed.
For each 5-minute drive the linear average FFT
spectra were calculated with a frequency span of 40
Hz and a delta F 100 mHz. The graphs are presented
in fig 5. The maximum values are listed in table 1.
As can be seen in the graphs, the maximum values
were for the Z direction. It can be observed for that
direction that there was resonance at approx. 2 Hz
that shifted to approx. 1.7 Hz when the dampers
2 HP - High Pass filter

DIAGNOSTYKA, Vol. 18, No. 1 (2017)
BIAŁKOWSKI, KRĘŻEL: Diagnostic of shock absorbers during road test with the use of vibration FFT and …
82
were damaged. It can also be observed that for first condition the resonance was strongly dampened. Table 1. FFT max vibration values of the first mode
Dir
ecti
on
Po
int All dampers good Left rear broken Both rear broken
Front right and rear
left broken All broken
f [Hz] a [m/s2] f [Hz] a [m/s2] f [Hz] a [m/s2] f [Hz] a [m/s2] f [Hz] a [m/s2]
X
P1 2.10 0.07 1.80 0.08 1.70 0.13 1.70 0.10 1.70 0.20
P2 2.10 0.07 1.80 0.08 1.70 0.14 1.70 0.10 1.70 0.22
P3 2.10 0.08 1.80 0.10 1.70 0.19 1.70 0.14 1.70 0.30
P4 2.10 0.10 1.80 0.12 1.70 0.24 1.70 0.16 1.70 0.38
Y
P1 1.40 0.07 1.60 0.08 1.60 0.08 1.70 0.08 1.40 0.21
P2 1.40 0.07 1.60 0.09 1.60 0.07 1.70 0.13 1.40 0.17
P3 1.40 0.08 1.60 0.09 1.60 0.10 1.70 0.16 1.40 0.14
P4 1.40 0.09 1.60 0.09 1.60 0.11 1.70 0.14 1.40 0.16
Z
P1 2.20 0.19 1.80 0.20 1.70 0.17 1.70 0.37 1.40/1.70 0.80/0.42
P2 2.20 0.18 1.80 0.17 1.70 0.20 1.70 0.23 1.40/1.70 0.78/0.40
P3 2.20 0.23 1.80 0.25 1.70 0.73 1.70 0.34 1.40/1.70 0.52/1.04
P4 2.20 0.24 1.80 0.32 1.70 0.70 1.70 0.45 1.40/1.70 0.51/1.03
P5 2.20 0.17 1.80 0.15 1.70 0.13 1.70 0.26 1.40/1.70 0.75/0.33
All dampers good
X Y Z
200 m 500 m 1 2 5 10 20
Frequency (Hz)
Acc
eler
atio
n (m
/s²)
200 m
400 m
600 m
800 m
1
1.2 Display
Mode: Magnitude
Traces:
FFT1: AvSpc [1]-S001D001
FFT1: AvSpc [4]-S001D004
FFT1: AvSpc [7]-S001D007
FFT1: AvSpc [10]-S001D010
Overall levels:
Cursor
X:
AvSpc [1] Y:
AvSpc [4] Y:
AvSpc [7] Y:
AvSpc [10] Y:
(11:46:09 12/29/15)
(11:46:09 12/29/15)
(11:46:09 12/29/15)
(11:46:09 12/29/15)
RMS : 646 mm/s²
RMS : 654 mm/s²
RMS : 650 mm/s²
RMS : 707 mm/s²
2.1 Hz
69.5 mm/s²
65.1 mm/s²
83 mm/s²
96.7 mm/s²
Display
Mode: Magnitude
Traces:
FFT1: AvSpc [1]-S001D001
FFT1: AvSpc [4]-S001D004
FFT1: AvSpc [7]-S001D007
FFT1: AvSpc [10]-S001D010
Overall levels:
Cursor
X:
AvSpc [1] Y:
AvSpc [4] Y:
AvSpc [7] Y:
AvSpc [10] Y:
(11:46:09 12/29/15)
(11:46:09 12/29/15)
(11:46:09 12/29/15)
(11:46:09 12/29/15)
RMS : 646 mm/s²
RMS : 654 mm/s²
RMS : 650 mm/s²
RMS : 707 mm/s²
2.1 Hz
69.5 mm/s²
65.1 mm/s²
83 mm/s²
96.7 mm/s²
200 m 500 m 1 2 5 10 20
Frequency (Hz)
Acc
eler
atio
n (m
/s²)
200 m
400 m
600 m
800 m
1
1.2 Display
Mode: Magnitude
Traces:
FFT1: AvSpc [2]-S001D002
FFT1: AvSpc [5]-S001D005
FFT1: AvSpc [8]-S001D008
FFT1: AvSpc [11]-S001D011
Overall levels:
Cursor
X:
AvSpc [2] Y:
AvSpc [5] Y:
AvSpc [8] Y:
AvSpc [11] Y:
(11:46:09 12/29/15)
(11:46:09 12/29/15)
(11:46:09 12/29/15)
(11:46:09 12/29/15)
RMS : 576 mm/s²
RMS : 675 mm/s²
RMS : 655 mm/s²
RMS : 649 mm/s²
1.4 Hz
65.1 mm/s²
68.9 mm/s²
80.8 mm/s²
86.3 mm/s²
Display
Mode: Magnitude
Traces:
FFT1: AvSpc [2]-S001D002
FFT1: AvSpc [5]-S001D005
FFT1: AvSpc [8]-S001D008
FFT1: AvSpc [11]-S001D011
Overall levels:
Cursor
X:
AvSpc [2] Y:
AvSpc [5] Y:
AvSpc [8] Y:
AvSpc [11] Y:
(11:46:09 12/29/15)
(11:46:09 12/29/15)
(11:46:09 12/29/15)
(11:46:09 12/29/15)
RMS : 576 mm/s²
RMS : 675 mm/s²
RMS : 655 mm/s²
RMS : 649 mm/s²
1.4 Hz
65.1 mm/s²
68.9 mm/s²
80.8 mm/s²
86.3 mm/s²
200 m 500 m 1 2 5 10 20
Frequency (Hz)
Acc
eler
atio
n (m
/s²)
200 m
400 m
600 m
800 m
1
1.2 1L 1R1 2 Display
Mode: Magnitude
Traces:
FFT1: AvSpc [3]-S001D003
FFT1: AvSpc [6]-S001D006
FFT1: AvSpc [9]-S001D009
FFT1: AvSpc [12]-S001D012
FFT1: AvSpc [14]-S001D013
Overall levels:
Power band marker
Id Trace From To Power
1AvSpc [12]
Cursor1
X:
AvSpc [3] Y:
AvSpc [6] Y:
AvSpc [9] Y:
AvSpc [12] Y:
AvSpc [14] Y:
Cursor2
X:
AvSpc [3] Y:
AvSpc [6] Y:
AvSpc [9] Y:
AvSpc [12] Y:
AvSpc [14] Y:
dX:
AvSpc [3] dY:
AvSpc [6] dY:
AvSpc [9] dY:
AvSpc [12] dY:
AvSpc [14] dY:
(11:46:09 12/29/15)
(11:46:09 12/29/15)
(11:46:09 12/29/15)
(11:46:09 12/29/15)
(11:46:09 12/29/15)
RMS : 1.212 m/s²
RMS : 1.158 m/s²
RMS : 1.386 m/s²
RMS : 1.328 m/s²
RMS : 930 mm/s²
500 mHz 7 Hz1.005 m/s²
100 mHz
61.6 mm/s²
52.6 mm/s²
28.56 mm/s²
27.21 mm/s²
76.9 mm/s²
Cursor2
2.2 Hz
188.2 mm/s²
184.8 mm/s²
229.1 mm/s²
235.1 mm/s²
165.1 mm/s²
2.1 Hz
126.6 mm/s²
132.2 mm/s²
200.5 mm/s²
207.9 mm/s²
88.2 mm/s²
Display
Mode: Magnitude
Traces:
FFT1: AvSpc [3]-S001D003
FFT1: AvSpc [6]-S001D006
FFT1: AvSpc [9]-S001D009
FFT1: AvSpc [12]-S001D012
FFT1: AvSpc [14]-S001D013
Overall levels:
Power band marker
Id Trace From To Power
1 AvSpc [12]
Cursor1
X:
AvSpc [3] Y:
AvSpc [6] Y:
AvSpc [9] Y:
AvSpc [12] Y:
AvSpc [14] Y:
Cursor2
X:
AvSpc [3] Y:
AvSpc [6] Y:
AvSpc [9] Y:
AvSpc [12] Y:
AvSpc [14] Y:
dX:
AvSpc [3] dY:
AvSpc [6] dY:
AvSpc [9] dY:
AvSpc [12] dY:
AvSpc [14] dY:
(11:46:09 12/29/15)
(11:46:09 12/29/15)
(11:46:09 12/29/15)
(11:46:09 12/29/15)
(11:46:09 12/29/15)
RMS : 1.212 m/s²
RMS : 1.158 m/s²
RMS : 1.386 m/s²
RMS : 1.328 m/s²
RMS : 930 mm/s²
500 mHz 7 Hz 1.005 m/s²
100 mHz
61.6 mm/s²
52.6 mm/s²
28.56 mm/s²
27.21 mm/s²
76.9 mm/s²
Cursor2
2.2 Hz
188.2 mm/s²
184.8 mm/s²
229.1 mm/s²
235.1 mm/s²
165.1 mm/s²
2.1 Hz
126.6 mm/s²
132.2 mm/s²
200.5 mm/s²
207.9 mm/s²
88.2 mm/s²
Left rear broken
X Y Z
200 m 500 m 1 2 5 10 20
Frequency (Hz)
Acc
eler
atio
n (m
/s²)
200 m
400 m
600 m
800 m
1
1.2 Display
Mode: Magnitude
Traces:
FFT1: AvSpc [1]-S001D001
FFT1: AvSpc [4]-S001D004
FFT1: AvSpc [7]-S001D007
FFT1: AvSpc [10]-S001D010
Overall levels:
Cursor
X:
AvSpc [1] Y:
AvSpc [4] Y:
AvSpc [7] Y:
AvSpc [10] Y:
(10:59:58 01/12/16)
(10:59:58 01/12/16)
(10:59:58 01/12/16)
(10:59:58 01/12/16)
RMS : 592 mm/s²
RMS : 656 mm/s²
RMS : 612 mm/s²
RMS : 701 mm/s²
1.8 Hz
75.3 mm/s²
82.2 mm/s²
102.6 mm/s²
123.3 mm/s²
Display
Mode: Magnitude
Traces:
FFT1: AvSpc [1]-S001D001
FFT1: AvSpc [4]-S001D004
FFT1: AvSpc [7]-S001D007
FFT1: AvSpc [10]-S001D010
Overall levels:
Cursor
X:
AvSpc [1] Y:
AvSpc [4] Y:
AvSpc [7] Y:
AvSpc [10] Y:
(10:59:58 01/12/16)
(10:59:58 01/12/16)
(10:59:58 01/12/16)
(10:59:58 01/12/16)
RMS : 592 mm/s²
RMS : 656 mm/s²
RMS : 612 mm/s²
RMS : 701 mm/s²
1.8 Hz
75.3 mm/s²
82.2 mm/s²
102.6 mm/s²
123.3 mm/s²
200 m 500 m 1 2 5 10 20
Frequency (Hz)
Acc
eler
atio
n (m
/s²)
200 m
400 m
600 m
800 m
1
1.2 Display
Mode: Magnitude
Traces:
FFT1: AvSpc [2]-S001D002
FFT1: AvSpc [5]-S001D005
FFT1: AvSpc [8]-S001D008
FFT1: AvSpc [11]-S001D011
Overall levels:
Cursor
X:
AvSpc [2] Y:
AvSpc [5] Y:
AvSpc [8] Y:
AvSpc [11] Y:
(10:59:58 01/12/16)
(10:59:58 01/12/16)
(10:59:58 01/12/16)
(10:59:58 01/12/16)
RMS : 595 mm/s²
RMS : 669 mm/s²
RMS : 655 mm/s²
RMS : 644 mm/s²
1.6 Hz
84.6 mm/s²
85.9 mm/s²
93.7 mm/s²
86.7 mm/s²
Display
Mode: Magnitude
Traces:
FFT1: AvSpc [2]-S001D002
FFT1: AvSpc [5]-S001D005
FFT1: AvSpc [8]-S001D008
FFT1: AvSpc [11]-S001D011
Overall levels:
Cursor
X:
AvSpc [2] Y:
AvSpc [5] Y:
AvSpc [8] Y:
AvSpc [11] Y:
(10:59:58 01/12/16)
(10:59:58 01/12/16)
(10:59:58 01/12/16)
(10:59:58 01/12/16)
RMS : 595 mm/s²
RMS : 669 mm/s²
RMS : 655 mm/s²
RMS : 644 mm/s²
1.6 Hz
84.6 mm/s²
85.9 mm/s²
93.7 mm/s²
86.7 mm/s²
200 m 500 m 1 2 5 10 20
Frequency (Hz)
Acc
eler
atio
n (m
/s²)
200 m
400 m
600 m
800 m
1
1.2 1L 1R Display
Mode: Magnitude
Traces:
FFT1: AvSpc [3]-S001D003
FFT1: AvSpc [6]-S001D006
FFT1: AvSpc [9]-S001D009
FFT1: AvSpc [12]-S001D012
FFT1: AvSpc [13]-S001D014
Overall levels:
Power band marker
Id Trace From To Power
1AvSpc [12]
Cursor
X:
AvSpc [3] Y:
AvSpc [6] Y:
AvSpc [9] Y:
AvSpc [12] Y:
AvSpc [13] Y:
(10:59:58 01/12/16)
(10:59:58 01/12/16)
(10:59:58 01/12/16)
(10:59:58 01/12/16)
(10:59:58 01/12/16)
RMS : 1.139 m/s²
RMS : 1.072 m/s²
RMS : 1.341 m/s²
RMS : 1.273 m/s²
RMS : 843 mm/s²
500 mHz 7 Hz993 mm/s²
1.8 Hz
200.7 mm/s²
167.7 mm/s²
249.5 mm/s²
320.4 mm/s²
150.1 mm/s²
Display
Mode: Magnitude
Traces:
FFT1: AvSpc [3]-S001D003
FFT1: AvSpc [6]-S001D006
FFT1: AvSpc [9]-S001D009
FFT1: AvSpc [12]-S001D012
FFT1: AvSpc [13]-S001D014
Overall levels:
Power band marker
Id Trace From To Power
1 AvSpc [12]
Cursor
X:
AvSpc [3] Y:
AvSpc [6] Y:
AvSpc [9] Y:
AvSpc [12] Y:
AvSpc [13] Y:
(10:59:58 01/12/16)
(10:59:58 01/12/16)
(10:59:58 01/12/16)
(10:59:58 01/12/16)
(10:59:58 01/12/16)
RMS : 1.139 m/s²
RMS : 1.072 m/s²
RMS : 1.341 m/s²
RMS : 1.273 m/s²
RMS : 843 mm/s²
500 mHz 7 Hz 993 mm/s²
1.8 Hz
200.7 mm/s²
167.7 mm/s²
249.5 mm/s²
320.4 mm/s²
150.1 mm/s²
Both rear broken
X Y Z
200 m 500 m 1 2 5 10 20
Frequency (Hz)
Acc
eler
atio
n (m
/s²)
200 m
400 m
600 m
800 m
1
1.2 Display
Mode: Magnitude
Traces:
FFT1: AvSpc [1]-S001D001
FFT1: AvSpc [4]-S001D004
FFT1: AvSpc [7]-S001D007
FFT1: AvSpc [10]-S001D010
Overall levels:
Cursor
X:
AvSpc [1] Y:
AvSpc [4] Y:
AvSpc [7] Y:
AvSpc [10] Y:
(12:05:30 01/12/16)
(12:05:30 01/12/16)
(12:05:30 01/12/16)
(12:05:30 01/12/16)
RMS : 804 mm/s²
RMS : 786 mm/s²
RMS : 818 mm/s²
RMS : 885 mm/s²
1.7 Hz
127.3 mm/s²
137.8 mm/s²
185.9 mm/s²
244.6 mm/s²
Display
Mode: Magnitude
Traces:
FFT1: AvSpc [1]-S001D001
FFT1: AvSpc [4]-S001D004
FFT1: AvSpc [7]-S001D007
FFT1: AvSpc [10]-S001D010
Overall levels:
Cursor
X:
AvSpc [1] Y:
AvSpc [4] Y:
AvSpc [7] Y:
AvSpc [10] Y:
(12:05:30 01/12/16)
(12:05:30 01/12/16)
(12:05:30 01/12/16)
(12:05:30 01/12/16)
RMS : 804 mm/s²
RMS : 786 mm/s²
RMS : 818 mm/s²
RMS : 885 mm/s²
1.7 Hz
127.3 mm/s²
137.8 mm/s²
185.9 mm/s²
244.6 mm/s²
200 m 500 m 1 2 5 10 20
Frequency (Hz)
Acc
eler
atio
n (m
/s²)
200 m
400 m
600 m
800 m
1
1.2 Display
Mode: Magnitude
Traces:
FFT1: AvSpc [2]-S001D002
FFT1: AvSpc [5]-S001D005
FFT1: AvSpc [8]-S001D008
FFT1: AvSpc [11]-S001D011
Overall levels:
Cursor
X:
AvSpc [2] Y:
AvSpc [5] Y:
AvSpc [8] Y:
AvSpc [11] Y:
(12:05:30 01/12/16)
(12:05:30 01/12/16)
(12:05:30 01/12/16)
(12:05:30 01/12/16)
RMS : 737 mm/s²
RMS : 815 mm/s²
RMS : 771 mm/s²
RMS : 768 mm/s²
1.6 Hz
77.4 mm/s²
68.2 mm/s²
97.6 mm/s²
113.3 mm/s²
Display
Mode: Magnitude
Traces:
FFT1: AvSpc [2]-S001D002
FFT1: AvSpc [5]-S001D005
FFT1: AvSpc [8]-S001D008
FFT1: AvSpc [11]-S001D011
Overall levels:
Cursor
X:
AvSpc [2] Y:
AvSpc [5] Y:
AvSpc [8] Y:
AvSpc [11] Y:
(12:05:30 01/12/16)
(12:05:30 01/12/16)
(12:05:30 01/12/16)
(12:05:30 01/12/16)
RMS : 737 mm/s²
RMS : 815 mm/s²
RMS : 771 mm/s²
RMS : 768 mm/s²
1.6 Hz
77.4 mm/s²
68.2 mm/s²
97.6 mm/s²
113.3 mm/s²
200 m 500 m 1 2 5 10 20
Frequency (Hz)
Acc
eler
atio
n (m
/s²)
200 m
400 m
600 m
800 m
1
1.2 1L 1R Display
Mode: Magnitude
Traces:
FFT1: AvSpc [3]-S001D003
FFT1: AvSpc [6]-S001D006
FFT1: AvSpc [9]-S001D009
FFT1: AvSpc [12]-S001D012
FFT1: AvSpc [13]-S001D014
Overall levels:
Power band marker
Id Trace From To Power
1AvSpc [12]
Cursor
X:
AvSpc [3] Y:
AvSpc [6] Y:
AvSpc [9] Y:
AvSpc [12] Y:
AvSpc [13] Y:
(12:05:30 01/12/16)
(12:05:30 01/12/16)
(12:05:30 01/12/16)
(12:05:30 01/12/16)
(12:05:30 01/12/16)
RMS : 1.221 m/s²
RMS : 1.177 m/s²
RMS : 1.802 m/s²
RMS : 1.716 m/s²
RMS : 948 mm/s²
500 mHz 7 Hz1.438 m/s²
1.7 Hz
172.5 mm/s²
196.5 mm/s²
733 mm/s²
704 mm/s²
134.6 mm/s²
Display
Mode: Magnitude
Traces:
FFT1: AvSpc [3]-S001D003
FFT1: AvSpc [6]-S001D006
FFT1: AvSpc [9]-S001D009
FFT1: AvSpc [12]-S001D012
FFT1: AvSpc [13]-S001D014
Overall levels:
Power band marker
Id Trace From To Power
1 AvSpc [12]
Cursor
X:
AvSpc [3] Y:
AvSpc [6] Y:
AvSpc [9] Y:
AvSpc [12] Y:
AvSpc [13] Y:
(12:05:30 01/12/16)
(12:05:30 01/12/16)
(12:05:30 01/12/16)
(12:05:30 01/12/16)
(12:05:30 01/12/16)
RMS : 1.221 m/s²
RMS : 1.177 m/s²
RMS : 1.802 m/s²
RMS : 1.716 m/s²
RMS : 948 mm/s²
500 mHz 7 Hz 1.438 m/s²
1.7 Hz
172.5 mm/s²
196.5 mm/s²
733 mm/s²
704 mm/s²
134.6 mm/s²
Front right and rear left broken
X Y Z
200 m 500 m 1 2 5 10 20
Frequency (Hz)
Acc
eler
atio
n (m
/s²)
200 m
400 m
600 m
800 m
1
1.2 Display
Mode: Magnitude
Traces:
FFT1: AvSpc [1]-S001D001
FFT1: AvSpc [4]-S001D004
FFT1: AvSpc [7]-S001D007
FFT1: AvSpc [10]-S001D010
Overall levels:
Cursor
X:
AvSpc [1] Y:
AvSpc [4] Y:
AvSpc [7] Y:
AvSpc [10] Y:
(12:00:38 01/13/16)
(12:00:38 01/13/16)
(12:00:38 01/13/16)
(12:00:38 01/13/16)
RMS : 643 mm/s²
RMS : 675 mm/s²
RMS : 662 mm/s²
RMS : 751 mm/s²
1.7 Hz
103.5 mm/s²
102.5 mm/s²
135.5 mm/s²
161.9 mm/s²
Display
Mode: Magnitude
Traces:
FFT1: AvSpc [1]-S001D001
FFT1: AvSpc [4]-S001D004
FFT1: AvSpc [7]-S001D007
FFT1: AvSpc [10]-S001D010
Overall levels:
Cursor
X:
AvSpc [1] Y:
AvSpc [4] Y:
AvSpc [7] Y:
AvSpc [10] Y:
(12:00:38 01/13/16)
(12:00:38 01/13/16)
(12:00:38 01/13/16)
(12:00:38 01/13/16)
RMS : 643 mm/s²
RMS : 675 mm/s²
RMS : 662 mm/s²
RMS : 751 mm/s²
1.7 Hz
103.5 mm/s²
102.5 mm/s²
135.5 mm/s²
161.9 mm/s²
200 m 500 m 1 2 5 10 20
Frequency (Hz)
Acc
eler
atio
n (m
/s²)
200 m
400 m
600 m
800 m
1
1.2 Display
Mode: Magnitude
Traces:
FFT1: AvSpc [2]-S001D002
FFT1: AvSpc [5]-S001D005
FFT1: AvSpc [8]-S001D008
FFT1: AvSpc [11]-S001D011
Overall levels:
Cursor
X:
AvSpc [2] Y:
AvSpc [5] Y:
AvSpc [8] Y:
AvSpc [11] Y:
(12:00:38 01/13/16)
(12:00:38 01/13/16)
(12:00:38 01/13/16)
(12:00:38 01/13/16)
RMS : 624 mm/s²
RMS : 803 mm/s²
RMS : 746 mm/s²
RMS : 711 mm/s²
1.7 Hz
76.1 mm/s²
134.1 mm/s²
163 mm/s²
141.3 mm/s²
Display
Mode: Magnitude
Traces:
FFT1: AvSpc [2]-S001D002
FFT1: AvSpc [5]-S001D005
FFT1: AvSpc [8]-S001D008
FFT1: AvSpc [11]-S001D011
Overall levels:
Cursor
X:
AvSpc [2] Y:
AvSpc [5] Y:
AvSpc [8] Y:
AvSpc [11] Y:
(12:00:38 01/13/16)
(12:00:38 01/13/16)
(12:00:38 01/13/16)
(12:00:38 01/13/16)
RMS : 624 mm/s²
RMS : 803 mm/s²
RMS : 746 mm/s²
RMS : 711 mm/s²
1.7 Hz
76.1 mm/s²
134.1 mm/s²
163 mm/s²
141.3 mm/s²
200 m 500 m 1 2 5 10 20
Frequency (Hz)
Acc
eler
atio
n (m
/s²)
200 m
400 m
600 m
800 m
1
1.2 1L 1R Display
Mode: Magnitude
Traces:
FFT1: AvSpc [3]-S001D003
FFT1: AvSpc [6]-S001D006
FFT1: AvSpc [9]-S001D009
FFT1: AvSpc [12]-S001D012
FFT1: AvSpc [13]-S001D014
Overall levels:
Power band marker
Id Trace From To Power
1AvSpc [12]
Cursor
X:
AvSpc [3] Y:
AvSpc [6] Y:
AvSpc [9] Y:
AvSpc [12] Y:
AvSpc [13] Y:
(12:00:38 01/13/16)
(12:00:38 01/13/16)
(12:00:38 01/13/16)
(12:00:38 01/13/16)
(12:00:38 01/13/16)
RMS : 1.374 m/s²
RMS : 1.141 m/s²
RMS : 1.381 m/s²
RMS : 1.438 m/s²
RMS : 994 mm/s²
500 mHz 7 Hz1.196 m/s²
1.7 Hz
371.2 mm/s²
227.7 mm/s²
336.8 mm/s²
448.3 mm/s²
261.8 mm/s²
Display
Mode: Magnitude
Traces:
FFT1: AvSpc [3]-S001D003
FFT1: AvSpc [6]-S001D006
FFT1: AvSpc [9]-S001D009
FFT1: AvSpc [12]-S001D012
FFT1: AvSpc [13]-S001D014
Overall levels:
Power band marker
Id Trace From To Power
1 AvSpc [12]
Cursor
X:
AvSpc [3] Y:
AvSpc [6] Y:
AvSpc [9] Y:
AvSpc [12] Y:
AvSpc [13] Y:
(12:00:38 01/13/16)
(12:00:38 01/13/16)
(12:00:38 01/13/16)
(12:00:38 01/13/16)
(12:00:38 01/13/16)
RMS : 1.374 m/s²
RMS : 1.141 m/s²
RMS : 1.381 m/s²
RMS : 1.438 m/s²
RMS : 994 mm/s²
500 mHz 7 Hz 1.196 m/s²
1.7 Hz
371.2 mm/s²
227.7 mm/s²
336.8 mm/s²
448.3 mm/s²
261.8 mm/s²
All broken
X Y Z
200 m 500 m 1 2 5 10 20
Frequency (Hz)
Acc
eler
atio
n (m
/s²)
200 m
400 m
600 m
800 m
1
1.2 Display
Mode: Magnitude
Traces:
FFT1: AvSpc [1]-S001D001
FFT1: AvSpc [4]-S001D004
FFT1: AvSpc [7]-S001D007
FFT1: AvSpc [10]-S001D010
Overall levels:
Cursor
X:
AvSpc [1] Y:
AvSpc [4] Y:
AvSpc [7] Y:
AvSpc [10] Y:
(13:13:00 01/12/16)
(13:13:00 01/12/16)
(13:13:00 01/12/16)
(13:13:00 01/12/16)
RMS : 777 mm/s²
RMS : 767 mm/s²
RMS : 835 mm/s²
RMS : 936 mm/s²
1.7 Hz
202.1 mm/s²
216.2 mm/s²
297.4 mm/s²
382.5 mm/s²
Display
Mode: Magnitude
Traces:
FFT1: AvSpc [1]-S001D001
FFT1: AvSpc [4]-S001D004
FFT1: AvSpc [7]-S001D007
FFT1: AvSpc [10]-S001D010
Overall levels:
Cursor
X:
AvSpc [1] Y:
AvSpc [4] Y:
AvSpc [7] Y:
AvSpc [10] Y:
(13:13:00 01/12/16)
(13:13:00 01/12/16)
(13:13:00 01/12/16)
(13:13:00 01/12/16)
RMS : 777 mm/s²
RMS : 767 mm/s²
RMS : 835 mm/s²
RMS : 936 mm/s²
1.7 Hz
202.1 mm/s²
216.2 mm/s²
297.4 mm/s²
382.5 mm/s²
200 m 500 m 1 2 5 10 20
Frequency (Hz)
Acc
eler
atio
n (m
/s²)
200 m
400 m
600 m
800 m
1
1.2 Display
Mode: Magnitude
Traces:
FFT1: AvSpc [2]-S001D002
FFT1: AvSpc [5]-S001D005
FFT1: AvSpc [8]-S001D008
FFT1: AvSpc [11]-S001D011
Overall levels:
Cursor
X:
AvSpc [2] Y:
AvSpc [5] Y:
AvSpc [8] Y:
AvSpc [11] Y:
(13:13:00 01/12/16)
(13:13:00 01/12/16)
(13:13:00 01/12/16)
(13:13:00 01/12/16)
RMS : 832 mm/s²
RMS : 928 mm/s²
RMS : 755 mm/s²
RMS : 770 mm/s²
1.4 Hz
211.6 mm/s²
174.4 mm/s²
144 mm/s²
163.8 mm/s²
Display
Mode: Magnitude
Traces:
FFT1: AvSpc [2]-S001D002
FFT1: AvSpc [5]-S001D005
FFT1: AvSpc [8]-S001D008
FFT1: AvSpc [11]-S001D011
Overall levels:
Cursor
X:
AvSpc [2] Y:
AvSpc [5] Y:
AvSpc [8] Y:
AvSpc [11] Y:
(13:13:00 01/12/16)
(13:13:00 01/12/16)
(13:13:00 01/12/16)
(13:13:00 01/12/16)
RMS : 832 mm/s²
RMS : 928 mm/s²
RMS : 755 mm/s²
RMS : 770 mm/s²
1.4 Hz
211.6 mm/s²
174.4 mm/s²
144 mm/s²
163.8 mm/s²
200 m 500 m 1 2 5 10 20
Frequency (Hz)
Acc
eler
atio
n (m
/s²)
200 m
400 m
600 m
800 m
1
1.2 1L 1R1 2 Display
Mode: Magnitude
Traces:
FFT1: AvSpc [3]-S001D003
FFT1: AvSpc [6]-S001D006
FFT1: AvSpc [9]-S001D009
FFT1: AvSpc [12]-S001D012
FFT1: AvSpc [13]-S001D014
Overall levels:
Power band marker
Id Trace From To Power
1AvSpc [12]
Cursor1
X:
AvSpc [3] Y:
AvSpc [6] Y:
AvSpc [9] Y:
AvSpc [12] Y:
AvSpc [13] Y:
Cursor2
X:
AvSpc [3] Y:
AvSpc [6] Y:
AvSpc [9] Y:
AvSpc [12] Y:
AvSpc [13] Y:
dX:
AvSpc [3] dY:
AvSpc [6] dY:
AvSpc [9] dY:
AvSpc [12] dY:
AvSpc [13] dY:
(13:13:00 01/12/16)
(13:13:00 01/12/16)
(13:13:00 01/12/16)
(13:13:00 01/12/16)
(13:13:00 01/12/16)
RMS : 1.682 m/s²
RMS : 1.612 m/s²
RMS : 2.011 m/s²
RMS : 1.949 m/s²
RMS : 1.457 m/s²
500 mHz 7 Hz1.734 m/s²
1.4 Hz
796 mm/s²
775 mm/s²
517 mm/s²
510 mm/s²
753 mm/s²
Cursor2
1.7 Hz
418.2 mm/s²
397.5 mm/s²
1.038 m/s²
1.03 m/s²
334.1 mm/s²
300 mHz
-377.9 mm/s²
-377.3 mm/s²
521 mm/s²
519 mm/s²
-419.2 mm/s²
Display
Mode: Magnitude
Traces:
FFT1: AvSpc [3]-S001D003
FFT1: AvSpc [6]-S001D006
FFT1: AvSpc [9]-S001D009
FFT1: AvSpc [12]-S001D012
FFT1: AvSpc [13]-S001D014
Overall levels:
Power band marker
Id Trace From To Power
1 AvSpc [12]
Cursor1
X:
AvSpc [3] Y:
AvSpc [6] Y:
AvSpc [9] Y:
AvSpc [12] Y:
AvSpc [13] Y:
Cursor2
X:
AvSpc [3] Y:
AvSpc [6] Y:
AvSpc [9] Y:
AvSpc [12] Y:
AvSpc [13] Y:
dX:
AvSpc [3] dY:
AvSpc [6] dY:
AvSpc [9] dY:
AvSpc [12] dY:
AvSpc [13] dY:
(13:13:00 01/12/16)
(13:13:00 01/12/16)
(13:13:00 01/12/16)
(13:13:00 01/12/16)
(13:13:00 01/12/16)
RMS : 1.682 m/s²
RMS : 1.612 m/s²
RMS : 2.011 m/s²
RMS : 1.949 m/s²
RMS : 1.457 m/s²
500 mHz 7 Hz 1.734 m/s²
1.4 Hz
796 mm/s²
775 mm/s²
517 mm/s²
510 mm/s²
753 mm/s²
Cursor2
1.7 Hz
418.2 mm/s²
397.5 mm/s²
1.038 m/s²
1.03 m/s²
334.1 mm/s²
300 mHz
-377.9 mm/s²
-377.3 mm/s²
521 mm/s²
519 mm/s²
-419.2 mm/s²
Fig. 5. FFT spectrums of 3 axial vibration for all conditions

DIAGNOSTYKA, Vol. 18, No. 1 (2017)
BIAŁKOWSKI, KRĘŻEL: Diagnostic of shock absorbers during road test with the use of vibration FFT and …
83
Table 2. Change of dominating mode amplitude for direction Z (for frequency of mode)
Point
Vibration amplitude change [%]
One rear broken Two rear broken One front and one
rear broken All broken
P1 5.3 -10.5 94.7 321.1
P2 -5.6 11.1 27.8 333.3
P3 8.7 217.4 47.8 352.2
P4 33.3 191.7 87.5 329.2
P5 -11.8 -23.5 52.9 341.2
With the following conditions and with more
dampers broken, damping was lower, which
resulted in an increase of the amplitude of the
narrow resonance peak. On graph for all dampers
broken and direction Z, two high peaks may be
observed at 1.4 Hz and at 1.7 Hz. The first mode
was for the front suspension and second was for the
rear. The rear frequency was higher because of the
location of the center of mass. On the other graphs
those two modes are visible, but the one related to
the rear suspension is dominant.
For the most difficult to detect condition, when
only one absorber was damaged, the highest
difference of maximum FFT vibration (33.3%) was
near the damaged damper (table 2 - P4). If more
absorbers are damaged, the results are even better.
This would be a success but vibration is strongly
related to driving character, type of road, vehicle
speed, total mass, roughness and many other
factors. That is why a new calculation was used. To
get rid of the effect that vibration values depend on
the type of road and driving paramters, a new
estimation was created: Max value/band power.
When the damper is broken, the damping of the
system goes down and the amplitude of the
resonance increases. So the aim was to find a
function that would show the rise of the value in the
resonance independent of the increase in total
vibration (power band).
In FRF this is realized by the half power method. In
this case, it was difficult to use that approach,
because some approximation of curves was needed
(involving too much error).
The results for that estimation are listed in table
3. The results are a little better for one damper
broken. For other conditions this function decreases
the results. But the main aim was to detect damage
independently from driving conditions and not to
improve the measurements themselves.
Cross spectra were prepared. A cross spectrum
is function other than an FRF that gives phase
information. The cross spectra were calculated for
direction Z and for the following points:
- Both front points (point 1 and point 2),
- Both rear points (point 3 and point 4),
- One front point and one rear front
(diagonal – point 1 and point 4),
- One front point and one rear front
(diagonal – point 2 and point 3).
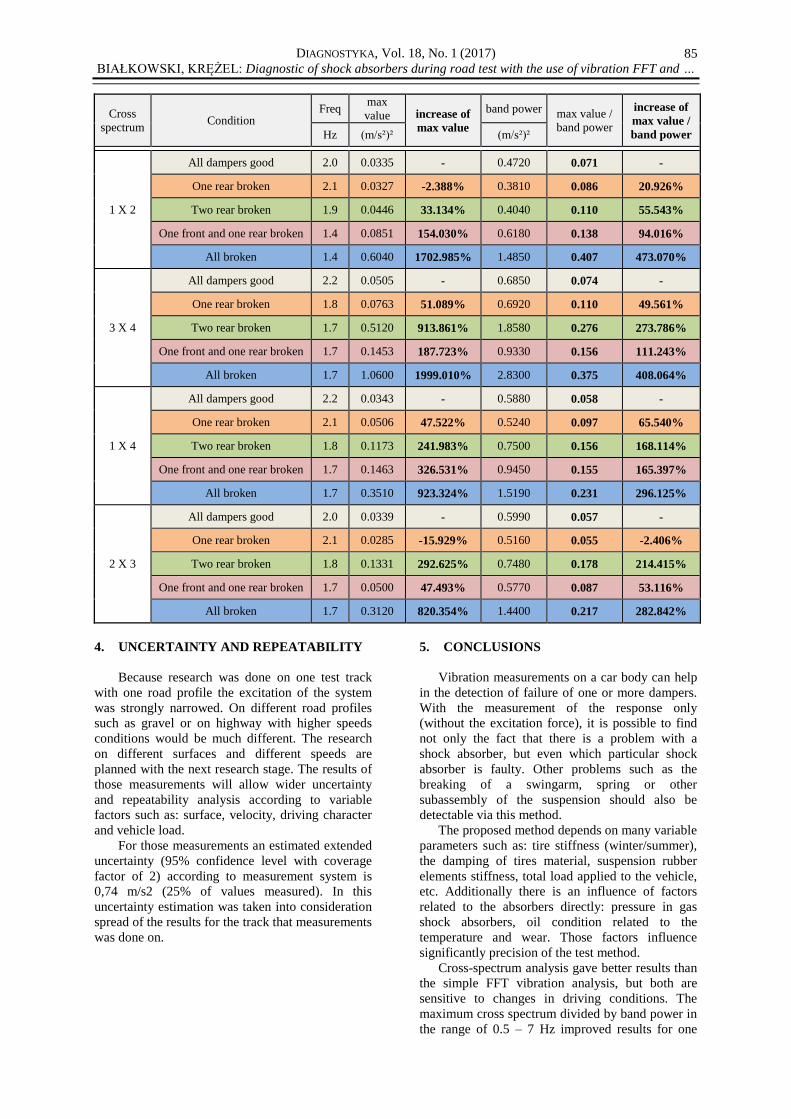
The cross spectrum graphs are presented in
fig. 6 and values are listed in table 4. Two values
were taken: the maximum value in the range of 0 –
40 Hz and band power of 0.5 – 7 Hz. Cross
spectrum maximum values gave better results than
the FFT. But the measurements were performed on
the same road and with a very similar type of
driving. Change of road, speed, weight and other
factors would change the FFT values and the cross
spectra even more. Under normal conditions a
vehicle travels on many types of roads so the
diagnostic must not be sensitive to this.
The biggest problem was for one damper
broken, because damping loss and vibration
increase were not significant. The highest increase
was observed for spectra when one of the signals
was from the accelerometer near the broken damper
(point 4) - for cross spectra 3&4 and 1&4 the
increase was approximately 50%. For 1&2 results
were similar to those for all good dampers. For 2&3
results were a little lower (-16% approx.) than for
all dampers good. The max value/power band
estimator improved those results to 21%, 50%, 66%
and -2%.
For both rear dumpers broken, as is reasonable,
the highest increase was for cross spectrum 3&4
and the lowest for 1&2.
For condition when the rear right and front left
shock absorbers were destroyed, the lowest increase
(47%) was for cross spectra from points near the
good dampers (2&3). The highest was for 1&4
damaged (327%). For two front and two rear points,
results were near the average of the above (154%
and 188%).
For all dampers broken results were very high
(minimum 820% for 2&3 and maximum almost
2000% for 3&4). For all options, besides one
damper broken, the max value/band power factor
gave lower results. Nevertheless, they were still
high.
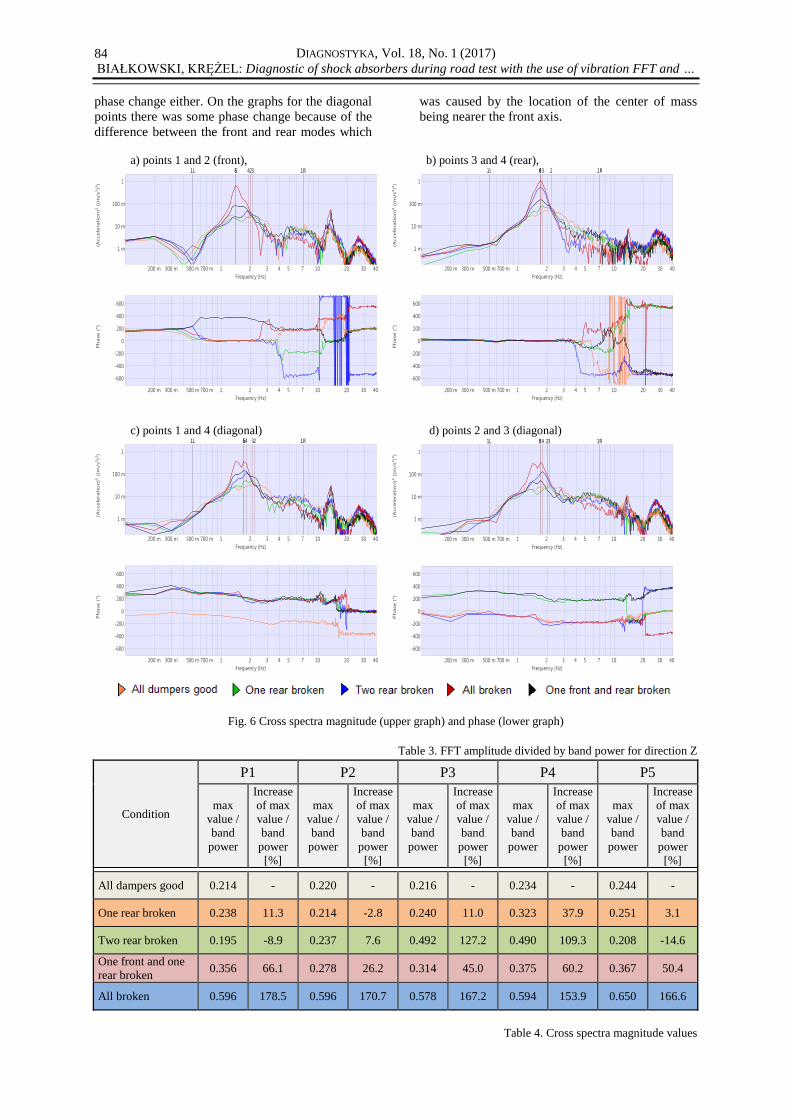
According to the phase of the signals for the
rear points, both were in phase and flat up to 4 Hz,
which means that point 3 and 4 moved with the
same sign at first resonance. For the front points the
phase changed by approx. 180 degree at 0.4 Hz, but
for the main resonance (1.4 - 2 Hz) there was no
DIAGNOSTYKA, Vol. 18, No. 1 (2017)
BIAŁKOWSKI, KRĘŻEL: Diagnostic of shock absorbers during road test with the use of vibration FFT and …
84
phase change either. On the graphs for the diagonal
points there was some phase change because of the
difference between the front and rear modes which
was caused by the location of the center of mass
being nearer the front axis.
a) points 1 and 2 (front), b) points 3 and 4 (rear),
200 m 300 m 500 m 700 m 1 2 3 4 5 7 10 20 30 40
Frequency (Hz)
(Accele
rati
on
)² (
(m/s²)²
)
1 m
10 m
100 m
1
1L 1R23456
200 m 300 m 500 m 700 m 1 2 3 4 5 7 10 20 30 40
Frequency (Hz)
Ph
ase (
°)
-600
-400
-200
0
200
400
600
Max marker
Id Trace X Y
2AvXSpc [3/6](EU²)
3 AvXSpc [3/6](EU²)
4 AvXSpc [3/6](EU²)
5 AvXSpc [3/6](EU²)
6 AvXSpc [3/6](EU²)
Power band marker
Id Trace From To Power
1AvXSpc [3/6] (EU²)
1 AvXSpc [3/6] (EU²)
1 AvXSpc [3/6] (EU²)
1 AvXSpc [3/6] (EU²)
1 AvXSpc [3/6] (EU²)
2 Hz 33.5 m(m/s²)²
2.1 Hz 32.7 m(m/s²)²
1.9 Hz 44.6 m(m/s²)²
1.4 Hz 604 m(m/s²)²
1.4 Hz 85.1 m(m/s²)²
500 mHz 7 Hz472 m(m/s²)²
500 mHz 7 Hz381 m(m/s²)²
500 mHz 7 Hz404 m(m/s²)²
500 mHz 7 Hz1.485 (m/s²)²
500 mHz 7 Hz618 m(m/s²)²
Max marker
Id Trace X Y
2 AvXSpc [3/6](EU²)
3 AvXSpc [3/6](EU²)
4 AvXSpc [3/6](EU²)
5 AvXSpc [3/6](EU²)
6 AvXSpc [3/6](EU²)
Power band marker
Id Trace From To Power
1 AvXSpc [3/6] (EU²)
1 AvXSpc [3/6] (EU²)
1 AvXSpc [3/6] (EU²)
1 AvXSpc [3/6] (EU²)
1 AvXSpc [3/6] (EU²)
2 Hz 33.5 m(m/s²)²
2.1 Hz 32.7 m(m/s²)²
1.9 Hz 44.6 m(m/s²)²
1.4 Hz 604 m(m/s²)²
1.4 Hz 85.1 m(m/s²)²
500 mHz 7 Hz 472 m(m/s²)²
500 mHz 7 Hz 381 m(m/s²)²
500 mHz 7 Hz 404 m(m/s²)²
500 mHz 7 Hz 1.485 (m/s²)²
500 mHz 7 Hz 618 m(m/s²)²
200 m 300 m 500 m 700 m 1 2 3 4 5 7 10 20 30 40
Frequency (Hz)
(Accele
rati
on
)² (
(m/s²)²
)
1 m
10 m
100 m
1
1L 1R23456
200 m 300 m 500 m 700 m 1 2 3 4 5 7 10 20 30 40
Frequency (Hz)P
hase (
°)
-600
-400
-200
0
200
400
600
Display
Mode: Magnitude/Phase
Traces:
allOK: FFT1: AvXSpc [12]-S001D012 [9]-S001D009(EU²)
1dead: FFT1: AvXSpc [12]-S001D012 [9]-S001D009(EU²)
2tyl: FFT1: AvXSpc [12]-S001D012 [9]-S001D009(EU²)
allDead: FFT1: AvXSpc [12]-S001D012 [9]-S001D009(EU²)
2przekatna: FFT1: AvXSpc [12]-S001D012 [9]-S001D009(EU²)
Max marker
Id Trace X Y
2AvXSpc [12/9](EU²)
3 AvXSpc [12/9](EU²)
4 AvXSpc [12/9](EU²)
5 AvXSpc [12/9](EU²)
6 AvXSpc [12/9](EU²)
Power band marker
Id Trace From To Power
1AvXSpc [12/9] (EU²)
1 AvXSpc [12/9] (EU²)
1 AvXSpc [12/9] (EU²)
1 AvXSpc [12/9] (EU²)
1 AvXSpc [12/9] (EU²)
Cursor
X:
AvXSpc [12/9](EU²) Y:
AvXSpc [12/9](EU²) Y:
AvXSpc [12/9](EU²) Y:
AvXSpc [12/9](EU²) Y:
AvXSpc [12/9](EU²) Y:
AvXSpc [12/9](EU²) Y:
AvXSpc [12/9](EU²) Y:
AvXSpc [12/9](EU²) Y:
AvXSpc [12/9](EU²) Y:
AvXSpc [12/9](EU²) Y:
(11:46:09 12/29/15)
(10:59:58 01/12/16)
(12:05:30 01/12/16)
(13:13:00 01/12/16)
(12:00:38 01/13/16)
2.2 Hz 50.5 m(m/s²)²
1.8 Hz 76.3 m(m/s²)²
1.7 Hz 512 m(m/s²)²
1.7 Hz 1.06 (m/s²)²
1.7 Hz 145.3 m(m/s²)²
500 mHz 7 Hz685 m(m/s²)²
500 mHz 7 Hz692 m(m/s²)²
500 mHz 7 Hz1.858 (m/s²)²
500 mHz 7 Hz 2.83 (m/s²)²
500 mHz 7 Hz933 m(m/s²)²
100 mHz
347 u(m/s²)²
187.3 u(m/s²)²
429 u(m/s²)²
435 u(m/s²)²
487 u(m/s²)²
28.3 °
27.7 °
11.9 °
14.8 °
6.9 °
Display
Mode: Magnitude/Phase
Traces:
allOK: FFT1: AvXSpc [12]-S001D012 [9]-S001D009(EU²)
1dead: FFT1: AvXSpc [12]-S001D012 [9]-S001D009(EU²)
2tyl: FFT1: AvXSpc [12]-S001D012 [9]-S001D009(EU²)
allDead: FFT1: AvXSpc [12]-S001D012 [9]-S001D009(EU²)
2przekatna: FFT1: AvXSpc [12]-S001D012 [9]-S001D009(EU²)
Max marker
Id Trace X Y
2 AvXSpc [12/9](EU²)
3 AvXSpc [12/9](EU²)
4 AvXSpc [12/9](EU²)
5 AvXSpc [12/9](EU²)
6 AvXSpc [12/9](EU²)
Power band marker
Id Trace From To Power
1 AvXSpc [12/9] (EU²)
1 AvXSpc [12/9] (EU²)
1 AvXSpc [12/9] (EU²)
1 AvXSpc [12/9] (EU²)
1 AvXSpc [12/9] (EU²)
Cursor
X:
AvXSpc [12/9](EU²) Y:
AvXSpc [12/9](EU²) Y:
AvXSpc [12/9](EU²) Y:
AvXSpc [12/9](EU²) Y:
AvXSpc [12/9](EU²) Y:
AvXSpc [12/9](EU²) Y:
AvXSpc [12/9](EU²) Y:
AvXSpc [12/9](EU²) Y:
AvXSpc [12/9](EU²) Y:
AvXSpc [12/9](EU²) Y:
(11:46:09 12/29/15)
(10:59:58 01/12/16)
(12:05:30 01/12/16)
(13:13:00 01/12/16)
(12:00:38 01/13/16)
2.2 Hz 50.5 m(m/s²)²
1.8 Hz 76.3 m(m/s²)²
1.7 Hz 512 m(m/s²)²
1.7 Hz 1.06 (m/s²)²
1.7 Hz 145.3 m(m/s²)²
500 mHz 7 Hz 685 m(m/s²)²
500 mHz 7 Hz 692 m(m/s²)²
500 mHz 7 Hz 1.858 (m/s²)²
500 mHz 7 Hz 2.83 (m/s²)²
500 mHz 7 Hz 933 m(m/s²)²
100 mHz
347 u(m/s²)²
187.3 u(m/s²)²
429 u(m/s²)²
435 u(m/s²)²
487 u(m/s²)²
28.3 °
27.7 °
11.9 °
14.8 °
6.9 °
c) points 1 and 4 (diagonal) d) points 2 and 3 (diagonal)
200 m 300 m 500 m 700 m 1 2 3 4 5 7 10 20 30 40
Frequency (Hz)
(Accele
rati
on
)² (
(m/s²)²
)
1 m
10 m
100 m
1
1L 1R23456
200 m 300 m 500 m 700 m 1 2 3 4 5 7 10 20 30 40
Frequency (Hz)
Ph
ase (
°)
-600
-400
-200
0
200
400
600
Display
Mode: Magnitude/Phase
Traces:
allOK: FFT1: AvXSpc [12]-S001D012 [3]-S001D003(EU²)
1dead: FFT1: AvXSpc [12]-S001D012 [3]-S001D003(EU²)
2tyl: FFT1: AvXSpc [12]-S001D012 [3]-S001D003(EU²)
allDead: FFT1: AvXSpc [12]-S001D012 [3]-S001D003(EU²)
2przekatna: FFT1: AvXSpc [12]-S001D012 [3]-S001D003(EU²)
Max marker
Id Trace X Y
2AvXSpc [12/3](EU²)
3 AvXSpc [12/3](EU²)
4 AvXSpc [12/3](EU²)
5 AvXSpc [12/3](EU²)
6 AvXSpc [12/3](EU²)
Power band marker
Id Trace From To Power
1AvXSpc [12/3] (EU²)
1 AvXSpc [12/3] (EU²)
1 AvXSpc [12/3] (EU²)
1 AvXSpc [12/3] (EU²)
1 AvXSpc [12/3] (EU²)
Cursor
X:
AvXSpc [12/3](EU²) Y:
AvXSpc [12/3](EU²) Y:
AvXSpc [12/3](EU²) Y:
AvXSpc [12/3](EU²) Y:
AvXSpc [12/3](EU²) Y:
AvXSpc [12/3](EU²) Y:
AvXSpc [12/3](EU²) Y:
AvXSpc [12/3](EU²) Y:
AvXSpc [12/3](EU²) Y:
AvXSpc [12/3](EU²) Y:
(11:46:09 12/29/15)
(10:59:58 01/12/16)
(12:05:30 01/12/16)
(13:13:00 01/12/16)
(12:00:38 01/13/16)
2.2 Hz 34.3 m(m/s²)²
2.1 Hz 50.6 m(m/s²)²
1.8 Hz 117.3 m(m/s²)²
1.7 Hz 351 m(m/s²)²
1.7 Hz 146.3 m(m/s²)²
500 mHz 7 Hz588 m(m/s²)²
500 mHz 7 Hz524 m(m/s²)²
500 mHz 7 Hz750 m(m/s²)²
500 mHz 7 Hz1.519 (m/s²)²
500 mHz 7 Hz945 m(m/s²)²
100 mHz
556 u(m/s²)²
636 u(m/s²)²
571 u(m/s²)²
618 u(m/s²)²
566 u(m/s²)²
-68.7 °
259.6 °
281.2 °
245.1 °
300 °
Display
Mode: Magnitude/Phase
Traces:
allOK: FFT1: AvXSpc [12]-S001D012 [3]-S001D003(EU²)
1dead: FFT1: AvXSpc [12]-S001D012 [3]-S001D003(EU²)
2tyl: FFT1: AvXSpc [12]-S001D012 [3]-S001D003(EU²)
allDead: FFT1: AvXSpc [12]-S001D012 [3]-S001D003(EU²)
2przekatna: FFT1: AvXSpc [12]-S001D012 [3]-S001D003(EU²)
Max marker
Id Trace X Y
2 AvXSpc [12/3](EU²)
3 AvXSpc [12/3](EU²)
4 AvXSpc [12/3](EU²)
5 AvXSpc [12/3](EU²)
6 AvXSpc [12/3](EU²)
Power band marker
Id Trace From To Power
1 AvXSpc [12/3] (EU²)
1 AvXSpc [12/3] (EU²)
1 AvXSpc [12/3] (EU²)
1 AvXSpc [12/3] (EU²)
1 AvXSpc [12/3] (EU²)
Cursor
X:
AvXSpc [12/3](EU²) Y:
AvXSpc [12/3](EU²) Y:
AvXSpc [12/3](EU²) Y:
AvXSpc [12/3](EU²) Y:
AvXSpc [12/3](EU²) Y:
AvXSpc [12/3](EU²) Y:
AvXSpc [12/3](EU²) Y:
AvXSpc [12/3](EU²) Y:
AvXSpc [12/3](EU²) Y:
AvXSpc [12/3](EU²) Y:
(11:46:09 12/29/15)
(10:59:58 01/12/16)
(12:05:30 01/12/16)
(13:13:00 01/12/16)
(12:00:38 01/13/16)
2.2 Hz 34.3 m(m/s²)²
2.1 Hz 50.6 m(m/s²)²
1.8 Hz 117.3 m(m/s²)²
1.7 Hz 351 m(m/s²)²
1.7 Hz 146.3 m(m/s²)²
500 mHz 7 Hz 588 m(m/s²)²
500 mHz 7 Hz 524 m(m/s²)²
500 mHz 7 Hz 750 m(m/s²)²
500 mHz 7 Hz 1.519 (m/s²)²
500 mHz 7 Hz 945 m(m/s²)²
100 mHz
556 u(m/s²)²
636 u(m/s²)²
571 u(m/s²)²
618 u(m/s²)²
566 u(m/s²)²
-68.7 °
259.6 °
281.2 °
245.1 °
300 °
200 m 300 m 500 m 700 m 1 2 3 4 5 7 10 20 30 40
Frequency (Hz)
(Accele
rati
on
)² (
(m/s²)²
)
1 m
10 m
100 m
1
1L 1R23456
200 m 300 m 500 m 700 m 1 2 3 4 5 7 10 20 30 40
Frequency (Hz)
Ph
ase (
°)
-600
-400
-200
0
200
400
600
Display
Mode: Magnitude/Phase
Traces:
allOK: FFT1: AvXSpc [9]-S001D009 [6]-S001D006(EU²)
1dead: FFT1: AvXSpc [9]-S001D009 [6]-S001D006(EU²)
2tyl: FFT1: AvXSpc [9]-S001D009 [6]-S001D006(EU²)
allDead: FFT1: AvXSpc [9]-S001D009 [6]-S001D006(EU²)
2przekatna: FFT1: AvXSpc [9]-S001D009 [6]-S001D006(EU²)
Max marker
Id Trace X Y
2AvXSpc [9/6](EU²)
3 AvXSpc [9/6](EU²)
4 AvXSpc [9/6](EU²)
5 AvXSpc [9/6](EU²)
6 AvXSpc [9/6](EU²)
Power band marker
Id Trace From To Power
1AvXSpc [9/6] (EU²)
1 AvXSpc [9/6] (EU²)
1 AvXSpc [9/6] (EU²)
1 AvXSpc [9/6] (EU²)
1 AvXSpc [9/6] (EU²)
Cursor
X:
AvXSpc [9/6](EU²) Y:
AvXSpc [9/6](EU²) Y:
AvXSpc [9/6](EU²) Y:
AvXSpc [9/6](EU²) Y:
AvXSpc [9/6](EU²) Y:
AvXSpc [9/6](EU²) Y:
AvXSpc [9/6](EU²) Y:
AvXSpc [9/6](EU²) Y:
AvXSpc [9/6](EU²) Y:
AvXSpc [9/6](EU²) Y:
(11:46:09 12/29/15)
(10:59:58 01/12/16)
(12:05:30 01/12/16)
(13:13:00 01/12/16)
(12:00:38 01/13/16)
2 Hz 33.9 m(m/s²)²
2.1 Hz 28.5 m(m/s²)²
1.8 Hz 133.1 m(m/s²)²
1.7 Hz 312 m(m/s²)²
1.7 Hz 50 m(m/s²)²
500 mHz 7 Hz599 m(m/s²)²
500 mHz 7 Hz516 m(m/s²)²
500 mHz 7 Hz748 m(m/s²)²
500 mHz 7 Hz 1.44 (m/s²)²
500 mHz 7 Hz577 m(m/s²)²
100 mHz
154.6 u(m/s²)²
248 u(m/s²)²
103 u(m/s²)²
165.2 u(m/s²)²
387 u(m/s²)²
-26.4 °
242.7 °
-36.6 °
-34.9 °
211.6 °
Display
Mode: Magnitude/Phase
Traces:
allOK: FFT1: AvXSpc [9]-S001D009 [6]-S001D006(EU²)
1dead: FFT1: AvXSpc [9]-S001D009 [6]-S001D006(EU²)
2tyl: FFT1: AvXSpc [9]-S001D009 [6]-S001D006(EU²)
allDead: FFT1: AvXSpc [9]-S001D009 [6]-S001D006(EU²)
2przekatna: FFT1: AvXSpc [9]-S001D009 [6]-S001D006(EU²)
Max marker
Id Trace X Y
2 AvXSpc [9/6](EU²)
3 AvXSpc [9/6](EU²)
4 AvXSpc [9/6](EU²)
5 AvXSpc [9/6](EU²)
6 AvXSpc [9/6](EU²)
Power band marker
Id Trace From To Power
1 AvXSpc [9/6] (EU²)
1 AvXSpc [9/6] (EU²)
1 AvXSpc [9/6] (EU²)
1 AvXSpc [9/6] (EU²)
1 AvXSpc [9/6] (EU²)
Cursor
X:
AvXSpc [9/6](EU²) Y:
AvXSpc [9/6](EU²) Y:
AvXSpc [9/6](EU²) Y:
AvXSpc [9/6](EU²) Y:
AvXSpc [9/6](EU²) Y:
AvXSpc [9/6](EU²) Y:
AvXSpc [9/6](EU²) Y:
AvXSpc [9/6](EU²) Y:
AvXSpc [9/6](EU²) Y:
AvXSpc [9/6](EU²) Y:
(11:46:09 12/29/15)
(10:59:58 01/12/16)
(12:05:30 01/12/16)
(13:13:00 01/12/16)
(12:00:38 01/13/16)
2 Hz 33.9 m(m/s²)²
2.1 Hz 28.5 m(m/s²)²
1.8 Hz 133.1 m(m/s²)²
1.7 Hz 312 m(m/s²)²
1.7 Hz 50 m(m/s²)²
500 mHz 7 Hz 599 m(m/s²)²
500 mHz 7 Hz 516 m(m/s²)²
500 mHz 7 Hz 748 m(m/s²)²
500 mHz 7 Hz 1.44 (m/s²)²
500 mHz 7 Hz 577 m(m/s²)²
100 mHz
154.6 u(m/s²)²
248 u(m/s²)²
103 u(m/s²)²
165.2 u(m/s²)²
387 u(m/s²)²
-26.4 °
242.7 °
-36.6 °
-34.9 °
211.6 °
Fig. 6 Cross spectra magnitude (upper graph) and phase (lower graph)
Table 3. FFT amplitude divided by band power for direction Z
Condition
P1 P2 P3 P4 P5
max
value /
band
power
Increase
of max
value /
band
power
[%]
max
value /
band
power
Increase
of max
value /
band
power
[%]
max
value /
band
power
Increase
of max
value /
band
power
[%]
max
value /
band
power
Increase
of max
value /
band
power
[%]
max
value /
band
power
Increase
of max
value /
band
power
[%]
All dampers good 0.214 - 0.220 - 0.216 - 0.234 - 0.244 -
One rear broken 0.238 11.3 0.214 -2.8 0.240 11.0 0.323 37.9 0.251 3.1
Two rear broken 0.195 -8.9 0.237 7.6 0.492 127.2 0.490 109.3 0.208 -14.6
One front and one
rear broken 0.356 66.1 0.278 26.2 0.314 45.0 0.375 60.2 0.367 50.4
All broken 0.596 178.5 0.596 170.7 0.578 167.2 0.594 153.9 0.650 166.6
Table 4. Cross spectra magnitude values
DIAGNOSTYKA, Vol. 18, No. 1 (2017)
BIAŁKOWSKI, KRĘŻEL: Diagnostic of shock absorbers during road test with the use of vibration FFT and …
85
Cross
spectrum Condition
Freq max
value increase of
max value
band power max value /
band power
increase of
max value /
band power Hz (m/s²)² (m/s²)²
1 X 2
All dampers good 2.0 0.0335 - 0.4720 0.071 -
One rear broken 2.1 0.0327 -2.388% 0.3810 0.086 20.926%
Two rear broken 1.9 0.0446 33.134% 0.4040 0.110 55.543%
One front and one rear broken 1.4 0.0851 154.030% 0.6180 0.138 94.016%
All broken 1.4 0.6040 1702.985% 1.4850 0.407 473.070%
3 X 4
All dampers good 2.2 0.0505 - 0.6850 0.074 -
One rear broken 1.8 0.0763 51.089% 0.6920 0.110 49.561%
Two rear broken 1.7 0.5120 913.861% 1.8580 0.276 273.786%
One front and one rear broken 1.7 0.1453 187.723% 0.9330 0.156 111.243%
All broken 1.7 1.0600 1999.010% 2.8300 0.375 408.064%
1 X 4
All dampers good 2.2 0.0343 - 0.5880 0.058 -
One rear broken 2.1 0.0506 47.522% 0.5240 0.097 65.540%
Two rear broken 1.8 0.1173 241.983% 0.7500 0.156 168.114%
One front and one rear broken 1.7 0.1463 326.531% 0.9450 0.155 165.397%
All broken 1.7 0.3510 923.324% 1.5190 0.231 296.125%
2 X 3
All dampers good 2.0 0.0339 - 0.5990 0.057 -
One rear broken 2.1 0.0285 -15.929% 0.5160 0.055 -2.406%
Two rear broken 1.8 0.1331 292.625% 0.7480 0.178 214.415%
One front and one rear broken 1.7 0.0500 47.493% 0.5770 0.087 53.116%
All broken 1.7 0.3120 820.354% 1.4400 0.217 282.842%
4. UNCERTAINTY AND REPEATABILITY
Because research was done on one test track
with one road profile the excitation of the system
was strongly narrowed. On different road profiles
such as gravel or on highway with higher speeds
conditions would be much different. The research
on different surfaces and different speeds are
planned with the next research stage. The results of
those measurements will allow wider uncertainty
and repeatability analysis according to variable
factors such as: surface, velocity, driving character
and vehicle load.
For those measurements an estimated extended
uncertainty (95% confidence level with coverage
factor of 2) according to measurement system is
0,74 m/s2 (25% of values measured). In this
uncertainty estimation was taken into consideration
spread of the results for the track that measurements
was done on.
5. CONCLUSIONS
Vibration measurements on a car body can help
in the detection of failure of one or more dampers.
With the measurement of the response only
(without the excitation force), it is possible to find
not only the fact that there is a problem with a
shock absorber, but even which particular shock
absorber is faulty. Other problems such as the
breaking of a swingarm, spring or other
subassembly of the suspension should also be
detectable via this method.
The proposed method depends on many variable
parameters such as: tire stiffness (winter/summer),
the damping of tires material, suspension rubber
elements stiffness, total load applied to the vehicle,
etc. Additionally there is an influence of factors
related to the absorbers directly: pressure in gas
shock absorbers, oil condition related to the
temperature and wear. Those factors influence
significantly precision of the test method.
Cross-spectrum analysis gave better results than
the simple FFT vibration analysis, but both are
sensitive to changes in driving conditions. The
maximum cross spectrum divided by band power in
the range of 0.5 – 7 Hz improved results for one
DIAGNOSTYKA, Vol. 18, No. 1 (2017)
BIAŁKOWSKI, KRĘŻEL: Diagnostic of shock absorbers during road test with the use of vibration FFT and …
86
damper damaged (which was the most difficult
condition to detect).
The reference suspension is not needed for
evaluation of progressive dampers degradation. The
long time averaged vibration spectrums of vehicle
with undamaged shock absorbers are taken as the
reference.
REFERENCES
1 Sikorski J. Amortyzatory pojazdów
samochodowych, Budowa, Naprawa, Badania.
Wydawnictwa Komunikacji i Łączności
Warszawa 1984.
2 Randall RB, Tech BA. Application of B&K
Equipment to Freqency Analysis, September
1977.
3 Reference Manual Vol. 1-5 NVGate for v7.00 and
later.
4 Structural Solutions OROS Modal 2 User’s
Manual.
5 Gardulski J, Warczek J. Moc tłumienia jako
parametr diagnostyczny amortyzatorów
samochodowych. Diagnostyka, 2003; 29: 69-72.
6 Gardulski J, Burdzik R. Metodyka wyznaczania
diagnostycznych miar stanu technicznego
amortyzatorów samochodowych, Diagnostyka,
2006; 40:127-131.
7 Cempiel D. Automatic classifier of the kind of car
shock absorber damage, Combustion Engines.
2013; 154(3):1067-1075.
8 Pikosz H, Ślaski G. Charakterystyki elementów
sprężystych i tłumiących zawieszenia
samochodu osobowego oraz zastępcze
charakterystyki ich modeli, LOGITRANS – VII
Konferencja Naukowo-Techniczna, Logistyka,
Systemy transportowe Bezpieczeństwo w
transporcie.
9 Muhammad Zahir Hassan: Experimental modal
analysis of brake squeal noise, Kolej Universiti
Teknikal Kebangsaan Malaysia, Faculty of
Mechanical Engineering, Karung Berkunci
I200, Ayer Keroh, Melaka, Malaysia.
10 Magda P, Uhl T. Maintenance On Demand For
Vehicle Suspension System. Diagnostyka, 2013;
14(1):57-64, 2013.
11 Burdzik R. Monitoring system of vibration
propagation in vehicles and method of analysing
vibration modes. TST 2012, CCIS 329,
2012:406–413.
12 Kupiec J, Ślaski G. Wpływ siły tłumienia
amortyzatora na obciążenia dynamiczne kół i
wyniki badań kontrolnych zawieszenia
metodami drgań wymuszonych, Transcomp –
International Conference, Computer Systems
Aided Science, Industry and Transport 2009.
13 Burdzik R, Dolček R. Research of vibration
distribution in vehicle constructive. Perner’s
Contacts, Number 4, Volume VII, December,
pp. 16-25, 2012
Received 2016-05-23 Accepted 2016-11-21
Available online 2017-03-23
Piotr BIAŁKOWSKI,
M.Sc. Eng. works in the
Noise and Vibration
Laboratory at the BOSMAL
Automotive Research and
Development Institute Ltd.
His scientific interests
include modal analysis and
vibroacoustic diagnostic.
His research work is mainly
practical with the use of FFT,
FRF, order analysis, etc.
Bogusław KRĘŻEL, Eng.
works in the Noise and
Vibration Laboratory at the
BOSMAL Automotive
Research and Development
Institute Ltd.
His scientific interests
include acoustic analysis and
vibroacoustic diagnostic.
His research work is mainly
practical with the use of
different measurement
systems.