Embed Size (px)
Citation preview

Diagnostic techniques for cultural heritage: applications of Synchrotron FourierTransform
Infrared (FT-IR) spectroscopy
Mariangela Cestelli Guidi Sinbad IR beamline @ DaFne
INFN-International Masterclass 2015

The scientific approach to conservation
Principles of FT-IR spectroscopy
Sampling techniques: transmission, reflection, Attenuated total reflection (ATR) and Diffuse reflection (DRIFT)
Infrared imaging and microscopy: chemical images
FT-IR Analysis of a painting cross section
Layout


FOURIER TRANSFORM INFRARED SPECTROSCOPY (FT-IR):
physical principles

Electromagnetic spectrum and IR

Tecniche invasive e distruttive
The EM field

Visible and IR light are both EM radiation, differing only for the wavelegth. They both propagate in vacuum at the light speed c.
Wavelength l (mm)
Frequency n (Hz: n=c/l)
Energy E (eV: E=hn)
Wavenumber 𝜈 (cm-1)
𝝂 (cm-1)= 1/l (cm)
IR Units

What happens when «light» interacts with matter
E total = E translational + E rotational + E vibrational

In the simple case of two point charges, one with charge +q and the other one with charge −q, the electric dipole moment p is:
d is the displacement vector pointing from the negative charge to the positive charge. Thus, the electric dipole moment vector p points from the negative charge to the positive charge.
Every molecule interacts with the IR EM field?
Electric field of an electric dipole. The dipole consists of two point electric charges of opposite polarity located close together

Polar molecules
A molecule of water is polar because of the
unequal sharing of its electrons in a "bent"
structure. A separation of charge is present
with negative charge in the middle (red
shade), and positive charge at the ends
(blue shade).
Examples of polar molecules of materials that are gases under standard conditions are: Ammonia (NH3) Sulfur Dioxide (SO2) Hydrogen Sulfide (H2S).

Common examples of non-polar gases are the noble or inert gases, including: Helium (He) Neon (Ne) Krypton (Kr) Xenon (Xe) Other non-polar gases include: Hydrogen (H2) Nitrogen (N2) Oxygen (O2) Carbon Dioxide (CO2) Methane (CH4) Ethylene (C2H4)
Non polar molecules

O2, H2, Cl2, N2 are not IR active!
IR active modes

M1 M2
𝜈 =𝑘
𝑚 vibration frequency
𝑚 =𝑀1∙𝑀2
𝑀1+𝑀2 (reduced mass)
Increasing k (bond strength) the frequency increases Decreasing m, the frequency increases.

Single bonds: C-C, C-O, C-N 800 - 1300 cm-1
Double bonds: C=C, C=O, C=N 1700-1900 cm-1
Triple bonds: C≡C, C ≡O, C ≡N 2000-2300 cm-1
C-H, N-H, O-H 2700-3800 cm-1

𝐸 = (𝑛 +1
2) hn
(quantized energy levels)
3N-6 (non linear molecule) 3N -5 (linear molecule)
Normal modes of vibration

Every molecule has its unique IR spectrum

Also very complex molecules...

Fourier Transform Infrared Spectroscopy (FT-IR)
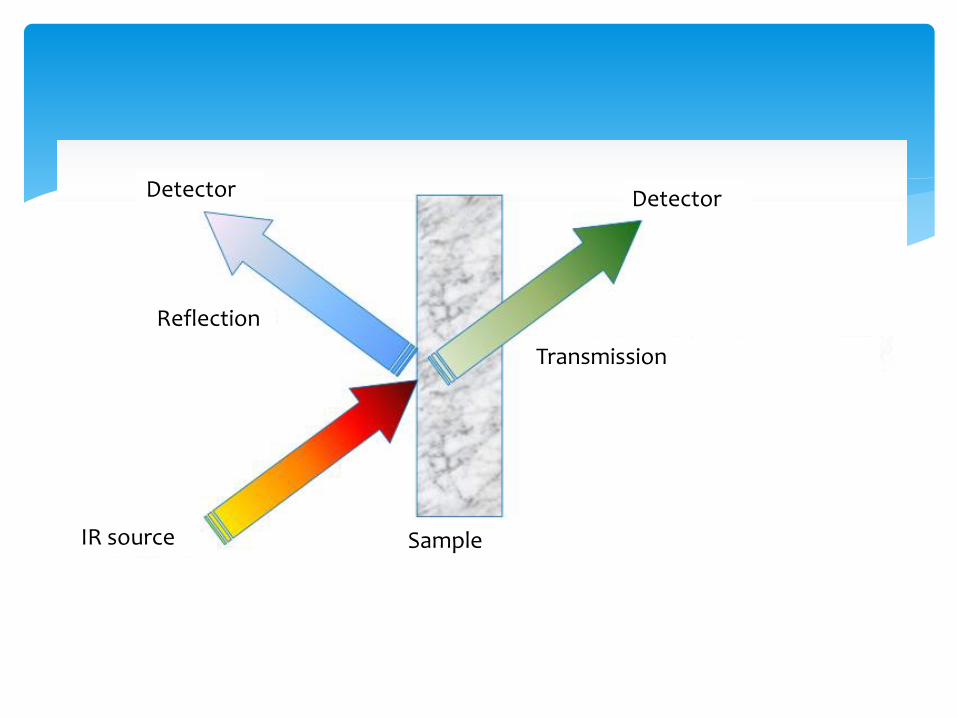
Detector Detector
Reflection
Transmission
IR source Sample

IR sources

Synchrotron radiation
LNF, February 16 2015

Every moving electric charge emits EM radiation.
Classic (v<<c) Relativistic (v≈c)
1/𝛾
𝛾 =1
1 − 𝛽2
𝛽 = 𝑣/𝑐
Per b=0.99 1/g= 10 mrad
Critical energy


The beamlines

The IR SINBAD beamline Infrared domain
from 10 to 103 cm-1
1.24meV to 1.24 eV
DAFNE

Michelson interferometer

Mobile mirror M1
Fixed mirror M1
IR source
Detector
beamsplitter

The interferogram depends on the optical path difference (OPD) between the two beams
The OPD is twice the mirror excursion x. Since the mirror speed v is constant:

OPD= 2n 𝜆
2 (𝑛 = 0, ±1, ±2,… )
OPD= (2n+1) 𝜆
2 (𝑛 = 0,±1,±2,… )

Origin of the interferogram: the momocromatic wave Detector signal
OPD
The Fourier transform
Spectrum
Frequency
FOURIER TRANSFORM

Origin of the interferogram: the policromatic wave (disccrete frequencies)
Detector signal
Spectrum

Origin of the interferogram: the policromatic wave (continuous frequencies)
Detector signal


Measuring an IR spectrum
TRANSMITTANCE

ABSORBANCE


Sampling techniques

Depending on the sample form (solid, liquid, powder, film) and which characteristics you want to mantain, it is possible to use different sampling techniques, distructive or non distructive:
Transmission (liquids, powders, thin sections)
Specular reflection (crystals, polished sections)
Diffuse reflectance (powders)
Attenuated Total Reflection (ATR) (thick samples, non reflecting surfaces)

Transmission KBr powder pellets
• Invasive • Destructive • Time consuming • Very precise (absolute measurement) • Spectral database

Sample

Beer-Lambert law A = log I0/I= e C b
Absorbance is proportional to the concentration

Reflection spectroscopy
Preparation of the surface – polishing Thick samples

Attenuated Total Reflection (ATR)

Crystal n1
Sample n2
Snell’s law: n1 x sini = n2 x sinr
Critical angle: r = 90°
sinc = n2 / n1
(es. 38° for ZnSe for a sample with n=1.5)
Principles of Attenuated Total Reflection spectroscopy (ATR)


Penetration depth

dP prop l
ATR = AB * n [cm-1] / 1000 [cm-1]

Quick
Non invasive
(semi)destructive
Kazarian et al, Vibrational Spectroscopy 53 (2010) 274–278

CaSO4·2H2O
CaSO4.0.5H2O
CaSO4
ATR spectrum of gypsum
n3 Stretching antisymmetric of SO4 tetrahedra n1 Stretching symmetric of SO4 tetrahedra
Water molecule: Stretching symmetric and antisymmetric of H2O

CaSO4·2H2O
CaCO3

What if the sample is VERY small?


Microscopy and Imaging

The microscope is essentially a beam condenser
The IR microscope is essentially a beam condenser

FTIR imaging
Vincent Mazel et al, (2007). Analytical Chemistry. DOI : 10.1021/ac070993k

Mapping vs imaging


APPLICATION TO THE STUDY OF PAINTING CROSS SECTIONS

Figura 1. Sezione stratigrafica di un frammento prelevato dalla veste verde di un dipinto raffigurante la Madonna col Bambino: a) sezione stratigrafia al microscopio ottico in luce visibile; b) immagine ottenuta al microscopio elettronico (SEM); c) mappatura dell’elemento rame (Cu) eseguita mediante spettrometro a raggi X al microscopio elettronico (SEM-EDS); d) distribuzione della resina poliestere ottenuta mediante FTIR FPA-imaging; e) distribuzione del pigmento verde malachite, ottenuta mediante FTIR FPA-imaging; f) distribuzione di legante proteico, ottenuta mediante FTIR FPA-imaging; g) distribuzione di olio siccativo ottenuta mediante FTIR FPA-imaging; h) spettro di assorbenza della particella verde e del riferimento della malachite; i) spettro della componente proteica e del riferimento del rosso d’uovo; j) spettro ottenuto da una zona contenente olio siccativo e lo spettro di riferimento di una “sapone” formatosi per reazione tra rame e olio siccativo – immagine tratta dal testo citato – nota 3

LED lights may be bad for Van Gogh Paintings
http://www.vangogh.ua.ac.be/
The darkening of chrome yellow is a phenomenon widely observed on several paintings by Vincent van Gogh such as the famous versions of the Sunflowers. Analysis of artificially aged model samples of lead chromate using the combined use of various synchrotron radiation based analytical techniques (μ-XRD, μ-XANES and µ-FTIR), established that darkening of chrome yellow is caused by reduction of PbCrO4 to Cr2O3.2H2O (viridian green). This is likely accompanied by the presence of another Cr(III) compound, such as either Cr2(SO4)3.H2O or (CH3CO2)7Cr3(OH)2 [chromium(III) acetate hydroxide].

Image courtesy of http://www.vangogh.ua.ac.be/
Phosphor-based white LED light
To avoid photo induced darkening of the susceptible variants of the lead chromate-based pigments, it is advisable to minimize their exposure to light with wavelengths shorter than about 525 nm
PbCr1−xSxO4 PbCrO4

What is the alteration
mechanism of the chrome
yellow pigments?
Micro-X-ray Fluorescence
Micro-X-ray Diffraction
Micro-Fourier Transform
Infrared Spectroscopy
Micro-X-ray Absorption Near-Edge
Combined use of Synchrotron Radiation Based Techniques for Revealing an Alternative Degradation Pathway of the
Pigment Cadmium Yellow in a Painting by Van Gogh

Fourier Transform Infrared Spectroscopy (FT-IR) @ LNF
Sulphate [SO 4 2- ] content
monoclinic orthorombic

Septimius Severus’s Arch degradation products
200x600 mm

MICRO FT-IR chemical imaging
FPA detector
Ossalato
20 mm

Multivariate analysis combined with FT-IR
Cluster Analysis Principal Component Analysis
RGB map of the sample composition

Alcuni spettri di riferimento Courtesy of Centro Conservazione e Restauro
La Venaria Reale

Il carbonile
Solventi Leganti Vernici Fibre Ma anche in alcuni pigmenti inorganici

Gli esteri
Olii siccativi Resine naturali Cere Resine sintetiche Additivi Plastiche


Le ammidi
Struttura generale di un'ammide. Se R' e R" sono idrogeni l'ammide si dice primaria, se solo uno fra R' ed R" è un H, si dice secondaria, se R' ed R" non sono idrogeni, l'ammide si dice terziaria
Tempere all’uovo Tempera grassa Lana e seta Colle animali Cuoio e pelle Caseina Plastica


I polisaccaridi

Carbonati
Silicati
Solfati
Pigmenti organici
I pigmenti

Solfati
Ossalati
Nitrati
Saponi
Prodotti di degrado comuni

https://web2.infn.it/Dafne_Light/ [email protected]


![심실세동파형의Hilbert-Huang 변환을기반으로한제세동성 ......며푸리에변환(FourierTransform)방법을이용하여심실세동신호에서의주파수 성분변화의특성을분석하였다[8]-[12]](https://img.pdfslide.net/doc/110x75/6066032b7e5d70019917e6d5/eoeoehilbert-huang-eeeoeeoeoeoee-.jpg)