Embed Size (px)
Citation preview

ANNUAL REPORT
DIAMOND OFFSHORE DRILLING, INC.

L Ocean Onyx 6,000 Ft. 15K; 4M GOM
Ocean Apex 6,000 Ft. 15K; 4M Singapore
È Ocean Clipper 7,875 Ft. DP; 15K Brazil
È Ocean BlackHawk 12,000 Ft. DP; 7R; 15K; 5M South Korea
Ocean BlackHornet 12,000 Ft. DP; 7R; 15K; 5M South Korea
Ocean BlackLion 12,000 Ft. DP; 7R; 15K; 5M South Korea
Ocean BlackRhino 12,000 Ft. DP; 7R; 15K; 5M South Korea
Key
Ì DP Dynamically Positioned
Ì IC Independent-Leg Cantilevered Rig
Ì GOM U.S. Gulf of Mexico
Ì 6R Six Ram Blowout Preventer
Ì 7R Seven Ram Blowout Preventer
Ì 4M Four Mud Pumps
Ì 5M Five Mud Pumps
Ì 15K 15,000 PSI Well Control System
Our Fleet (as of January 27, 2014)
Drillships
Semisubmersible Rigs
Ultra-deepwater Rigs (7,500+ Ft.)
Deepwater Rigs (5,000 – 7,500 Ft.)
Mid-water Rigs (400 – 5,000 Ft.)
L Ocean Baroness 8,000 Ft. 15K; 4M Brazil
L Ocean Worker 4,000 Ft. Brazil
L Ocean Ambassador 1,100 Ft. GOM
L Ocean Victory 5,5 00 Ft. 15K GOM
L Ocean Lexington 2,200 Ft. Trinidad and Tobago
L Ocean Rover 8,000 Ft. 15K; 4M Malaysia
L Ocean Winner 4,000 Ft. Brazil
L Ocean Nomad 1,200 Ft. UK
L Ocean Saratoga 2,200 Ft. GOM
L Ocean Concord 2,300 Ft. Brazil
L Ocean Yorktown 2,850 Ft. Mexico
L Ocean General 3,000 Ft. Vietnam
L Ocean Epoch 3,000 Ft. Malaysia (Cold stacked)
L Ocean Patriot 3,000 Ft. 15K Singapore
L Ocean Yatzy 3,300 Ft. DP Brazil
L Ocean Courage 10,000 Ft. DP; 6R; 15K; 4M Brazil
L Ocean Quest 4,000 Ft. 15K Labuan
L Ocean Princess 1,500 Ft. 15K UK
L Ocean Vanguard 1,500 Ft. 15K Norway
L Ocean Guardian 1,500 Ft. 15K UK
L Ocean New Era 1,500 Ft. GOM (Cold stacked)
L Ocean Whittington 1,650 Ft. GOM(Cold stacked)
L Ocean Valor 10,000 Ft. DP; 6R; 15K; 4M Brazil
Ocean GreatWhite 10,000 Ft. DP; 6R; 15K; 5M South Korea
L Ocean Alliance 5,250 Ft. DP; 15K Brazil
L Ocean Confidence 10,000 Ft. DP; 6R; 15K; 4M Cameroon
L Ocean Valiant 5,500 Ft.15K Canary Islands
L Ocean Endeavor 10,000 Ft. 15K; 4M Italy
L Ocean America 5,500 Ft. 15K Australia
L Ocean Monarch 10,000 Ft. 15K; 4M Indonesia
L Ocean Star 5,500 Ft. 15K Brazil
Under Construction
Under Construction
Under Construction
¬ Ocean King 300 Ft. IC GOM
¬ Ocean Spartan 300 Ft. IC GOM (Cold stacked)
¬ Ocean Titan 350 Ft. IC; 15K Mexico
¬ Ocean Scepter 350 Ft. IC; 15K Mexico
¬ Ocean Nugget 300 Ft. IC Mexico
¬ Ocean Spur 300 Ft. IC Ecuador
¬ Ocean Summit 300 Ft. IC Mexico
Jack-up Rigs
RATED WATER DEPTH
For semisubmersible rigs and drillships, the indicated depth reflects the operating water depth capacity for each drilling unit. In many cases, individual rigs are capable of achieving, or have achieved, greater water depths. In all cases, floating rigs are capable of working successfully at greater depths than their rated water depth. On a case-by-case basis, a greater depth capacity may be achieved by providing additional equipment.
Jack-up Rigs Semisubmersible Rigs Drillships
Mid-water Rigs (400 – 5,000 Ft.)
Deepwater Rigs (5,000 – 7,500 Ft.)
Ultra-deepwater Rigs (7,500+ Ft.)
Ocean
Su
mm
it
Ocean
On
yx
Ocean
Ap
ex
Ocean
Sp
artan
Ocean
Sp
ur
Ocean
Nu
gget
Ocean
Mo
narch
Ocean
Kin
g
Ocean
Co
urage
Ocean
Titan
Ocean
Clip
per
Ocean
Am
bassad
or
Ocean
BlackL
ion
Ocean
Prin
cess
Ocean
BlackR
hin
o
Ocean
Gu
ardian
Ocean
BlackH
orn
et
Ocean
Yorktow
n
Ocean
BlackH
awk
Ocean
Rover
Ocean
Co
nfi
den
ce
Ocean
Valo
r
Ocean
GreatW
hite
Ocean
Scep
ter
Ocean
No
mad
Ocean
New
Era
Ocean
Wh
ittingto
n
Ocean
Valian
t
Ocean
Baro
ness
Ocean
Allian
ce
Ocean
En
deavo
r
Ocean
Lexin
gton
Ocean
Victo
ry
Ocean
Ep
och
Ocean
Sarato
ga
Ocean
Am
erica
Ocean
Star
Ocean
Co
nco
rd
Ocean
Gen
eral
Ocean
Win
ner
Ocean
Patrio
t
Ocean
Qu
est
Ocean
Wo
rker
Ocean
Yatzy
Ocean
Van
guard

Contents
Our Fleet / Inside flap Letter to Shareholders / 0 1
Financials / Form 10-K
About the Company
Diamond Offshore is a leader in offshore drilling, providing contract drilling services to the energy industry around the globe with a total fleet of 45 offshore drilling rigs, including five rigs under construction. Diamond Offshore’s fleet consists of 33 semisubmersibles, two of which are under construction, five dynamically positioned drillships, three of which are under construction, and seven jack-ups. Diamond Offshore’s headquarters are in Houston, Texas. Primary regional offices are located in Brazil, Scotland, and Singapore, with local offices in other countries as required to support operations. Approximately 5,500 people work for the Company on board our rigs and in our offices. Diamond Offshore’s common stock is listed on the New York Stock Exchange under the symbol “DO.”
About the Cover
The Ocean Onyx is shown working in the U.S. Gulf of Mexico.
Financial Highlights ( dollars in millions )2013 2012 2011
Revenue . . . . . . . . . . . . . . . . . . . . . . . . . . . . $ 2,920 $ 2,987 $ 3,322Depreciation & Amortization . . . . . . . . . . . . . . . . . . . . 388 393 399Operating Expenses . . . . . . . . . . . . . . . . . . . . . . . . 2,119 2,024 2,067Earnings Before Interest, Taxes, Depreciation & Amortization ( EBITDA ) . . . 1,186 1,354 1,649Net Income . . . . . . . . . . . . . . . . . . . . . . . . . . . 549 720 963Capital Expenditures. . . . . . . . . . . . . . . . . . . . . . . . 958 702 775
Cash and Investments . . . . . . . . . . . . . . . . . . . . . . . $ 2,097 $ 1,486 $ 1,236Drilling & Other Property & Equipment, Net . . . . . . . . . . . . . . 5,467 4,865 4,667Total Assets . . . . . . . . . . . . . . . . . . . . . . . . . . . 8,391 7,235 6,964Long - term Debt . . . . . . . . . . . . . . . . . . . . . . . . . 2,494 1,496 1,496Shareholders’ Equity . . . . . . . . . . . . . . . . . . . . . . . 4,637 4,576 4,333

Diamond Offshore advanced its fleet renewal program in 2013, with two of seven rigs under construction nearly complete at year-end. Our operating results benefited from our ongoing focus on safe operations, cost controls, and management of unplanned downtime. These accom-plishments, however, have been somewhat eclipsed by weakening industry fundamentals.
In early 2014, we took delivery of our first newbuild drill-
ship, the Ocean BlackHawk. The rig is now underway from the shipyard in Korea to the U.S. Gulf of Mexico, where it will begin a five-year job for our customer Anadarko. We expect our second drillship, the Ocean BlackHornet, to be close behind with a scheduled shipyard completion in May 2014, followed by commissioning and mobilization to the U.S. Gulf, also to work under a five-year contract for Anadarko.
The third of four drillships on order, the Ocean BlackRhino, is scheduled for shipyard completion this summer, while our final drillship, the Ocean BlackLion, is on schedule for a shipyard delivery in early 2015. As this letter goes to press, we have not yet signed contracts on the BlackRhino or BlackLion, but we are pursuing a number of potential opportunities around the world.
Additionally, we have taken delivery of the deepwater semisubmersible Ocean Onyx, which is now on location and working in the U.S. Gulf under a one-year contract for Apache. Another deepwater semi under construction, the Ocean Apex, is scheduled to be delivered and working by year-end on a one-well assignment with ExxonMobil in Vietnam. We anticipate a number of opportunities for follow-on term work—no other new capacity targeting the standard deepwater market is currently under construction, and these rigs should be ideally suited to meet demand in this market segment.
GROWING THE FLEET
LETTER TO OUR SHAREHOLDERS
James S. Tisch, Chairman of the Board
DIAMOND OFFSHORE / 2013 ANNUAL REPORT 1

The last of our rigs currently under construction is a harsh environment, ultra-deepwater semisubmersible, the Ocean GreatWhite. The rig is backed by a three-year contract with BP for operation in the Great Australian Bight.
We have enjoyed healthy market conditions across
all water depths for a number of years, during which the industry maintained high rig utilization while increasing the supply of ultra-deepwater units. The past year, however, reminds us that offshore drilling tends to be a cyclical industry, and we are currently seeing indicators of weakening business fundamentals.
Investor sentiment has turned decidedly negative, as reflected in the recent stock price performance of Diamond Offshore and our industry peers. Concern
stems from uncertainty over the future rig supply-demand balance faced by the offshore drillers with the impending delivery of new ultra-deepwater capacity. Market estimates show that 57 rigs are scheduled for delivery in 2014
through 2015, about half of which do not yet have contracts. After what has been a prolonged period of market strength, dayrates have come under some pressure. Additionally, on prospective contracts in the ultra-deepwater market, we are seeing durations reduced to the general range of two to three years, rather than the five-year opportunities that were prevalent in the previous few years.
Although dayrates are down from prior market peaks, our rigs, on the whole, continue to generate healthy cash flow. We anticipate that our current contract backlog, together with dayrates on future contracts, will generate ample returns on our newbuild projects.
POTENTIAL FOR ROUGH SEAS AHEAD
2 DIAMOND OFFSHORE / 2013 ANNUAL REPORT

The Ocean Onyx
DIAMOND OFFSHORE / 2013 ANNUAL REPORT 3

4 DIAMOND OFFSHORE / 2013 ANNUAL REPORT
Our net income for 2013 declined to $549 million
from $720 million in the prior year, primarily due to lower rig fleet utilization including down-time for planned surveys and shipyard projects. Additionally, results reflected the negative impact of customer non-payments in the third and fourth quarters totaling $99 million, after tax, net of a partial recovery in the fourth quarter. Results for 2013 also included a $57 million tax charge for an uncertain tax position related to Egyptian operations. Although somewhat overshadowed by the signifi-cant items mentioned above, results continue to benefit from our efforts to control operating expenses, which came in slightly under our cost guidance for 2013.
The most important metric by which we measure our operational success is safety. For 2013, we
achieved another excellent year of safety performance, with a Total Recordable Incident Rate that was just slightly higher than in 2012, our best year ever, though 2013 was lower in incident severity.
In 2013, our Board of Directors declared regular
and special dividends totaling $3.50 per share. Since Diamond Offshore began paying special dividends in January 2006, we have paid approximately $5.2 billion, more than $38 per share, in regular and special cash dividends to shareholders.
Despite this extraordinary track record of dividend payments, the decline in the share price over the past several months has resulted in a total return to shareholders that significantly underperformed the S&P 500 index. This is extremely disappointing to all of us.
LONG-TERM VALUE CREATION
2013FINANCIALRESULTS
WE ACHIEVED ANOTHER EXCELLENT YEAR OF SAFETY PERFORMANCE, WITH A TOTAL RECORDABLE INCIDENT RATE ON PAR WITH THE RATE IN 2012, OUR BEST YEAR EVER.
DIAMOND OFFSHORE / 2013 ANNUAL REPORT 5

6 DIAMOND OFFSHORE / 2013 ANNUAL REPORT
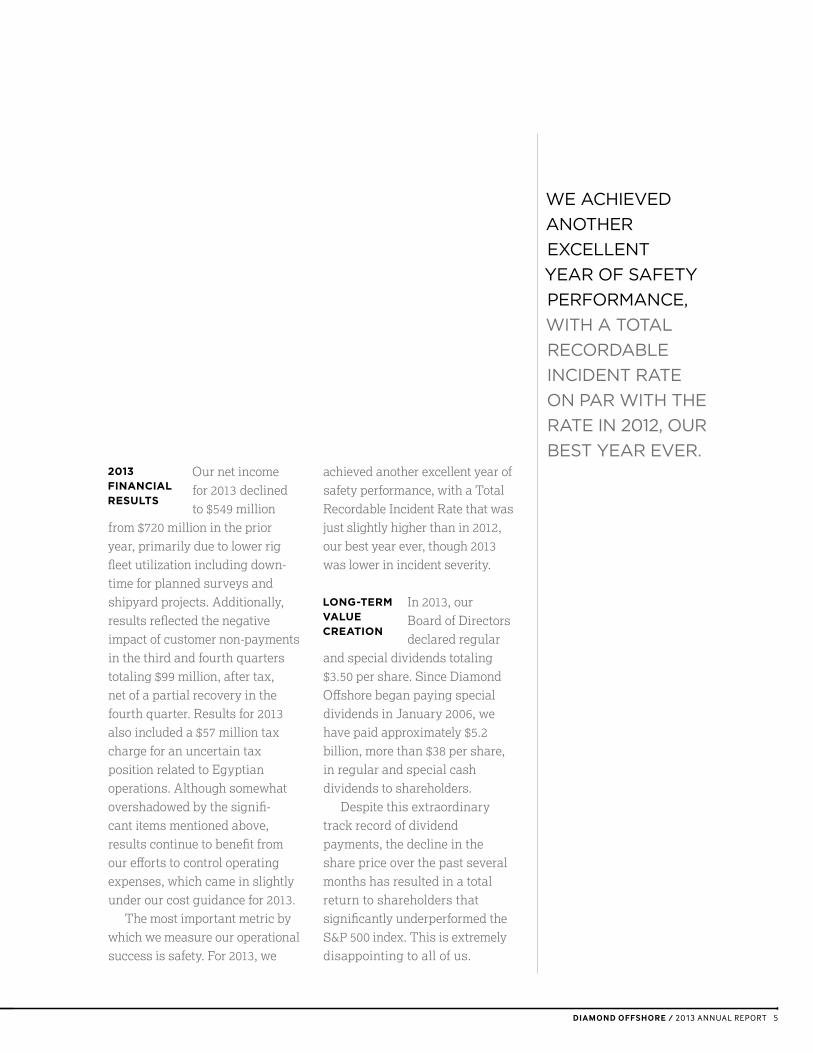
The Ocean Endeavor is shown in the shipyard in Palermo, Italy, undergoing preparation for transport to the Black Sea.
ALTHOUGH WE ARE DOWN FROM PRIOR MARKET PEAKS...WE STILL SEE MARKET RATES IN A RANGE THAT WE ARE COMFORTABLE WILL GENERATE AMPLE RETURNS ON OUR NEWBUILD PROJECTS.
DIAMOND OFFSHORE / 2013 ANNUAL REPORT 7

8 DIAMOND OFFSHORE / 2013 ANNUAL REPORT

Although views regarding the appropriate stock valuation may differ, we feel that our share price as of February 2014 reflects an extreme level of pessimism, given our performance history over the decades, the quality of our fleet, and the price of Brent crude that remains well above $100 per barrel.
We cannot forecast the exact capital expenditure plans of our customers in future years or precisely how the delivery of new rigs will affect dayrates across all water-depth segments. However, we firmly believe that the consensus economic growth fore-cast predicts a world in which there will remain a healthy demand for hydrocarbons. Over the long term, growth of our industry’s ultra-deepwater fleet will be required to find, develop, and produce oil to meet world demand.
Consistent with this view, we have made a significant financial commitment to growing and enhancing our fleet, yet we recognize the importance to shareholders of returning a portion of our cash flow. Our strong and flexible balance sheet, among the least levered of our industry peers, should position us to take advantage of future opportunities. We will continue to exercise strict discipline over controllable costs while making the expenditures required to meet the highly competitive demands of our industry.
Our cash flow and balance sheet give us
the financial wherewithal to make substantial reinvestments in our fleet—if we are comfortable with the anticipated return on capital.
OUR STRONG ANDFLEXIBLE BALANCESHEET, AMONG THE LEAST LEVERED OF OUR INDUSTRY PEERS, SHOULD POSITION US TO TAKE ADVANTAGE OF FUTURE OPPORTUNITIES.
PARTICIPATING IN A CYCLICAL INDUSTRY
DIAMOND OFFSHORE / 2013 ANNUAL REPORT 9

James S. TischChairman of the Board
In considering how to deploy capital, we take a long-term view towards creating future earnings growth. This approach some-times puts us out of step with our industry peers, but we acquire assets or make investments in our fleet only if we believe these will generate ample returns for shareholders.
Over the years, we have employed a strategy of taking advantage of industry cyclicality to make opportune investments at times of distress, or when others are unwilling or unable to acquire assets. We believe this strategy, along with a disciplined approach to making acquisitions, is why, year after year, Diamond Offshore has delivered the industry’s highest return on capital employed.
Since 2009, Diamond Offshore has purchased, built, or ordered seven ultra-deepwater and two deepwater units, totaling more than $5 billion of investment. Our latest projects will continue the process
of renewing the fleet—and we will continue to look for other invest-ments that meet our return criteria. While each transaction is unique, all of these investments share one common attribute: we believe they will generate signifi-cant shareholder value.
Looking ahead, we welcome Marc Edwards, who becomes
Diamond Offshore’s CEO in March. We are fortunate to have a proven energy professional with Marc’s experience and leadership qualities to take the helm. Marc succeeds Larry Dickerson, who retired at the end of February 2014 after more than 30 years with the Company. All of us at Diamond Offshore appreciate Larry’s leader-ship and thank him for his many contributions toward achieving operational excellence and creating value for shareholders over many years.
GRATITUDEFOR THE PAST, EMBRACING THE FUTURE
10 DIAMOND OFFSHORE / 2013 ANNUAL REPORT

DIAMOND OFFSHORE / 2013 ANNUAL REPORT 11
12 DIAMOND OFFSHORE / 2013 ANNUAL REPORT

UNITED STATES SECURITIES AND EXCHANGE COMMISSIONWashington, D.C. 20549
FORM 10-KÈ ANNUAL REPORT PURSUANT TO SECTION 13 OR 15(d)
OF THE SECURITIES EXCHANGE ACT OF 1934For the fiscal year ended December 31, 2013
OR
‘ TRANSITION REPORT PURSUANT TO SECTION 13 OR 15(d)OF THE SECURITIES EXCHANGE ACT OF 1934For the transition period from to
Commission file number 1-13926
DIAMOND OFFSHORE DRILLING, INC.(Exact name of registrant as specified in its charter)
Delaware 76-0321760(State or other jurisdiction of
incorporation or organization)
(I.R.S. Employer
Identification No.)
15415 Katy FreewayHouston, Texas 77094
(Address and zip code of principal executive offices)(281) 492-5300
(Registrant’s telephone number, including area code)Securities registered pursuant to Section 12(b) of the Act:
Title of each class Name of each exchange on which registered
Common Stock, $0.01 par value per share New York Stock Exchange
Securities registered pursuant to Section 12(g) of the Act:None
Indicate by check mark if the registrant is a well-known seasoned issuer, as defined in Rule 405 of the SecuritiesAct. Yes Í No ‘
Indicate by check mark if the registrant is not required to file reports pursuant to Section 13 or Section 15(d) of theAct. Yes ‘ No Í
Indicate by check mark whether the registrant (1) has filed all reports required to be filed by Section 13 or 15(d) of the SecuritiesExchange Act of 1934 during the preceding 12 months (or for such shorter period that the registrant was required to file such reports),and (2) has been subject to such filing requirements for the past 90 days. Yes Í No ‘
Indicate by check mark whether the registrant has submitted electronically and posted on its corporate Web site, if any, everyInteractive Data File required to be submitted and posted pursuant to Rule 405 of Regulation S-T during the preceding 12 months (or forsuch shorter period that the registrant was required to submit and post such files). Yes Í No ‘
Indicate by check mark if disclosure of delinquent filers pursuant to Item 405 of Regulation S-K is not contained herein, and will notbe contained, to the best of registrant’s knowledge, in definitive proxy or information statements incorporated by reference in Part III ofthis Form 10-K or any amendment to this Form 10-K. Í
Indicate by check mark whether the registrant is a large accelerated filer, an accelerated filer, a non-accelerated filer, or a smallerreporting company. See definitions of “large accelerated filer,” “accelerated filer,” and “smaller reporting company” in Rule 12b-2 of theExchange Act. (Check one):Large accelerated filer Í Accelerated filer ‘ Non-accelerated filer ‘ Smaller reporting company ‘
(Do not check if a smaller reporting company)Indicate by check mark whether the registrant is a shell company (as defined in Rule 12b-2 of the Exchange
Act). Yes ‘ No ÍState the aggregate market value of the voting and non-voting common equity held by non-affiliates computed by reference to the
price at which the common equity was last sold as of the last business day of the registrant’s most recently completed second fiscalquarter.
As of June 28, 2013 $4,741,751,658Indicate the number of shares outstanding of each of the registrant’s classes of common stock, as of the latest practicable date.As of February 18, 2014 Common Stock, $0.01 par value per share 139,035,448 shares
DOCUMENTS INCORPORATED BY REFERENCEPortions of the definitive proxy statement relating to the 2014 Annual Meeting of Stockholders of Diamond Offshore Drilling, Inc.,
which will be filed within 120 days of December 31, 2013, are incorporated by reference in Part III of this report.

DIAMOND OFFSHORE DRILLING, INC.FORM 10-K for the Year Ended December 31, 2013
TABLE OF CONTENTS
Page No.
Cover Page . . . . . . . . . . . . . . . . . . . . . . . . . . . . . . . . . . . . . . . . . . . . . . . . . . . . . . . . . . . . . . . . . . . . . . . . . . . . . . . . . . . . . . . . . . . . . . 1
Document Table of Contents . . . . . . . . . . . . . . . . . . . . . . . . . . . . . . . . . . . . . . . . . . . . . . . . . . . . . . . . . . . . . . . . . . . . . . . . . . . . . . 2
Part IItem 1. Business . . . . . . . . . . . . . . . . . . . . . . . . . . . . . . . . . . . . . . . . . . . . . . . . . . . . . . . . . . . . . . . . . . . . . . . . . . . . . . . . . . . . . . . . . . . . . . . . . 1
Item 1A. Risk Factors . . . . . . . . . . . . . . . . . . . . . . . . . . . . . . . . . . . . . . . . . . . . . . . . . . . . . . . . . . . . . . . . . . . . . . . . . . . . . . . . . . . . . . . . . . . . . . 7
Item 1B. Unresolved Staff Comments . . . . . . . . . . . . . . . . . . . . . . . . . . . . . . . . . . . . . . . . . . . . . . . . . . . . . . . . . . . . . . . . . . . . . . . . . . . . . . . 18
Item 2. Properties . . . . . . . . . . . . . . . . . . . . . . . . . . . . . . . . . . . . . . . . . . . . . . . . . . . . . . . . . . . . . . . . . . . . . . . . . . . . . . . . . . . . . . . . . . . . . . . 18
Item 3. Legal Proceedings . . . . . . . . . . . . . . . . . . . . . . . . . . . . . . . . . . . . . . . . . . . . . . . . . . . . . . . . . . . . . . . . . . . . . . . . . . . . . . . . . . . . . . . . 18
Item 4. Mine Safety Disclosures . . . . . . . . . . . . . . . . . . . . . . . . . . . . . . . . . . . . . . . . . . . . . . . . . . . . . . . . . . . . . . . . . . . . . . . . . . . . . . . . . . . 18
Part IIItem 5. Market for the Registrant’s Common Equity, Related Stockholder Matters and Issuer Purchases of Equity
Securities . . . . . . . . . . . . . . . . . . . . . . . . . . . . . . . . . . . . . . . . . . . . . . . . . . . . . . . . . . . . . . . . . . . . . . . . . . . . . . . . . . . . . . . . . . . . . . . . 19
Item 6. Selected Financial Data . . . . . . . . . . . . . . . . . . . . . . . . . . . . . . . . . . . . . . . . . . . . . . . . . . . . . . . . . . . . . . . . . . . . . . . . . . . . . . . . . . . 21
Item 7. Management’s Discussion and Analysis of Financial Condition and Results of Operations . . . . . . . . . . . . . . . . . . . . . . . . 21
Item 7A. Quantitative and Qualitative Disclosures About Market Risk . . . . . . . . . . . . . . . . . . . . . . . . . . . . . . . . . . . . . . . . . . . . . . . . . . . 42
Item 8. Financial Statements and Supplementary Data . . . . . . . . . . . . . . . . . . . . . . . . . . . . . . . . . . . . . . . . . . . . . . . . . . . . . . . . . . . . . . 44
Consolidated Financial Statements . . . . . . . . . . . . . . . . . . . . . . . . . . . . . . . . . . . . . . . . . . . . . . . . . . . . . . . . . . . . . . . . . . . . . . . . . 46
Notes to Consolidated Financial Statements . . . . . . . . . . . . . . . . . . . . . . . . . . . . . . . . . . . . . . . . . . . . . . . . . . . . . . . . . . . . . . . . 51
Item 9. Changes in and Disagreements with Accountants on Accounting and Financial Disclosure . . . . . . . . . . . . . . . . . . . . . . 79
Item 9A. Controls and Procedures . . . . . . . . . . . . . . . . . . . . . . . . . . . . . . . . . . . . . . . . . . . . . . . . . . . . . . . . . . . . . . . . . . . . . . . . . . . . . . . . . . 79
Item 9B. Other Information . . . . . . . . . . . . . . . . . . . . . . . . . . . . . . . . . . . . . . . . . . . . . . . . . . . . . . . . . . . . . . . . . . . . . . . . . . . . . . . . . . . . . . . . 79
Part IIICertain information called for by Part III Items 10, 11, 12, 13 and 14 has been omitted as the Registrant intends to
file with the Securities and Exchange Commission not later than 120 days after the end of its fiscal year a definitive
Proxy Statement pursuant to Regulation 14A.
Part IVItem 15. Exhibits and Financial Statement Schedules . . . . . . . . . . . . . . . . . . . . . . . . . . . . . . . . . . . . . . . . . . . . . . . . . . . . . . . . . . . . . . . . . 80
Signatures . . . . . . . . . . . . . . . . . . . . . . . . . . . . . . . . . . . . . . . . . . . . . . . . . . . . . . . . . . . . . . . . . . . . . . . . . . . . . . . . . . . . . . . . . . . . . . . 81
Exhibit Index . . . . . . . . . . . . . . . . . . . . . . . . . . . . . . . . . . . . . . . . . . . . . . . . . . . . . . . . . . . . . . . . . . . . . . . . . . . . . . . . . . . . . . . . . . . . . 82
1

PART I
Item 1. Business.
General
Diamond Offshore Drilling, Inc. is a leader in offshore drilling, providing contract drilling services to the energy industry around the
globe with a fleet of 45 offshore drilling rigs, including five rigs under construction. Our fleet consists of 33 semisubmersibles, two of
which are under construction, seven jack-ups, one of which is held for sale, and five dynamically positioned drillships, three of which are
under construction. The Ocean BlackHawk, the first of our four new ultra-deepwater drillships, was delivered in late January 2014 and, as
of the date of this report, is en route to the U.S. Gulf of Mexico, or GOM, where it is expected to begin operating under contract in the
second quarter of 2014. The deepwater floater Ocean Onyx was completed in late 2013 and is operating under contract in the GOM. See
“— Fleet Enhancements and Additions” and “— Fleet Status.”
Unless the context otherwise requires, references in this report to “Diamond Offshore,” “we,” “us” or “our” mean Diamond Offshore
Drilling, Inc. and our consolidated subsidiaries. We were incorporated in Delaware in 1989.
Our Fleet
Our diverse fleet enables us to offer a broad range of services worldwide in both the floater market (ultra-deepwater, deepwater and
mid-water) and the non-floater, or jack-up, market.
Floaters. A floater rig is a type of mobile offshore drilling unit that floats and does not rest on the seafloor. This asset class includes
self-propelled drillships and semisubmersible rigs. Semisubmersible rigs consist of an upper working and living deck resting on vertical
columns connected to lower hull members. Such rigs operate in a “semi-submerged” position, remaining afloat, off bottom, in a position
in which the lower hull is approximately 55 feet to 90 feet below the water line and the upper deck protrudes well above the surface.
Semisubmersibles hold position while drilling by use of a series of small propulsion units or thrusters that provide dynamic positioning, or
DP, to keep the rig on location, or with anchors tethered to the sea bed. Although DP semisubmersibles are self-propelled, such rigs may
be moved long distances with the assistance of tug boats. Non-DP, or moored, semisubmersibles require tug boats or the use of a heavy
lift vessel to move between locations.
A drillship is an adaptation of a maritime vessel which is designed and constructed to carry out drilling operations by means of a
substructure with a moon pool centrally located in the hull. Drillships are typically self-propelled and are positioned over a drillsite
through the use of either an anchoring system or a DP system similar to those used on semisubmersible rigs.
Our floater fleet (semisubmersibles and drillships) can be further categorized based on the nominal water depth for each class of rig
as follows:
Category
RatedWater Depth (a)
(in feet) Number of Units in Our Fleet
Ultra-Deepwater . . . . . . . . . . . . . . . . 7,501 to 12,000 13 (b)
Deepwater . . . . . . . . . . . . . . . . . . . . . 5,000 to 7,500 7 (c)
Mid-Water . . . . . . . . . . . . . . . . . . . . . . 400 to 4,999 18
(a) Rated water depth for semisubmersibles and drillships reflects the maximum water depth in which a floating rig has been designed
to operate. However, individual rigs are capable of drilling, or have drilled, in marginally greater water depths depending on various
conditions (such as salinity of the ocean, weather and sea conditions).
(b) Includes three drillships and one harsh environment semisubmersible rig under construction.
(c) Includes the Ocean Apex, currently under construction.
See “— Fleet Enhancements and Additions” for further discussion of our rigs under construction.
Jack-ups. Jack-up rigs are mobile, self-elevating drilling platforms equipped with legs that are lowered to the ocean floor. Our jack-
ups are used for drilling in water depths from 20 feet to 350 feet. The water depth limit in which a particular rig is able to operate is
principally determined by the length of the rig’s legs. The rig hull includes the drilling equipment, jacking system, crew quarters, loading
and unloading facilities, storage areas for bulk and liquid materials, heliport and other related equipment. A jack-up rig is towed to the
drillsite with its hull riding in the sea, as a vessel, with its legs retracted. Once over a drillsite, the legs are lowered until they rest on the
DIAMOND OFFSHORE / 2013 ANNUAL REPORT 1

seabed and jacking continues with the legs penetrating the seabed until they are firm and stable, and resistance is sufficient to elevate
the hull above the surface of the water. After completion of drilling operations, the hull is lowered until it rests in the water and then the
legs are retracted for relocation to another drillsite. All of our jack-up rigs are equipped with a cantilever system that enables the rig to
cantilever or extend its drilling package over the aft end of the rig.
Fleet Enhancements and Additions. Our long-term strategy is to upgrade our fleet to meet customer demand for advanced,
efficient and high-tech rigs by acquiring or building new rigs when possible to do so at attractive prices, and otherwise by enhancing the
capabilities of our existing rigs at a lower cost and reduced construction period than newbuild construction would require. Since 2009,
commencing with the acquisition of two newbuild, ultra-deepwater semisubmersible rigs, the Ocean Courage and Ocean Valor, we have
committed over $5.0 billion towards upgrading our fleet. The Ocean Onyx, one of our two newest deepwater semisubmersible rigs, was
completed in late 2013 and commenced drilling operations under a one-year contract in the GOM in early 2014. The Ocean BlackHawk,
the first of four new ultra-deepwater drillships, is mobilizing to the GOM as of the date of this report and is expected to begin working
under contract in the second quarter of 2014. We also have six other construction/enhancement projects underway.
The following is a summary of our ongoing rig construction/enhancement projects as of the date of this report:
Rig Type
EstimatedCost
(In millions)Expected
Completion
Contract Status
Rig Name Customer Location
Ocean BlackHornet . . . . . . . . . . . . . . . . . . . Ultra-deepwater drillship $635 Q2 2014 Anadarko GOM
Ocean BlackRhino . . . . . . . . . . . . . . . . . . . . Ultra-deepwater drillship $645 Q3 2014 Actively marketing South Korea (1)
Ocean BlackLion . . . . . . . . . . . . . . . . . . . . . Ultra-deepwater drillship $655 Q1 2015 Actively marketing South Korea (1)
Ocean GreatWhite . . . . . . . . . . . . . . . . . . . . Ultra-deepwater semisubmersible $755 Q1 2016 BP Australia
Ocean Apex . . . . . . . . . . . . . . . . . . . . . . . . . . Deepwater semisubmersible $370 Q3 2014 ExxonMobil Vietnam
Ocean Patriot . . . . . . . . . . . . . . . . . . . . . . . . Mid-water semisubmersible (2) $120 Q2 2014 Shell North Sea/U.K.
(1) Rigs are under construction in South Korea. As of the date of this report, it has not yet been determined where these rigs will be
located once shipyard work and commissioning are completed.
(2) Enhancements to the rig are underway which will enable it to work in the North Sea.
We will evaluate further rig acquisition and enhancement opportunities as they arise. However, we can provide no assurance
whether, or to what extent, we will continue to make rig acquisitions or enhancements to our fleet. See “Management’s Discussion and
Analysis of Financial Condition and Results of Operations — Cash Flow and Capital Expenditures” in Item 7 of this report.
See “— Fleet Status” for more detailed information about our drilling fleet.
2 DIAMOND OFFSHORE / 2013 ANNUAL REPORT

Fleet Status
The following table presents additional information regarding our floater fleet at January 27, 2014:
Rig Type and Name
RatedWater Depth
(in feet) AttributesYear Built/
Redelivered(a)Current
Location(b) Customer(c)
ULTRA-DEEPWATER:Semisubmersibles(8):
Ocean GreatWhite . . . . . . . . . . . . . . . . . . . 10,000 DP; 6R; 15K Q1 2016 South Korea Under construction/BP (d)
Ocean Valor . . . . . . . . . . . . . . . . . . . . . . . . . 10,000 DP; 6R; 15K 2009 Brazil Petrobras
Ocean Courage . . . . . . . . . . . . . . . . . . . . . . 10,000 DP; 6R; 15K 2009 Brazil Petrobras
Ocean Confidence . . . . . . . . . . . . . . . . . . . 10,000 DP; 6R; 15K 2001 In transit/Cameroon Murphy West Africa
Ocean Monarch . . . . . . . . . . . . . . . . . . . . . 10,000 15K 2008 Indonesia Actively marketing
Ocean Endeavor . . . . . . . . . . . . . . . . . . . . . 10,000 15K 2007 In transit/Italy Contract preparation/
ExxonMobil
Ocean Rover . . . . . . . . . . . . . . . . . . . . . . . . 8,000 15K 2003 Malaysia Murphy Exploration
Ocean Baroness . . . . . . . . . . . . . . . . . . . . . 8,000 15K 2002 Brazil Petrobras
Drillships(5):Ocean BlackLion . . . . . . . . . . . . . . . . . . . . . 12,000 DP; 7R; 15K Q1 2015 South Korea Under construction
Ocean BlackRhino . . . . . . . . . . . . . . . . . . . 12,000 DP; 7R; 15K Q3 2014 South Korea Under construction
Ocean BlackHornet . . . . . . . . . . . . . . . . . . 12,000 DP; 7R; 15K Q2 2014 South Korea Under construction/
Anadarko (d)
Ocean BlackHawk . . . . . . . . . . . . . . . . . . . 12,000 DP; 7R; 15K 2014 South Korea Commissioning/
Anadarko (d)
Ocean Clipper . . . . . . . . . . . . . . . . . . . . . . . 7,875 DP; 15K 1997 Brazil Petrobras
DEEPWATER:Semisubmersibles(7):
Ocean Apex . . . . . . . . . . . . . . . . . . . . . . . . . 6,000 15K Q3 2014 Singapore Under construction/
ExxonMobil (d)
Ocean Onyx . . . . . . . . . . . . . . . . . . . . . . . . . 6,000 15K 2013 GOM Apache
Ocean Victory . . . . . . . . . . . . . . . . . . . . . . . 5,500 15K 1997 GOM Stone Energy
Ocean America . . . . . . . . . . . . . . . . . . . . . . 5,500 15K 1988 Australia Chevron
Ocean Valiant . . . . . . . . . . . . . . . . . . . . . . . 5,500 15K 1988 Canary Islands Survey/Actively
marketing
Ocean Star . . . . . . . . . . . . . . . . . . . . . . . . . . 5,500 15K 1997 Brazil Queiroz Galvão
Exploration
Ocean Alliance . . . . . . . . . . . . . . . . . . . . . . 5,250 DP; 15K 1988 Brazil Petrobras
MID-WATER:Semisubmersibles(18):
Ocean Winner . . . . . . . . . . . . . . . . . . . . . . . 4,000 1976 Brazil Petrobras
Ocean Worker . . . . . . . . . . . . . . . . . . . . . . . 4,000 1982 Brazil Petrobras
Ocean Quest . . . . . . . . . . . . . . . . . . . . . . . . 4,000 15K 1973 Labuan Actively marketing
Ocean Yatzy . . . . . . . . . . . . . . . . . . . . . . . . . 3,300 DP 1989 Brazil Petrobras
Ocean Patriot . . . . . . . . . . . . . . . . . . . . . . . . 3,000 15K 1983 Singapore Under construction/Shell
Ocean General . . . . . . . . . . . . . . . . . . . . . . 3,000 1976 Vietnam Premier Vietnam
Ocean Yorktown . . . . . . . . . . . . . . . . . . . . . 2,850 1976 Mexico PEMEX
Ocean Concord . . . . . . . . . . . . . . . . . . . . . . 2,300 1975 Brazil Petrobras
Ocean Lexington . . . . . . . . . . . . . . . . . . . . 2,200 1976 Trinidad and Tobago BG International
Ocean Saratoga . . . . . . . . . . . . . . . . . . . . . 2,200 1976 GOM LLOG
Ocean Guardian . . . . . . . . . . . . . . . . . . . . . 1,500 15K 1985 North Sea/U.K. Shell
Ocean Princess . . . . . . . . . . . . . . . . . . . . . . 1,500 15K 1975 North Sea/U.K. EnQuest
Ocean Vanguard . . . . . . . . . . . . . . . . . . . . . 1,500 15K 1982 North Sea/Norway Statoil
Ocean Nomad . . . . . . . . . . . . . . . . . . . . . . . 1,200 1975 North Sea/U.K. Dana Petroleum
Ocean Ambassador . . . . . . . . . . . . . . . . . . 1,100 1975 GOM Contract
preparation/PEMEX
Ocean Epoch . . . . . . . . . . . . . . . . . . . . . . . . 3,000 1977 Malaysia Cold stacked
Ocean Whittington . . . . . . . . . . . . . . . . . . . 1,650 1974 GOM Cold stacked
Ocean New Era . . . . . . . . . . . . . . . . . . . . . . 1,500 1974 GOM Cold stacked
DIAMOND OFFSHORE / 2013 ANNUAL REPORT 3
Attributes
DP = Dynamically Positioned/Self-Propelled 7R = 2 Seven ram blow out preventers
6R = Six ram blow out preventer 15K = 15,000 psi well control system
(a) Represents year rig was (or is expected to be) built and originally placed in service or year rig was (or is expected to be) redelivered with
significant enhancements that enabled the rig to be classified within a different floater category than originally constructed.
(b) GOM means U.S. Gulf of Mexico.
(c) For ease of presentation in this table, customer names have been shortened or abbreviated.
(d) Rig is contracted for future work upon completion of commissioning.
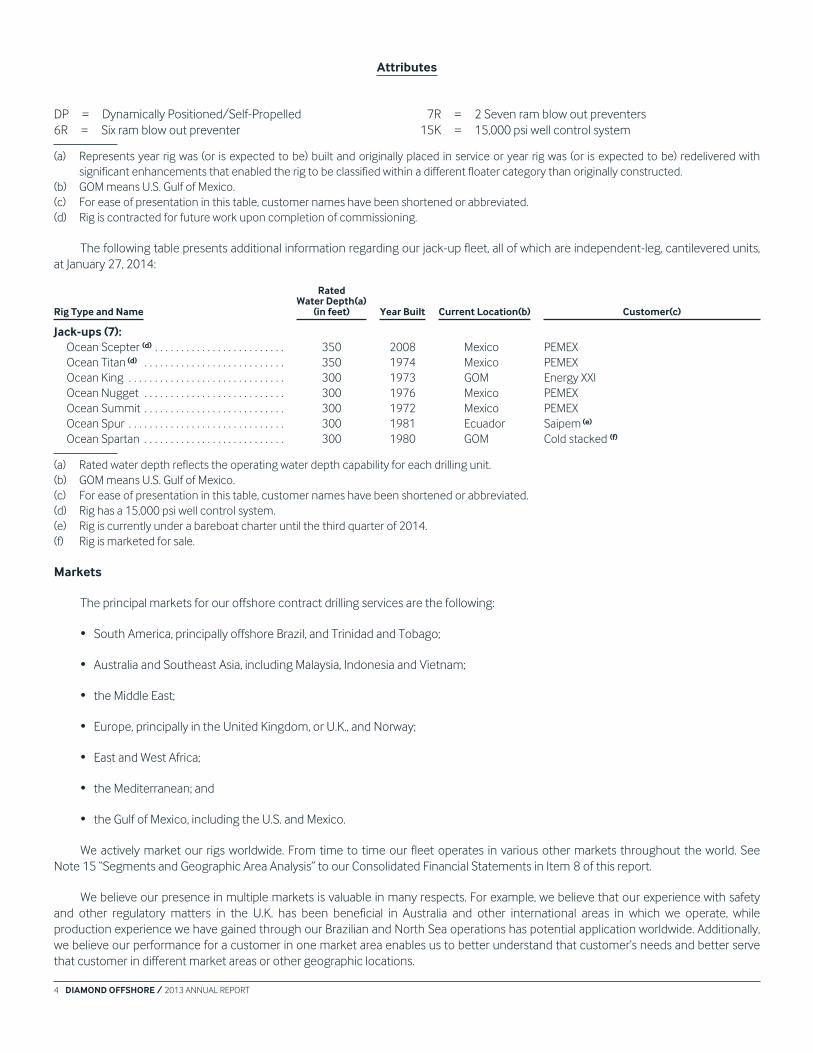
The following table presents additional information regarding our jack-up fleet, all of which are independent-leg, cantilevered units,
at January 27, 2014:
Rig Type and Name
RatedWater Depth(a)
(in feet) Year Built Current Location(b) Customer(c)
Jack-ups (7):Ocean Scepter (d) . . . . . . . . . . . . . . . . . . . . . . . . . 350 2008 Mexico PEMEX
Ocean Titan (d) . . . . . . . . . . . . . . . . . . . . . . . . . . . 350 1974 Mexico PEMEX
Ocean King . . . . . . . . . . . . . . . . . . . . . . . . . . . . . . 300 1973 GOM Energy XXI
Ocean Nugget . . . . . . . . . . . . . . . . . . . . . . . . . . . 300 1976 Mexico PEMEX
Ocean Summit . . . . . . . . . . . . . . . . . . . . . . . . . . . 300 1972 Mexico PEMEX
Ocean Spur . . . . . . . . . . . . . . . . . . . . . . . . . . . . . . 300 1981 Ecuador Saipem (e)
Ocean Spartan . . . . . . . . . . . . . . . . . . . . . . . . . . . 300 1980 GOM Cold stacked (f)
(a) Rated water depth reflects the operating water depth capability for each drilling unit.
(b) GOM means U.S. Gulf of Mexico.
(c) For ease of presentation in this table, customer names have been shortened or abbreviated.
(d) Rig has a 15,000 psi well control system.
(e) Rig is currently under a bareboat charter until the third quarter of 2014.
(f) Rig is marketed for sale.
Markets
The principal markets for our offshore contract drilling services are the following:
• South America, principally offshore Brazil, and Trinidad and Tobago;
• Australia and Southeast Asia, including Malaysia, Indonesia and Vietnam;
• the Middle East;
• Europe, principally in the United Kingdom, or U.K., and Norway;
• East and West Africa;
• the Mediterranean; and
• the Gulf of Mexico, including the U.S. and Mexico.
We actively market our rigs worldwide. From time to time our fleet operates in various other markets throughout the world. See
Note 15 “Segments and Geographic Area Analysis” to our Consolidated Financial Statements in Item 8 of this report.
We believe our presence in multiple markets is valuable in many respects. For example, we believe that our experience with safety
and other regulatory matters in the U.K. has been beneficial in Australia and other international areas in which we operate, while
production experience we have gained through our Brazilian and North Sea operations has potential application worldwide. Additionally,
we believe our performance for a customer in one market area enables us to better understand that customer’s needs and better serve
that customer in different market areas or other geographic locations.
4 DIAMOND OFFSHORE / 2013 ANNUAL REPORT

Offshore Contract Drilling Services
Our contracts to provide offshore drilling services vary in their terms and provisions. We typically obtain our contracts through a
competitive bid process, although it is not unusual for us to be awarded drilling contracts following direct negotiations. Our drilling
contracts generally provide for a basic fixed dayrate regardless of whether or not such drilling results in a productive well. Drilling
contracts may also provide for reductions in rates during periods when the rig is being moved or when drilling operations are interrupted
or restricted by equipment breakdowns, adverse weather conditions or other circumstances. Under dayrate contracts, we generally pay
the operating expenses of the rig, including wages and the cost of incidental supplies. Historically, dayrate contracts have accounted for
the majority of our revenues. In addition, from time to time, our dayrate contracts may also provide for the ability to earn an incentive
bonus from our customer based upon performance.
The duration of a dayrate drilling contract is generally tied to the time required to drill a single well or a group of wells, in what we
refer to as a well-to-well contract, or a fixed period of time, in what we refer to as a term contract. Many drilling contracts may be
terminated by the customer in the event the drilling unit is destroyed or lost, or if drilling operations are suspended for an extended
period of time as a result of a breakdown of equipment or, in some cases, due to events beyond the control of either party to the
contract. Certain of our contracts also permit the customer to terminate the contract early by giving notice; in most circumstances this
requires the payment of an early termination fee by the customer. The contract term in many instances may also be extended by the
customer exercising options for the drilling of additional wells or for an additional length of time, generally at competitive market rates
and mutually agreeable terms at the time of the extension. See “Risk Factors — Our business involves numerous operating hazards
which could expose us to significant losses and significant damage claims. We are not fully insured against all of these risks and our
contractual indemnity provisions may not fully protect us,” “Risk Factors — The terms of our drilling contracts may limit our ability to
attain profitability in a declining market or to benefit from increasing dayrates in an improving market,” “Risk Factors — Our drilling
contracts may be terminated due to events beyond our control,” “Risk Factors — We may enter into drilling contracts that expose us to
greater risks than we normally assume” and “Risk Factors — We have elected to self-insure for physical damage to rigs and equipment
caused by named windstorms in the U.S. Gulf of Mexico” in Item 1A of this report, which are incorporated herein by reference. For a
discussion of our contract backlog, see “Management’s Discussion and Analysis of Financial Condition and Results of Operations —
Market Overview — Contract Drilling Backlog” in Item 7 of this report, which is incorporated herein by reference.
Customers
We provide offshore drilling services to a customer base that includes major and independent oil and gas companies and
government-owned oil companies. During 2013, 2012 and 2011, we performed services for 39, 35 and 52 different customers,
respectively. During 2013, 2012 and 2011, one of our customers in Brazil, Petróleo Brasileiro S.A., or Petrobras (a Brazilian multinational
energy company that is majority-owned by the Brazilian government), accounted for 34%, 33% and 35% of our annual total
consolidated revenues, respectively. OGX Petróleo e Gás Ltda., or OGX (a privately owned Brazilian oil and natural gas company that filed
for bankruptcy in October 2013), accounted for 2%, 12% and 14% of our annual total consolidated revenues for the years ended
December 31, 2013, 2012 and 2011, respectively. No other customer accounted for 10% or more of our annual total consolidated
revenues during 2013, 2012 or 2011. See “Risk Factors — We rely heavily on a relatively small number of customers and the loss of a
significant customer and/or a dispute that leads to the loss of a customer could have a material adverse impact on our financial results”
in Item 1A of this report, which is incorporated herein by reference.
Brazil is one of the most active floater markets in the world today. As of the date of this report, the greatest concentration of our
operating assets is offshore Brazil, where we have ten rigs currently contracted. Our contract backlog attributable to our expected
operations offshore Brazil is $953.0 million, $537.0 million and $62.0 million for the years 2014, 2015 and 2016, respectively. See
“Management’s Discussion and Analysis of Financial Condition and Results of Operations — Market Overview — Contract Drilling
Backlog” in Item 7 of this report.
Competition
Despite consolidation in previous years, the offshore contract drilling industry remains highly competitive with numerous industry
participants, none of which at the present time has a dominant market share. The industry may also experience additional consolidation
in the future, which could create other large competitors. Some of our competitors may have greater financial or other resources than
we do. We compete with offshore drilling contractors that together have approximately 600 mobile rigs available worldwide.
The offshore contract drilling industry is influenced by a number of factors, including global economies and demand for oil and
natural gas, current and anticipated prices of oil and natural gas, expenditures by oil and gas companies for exploration and development
of oil and natural gas and the availability of drilling rigs.
DIAMOND OFFSHORE / 2013 ANNUAL REPORT 5

Drilling contracts are traditionally awarded on a competitive bid basis. Price is typically the primary factor in determining which
qualified contractor is awarded a job. Customers may also consider rig availability and location, a drilling contractor’s operational and
safety performance record, and condition and suitability of equipment. We believe we compete favorably with respect to these factors.
We compete on a worldwide basis, but competition may vary significantly by region at any particular time. See “— Markets.”
Competition for offshore rigs generally takes place on a global basis, as these rigs are highly mobile and may be moved, at a cost that
may be substantial, from one region to another. It is characteristic of the offshore contract drilling industry to move rigs from areas of low
utilization and dayrates to areas of greater activity and relatively higher dayrates. Significant new rig construction and upgrades of
existing drilling units could also intensify price competition. See “Risk Factors — Our industry is highly competitive and cyclical, with
intense price competition” in Item 1A of this report, which is incorporated herein by reference.
Governmental Regulation
Our operations are subject to numerous international, foreign, U.S., state and local laws and regulations that relate directly or
indirectly to our operations, including regulations controlling the discharge of materials into the environment, requiring removal and
clean-up under some circumstances, or otherwise relating to the protection of the environment, and may include laws or regulations
pertaining to climate change, carbon emissions or energy use. See “Risk Factors — Governmental laws and regulations, both domestic
and international, may add to our costs or limit our drilling activity” and “Risk Factors — Compliance with or breach of environmental laws
can be costly and could limit our operations” in Item 1A of this report, which are incorporated herein by reference.
Operations Outside the United States
Our operations outside the U.S. accounted for approximately 89%, 94% and 90% of our total consolidated revenues for the years
ended December 31, 2013, 2012 and 2011, respectively. See “Risk Factors — Significant portions of our operations are conducted
outside the United States and involve additional risks not associated with domestic operations,” “Risk Factors — We may enter into
drilling contracts that expose us to greater risks than we normally assume” and “Risk Factors — Fluctuations in exchange rates and
nonconvertibility of currencies could result in losses to us” in Item 1A of this report, which are incorporated herein by reference.
Employees
As of December 31, 2013, we had approximately 5,500 workers, including international crew personnel furnished through
independent labor contractors.
Executive Officers of the Registrant
We have included information on our executive officers in Part I of this report in reliance on General Instruction G(3) to Form 10-K.
Our executive officers are elected annually by our Board of Directors to serve until the next annual meeting of our Board of Directors, or
until their successors are duly elected and qualified, or until their earlier death, resignation, disqualification or removal from office.
Information with respect to our executive officers is set forth below.
NameAge as of
January 31, 2014 Position
Lawrence R. Dickerson . . . . . . . . . . . . . . . . . . . . . . . . . . 61 Incumbent President, Chief Executive Officer and
Director (1)
Marc Edwards . . . . . . . . . . . . . . . . . . . . . . . . . . . . . . . . . . 53 Incoming President, Chief Executive Officer and
Director (1)
John M. Vecchio . . . . . . . . . . . . . . . . . . . . . . . . . . . . . . . . . 63 Executive Vice President
Gary T. Krenek . . . . . . . . . . . . . . . . . . . . . . . . . . . . . . . . . . 55 Senior Vice President and Chief Financial Officer
William C. Long . . . . . . . . . . . . . . . . . . . . . . . . . . . . . . . . . 47 Senior Vice President, General Counsel & Secretary
Beth G. Gordon . . . . . . . . . . . . . . . . . . . . . . . . . . . . . . . . . 58 Controller – Chief Accounting Officer
Lyndol L. Dew . . . . . . . . . . . . . . . . . . . . . . . . . . . . . . . . . . . 59 Senior Vice President – Worldwide Operations
(1) Effective March 3, 2014, Mr. Dickerson will retire as an officer and director and Mr. Edwards will become our President and Chief
Executive Officer and a director.
Lawrence R. Dickerson has served as our President and a Director since March 1998 and as our Chief Executive Officer since May
2008. Mr. Dickerson served as our Chief Operating Officer from March 1998 to May 2008. Mr. Dickerson will retire from his positions as an
officer and director effective upon the appointment of Mr. Edwards on March 3, 2014.
6 DIAMOND OFFSHORE / 2013 ANNUAL REPORT

Marc Edwards will serve as our President and Chief Executive Officer and as a Director effective March 3, 2014. Mr. Edwards served
as a member of the Executive Committee and as Senior Vice President of the Completion and Production Division at Halliburton
Company, a diversified oilfield services company, from January 2010 to February 2014. Mr. Edwards previously served as Vice President
for Production Enhancement of Halliburton Company from January 2008 through December 2009.
John M. Vecchio has served as Executive Vice President since August 2009. Mr. Vecchio previously served as our Senior Vice
President — Technical Services from April 2002 to July 2009.
Gary T. Krenek has served as a Senior Vice President and our Chief Financial Officer since October 2006. Mr. Krenek previously
served as our Vice President and Chief Financial Officer since March 1998.
William C. Long has served as a Senior Vice President and our General Counsel and Secretary since October 2006. Mr. Long
previously served as our Vice President, General Counsel and Secretary since March 2001 and as our General Counsel and Secretary
from March 1999 through February 2001.
Beth G. Gordon has served as our Controller and Chief Accounting Officer since April 2000.
Lyndol L. Dew has served as a Senior Vice President since September 2006. Previously, Mr. Dew served as our Vice President-
International Operations from January 2006 to August 2006 and as our Vice President — North American Operations from January 2003
to December 2005.
Access to Company Filings
We are subject to the informational requirements of the Securities Exchange Act of 1934, as amended, or the Exchange Act, and
accordingly file annual, quarterly and current reports, any amendments to those reports, proxy statements and other information with
the United States Securities and Exchange Commission, or SEC. You may read and copy the information we file with the SEC at the
public reference facilities maintained by the SEC at 100 F Street, N.E., Washington, DC 20549. Please call the SEC at 1-800-SEC-0330 for
further information on the operation of the public reference room. Our SEC filings are also available to the public from the SEC’s Internet
site at www.sec.gov or from our Internet site at www.diamondoffshore.com. Our website provides a hyperlink to a third-party SEC filings
website where these reports may be viewed and printed at no cost as soon as reasonably practicable after we have electronically filed
such material with, or furnished it to, the SEC. The information contained on our website, or on other websites linked to our website, is
not part of this report.
Item 1A. Risk Factors.
Our business is subject to a variety of risks, including the risks described below. You should carefully consider these risks when
evaluating us and our securities. The risks and uncertainties described below are not the only ones facing our company. We are also
subject to a variety of risks that affect many other companies generally, as well as additional risks and uncertainties not known to us or
that, as of the date of this report, we believe are not as significant as the risks described below. If any of the following risks actually occur,
our business, financial condition, results of operations and cash flows, and the trading prices of our securities, may be materially and
adversely affected.
Our business depends on the level of activity in the oil and gas industry, which is significantly affected by volatile oiland gas prices.
Our business depends on the level of activity in offshore oil and gas exploration, development and production in markets worldwide.
Worldwide demand for oil and gas, oil and gas prices, market expectations of potential changes in these prices and a variety of political
and economic factors significantly affect this level of activity. However, higher or lower commodity demand and prices do not necessarily
translate into increased or decreased drilling activity since our customers’ project development time, reserve replacement needs, as well
as expectations of future commodity demand and prices all combine to affect demand for our rigs. In addition, the level of offshore
drilling activity may be adversely affected if operators reduce or defer new investment in offshore projects or reallocate their drilling
budgets away from offshore drilling in favor of shale plays or other land-based energy markets, which could reduce demand for our rigs
and newbuilds. Oil and gas prices have been, and are expected to continue to be, extremely volatile and are affected by numerous factors
beyond our control, including:
• worldwide demand for oil and gas;
• the level of economic activity in energy-consuming markets;
DIAMOND OFFSHORE / 2013 ANNUAL REPORT 7

• the worldwide economic environment or economic trends, such as recessions;
• the ability of the Organization of Petroleum Exporting Countries, commonly called OPEC, to set and maintain production levels
and pricing;
• the level of production in non-OPEC countries;
• the worldwide political and military environment, including uncertainty or instability resulting from an escalation or additional
outbreak of armed hostilities in the Middle East, other oil-producing regions or other geographic areas or further acts of terrorism
in the United States or elsewhere;
• civil unrest;
• the cost of exploring for, producing and delivering oil and gas;
• the discovery rate of new oil and gas reserves;
• the rate of decline of existing and new oil and gas reserves;
• available pipeline and other oil and gas transportation and refining capacity;
• the ability of oil and gas companies to raise capital;
• weather conditions;
• natural disasters or incidents resulting from operating hazards inherent in offshore drilling, such as oil spills;
• the policies of various governments regarding exploration and development of their oil and gas reserves;
• development and exploitation of alternative fuels or energy sources;
• competition for customers’ drilling budgets from land-based energy markets around the world;
• laws and regulations relating to environmental or energy security matters, including those addressing the risks of global climate
change;
• domestic and foreign tax policy; and
• advances in exploration and development technology.
Governmental laws and regulations, both domestic and international, may add to our costs or limit our drilling activity.
Our operations are affected from time to time in varying degrees by governmental laws and regulations. The offshore drilling
industry is dependent on demand for services from the oil and gas exploration industry and, accordingly, is affected by changing tax and
other laws relating to the energy business generally. We may be required to make significant capital expenditures for additional
equipment to comply with existing or new governmental laws and regulations. It is also possible that these laws and regulations may in
the future add significantly to our operating costs or result in a reduction in revenues associated with downtime required to install such
equipment, or may otherwise significantly limit drilling activity.
In the aftermath of the 2010 Macondo well blowout and subsequent investigation into the causes of the event, new rules have
been implemented for oil and gas operations in the U.S. Gulf of Mexico, or GOM, and in many of the international locations in which we
operate, including new standards for well design, casing and cementing and well control procedures, as well as rules requiring operators
to systematically identify risks and establish safeguards against those risks through a comprehensive safety and environmental
management system, or SEMS. New regulations may continue to be announced, including rules regarding drilling systems and
equipment, such as blowout preventer and well control systems and lifesaving systems, as well as rules regarding employee training,
engaging personnel in safety management and requiring third party audits of SEMS programs. Such new regulations could require
modifications or enhancements to existing systems and equipment, or require new equipment, and could increase our operating costs
8 DIAMOND OFFSHORE / 2013 ANNUAL REPORT

and cause downtime for our rigs if we are required to take any of them out of service between scheduled surveys or inspections, or if we
are required to extend scheduled surveys or inspections, to meet any such new requirements. We are not able to predict the likelihood,
nature or extent of additional rulemaking, nor are we able to predict the future impact of these events on our operations. Additional
governmental regulations concerning licensing, taxation, equipment specifications, training requirements or other matters could
increase the costs of our operations, and enhanced permitting requirements, as well as escalating costs borne by our customers, could
reduce exploration activity in the GOM and therefore demand for our services.
Governments in some countries are increasingly active in regulating and controlling the ownership of concessions, the exploration
for oil and gas and other aspects of the oil and gas industry. The modification of existing laws or regulations or the adoption of new laws
or regulations curtailing exploratory or developmental drilling for oil and gas for economic, environmental or other reasons could
materially and adversely affect our operations by limiting drilling opportunities.
As discussion of climate change issues increases, governments around the world are beginning to adopt laws and regulations to
address the matter. Lawmakers and regulators in the United States and other jurisdictions where we operate have focused increasingly
on restricting the emission of carbon dioxide, methane and other “greenhouse” gases. This may result in new environmental regulations
that may unfavorably impact us, our suppliers and our customers. We may be exposed to risks related to new laws, regulations, treaties or
international agreements pertaining to climate change, greenhouse gases, carbon emissions or energy use that could decrease the use
of oil or natural gas, thus reducing demand for hydrocarbon-based fuel and our drilling services. Governments may also pass laws or
regulations incentivizing or mandating the use of alternative energy sources, such as wind power and solar energy, which may reduce
demand for oil and natural gas and our drilling services. Such laws, regulations, treaties or international agreements could result in
increased compliance costs or additional operating restrictions, which may have a negative impact on our business, and could adversely
affect our operations by limiting drilling opportunities.
Our business involves numerous operating hazards which could expose us to significant losses and significantdamage claims. We are not fully insured against all of these risks and our contractual indemnity provisions may notfully protect us.
Our operations are subject to the significant hazards inherent in drilling for oil and gas offshore, such as blowouts, reservoir damage,
loss of production, loss of well control, unstable or faulty sea floor conditions, fires and natural disasters such as hurricanes. The
occurrence of any of these types of events could result in the suspension of drilling operations, damage to or destruction of the
equipment involved and injury or death to rig personnel, damage to producing or potentially productive oil and gas formations, and oil
spillage, oil leaks, well blowouts and extensive uncontrolled fires, any of which could cause significant environmental damage. In addition,
offshore drilling operations are subject to perils peculiar to marine operations, including capsizing, grounding, collision and loss or
damage from severe weather. Operations also may be suspended because of machinery breakdowns, abnormal drilling conditions,
failure of suppliers or subcontractors to perform or supply goods or services or personnel shortages. Any of the foregoing events could
result in significant damage or loss to our properties and assets or the properties and assets of others, injury or death to rig personnel or
others, significant loss of revenues, and significant damage claims against us, which could have a material adverse effect on our results of
operations, financial condition and cash flows.
Our drilling contracts with our customers provide for varying levels of indemnity and allocation of liabilities between our customers
and us with respect to the hazards and risks inherent in, and damages or losses arising out of, our operations, and we may not be fully
protected. Our contracts with our customers generally provide that we and our customers each assume liability for our respective
personnel and property. Our contracts also generally provide that our customers assume most of the responsibility for and indemnify us
against loss, damage or other liability resulting from, among other hazards and risks, pollution originating from the well and subsurface
damage or loss, while we typically retain responsibility for and indemnify our customers against pollution originating from the rig.
However, in certain drilling contracts we may not be fully indemnified by our customers for damage to their property and/or the property
of their other contractors. In certain contracts we may assume liability for losses or damages (including punitive damages) resulting from
pollution or contamination caused by negligent or willful acts of commission or omission by us, our suppliers and/or subcontractors,
generally subject to negotiated caps on a per occurrence basis and/or on an aggregate basis for the term of the contract. In some cases,
suppliers or subcontractors who provide equipment or services to us may seek to limit their liability resulting from pollution or
contamination. Our contracts are individually negotiated, and the levels of indemnity and allocation of liabilities in them can vary from
contract to contract depending on market conditions, particular customer requirements and other factors existing at the time a contract
is negotiated.
Additionally, the enforceability of indemnification provisions in our contracts may be limited or prohibited by applicable law or may
not be enforced by courts having jurisdiction, and we could be held liable for substantial losses or damages and for fines and penalties
imposed by regulatory authorities. The indemnification provisions of our contracts may be subject to differing interpretations, and the
DIAMOND OFFSHORE / 2013 ANNUAL REPORT 9
laws or courts of certain jurisdictions may enforce such provisions while other laws or courts may find them to be unenforceable, void or
limited by public policy considerations, including when the cause of the underlying loss or damage is our gross negligence or willful
misconduct, when punitive damages are attributable to us or when fines or penalties are imposed directly against us. The law with
respect to the enforceability of indemnities varies from jurisdiction to jurisdiction and is unsettled under certain laws that are applicable
to our contracts. Current or future litigation in particular jurisdictions, whether or not we are a party, may impact the interpretation and
enforceability of indemnification provisions in our contracts. There can be no assurance that our contracts with our customers, suppliers
and subcontractors will fully protect us against all hazards and risks inherent in our operations. There can also be no assurance that
those parties with contractual obligations to indemnify us will be financially able to do so or will otherwise honor their contractual
obligations.
We maintain liability insurance, which includes coverage for environmental damage; however, because of contractual provisions
and policy limits, our insurance coverage may not adequately cover our losses and claim costs. In addition, pollution and environmental
risks are generally not fully insurable when they are determined to be the result of criminal acts. Also, we do not typically purchase loss-
of-hire insurance to cover lost revenues when a rig is unable to work. Moreover, insurance costs across the industry have increased
following the Macondo incident and, in the future, certain insurance coverage is likely to become more costly and may become less
available or not available at all. Accordingly, it is possible that our losses from the hazards we face could have a material adverse effect on
our results of operations, financial condition and cash flows.
We believe that the policy limit under our marine liability insurance is within the range that is customary for companies of our size in
the offshore drilling industry and is appropriate for our business. However, if an accident or other event occurs that exceeds our coverage
limits or is not an insurable event under our insurance policies, or is not fully covered by contractual indemnity, it could have a material
adverse effect on our results of operations, financial condition and cash flows. There can be no assurance that we will continue to carry
the insurance we currently maintain, that our insurance will cover all types of losses or that we will be able to maintain adequate
insurance in the future at rates we consider to be reasonable or that we will be able to obtain insurance against some risks.
Accordingly, the occurrence of any of the hazards we face could have a material adverse effect on our results of operations,
financial condition and cash flows.
Compliance with or breach of environmental laws can be costly and could limit our operations.
In the United States and in many of the international locations in which we operate, laws and regulations controlling the discharge
of materials into the environment, requiring removal and cleanup of materials that may harm the environment or otherwise relating to
the protection of the environment apply to some of our operations. For example, we, as an operator of mobile offshore drilling units in
navigable United States waters and some offshore areas, may be liable for damages and costs incurred in connection with oil spills
related to those operations. Laws and regulations protecting the environment have become increasingly stringent, and may in some
cases impose “strict liability,” rendering a person liable for environmental damage without regard to negligence or fault on the part of that
person. These laws and regulations may expose us to liability for the conduct of, or conditions caused by, others or for acts that were in
compliance with all applicable laws at the time they were performed.
U.S. federal and state, foreign and international laws and regulations address oil spill prevention and control and impose a variety of
obligations on us related to the prevention of oil spills and liability for damages resulting from such spills. Some of these laws and
regulations have significantly expanded liability exposure across all segments of the oil and gas industry. For example, the United States
Oil Pollution Act of 1990 imposes strict and, with limited exceptions, joint and several liability upon each responsible party for oil removal
costs and a variety of public and private damages. Failure to comply with such laws and regulations could subject us to civil or criminal
enforcement action, for which we may not receive contractual indemnification or have insurance coverage, and could result in the
issuance of injunctions restricting some or all of our activities in the affected areas. In addition, legislative and regulatory developments
may occur following the Macondo well blowout and other recent events that could substantially increase our exposure to liabilities which
might arise in connection with our operations.
The application of these laws and regulations or the adoption of new laws and regulations could have a material adverse effect on
our financial condition, results of operations and cash flows.
Our industry is highly competitive and cyclical, with intense price competition.
The offshore contract drilling industry is highly competitive with numerous industry participants, none of which at the present time
has a dominant market share. Some of our competitors may have greater financial or other resources than we do. The drilling industry
has experienced consolidation in the past and may experience additional consolidation, which could create additional large competitors.
10 DIAMOND OFFSHORE / 2013 ANNUAL REPORT

Drilling contracts are traditionally awarded on a competitive bid basis. Price is typically the primary factor in determining which qualified
contractor is awarded a job; however, rig availability and location, a drilling contractor’s safety record and the quality and technical
capability of service and equipment may also be considered.
Our industry has historically been cyclical. There have been periods of lower demand, excess rig supply and low dayrates, followed
by periods of high demand, short rig supply and high dayrates. We cannot predict the timing or duration of such business cycles. Periods
of lower demand or excess rig supply intensify the competition in the industry and often result in periods of low utilization. During these
periods, our existing rigs and newbuilds may not obtain contracts for future work and may be idle for long periods of time or may be able
to obtain work only under contracts with lower dayrates or less favorable terms, which could have a material adverse effect on our
financial condition, results of operations and cash flows. Additionally, prolonged periods of low utilization and dayrates could also result in
the recognition of impairment charges on certain of our drilling rigs if future cash flow estimates, based upon information available to
management at the time, indicate that the carrying value of these rigs may not be recoverable.
Significant new rig construction and upgrades of existing drilling units could also intensify price competition. As of the date of this
report, based on analyst reports, we believe that there are approximately 100 floaters on order and scheduled for delivery between 2014
and 2016, with approximately 32% of these rigs scheduled for delivery in 2014. The resulting increases in rig supply could be sufficient to
depress rig utilization and intensify price competition from both existing competitors, as well as new entrants into the offshore drilling
market. As of the date of this report, not all of the rigs currently under construction have been contracted for future work, which may
further intensify price competition as scheduled delivery dates occur. The majority of the floaters on order are dynamically positioned
drilling units, which further increases competition with our fleet in certain circumstances, depending on customer requirements. In Brazil,
Petrobras, which accounted for approximately 34% of our consolidated revenues in 2013 and, as of February 5, 2014, accounted for
approximately $1.0 billion and $0.5 billion of our contract drilling backlog in 2014 and in the aggregate for the years 2015 and 2016,
respectively, and to which 10 of our floaters are currently contracted, has announced plans to construct locally 28 new ultra-deepwater
drilling units to be delivered beginning in 2015. These new drilling units, if built, would increase rig supply and could intensify price
competition in Brazil as well as other markets as they enter the market, would compete with, and could displace, both our deepwater and
ultra-deepwater floaters coming off contract as well as our newbuilds coming to market and could materially adversely affect our
utilization rates, particularly in Brazil.
We may not be able to renew or replace expiring contracts for our existing rigs or obtain contracts for our uncontractednewbuilds.
We have a number of customer contracts that will expire in 2014 and 2015. Additionally, certain of our newbuilds that we expect to
come to market during 2014 are contracted on a short-term basis or are currently uncontracted. Although we will seek to secure
contracts for these units before construction is completed, our ability to renew or replace expiring contracts or obtain new contracts, and
the terms of any such contracts, will depend on various factors, including market conditions and the specific needs of our customers.
Given the highly competitive and historically cyclical nature of our industry, we may be required to renew or replace expiring contracts or
obtain new contracts at dayrates that are below, and potentially substantially below, existing dayrates, or we may be unable to secure
contracts for these units. This could have a material adverse effect on our financial condition, results of operations and cash flows.
We can provide no assurance that our current backlog of contract drilling revenue will be ultimately realized.
As of the date of this report, our contract drilling backlog was approximately $6.8 billion for contracted future work extending, in
some cases, until 2019. Generally, contract backlog only includes future revenues under firm commitments; however, from time to time,
we may report anticipated commitments for which definitive agreements have not yet been, but are expected to be, executed. We can
provide no assurance that we will be able to perform under these contracts due to events beyond our control or that we will be able to
ultimately execute a definitive agreement in cases where one does not currently exist. In addition, we can provide no assurance that our
customers will be able to or willing to fulfill their contractual commitments to us. Our inability to perform under our contractual
obligations or to execute definitive agreements, or our customers’ inability or unwillingness to fulfill their contractual commitments to us,
may have a material adverse effect on our financial condition, results of operations and cash flows. See “— Our industry is highly
competitive and cyclical, with intense price competition” and “Management’s Discussion and Analysis of Financial Condition and Results
of Operations — Market Overview — Contract Drilling Backlog” in Item 7 of this report.
We rely heavily on a relatively small number of customers and the loss of a significant customer and/or a dispute thatleads to the loss of a customer could have a material adverse impact on our financial results.
We provide offshore drilling services to a customer base that includes major and independent oil and gas companies and
government-owned oil companies. In 2013, our five largest customers in the aggregate accounted for 54% of our consolidated
revenues. We expect Petrobras, which accounted for approximately 34% of our consolidated revenues in 2013, to continue to be a
DIAMOND OFFSHORE / 2013 ANNUAL REPORT 11

significant customer in 2014. Our contract drilling backlog, as of the date of this report, includes $1.0 billion, or 36%, in 2014 and
$0.5 billion in the aggregate for the years 2015 and 2016, which is attributable to contracts with Petrobras for operations offshore Brazil.
Petrobras has announced plans to construct locally 28 new ultra-deepwater drilling units to be delivered beginning in 2015. These new
drilling units, if built, would compete with, and could displace, our deepwater and ultra-deepwater floaters coming off contract and could
materially adversely affect our utilization rates, particularly in Brazil. In addition, if Petrobras or another significant customer experiences
liquidity constraints or other financial difficulties, it could materially adversely affect our utilization rates in Brazil or other markets and
also displace demand for our other drilling rigs and newbuilds as the resulting excess supply enters the market. While it is normal for our
customer base to change over time as work programs are completed, the loss of, or a significant reduction in the number of rigs
contracted with, any major customer may have a material adverse effect on our financial condition, results of operations and cash flows.
See “Management’s Discussion and Analysis of Financial Condition and Results of Operations — Market Overview — Contract Drilling
Backlog” in Item 7 of this report.
The terms of our drilling contracts may limit our ability to attain profitability in a declining market or to benefit fromincreasing dayrates in an improving market.
The duration of offshore drilling contracts is generally determined by customer requirements and, to a lesser extent, the respective
management strategies of the offshore drilling contractors. In periods of decreasing demand for offshore rigs, drilling contractors
generally prefer longer term contracts to preserve dayrates at existing levels and ensure utilization, while customers prefer shorter
contracts that allow them to more quickly obtain the benefit of lower dayrates. Conversely, in periods of rising demand for offshore rigs,
contractors typically prefer shorter contracts that allow them to more quickly profit from increasing dayrates, while customers with
reasonably definite drilling programs typically prefer longer term contracts to maintain dayrate prices at a consistent level. We may be
exposed to decreasing dayrates if any of our rigs are working under short-term contracts during a declining market. Likewise, if any of our
rigs are committed under long-term contracts during an improving market, we may be unable to enjoy the benefit of rising dayrates for
the duration of those contracts. Exposure to falling dayrates in a declining market or the inability to fully benefit from increasing dayrates
in an improving market through shorter term contracts may limit our profitability.
Contracts for our drilling units are generally fixed dayrate contracts, and increases in our operating costs couldadversely affect our profitability on those contracts.
Our contracts for our drilling units provide for the payment of a fixed dayrate per rig operating day, although some contracts do
provide for a limited escalation in dayrate due to increased operating costs incurred by us. Many of our operating costs, such as labor
costs, are unpredictable and fluctuate based on events beyond our control. In addition, equipment repair and maintenance expenses
fluctuate depending on the type of activity the rig is performing, the age and condition of the equipment and general market factors
impacting relevant parts, components and services. The gross margin that we realize on these fixed dayrate contracts will fluctuate
based on variations in our operating costs over the terms of the contracts. In addition, for contracts with dayrate escalation clauses, we
may not be able to fully recover increased or unforeseen costs from our customers. Our inability to recover these increased or
unforeseen costs from our customers could materially and adversely affect our financial condition, results of operations and cash flows.
Our drilling contracts may be terminated due to events beyond our control.
Our customers may terminate some of our term drilling contracts if the drilling unit is destroyed or lost or if we have to suspend
drilling operations for a specified period of time as a result of a breakdown of major equipment or, in some cases, due to other events
beyond the control of either party. In addition, some of our drilling contracts permit the customer to terminate the contract after
specified notice periods by tendering contractually specified termination amounts. These termination payments may not fully
compensate us for the loss of a contract. In some cases, because of depressed market conditions, restricted credit markets, economic
downturns or other factors beyond our control, our customers may repudiate or otherwise fail to perform their obligations under our
contracts with them. Any recovery we might obtain in these cases may not fully compensate us for the loss of the contract. In any case,
the early termination of a contract may result in a rig being idle for an extended period of time, which could have a material adverse
effect on our financial condition, results of operations and cash flows. If our customers cancel some of our contracts with them or if we
elect to terminate in the event that a customer fails to perform, and we are unable to secure new contracts on a timely basis and on
substantially similar terms, or if contracts are disputed or suspended for an extended period of time or if a number of our contracts are
renegotiated, it could materially and adversely affect our financial condition, results of operations and cash flows.
12 DIAMOND OFFSHORE / 2013 ANNUAL REPORT

Significant portions of our operations are conducted outside the United States and involve additional risks notassociated with domestic operations.
We operate in various regions throughout the world which may expose us to political and other uncertainties, including risks of:
• war, riot, civil disturbances and acts of terrorism;
• piracy or assaults on property or personnel;
• kidnapping of personnel;
• seizure, expropriation, nationalization, deprivation, malicious damage, or other loss of possession or use, of property or
equipment;
• renegotiation or nullification of existing contracts;
• disputes and legal proceedings in international jurisdictions;
• changing social, political and economic conditions;
• imposition of wage and price controls, trade barriers or import-export quotas;
• foreign and domestic monetary policies;
• the inability to repatriate income or capital;
• difficulties in collecting accounts receivable and longer collection periods;
• fluctuations in currency exchange rates;
• regulatory or financial requirements to comply with foreign bureaucratic actions;
• travel limitations or operational problems caused by public health threats;
• difficulties in supplying, repairing or replacing equipment or transporting personnel in remote locations;
• difficulties in obtaining visas or work permits for our employees on a timely basis; and
• changing taxation policies and confiscatory or discriminatory taxation.
We are subject to the U.S. Treasury Department’s Office of Foreign Assets Control and other U.S. laws and regulations governing our
international operations in addition to worldwide anti-bribery laws. In addition, international contract drilling operations are subject to
various laws and regulations in countries in which we operate, including laws and regulations relating to:
• the equipping and operation of drilling units;
• import-export quotas or other trade barriers;
• repatriation of foreign earnings or capital;
• oil and gas exploration and development;
• local content requirements;
• taxation of offshore earnings and earnings of expatriate personnel; and
• use and compensation of local employees and suppliers by foreign contractors.
DIAMOND OFFSHORE / 2013 ANNUAL REPORT 13

Some foreign governments favor or effectively require the awarding of drilling contracts to local contractors, require use of a local
agent or require foreign contractors to employ citizens of, or purchase supplies from, a particular jurisdiction. These practices may
adversely affect our ability to compete in those regions. It is difficult to predict what governmental regulations may be enacted in the
future that could adversely affect the international offshore drilling industry. The actions of foreign governments may materially and
adversely affect our ability to compete.
In addition, the shipment of goods, including the movement of a drilling rig across international borders, subjects us to extensive
trade laws and regulations. Our import activities are governed by unique customs laws and regulations that differ in each of the countries
in which we operate and often impose record keeping and reporting obligations. The laws and regulations concerning import/export
activity and record keeping and reporting requirements are complex and change frequently. These laws and regulations may be enacted,
amended, enforced and/or interpreted in a manner that could materially and adversely impact our operations. Shipments can be
delayed and denied export or entry for a variety of reasons, some of which may be outside of our control. Shipping delays or denials
could cause unscheduled downtime for our rigs. Failure to comply with these laws and regulations could result in criminal and civil
penalties, economic sanctions, seizure of shipments and/or the contractual withholding of monies owed to us, among other things.
We may enter into drilling contracts that expose us to greater risks than we normally assume.
From time to time, we may enter into drilling contracts with national oil companies, government-controlled entities or others that
expose us to greater risks than we normally assume, such as exposure to greater environmental or other liability and more onerous
termination provisions giving the customer a right to terminate without cause or upon little or no notice. Upon termination, these
contracts may not result in a payment to us, or if a termination payment is required, it may not fully compensate us for the loss of a
contract. In addition, the early termination of a contract may result in a rig being idle for an extended period of time, which could
adversely affect our financial condition, results of operations and cash flows. While we believe that the financial terms of these contracts
and our operating safeguards in place mitigate these risks, we can provide no assurance that the increased risk exposure will not have a
material negative impact on our future operations or financial results.
Fluctuations in exchange rates and nonconvertibility of currencies could result in losses to us.
Due to our international operations, we have experienced currency exchange losses where revenues are received and expenses are
paid in nonconvertible currencies or where we do not effectively hedge an exposure to a foreign currency. We may also incur losses as a
result of an inability to collect revenues because of a shortage of convertible currency available to the country of operation, controls over
currency exchange or controls over the repatriation of income or capital. We can provide no assurance that financial hedging
arrangements will effectively hedge any foreign currency fluctuation losses that may arise.
Changes in tax laws, effective income tax rates or adverse outcomes resulting from examination of our tax returnscould adversely affect our financial results.
Tax laws and regulations are highly complex and subject to interpretation and disputes. We conduct our worldwide operations
through various subsidiaries in a number of different jurisdictions. We are subject to the tax laws, tax regulations and income tax treaties
within and between the countries in which we operate as well as countries in which we may be resident. We determine our income tax
expense based on our interpretation of the applicable tax laws and regulations in effect in each jurisdiction for the period during which
we operate and earn income. Our overall effective tax rate could be adversely and suddenly affected by lower than anticipated earnings
in countries where we have lower statutory rates and higher than anticipated earnings in countries where we have higher statutory rates,
by changes in the valuation of our deferred tax assets and liabilities or by changes in tax law, tax treaties, regulations, accounting
principles or interpretations thereof in one or more countries in which we operate.
Our income tax returns are subject to review and examination. We do not recognize the benefit of income tax positions we believe
are more likely than not to be disallowed upon challenge by a tax authority. If any tax authority successfully challenges any tax position
taken or intercompany pricing policies, or if the terms of certain income tax treaties are interpreted in a manner that is adverse to us or
our operations, or if we lose a material tax dispute in any country, our effective tax rate on our worldwide earnings could increase
substantially and our earnings and cash flows from operations could be materially adversely affected.
We may be required to accrue additional tax liability on certain of our foreign earnings.
Certain of our international rigs are owned and operated, directly or indirectly, by Diamond Offshore International Limited, or DOIL, a
Cayman Islands subsidiary which we wholly own. It is our intention to indefinitely reinvest future earnings of DOIL and its foreign
subsidiaries to finance foreign activities. We do not expect to provide for U.S. taxes on any future earnings generated by DOIL, except to
14 DIAMOND OFFSHORE / 2013 ANNUAL REPORT
the extent that these earnings are immediately subjected to U.S. federal income tax. Should a future distribution be made from any
unremitted earnings of this subsidiary, we may be required to record additional U.S. income taxes that, if material, could have a material
adverse effect on our financial condition, results of operations and cash flows.
Acts of terrorism and other political and military events could adversely affect the markets for our drilling services.
Terrorist attacks and the continued threat of terrorism in the U.S. and abroad, the continuation or escalation of existing armed
hostilities or the outbreak of additional hostilities could lead to increased political, economic and financial market instability and a
downturn in the economies of the U.S. and other countries. A lower level of economic activity could result in a decline in energy
consumption or an increase in the volatility of energy prices, either of which could materially and adversely affect the market for our
offshore drilling services, our dayrates or utilization and, accordingly, our financial condition, results of operations and cash flows. While
we take steps that we believe are appropriate to secure our energy assets, there is no assurance that we can completely secure these
assets, completely protect them against a terrorist attack or other political and military events or obtain adequate insurance coverage for
such events at reasonable rates.
We may be subject to litigation that could have a material adverse effect on us.
We are, from time to time, involved in various litigation matters. These matters may include, among other things, contract disputes,
personal injury claims, environmental claims or proceedings, asbestos and other toxic tort claims, employment and tax matters and other
litigation that arises in the ordinary course of our business. Although we intend to defend these matters vigorously, we cannot predict
with certainty the outcome or effect of any claim or other litigation matter, and there can be no assurance as to the ultimate outcome of
any litigation. We may not have insurance for litigation or claims that may arise, or if we do have insurance coverage it may not be
sufficient, insurers may not remain solvent, other claims may exhaust some or all of the insurance available to us or insurers may
interpret our insurance policies such that they do not cover losses for which we make claims or may otherwise dispute claims made.
Litigation may have a material adverse effect on us because of potential adverse outcomes, defense costs, the diversion of our
management’s resources and other factors.
Failure to obtain and retain highly skilled personnel could hurt our operations.
We require highly skilled personnel to operate and provide technical services and support for our business. To the extent that
demand for drilling services and the size of the worldwide industry fleet increase (including due to the impact of newly constructed rigs),
shortages of qualified personnel could arise, creating upward pressure on wages and difficulty in staffing and servicing our rigs, which
could adversely affect our results of operations. As of the date of this report, we have three new ultra-deepwater drillships and one ultra-
deepwater, semisubmersible rig, as well as the Ocean Apex, under construction. These rigs are not yet fully crewed, as of the date of this
report, and will require additional skilled personnel to operate. Additional new capacity in the offshore drilling market could also cause
further competition for qualified and experienced personnel as these entities seek to hire personnel with expertise in the offshore drilling
industry. The heightened competition for skilled personnel could materially and adversely impact our financial condition, results of
operations and cash flows by limiting our operations and further increasing our costs.
Although we have paid special cash dividends in the past, we may not pay special cash dividends in the future and wecan give no assurance as to the amount or timing of the payment of any future special cash dividends.
We have adopted a policy to consider paying special cash dividends, in amounts to be determined, on a quarterly basis. Any
determination to declare a special cash dividend, as well as the amount of any special cash dividend which may be declared, will be based
on our financial position, earnings, earnings outlook, capital spending plans and other factors that our Board of Directors considers
relevant at that time. Moreover, our dividend policy may change from time to time. We cannot assure you that we will continue to declare
any special cash dividends at all or in any particular amounts. If in the future we pay special cash dividends less frequently or in smaller
amounts, or cease to pay any special cash dividends, it could have a negative effect on the market price of our common stock. See
“Market for the Registrant’s Common Equity, Related Stockholder Matters and Issuer Purchases of Equity Securities — Dividend Policy”
in Item 5 of this report and “Management’s Discussion and Analysis of Financial Condition and Results of Operations — Liquidity and
Capital Resources” in Item 7 of this report.
Rig conversions, upgrades or new-builds may be subject to delays and cost overruns.
From time to time we add new capacity through conversions or upgrades to our existing rigs or through new construction, such as
our three ultra-deepwater drillships and our harsh environment, ultra-deepwater semisubmersible rig under construction and
DIAMOND OFFSHORE / 2013 ANNUAL REPORT 15

construction of the Ocean Apex. Projects of this type are subject to risks of delay or cost overruns inherent in any large construction
project resulting from numerous factors, including the following:
• shortages of equipment, materials or skilled labor;
• work stoppages;
• unscheduled delays in the delivery of ordered materials and equipment;
• unanticipated cost increases or change orders;
• weather interferences or storm damage;
• difficulties in obtaining necessary permits or in meeting permit conditions;
• design and engineering problems;
• disputes with shipyards or suppliers;
• availability of suppliers to recertify equipment for enhanced regulations;
• customer acceptance delays;
• shipyard failures or unavailability; and
• failure or delay of third party service providers, civil unrest and labor disputes.
Failure to complete a rig upgrade or new construction on time, or failure to complete a rig conversion or new construction in
accordance with its design specifications may, in some circumstances, result in the delay, renegotiation or cancellation of a drilling
contract, resulting in a loss of contract drilling backlog and revenue to us. If a drilling contract is terminated under these circumstances,
we may not be able to secure a replacement contract with equally favorable terms.
We rely on third-party suppliers, manufacturers and service providers to secure equipment, components and partsused in rig operations, conversions, upgrades and construction.
Our reliance on third-party suppliers, manufacturers and service providers to provide equipment and services exposes us to volatility
in the quality, price and availability of such items. Certain components, parts and equipment that we use in our operations may be
available only from a small number of suppliers, manufacturers or service providers. The failure of one or more third-party suppliers,
manufacturers or service providers to provide equipment, components, parts or services, whether due to capacity constraints,
production or delivery disruptions, price increases, quality control issues, recalls or other decreased availability of parts and equipment, is
beyond our control and could materially disrupt our operations or result in the delay, renegotiation or cancellation of a drilling contract,
thereby causing a loss of contract drilling backlog and/or revenue to us, as well as an increase in operating costs.
We have elected to self-insure for physical damage to rigs and equipment caused by named windstorms in the U.S. Gulfof Mexico.
Because the amount of insurance coverage available to us is limited, and the cost for such coverage is substantial, we have elected
to self-insure for physical damage to rigs and equipment caused by named windstorms in the U.S. Gulf of Mexico. This results in a higher
risk of losses, which could be material, that are not covered by third party insurance contracts. If one or more named windstorms in the
U.S. Gulf of Mexico cause significant damage to our rigs or equipment, it could have a material adverse effect on our financial condition,
results of operations and cash flows.
Our debt levels may limit our liquidity and flexibility in obtaining additional financing and in pursuing other businessopportunities.
As of December 31, 2013, we had $2.5 billion in senior debt maturing at various times from September 2014 through 2043. We also
had $750 million of availability under our revolving credit facility as of that date. We may borrow from time to time under our revolving
credit facility to fund working capital or other needs, subject to compliance with its covenants. Our ability to meet our debt service
16 DIAMOND OFFSHORE / 2013 ANNUAL REPORT

obligations is dependent upon our future performance, which is subject to general economic conditions, industry cycles and financial,
business and other factors affecting our operations, many of which are beyond our control. Our debt levels and the terms of our
indebtedness could potentially limit our liquidity and flexibility in obtaining additional financing at rates which we consider reasonable, or
at all. In addition, we may need to refinance our long-term debt on or before maturity, and our overall debt level and/or market
conditions could lead the credit rating agencies to lower our corporate credit ratings. A downgrade in our corporate credit ratings could
impact our ability to issue additional debt by raising the cost of issuing new debt. As a consequence, we may not be able to issue
additional debt in amounts and/or with terms that we consider to be reasonable. One or more of these occurrences could limit our
ability to pursue other business opportunities.
We may incur asset impairments as a result of declining demand for certain types of offshore drilling rigs.
We evaluate our property and equipment for impairment whenever changes in circumstances indicate that the carrying amount of
an asset may not be recoverable (such as cold stacking a rig or excess spending over budget on a new-build, construction project or
major rig upgrade), and we could incur impairment charges related to the carrying value of our drilling rigs. We utilize a probability-
weighted cash flow analysis in testing an asset for potential impairment, which reflects management’s assumptions and estimates
regarding the appropriate risk-adjusted dayrate by rig, future industry conditions and operations and other factors. Asset impairment
evaluations are, by their nature, highly subjective. The use of different estimates and assumptions could result in materially different
carrying values of our assets which could impact the need to record an impairment charge and the amount of any charge taken. See
“Management’s Discussion and Analysis of Financial Condition and Results of Operations — Market Overview — Critical Accounting
Estimates — Property, Plant and Equipment” in Item 7 of this report.
We can provide no assurance that our assumptions and estimates will ultimately be realized, nor can we provide any assurance that
the current carrying value of our property and equipment, including rigs designated as held for sale, will ultimately be realized.
Any significant cyber attack or other interruption in network security or the operation of critical computer systemscould materially disrupt our operations and adversely affect our business.
The offshore drilling industry has become increasingly dependent upon digital technologies to conduct day-to-day operations, and
we are placing greater reliance on technology to help support our operations and increase efficiency in our business. We are dependent
upon operational and financial computer systems to process the data necessary to conduct almost all aspects of our business. Any
failure of our computer systems, or those of our customers, vendors or others with whom we do business, could materially disrupt our
business operations and could result in the corruption of data or unauthorized release of confidential, proprietary or sensitive data
concerning our company, business activities, employees or customers. Computer and other business facilities and systems could
become unavailable or impaired from a variety of causes including, among others, storms and other natural disasters, terrorist attacks,
utility outages, theft, design defects, human error or complications encountered as existing systems are maintained, repaired, replaced or
upgraded. In addition, it has been reported that unknown entities or groups have mounted so-called “cyber attacks” on businesses and
other organizations solely to disable or disrupt computer systems, disrupt operations and, in some cases, steal data. Any cyber attack that
affects our facilities could have a material adverse effect on our operations, business or reputation.
Unionization efforts and labor regulations in some of the countries in which we operate could materially increase ourcosts or limit our flexibility.
Some of our employees in non-U.S. markets are represented by labor unions and work under collective bargaining or similar
agreements which are subject to periodic renegotiation. These negotiations could result in higher personnel expenses, other increased
costs or increased operational restrictions. Efforts have been made from time to time to unionize other portions of our workforce. In
addition, we may be subjected to strikes or work stoppages and other labor disruptions in certain countries. Additional unionization
efforts, new collective bargaining agreements or work stoppages could materially increase our costs, reduce our revenues or limit our
flexibility.
We are controlled by a single stockholder, which could result in potential conflicts of interest.
Loews Corporation, which we refer to as Loews, beneficially owned approximately 50.4% of our outstanding shares of common
stock as of February 18, 2014 and is in a position to control actions that require the consent of stockholders, including the election of
directors, amendment of our Restated Certificate of Incorporation and any merger or sale of substantially all of our assets. In addition,
two officers of Loews serve on our Board of Directors. One of those, James S. Tisch, the Chairman of the Board of our company, is also the
Chief Executive Officer and a director of Loews. We have also entered into a services agreement and a registration rights agreement with
Loews and we may in the future enter into other agreements with Loews.
DIAMOND OFFSHORE / 2013 ANNUAL REPORT 17

Loews is a holding company. In addition to us, its principal subsidiaries are CNA Financial Corporation, a 90% owned subsidiary
engaged in commercial property and casualty insurance; HighMount Exploration & Production LLC, a wholly owned subsidiary engaged
in exploration, production and marketing of natural gas and natural gas liquids; Boardwalk Pipeline Partners, LP, a 53% owned subsidiary
engaged in transportation and storage of natural gas and natural gas liquids and gathering and processing of natural gas; and Loews
Hotels Holding Corporation, a wholly owned subsidiary engaged in the operation of a chain of hotels. It is possible that Loews may in
some circumstances be in direct or indirect competition with us, including competition with respect to certain business strategies and
transactions that we may propose to undertake. In addition, potential conflicts of interest exist or could arise in the future for our
directors who are also officers of Loews with respect to a number of areas relating to the past and ongoing relationships of Loews and us,
including tax and insurance matters, financial commitments and sales of common stock pursuant to registration rights or otherwise.
Although the affected directors may abstain from voting on matters in which our interests and those of Loews are in conflict so as to
avoid potential violations of their fiduciary duties to stockholders, the presence of potential or actual conflicts could affect the process or
outcome of Board deliberations. We cannot assure you that these conflicts of interest will not materially adversely affect us.
Item 1B. Unresolved Staff Comments.
Not applicable.
Item 2. Properties.
We own an office building in Houston, Texas, where our corporate headquarters are located. We also own offices and other facilities
in New Iberia, Louisiana, Aberdeen, Scotland, Macae, Brazil, and Ciudad del Carmen, Mexico. Additionally, we currently lease various office,
warehouse and storage facilities in Angola, Australia, Cameroon, Egypt, Indonesia, Louisiana, Malaysia, Norway, Singapore, Thailand,
Trinidad and Tobago, the U.K.,and Vietnam to support our offshore drilling operations.
Item 3. Legal Proceedings.
See information with respect to legal proceedings in Note 11 “Commitments and Contingencies” to our Consolidated Financial
Statements in Item 8 of this report.
Item 4. Mine Safety Disclosures.
Not applicable.
18 DIAMOND OFFSHORE / 2013 ANNUAL REPORT

PART II
Item 5. Market for the Registrant’s Common Equity, Related Stockholder Matters and Issuer Purchases of EquitySecurities.
Price Range of Common Stock
Our common stock is listed on the New York Stock Exchange, or NYSE, under the symbol “DO.” The following table sets forth, for
the calendar quarters indicated, the high and low closing prices of our common stock as reported by the NYSE.
Common Stock
High Low
2013First Quarter . . . . . . . . . . . . . . . . . . . . . . . . . . . . . . . . . . . . . . . . . . . . . . . . . . . . . . . . . . . . . . . . . . . . . . . . . . . . . . . . . . . . . . . . . . . . . . . . . $76.48 $67.45
Second Quarter . . . . . . . . . . . . . . . . . . . . . . . . . . . . . . . . . . . . . . . . . . . . . . . . . . . . . . . . . . . . . . . . . . . . . . . . . . . . . . . . . . . . . . . . . . . . . 72.84 64.42
Third Quarter . . . . . . . . . . . . . . . . . . . . . . . . . . . . . . . . . . . . . . . . . . . . . . . . . . . . . . . . . . . . . . . . . . . . . . . . . . . . . . . . . . . . . . . . . . . . . . . . 72.65 62.13
Fourth Quarter . . . . . . . . . . . . . . . . . . . . . . . . . . . . . . . . . . . . . . . . . . . . . . . . . . . . . . . . . . . . . . . . . . . . . . . . . . . . . . . . . . . . . . . . . . . . . . 64.63 55.39
2012First Quarter . . . . . . . . . . . . . . . . . . . . . . . . . . . . . . . . . . . . . . . . . . . . . . . . . . . . . . . . . . . . . . . . . . . . . . . . . . . . . . . . . . . . . . . . . . . . . . . . . $72.43 $55.61
Second Quarter . . . . . . . . . . . . . . . . . . . . . . . . . . . . . . . . . . . . . . . . . . . . . . . . . . . . . . . . . . . . . . . . . . . . . . . . . . . . . . . . . . . . . . . . . . . . . 69.39 56.18
Third Quarter . . . . . . . . . . . . . . . . . . . . . . . . . . . . . . . . . . . . . . . . . . . . . . . . . . . . . . . . . . . . . . . . . . . . . . . . . . . . . . . . . . . . . . . . . . . . . . . . 69.24 58.85
Fourth Quarter . . . . . . . . . . . . . . . . . . . . . . . . . . . . . . . . . . . . . . . . . . . . . . . . . . . . . . . . . . . . . . . . . . . . . . . . . . . . . . . . . . . . . . . . . . . . . . 71.14 64.91
As of February 14, 2014 there were approximately 176 holders of record of our common stock. This number represents registered
stockholders and does not include stockholders who hold their shares institutionally.
Dividend Policy
In 2013, we paid regular cash dividends of $0.125 and special cash dividends of $0.75 per share of our common stock on
March 1, June 3, September 3 and December 2. In 2012, we paid regular cash dividends of $0.125 and special cash dividends of $0.75 per
share of our common stock on March 1, June 1, September 4 and December 3.
On February 5, 2014, we declared a regular cash dividend and a special cash dividend of $0.125 and $0.75, respectively, per share of
our common stock. Both the quarterly and special cash dividends are payable on March 3, 2014 to stockholders of record on
February 19, 2014.
We have adopted a policy to consider paying special cash dividends, in amounts to be determined, on a quarterly basis. Any
determination to declare a special cash dividend, as well as the amount of any special cash dividend that may be declared, will be based
on our financial position, earnings, earnings outlook, capital spending plans and other factors that our Board of Directors considers
relevant at that time.
DIAMOND OFFSHORE / 2013 ANNUAL REPORT 19

CUMULATIVE TOTAL STOCKHOLDER RETURN
The following graph shows the cumulative total stockholder return for our common stock, the Standard & Poor’s 500 Index and the
Dow Jones U.S. Oil Equipment & Services index over the five year period ended December 31, 2013.
Comparison of 2009 — 2013 Cumulative Total Return(1)
201320122011201020092008
DO
LLA
RS
Dow Jones U.S. OilEquipment & Services
Diamond Offshore
S&P 500
50
150
100
300
250
200
Dec. 31,2008
Dec. 31,2009
Dec. 31,2010
Dec. 31,2011
Dec. 31,2012
Dec. 31,2013
Diamond Offshore 100 185 135 117 151 133
S&P 500 100 126 146 149 172 228
Dow Jones U.S. Oil Equipment & Services 100 161 204 188 190 238
(1) Total return assuming reinvestment of dividends. Assumes $100 invested on December 31, 2008 in our common stock and the
two published indices.
Our dividend history for the periods reported above is as follows:
Q1 Q2 Q3 Q4
Year Regular Special Regular Special Regular Special Regular Special
2013 . . . . . . . . . . . . . . . . . . . . . . . . . . . . . . $0.125 $ 0.75 $0.125 $ 0.75 $0.125 $ 0.75 $0.125 $ 0.75
2012 . . . . . . . . . . . . . . . . . . . . . . . . . . . . . . $0.125 $ 0.75 $0.125 $ 0.75 $0.125 $ 0.75 $0.125 $ 0.75
2011 . . . . . . . . . . . . . . . . . . . . . . . . . . . . . . $0.125 $ 0.75 $0.125 $ 0.75 $0.125 $ 0.75 $0.125 $ 0.75
2010 . . . . . . . . . . . . . . . . . . . . . . . . . . . . . . $0.125 $1.875 $0.125 $1.375 $0.125 $ 0.75 $0.125 $ 0.75
2009 . . . . . . . . . . . . . . . . . . . . . . . . . . . . . . $0.125 $1.875 $0.125 $1.875 $0.125 $1.875 $0.125 $1.875
20 DIAMOND OFFSHORE / 2013 ANNUAL REPORT

Item 6. Selected Financial Data.
The following table sets forth certain historical consolidated financial data relating to Diamond Offshore. We prepared the selected
consolidated financial data from our consolidated financial statements as of and for the periods presented. The selected consolidated
financial data below should be read in conjunction with “Management’s Discussion and Analysis of Financial Condition and Results of
Operations” in Item 7 and our Consolidated Financial Statements (including the Notes thereto) in Item 8 of this report.
As of and for the Year Ended December 31,
2013 2012 2011 2010 2009
(In thousands, except per share and ratio data)
Income Statement Data:Total revenues . . . . . . . . . . . . . . . . . . . . . . . . . . . . . . . . . . . . . . . . . . . . . . . $2,920,421 $2,986,508 $3,322,419 $3,322,974 $3,631,284
Operating income . . . . . . . . . . . . . . . . . . . . . . . . . . . . . . . . . . . . . . . . . . . 801,606 962,378 1,255,414 1,425,374 1,903,213
Net income . . . . . . . . . . . . . . . . . . . . . . . . . . . . . . . . . . . . . . . . . . . . . . . . . 548,686 720,477 962,542 955,457 1,376,219
Net income per share:
Basic . . . . . . . . . . . . . . . . . . . . . . . . . . . . . . . . . . . . . . . . . . . . . . . . . . . . . 3.95 5.18 6.92 6.87 9.90
Diluted . . . . . . . . . . . . . . . . . . . . . . . . . . . . . . . . . . . . . . . . . . . . . . . . . . . 3.95 5.18 6.92 6.87 9.89
Balance Sheet Data:Drilling and other property and equipment, net . . . . . . . . . . . . . . . . . $5,467,227 $4,864,972 $4,667,469 $4,283,792 $4,432,052
Total assets . . . . . . . . . . . . . . . . . . . . . . . . . . . . . . . . . . . . . . . . . . . . . . . . . 8,391,434 7,235,286 6,964,157 6,726,984 6,264,261
Long-term debt (excluding current maturities)(1) . . . . . . . . . . . . . . . 2,244,189 1,496,066 1,495,823 1,495,593 1,495,375
Other Financial Data:Capital expenditures . . . . . . . . . . . . . . . . . . . . . . . . . . . . . . . . . . . . . . . . . $ 957,598 $ 702,041 $ 774,756 $ 434,262 $1,362,468
Cash dividends declared per share . . . . . . . . . . . . . . . . . . . . . . . . . . . . . 3.50 3.50 3.50 5.25 8.00
Ratio of earnings to fixed charges(2) . . . . . . . . . . . . . . . . . . . . . . . . . . . 7.79x 11.11x 14.40x 15.35x 37.29x
(1) See “Management’s Discussion and Analysis of Financial Condition and Results of Operations — Liquidity and Capital Resources —
Credit Agreement and Senior Notes” in Item 7 and Note 9 “Credit Agreement and Senior Notes” to our Consolidated Financial
Statements included in Item 8 of this report for a discussion of changes to our long-term debt.
(2) For all periods presented, the ratio of earnings to fixed charges has been computed on a total enterprise basis. Earnings represent
pre-tax income from continuing operations plus fixed charges. Fixed charges include (i) interest, whether expensed or capitalized,
(ii) amortization of debt issuance costs, whether expensed or capitalized, and (iii) a portion of rent expense, which we believe
represents the interest factor attributable to rent.
Item 7. Management’s Discussion and Analysis of Financial Condition and Results of Operations.
The following discussion should be read in conjunction with our Consolidated Financial Statements (including the Notes thereto) in
Item 8 of this report.
We are a leader in offshore drilling, providing contract drilling services to the energy industry around the globe with a fleet of 45
offshore drilling rigs, including five rigs under construction. Our fleet consists of 33 semisubmersibles, two of which are under
construction, seven jack-ups, one of which is held for sale, and five dynamically positioned drillships, three of which are under
construction. In late 2013 and in early 2014, we took delivery of the deepwater floater Ocean Onyx and the ultra-deepwater drillship
Ocean BlackHawk, respectively. The Ocean Onyx is currently operating under a one-year contract in the U.S. Gulf of Mexico, or GOM, and
we expect the Ocean BlackHawk to commence operating under contract in the second quarter of 2014, also in the GOM. The jack-up rig,
Ocean Spartan, is being marketed for sale.
During 2014, we expect to take delivery of two sister ultra-deepwater drillships, the Ocean BlackHornet and Ocean BlackRhino, as
well as the deepwater floater Ocean Apex. The remaining ultra-deepwater drillship Ocean BlackLion and the harsh environment, ultra-
deepwater semisubmersible Ocean GreatWhite are expected to be delivered in 2015 and 2016, respectively. Of these rigs, the Ocean
BlackRhino and Ocean BlackLion are not yet contracted.
Additionally, we expect to take the ultra-deepwater Ocean Confidence out of service late in the first quarter of 2014 for a service-
life-extension project. The rig is expected to be unavailable until mid-January 2015, when the rig is projected to resume working under
contract in West Africa.
DIAMOND OFFSHORE / 2013 ANNUAL REPORT 21

Market Overview
Floater Markets
Ultra-Deepwater Floaters. The ultra-deepwater market has weakened, with an increasing number of units competing for fewer
available jobs, resulting in a downward trend in recent contract dayrate fixtures and shorter-term contracts executed. The most active
ultra-deepwater floater markets remain primarily within the offshore basins of West Africa, Brazil and the Gulf of Mexico. However, there
has been limited tendering activity thus far in 2014 and the outlook is uncertain for the remainder of 2014. If this trend continues, ultra-
deepwater floaters could experience lower utilization, or idle time, and realize lower margins. Many industry analysts predict that there
will be an oversupply of floaters in the ultra-deepwater market by the end of 2014.
Deepwater Floaters. The market for deepwater floaters has also weakened and is characterized by intermittent demand, and
multiple existing units face pockets of idle time throughout 2014 while newbuilds may have challenges securing work. Dayrate fixtures
are also moderating in this market and are projected by industry analysts to continue softening in 2014. This market has also seen
limited tendering activity in 2014 with an uncertain outlook for the balance of the year.
Mid-Water Floaters. Strength in the mid-water market also varies significantly by region. In both the United Kingdom, or U.K., and
Norway sectors of the North Sea, the mid-water market is showing some signs of weakening, in the form of moderating or decreasing
dayrates, in part due to an increase in the availability of sublet opportunities being offered for some term contracted units. Increasing
operator interest in frontier markets across Southeast Asia and South America, including Colombia, Myanmar, Nicaragua, Peru and
Trinidad and Tobago, indicates possible future strengthening in those regions, although opportunities in these areas are not expected to
emerge quickly. In the GOM, demand for mid-water units is limited, while in Brazil, demand has moderated.
Impact of Newbuild Rigs and Other Challenges of the Offshore Drilling Industry
Since 2010, there have been a significant number of orders for newbuild ultra-deepwater and deepwater floaters by established
drilling contractors as well as new entrants to the industry. As of the date of this report, there are approximately 100 newbuild floater rigs
that have been announced, including an estimated 28 rigs potentially to be built on behalf of Petróleo Brasileiro S.A. Excluding these
customer-ordered rigs, 31 of the 57 newbuilds scheduled for delivery in 2014 through 2015 are not yet contracted for future work,
including two of our four rigs expected to be delivered in 2014 and 2015. The offshore drilling industry has been challenged by the
addition of these newbuild rigs, which has increased competition and has resulted in downward pressure on dayrates. The influx of
newbuilds into the market, combined with established rigs coming off contract in 2014 and 2015, is expected to continue to weaken the
ultra-deepwater and deepwater floater markets.
The offshore drilling industry continues to be challenged by growing regulatory demands and more complex customer
specifications, which could disadvantage some lower specification rigs. Additionally, customer focus on completing existing projects,
possible reduction or deferral of new investment, reallocation of budgets away from offshore projects and particular customer
requirements in certain markets could displace, or reduce, demand and result in the migration of some ultra-deepwater rigs to work in
deepwater and, likewise, some deepwater rigs to compete against mid-water units. Various units across all segments could experience
lower utilization or idle time, and lower specification rigs could be cold stacked or scrapped.
See “— Contract Drilling Backlog” for future commitments of our rigs during 2014 through 2019.
22 DIAMOND OFFSHORE / 2013 ANNUAL REPORT

Contract Drilling Backlog
The following table reflects our contract drilling backlog as of February 5, 2014, October 23, 2013 (the date reported in our
Quarterly Report on Form 10-Q for the quarter ended September 30, 2013), and February 1, 2013 (the date reported in our Annual
Report on Form 10-K for the year ended December 31, 2012). Contract drilling backlog as presented below includes only firm
commitments (typically represented by signed contracts) and is calculated by multiplying the contracted operating dayrate by the firm
contract period and adding one-half of any potential rig performance bonuses. Our calculation also assumes full utilization of our drilling
equipment for the contract period (excluding scheduled shipyard and survey days); however, the amount of actual revenue earned and
the actual periods during which revenues are earned will be different than the amounts and periods shown in the tables below due to
various factors. Utilization rates, which generally approach 92-98% during contracted periods, can be adversely impacted by downtime
due to various operating factors including, but not limited to, weather conditions and unscheduled repairs and maintenance. Contract
drilling backlog excludes revenues for mobilization, demobilization, contract preparation and customer reimbursables. No revenue is
generally earned during periods of downtime for regulatory surveys. Changes in our contract drilling backlog between periods are a
function of the performance of work on term contracts, as well as the extension or modification of existing term contracts and the
execution of additional contracts.
February 5,2014
October 23,2013
February 1,2013
(In thousands)
Contract Drilling BacklogFloaters:
Ultra-Deepwater(1) . . . . . . . . . . . . . . . . . . . . . . . . . . . . . . . . . . . . . . . . . . . . . . . . . . . . . . . . . . . . . . . . . $4,111,000 $4,306,000 $4,422,000
Deepwater(2) . . . . . . . . . . . . . . . . . . . . . . . . . . . . . . . . . . . . . . . . . . . . . . . . . . . . . . . . . . . . . . . . . . . . . . 794,000 862,000 1,229,000
Mid-Water (3) . . . . . . . . . . . . . . . . . . . . . . . . . . . . . . . . . . . . . . . . . . . . . . . . . . . . . . . . . . . . . . . . . . . . . . 1,744,000 1,997,000 2,649,000
Total Floaters . . . . . . . . . . . . . . . . . . . . . . . . . . . . . . . . . . . . . . . . . . . . . . . . . . . . . . . . . . . . . . . . . . . . 6,649,000 7,165,000 8,300,000
Jack-ups . . . . . . . . . . . . . . . . . . . . . . . . . . . . . . . . . . . . . . . . . . . . . . . . . . . . . . . . . . . . . . . . . . . . . . . . . . . . . 180,000 188,000 272,000
Total . . . . . . . . . . . . . . . . . . . . . . . . . . . . . . . . . . . . . . . . . . . . . . . . . . . . . . . . . . . . . . . . . . . . . . . . . . . $6,829,000 $7,353,000 $8,572,000
(1) Contract drilling backlog as of February 5, 2014 for our ultra-deepwater floaters includes (i) $823.0 million attributable to our
contracted operations offshore Brazil for the years 2014 and 2015, (ii) $1.8 billion in the aggregate attributable to future work for
the Ocean BlackHawk and the Ocean BlackHornet for the years 2014 to 2019 and (iii) $641.0 million attributable to future work for
the Ocean GreatWhite, which is under construction, for the years 2016 to 2019.
(2) Contract drilling backlog as of February 5, 2014 for our deepwater floaters includes (i) $308.0 million attributable to our contracted
operations offshore Brazil for the years 2014 to 2016 and (ii) $36.0 million for the years 2014 to 2015 attributable to future work for
the Ocean Apex, which is under construction.
(3) Contract drilling backlog as of February 5, 2014 for our mid-water floaters includes $421.0 million attributable to our contracted
operations offshore Brazil for the years 2014 and 2015.
The following table reflects the amount of our contract drilling backlog by year as of February 5, 2014.
For the Years Ending December 31,
Total 2014(1) 2015 2016 2017–2019
(In thousands)
Contract Drilling BacklogFloaters:
Ultra-Deepwater(2) . . . . . . . . . . . . . . . . . . . . . . . . . . . . . . . . . . . . . . . . $4,111,000 $ 971,000 $1,198,000 $499,000 $1,443,000
Deepwater(3) . . . . . . . . . . . . . . . . . . . . . . . . . . . . . . . . . . . . . . . . . . . . . 794,000 516,000 216,000 62,000 —
Mid-Water(4) . . . . . . . . . . . . . . . . . . . . . . . . . . . . . . . . . . . . . . . . . . . . . . 1,744,000 999,000 471,000 159,000 115,000
Total Floaters . . . . . . . . . . . . . . . . . . . . . . . . . . . . . . . . . . . . . . . . . . . 6,649,000 2,486,000 1,885,000 720,000 1,558,000
Jack-ups . . . . . . . . . . . . . . . . . . . . . . . . . . . . . . . . . . . . . . . . . . . . . . . . . . 180,000 110,000 48,000 22,000 —
Total . . . . . . . . . . . . . . . . . . . . . . . . . . . . . . . . . . . . . . . . . . . . . . . . . . . $6,829,000 $2,596,000 $1,933,000 $742,000 $1,558,000
(1) Represents a twelve-month period beginning January 1, 2014.
(2) Contract drilling backlog as of February 5, 2014 for our ultra-deepwater floaters includes (i) $499.0 million and $324.0 million for the
years 2014 and 2015, respectively, attributable to our contracted operations offshore Brazil, (ii) $174.0 million, $361.0 million and
$362.0 million for the years 2014, 2015 and 2016, respectively, and $909.0 million in the aggregate for the years 2017 to 2019,
DIAMOND OFFSHORE / 2013 ANNUAL REPORT 23
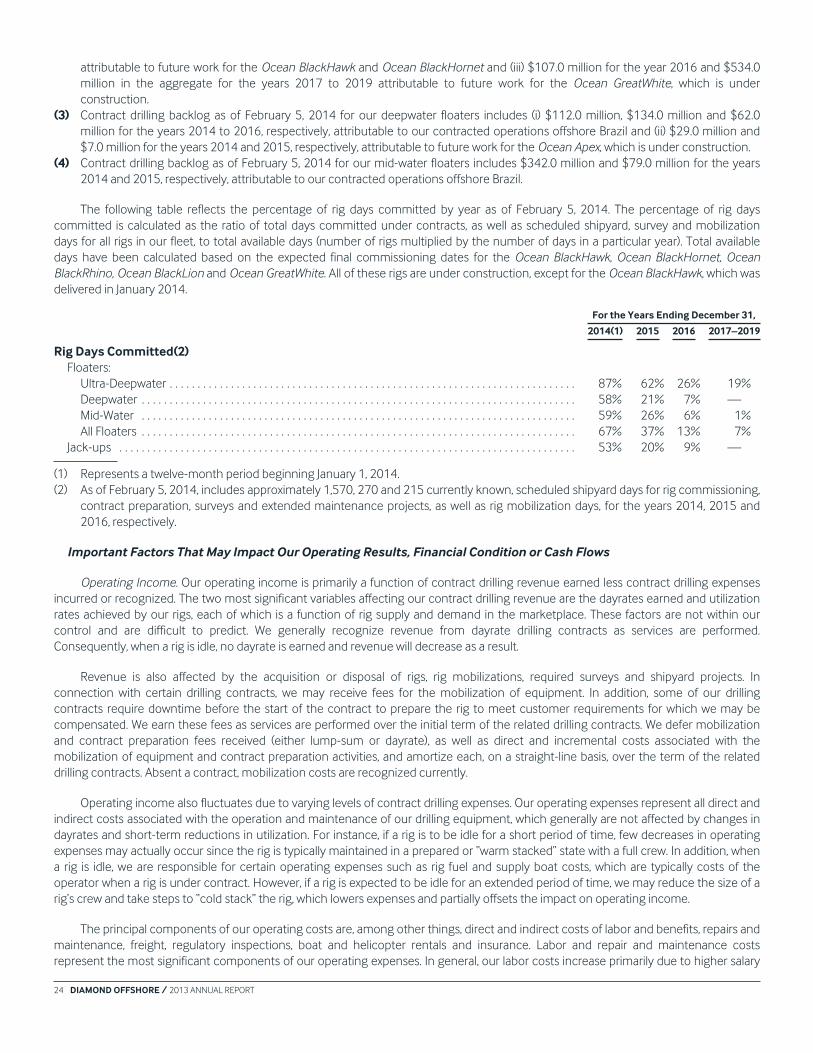
attributable to future work for the Ocean BlackHawk and Ocean BlackHornet and (iii) $107.0 million for the year 2016 and $534.0
million in the aggregate for the years 2017 to 2019 attributable to future work for the Ocean GreatWhite, which is under
construction.
(3) Contract drilling backlog as of February 5, 2014 for our deepwater floaters includes (i) $112.0 million, $134.0 million and $62.0
million for the years 2014 to 2016, respectively, attributable to our contracted operations offshore Brazil and (ii) $29.0 million and
$7.0 million for the years 2014 and 2015, respectively, attributable to future work for the Ocean Apex, which is under construction.
(4) Contract drilling backlog as of February 5, 2014 for our mid-water floaters includes $342.0 million and $79.0 million for the years
2014 and 2015, respectively, attributable to our contracted operations offshore Brazil.
The following table reflects the percentage of rig days committed by year as of February 5, 2014. The percentage of rig days
committed is calculated as the ratio of total days committed under contracts, as well as scheduled shipyard, survey and mobilization
days for all rigs in our fleet, to total available days (number of rigs multiplied by the number of days in a particular year). Total available
days have been calculated based on the expected final commissioning dates for the Ocean BlackHawk, Ocean BlackHornet, Ocean
BlackRhino, Ocean BlackLion and Ocean GreatWhite. All of these rigs are under construction, except for the Ocean BlackHawk, which was
delivered in January 2014.
For the Years Ending December 31,
2014(1) 2015 2016 2017–2019
Rig Days Committed(2)Floaters:
Ultra-Deepwater . . . . . . . . . . . . . . . . . . . . . . . . . . . . . . . . . . . . . . . . . . . . . . . . . . . . . . . . . . . . . . . . . . . . . . . . . 87% 62% 26% 19%
Deepwater . . . . . . . . . . . . . . . . . . . . . . . . . . . . . . . . . . . . . . . . . . . . . . . . . . . . . . . . . . . . . . . . . . . . . . . . . . . . . . 58% 21% 7% —
Mid-Water . . . . . . . . . . . . . . . . . . . . . . . . . . . . . . . . . . . . . . . . . . . . . . . . . . . . . . . . . . . . . . . . . . . . . . . . . . . . . . 59% 26% 6% 1%
All Floaters . . . . . . . . . . . . . . . . . . . . . . . . . . . . . . . . . . . . . . . . . . . . . . . . . . . . . . . . . . . . . . . . . . . . . . . . . . . . . . 67% 37% 13% 7%
Jack-ups . . . . . . . . . . . . . . . . . . . . . . . . . . . . . . . . . . . . . . . . . . . . . . . . . . . . . . . . . . . . . . . . . . . . . . . . . . . . . . . . . . 53% 20% 9% —
(1) Represents a twelve-month period beginning January 1, 2014.
(2) As of February 5, 2014, includes approximately 1,570, 270 and 215 currently known, scheduled shipyard days for rig commissioning,
contract preparation, surveys and extended maintenance projects, as well as rig mobilization days, for the years 2014, 2015 and
2016, respectively.
Important Factors That May Impact Our Operating Results, Financial Condition or Cash Flows
Operating Income. Our operating income is primarily a function of contract drilling revenue earned less contract drilling expenses
incurred or recognized. The two most significant variables affecting our contract drilling revenue are the dayrates earned and utilization
rates achieved by our rigs, each of which is a function of rig supply and demand in the marketplace. These factors are not within our
control and are difficult to predict. We generally recognize revenue from dayrate drilling contracts as services are performed.
Consequently, when a rig is idle, no dayrate is earned and revenue will decrease as a result.
Revenue is also affected by the acquisition or disposal of rigs, rig mobilizations, required surveys and shipyard projects. In
connection with certain drilling contracts, we may receive fees for the mobilization of equipment. In addition, some of our drilling
contracts require downtime before the start of the contract to prepare the rig to meet customer requirements for which we may be
compensated. We earn these fees as services are performed over the initial term of the related drilling contracts. We defer mobilization
and contract preparation fees received (either lump-sum or dayrate), as well as direct and incremental costs associated with the
mobilization of equipment and contract preparation activities, and amortize each, on a straight-line basis, over the term of the related
drilling contracts. Absent a contract, mobilization costs are recognized currently.
Operating income also fluctuates due to varying levels of contract drilling expenses. Our operating expenses represent all direct and
indirect costs associated with the operation and maintenance of our drilling equipment, which generally are not affected by changes in
dayrates and short-term reductions in utilization. For instance, if a rig is to be idle for a short period of time, few decreases in operating
expenses may actually occur since the rig is typically maintained in a prepared or “warm stacked” state with a full crew. In addition, when
a rig is idle, we are responsible for certain operating expenses such as rig fuel and supply boat costs, which are typically costs of the
operator when a rig is under contract. However, if a rig is expected to be idle for an extended period of time, we may reduce the size of a
rig’s crew and take steps to “cold stack” the rig, which lowers expenses and partially offsets the impact on operating income.
The principal components of our operating costs are, among other things, direct and indirect costs of labor and benefits, repairs and
maintenance, freight, regulatory inspections, boat and helicopter rentals and insurance. Labor and repair and maintenance costs
represent the most significant components of our operating expenses. In general, our labor costs increase primarily due to higher salary
24 DIAMOND OFFSHORE / 2013 ANNUAL REPORT

levels, rig staffing requirements and costs associated with labor regulations in the geographic regions in which our rigs operate. In
addition, the costs associated with training new and seasoned employees can be significant. We expect our labor and training costs to
increase in 2014 as a result of increased hiring and training activities as we continue the process of crewing our three remaining drillships
under construction, the ultra-deepwater Ocean GreatWhite and the deepwater Ocean Apex. Costs to repair and maintain our equipment
fluctuate depending upon the type of activity the drilling unit is performing, as well as the age and condition of the equipment and the
regions in which our rigs are working.
Regulatory Surveys and Planned Downtime. Our operating income is negatively impacted when we perform certain regulatory
inspections, which we refer to as a 5-year survey, or special survey, that are due every five years for each of our rigs. Operating revenue
decreases because these special surveys are generally performed during scheduled downtime in a shipyard. Operating expenses
increase as a result of these special surveys due to the cost to mobilize the rigs to a shipyard, inspection costs incurred and repair and
maintenance costs, which are recognized as incurred. Repair and maintenance activities may result from the special survey or may have
been previously planned to take place during this mandatory downtime. The number of rigs undergoing a 5-year survey will vary from
year to year, as well as from quarter to quarter.
In addition, operating income may also be negatively impacted by intermediate surveys, which are performed at interim periods
between 5-year surveys. Intermediate surveys are generally less extensive in duration and scope than a 5-year survey. Although an
intermediate survey may require some downtime for the drilling rig, it normally does not require dry-docking or shipyard time, except for
rigs located in the U.K. and Norwegian sectors of the North Sea.
During 2014, six of our rigs will require 5-year surveys and another three rigs will complete surveys that commenced in 2013. We
expect these nine rigs to be out of service for approximately 380 days in the aggregate. We also expect to spend an additional
approximately 670 days during 2014 for intermediate surveys, the mobilization of rigs, contract acceptance testing and extended
maintenance projects, including contract preparation work for the Ocean Endeavor (approximately 162 days) and North Sea
enhancements for the Ocean Patriot (approximately 165 days). The service-life-extension project for the Ocean Confidence is expected
to commence late in the first quarter of 2014, and the rig will be out of service for the balance of the year (approximately 290 days). We
can provide no assurance as to the exact timing and/or duration of downtime associated with regulatory inspections, planned rig
mobilizations and other shipyard projects. See “— Market Overview — Contract Drilling Backlog.”
Physical Damage and Marine Liability Insurance. We are self-insured for physical damage to rigs and equipment caused by named
windstorms in the U.S. Gulf of Mexico. If a named windstorm in the U.S. Gulf of Mexico causes significant damage to our rigs or
equipment, it could have a material adverse effect on our financial condition, results of operations and cash flows. Under our insurance
policy that expires on May 1, 2014, we carry physical damage insurance for certain losses other than those caused by named windstorms
in the U.S. Gulf of Mexico for which our deductible for physical damage is $25.0 million per occurrence. We do not typically retain loss-of-
hire insurance policies to cover our rigs.
In addition, under our current insurance policy, we carry marine liability insurance covering certain legal liabilities, including coverage for
certain personal injury claims, with no exclusions for pollution and/or environmental risk. We believe that the policy limit for our marine
liability insurance is within the range that is customary for companies of our size in the offshore drilling industry and is appropriate for our
business. Our deductibles for marine liability coverage, including for personal injury claims, are $10.0 million for the first occurrence and vary
in amounts ranging between $5.0 million and, if aggregate claims exceed certain thresholds, up to $100.0 million for each subsequent
occurrence, depending on the nature, severity and frequency of claims which might arise during the policy year.
Construction and Capital Upgrade Projects. We capitalize interest cost for the construction and upgrade of qualifying assets in
accordance with accounting principles generally accepted in the U.S., or GAAP. The period of interest capitalization covers the duration
of the activities required to make the asset ready for its intended use, and the capitalization period ends when the asset is substantially
complete and ready for its intended use, which is expected to continue after delivery of the rigs from the shipyard and until the user
acceptance phase of each project is completed. For the year ended December 31, 2013, we capitalized interest of $74.2 million on
qualifying expenditures, primarily related to the construction of our four new drillships, the Ocean GreatWhite, the Ocean Onyx and the
Ocean Apex. We will continue capitalizing interest on qualifying expenditures during 2014, which will no longer include expenditures
related to the Ocean Onyx, which was completed in December 2013, and will include a limited interest capitalization period for the
Ocean BlackHawk, which departed for the GOM in February 2014.
Critical Accounting Estimates
Our significant accounting policies are included in Note 1 “General Information” to our Consolidated Financial Statements in Item 8
of this report. Judgments, assumptions and estimates by our management are inherent in the preparation of our financial statements
and the application of our significant accounting policies. We believe that our most critical accounting estimates are as follows:
DIAMOND OFFSHORE / 2013 ANNUAL REPORT 25
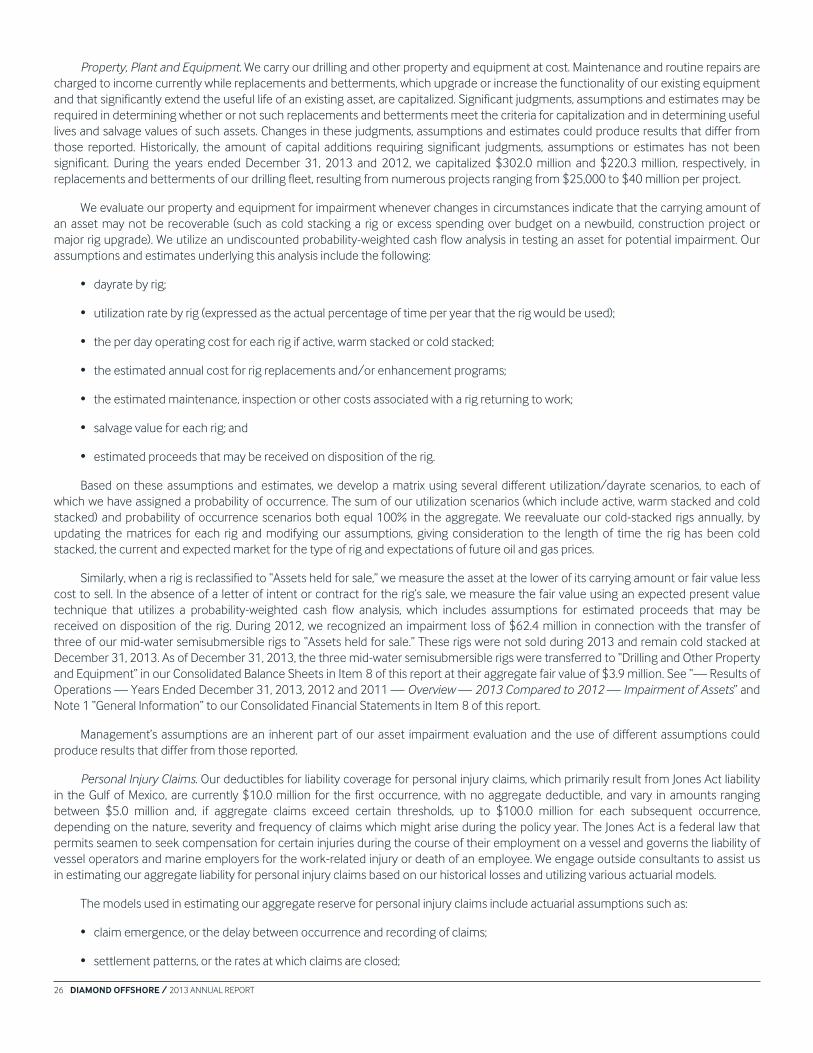
Property, Plant and Equipment. We carry our drilling and other property and equipment at cost. Maintenance and routine repairs are
charged to income currently while replacements and betterments, which upgrade or increase the functionality of our existing equipment
and that significantly extend the useful life of an existing asset, are capitalized. Significant judgments, assumptions and estimates may be
required in determining whether or not such replacements and betterments meet the criteria for capitalization and in determining useful
lives and salvage values of such assets. Changes in these judgments, assumptions and estimates could produce results that differ from
those reported. Historically, the amount of capital additions requiring significant judgments, assumptions or estimates has not been
significant. During the years ended December 31, 2013 and 2012, we capitalized $302.0 million and $220.3 million, respectively, in
replacements and betterments of our drilling fleet, resulting from numerous projects ranging from $25,000 to $40 million per project.
We evaluate our property and equipment for impairment whenever changes in circumstances indicate that the carrying amount of
an asset may not be recoverable (such as cold stacking a rig or excess spending over budget on a newbuild, construction project or
major rig upgrade). We utilize an undiscounted probability-weighted cash flow analysis in testing an asset for potential impairment. Our
assumptions and estimates underlying this analysis include the following:
• dayrate by rig;
• utilization rate by rig (expressed as the actual percentage of time per year that the rig would be used);
• the per day operating cost for each rig if active, warm stacked or cold stacked;
• the estimated annual cost for rig replacements and/or enhancement programs;
• the estimated maintenance, inspection or other costs associated with a rig returning to work;
• salvage value for each rig; and
• estimated proceeds that may be received on disposition of the rig.
Based on these assumptions and estimates, we develop a matrix using several different utilization/dayrate scenarios, to each of
which we have assigned a probability of occurrence. The sum of our utilization scenarios (which include active, warm stacked and cold
stacked) and probability of occurrence scenarios both equal 100% in the aggregate. We reevaluate our cold-stacked rigs annually, by
updating the matrices for each rig and modifying our assumptions, giving consideration to the length of time the rig has been cold
stacked, the current and expected market for the type of rig and expectations of future oil and gas prices.
Similarly, when a rig is reclassified to “Assets held for sale,” we measure the asset at the lower of its carrying amount or fair value less
cost to sell. In the absence of a letter of intent or contract for the rig’s sale, we measure the fair value using an expected present value
technique that utilizes a probability-weighted cash flow analysis, which includes assumptions for estimated proceeds that may be
received on disposition of the rig. During 2012, we recognized an impairment loss of $62.4 million in connection with the transfer of
three of our mid-water semisubmersible rigs to “Assets held for sale.” These rigs were not sold during 2013 and remain cold stacked at
December 31, 2013. As of December 31, 2013, the three mid-water semisubmersible rigs were transferred to “Drilling and Other Property
and Equipment” in our Consolidated Balance Sheets in Item 8 of this report at their aggregate fair value of $3.9 million. See “— Results of
Operations — Years Ended December 31, 2013, 2012 and 2011 — Overview — 2013 Compared to 2012 — Impairment of Assets” and
Note 1 “General Information” to our Consolidated Financial Statements in Item 8 of this report.
Management’s assumptions are an inherent part of our asset impairment evaluation and the use of different assumptions could
produce results that differ from those reported.
Personal Injury Claims. Our deductibles for liability coverage for personal injury claims, which primarily result from Jones Act liability
in the Gulf of Mexico, are currently $10.0 million for the first occurrence, with no aggregate deductible, and vary in amounts ranging
between $5.0 million and, if aggregate claims exceed certain thresholds, up to $100.0 million for each subsequent occurrence,
depending on the nature, severity and frequency of claims which might arise during the policy year. The Jones Act is a federal law that
permits seamen to seek compensation for certain injuries during the course of their employment on a vessel and governs the liability of
vessel operators and marine employers for the work-related injury or death of an employee. We engage outside consultants to assist us
in estimating our aggregate liability for personal injury claims based on our historical losses and utilizing various actuarial models.
The models used in estimating our aggregate reserve for personal injury claims include actuarial assumptions such as:
• claim emergence, or the delay between occurrence and recording of claims;
• settlement patterns, or the rates at which claims are closed;
26 DIAMOND OFFSHORE / 2013 ANNUAL REPORT

• development patterns, or the rate at which known cases develop to their ultimate level;
• average, potential frequency and severity of claims; and
• effect of re-opened claims.
The eventual settlement or adjudication of these claims could differ materially from our estimated amounts due to uncertainties
such as:
• the severity of personal injuries claimed;
• significant changes in the volume of personal injury claims;
• the unpredictability of legal jurisdictions where the claims will ultimately be litigated;
• inconsistent court decisions; and
• the risks and lack of predictability inherent in personal injury litigation.
Income Taxes. We account for income taxes in accordance with accounting standards that require the recognition of the amount of
taxes payable or refundable for the current year and an asset and liability approach in recognizing the amount of deferred tax liabilities
and assets for the future tax consequences of events that have been currently recognized in our financial statements or tax returns. In
each of our tax jurisdictions we recognize a current tax liability or asset for the estimated taxes payable or refundable on tax returns for
the current year and a deferred tax asset or liability for the estimated future tax effects attributable to temporary differences and
carryforwards. Deferred tax assets are reduced by a valuation allowance, if necessary, which is determined by the amount of any tax
benefits that, based on available evidence, are not expected to be realized under a “more likely than not” approach. We do not establish
deferred tax liabilities for certain of our foreign earnings that we intend to indefinitely reinvest to finance foreign activities. However, if
these earnings become subject to U.S. federal tax, any required provision could have a material adverse impact on our financial results.
We make judgments regarding future events and related estimates especially as they pertain to the forecasting of our effective tax rate,
the potential realization of deferred tax assets such as utilization of foreign tax credits, and exposure to the disallowance of items
deducted on tax returns upon audit.
Certain of our international rigs are owned and operated, directly or indirectly, by Diamond Offshore International Limited, or DOIL, a
Cayman Islands subsidiary which we wholly own. It is our intention to indefinitely reinvest future earnings of DOIL and its foreign
subsidiaries to finance foreign activities. Accordingly, we have not made a provision for U.S. income taxes on approximately $2.4 billion of
undistributed foreign earnings and profits. Although we do not intend to repatriate the earnings of DOIL and have not provided U.S.
income taxes for such earnings, except to the extent that such earnings were immediately subject to U.S. income taxes, these earnings
could become subject to U.S. income tax if remitted, or if deemed remitted as a dividend; however, it is not practicable to estimate this
potential liability.
In several of the international locations in which we operate, certain of our wholly-owned subsidiaries enter into agreements with
other of our wholly-owned subsidiaries to provide specialized services and equipment in support of our foreign operations. We apply a
transfer pricing methodology to determine the amount to be charged for providing the services and equipment, and utilize outside
consultants to assist us in the development of such transfer pricing methodologies. In most cases, there are alternative transfer pricing
methodologies that could be applied to these transactions and, if applied, could result in different chargeable amounts.
Results of Operations
Although we perform contract drilling services with different types of drilling rigs and in many geographic locations, there is a
similarity of economic characteristics due to the nature of the revenue earning process as it relates to the offshore drilling industry, over
the operating lives of our drilling rigs. We believe that the combination of our drilling rigs into one reportable segment is the appropriate
aggregation in accordance with applicable accounting standards on segment reporting. However, for purposes of this discussion and
analysis of our results of operations, we provide greater detail with respect to the types of rigs in our fleet to enhance the reader’s
understanding of our financial condition, changes in financial condition and results of operations.
DIAMOND OFFSHORE / 2013 ANNUAL REPORT 27

Key performance indicators by equipment type are listed below.
Year Ended December 31,
2013 2012 2011
REVENUE EARNING DAYS(1)Floaters:
Ultra-Deepwater . . . . . . . . . . . . . . . . . . . . . . . . . . . . . . . . . . . . . . . . . . . . . . . . . . . . . . . . . . . . . . . . . . . . . . . . 2,392 2,475 2,387
Deepwater . . . . . . . . . . . . . . . . . . . . . . . . . . . . . . . . . . . . . . . . . . . . . . . . . . . . . . . . . . . . . . . . . . . . . . . . . . . . . 1,530 1,605 1,718
Mid-Water . . . . . . . . . . . . . . . . . . . . . . . . . . . . . . . . . . . . . . . . . . . . . . . . . . . . . . . . . . . . . . . . . . . . . . . . . . . . . . 4,186 4,639 5,254
Jack-ups(2) . . . . . . . . . . . . . . . . . . . . . . . . . . . . . . . . . . . . . . . . . . . . . . . . . . . . . . . . . . . . . . . . . . . . . . . . . . . . . . . 1,949 1,753 2,218
UTILIZATION(3)Floaters:
Ultra-Deepwater . . . . . . . . . . . . . . . . . . . . . . . . . . . . . . . . . . . . . . . . . . . . . . . . . . . . . . . . . . . . . . . . . . . . . . . . 82% 85% 82%
Deepwater . . . . . . . . . . . . . . . . . . . . . . . . . . . . . . . . . . . . . . . . . . . . . . . . . . . . . . . . . . . . . . . . . . . . . . . . . . . . . 84% 88% 94%
Mid-Water . . . . . . . . . . . . . . . . . . . . . . . . . . . . . . . . . . . . . . . . . . . . . . . . . . . . . . . . . . . . . . . . . . . . . . . . . . . . . . 64% 68% 72%
Jack-ups(4) . . . . . . . . . . . . . . . . . . . . . . . . . . . . . . . . . . . . . . . . . . . . . . . . . . . . . . . . . . . . . . . . . . . . . . . . . . . . . . . 76% 53% 47%
AVERAGE DAILY REVENUE(5)Floaters:
Ultra-Deepwater . . . . . . . . . . . . . . . . . . . . . . . . . . . . . . . . . . . . . . . . . . . . . . . . . . . . . . . . . . . . . . . . . . . . . . . . $344,200 $354,900 $342,900
Deepwater . . . . . . . . . . . . . . . . . . . . . . . . . . . . . . . . . . . . . . . . . . . . . . . . . . . . . . . . . . . . . . . . . . . . . . . . . . . . . 403,100 368,800 416,500
Mid-Water . . . . . . . . . . . . . . . . . . . . . . . . . . . . . . . . . . . . . . . . . . . . . . . . . . . . . . . . . . . . . . . . . . . . . . . . . . . . . . 275,700 263,600 269,600
Jack-ups . . . . . . . . . . . . . . . . . . . . . . . . . . . . . . . . . . . . . . . . . . . . . . . . . . . . . . . . . . . . . . . . . . . . . . . . . . . . . . . . . . 88,600 90,200 81,900
(1) A revenue earning day is defined as a 24-hour period during which a rig earns a dayrate after commencement of operations and
excludes mobilization, demobilization and contract preparation days.
(2) Revenue earning days for the years ended December 31, 2012 and 2011 included approximately 87 days and 720 days,
respectively, earned by certain of our jack-up rigs during the respective period prior to being sold in 2012.
(3) Utilization is calculated as the ratio of total revenue-earning days divided by the total calendar days in the period for all of the
specified rigs in our fleet (including cold-stacked rigs).
(4) Utilization for our jack-up rigs would have been 87% and 59% for the years ended December 31, 2012 and 2011, respectively,
excluding revenue earning days and total calendar days associated with rigs that we sold in 2012.
(5) Average daily revenue is defined as contract drilling revenue for all of the specified rigs in our fleet (excluding revenues for
mobilization, demobilization and contract preparation) per revenue earning day.
28 DIAMOND OFFSHORE / 2013 ANNUAL REPORT
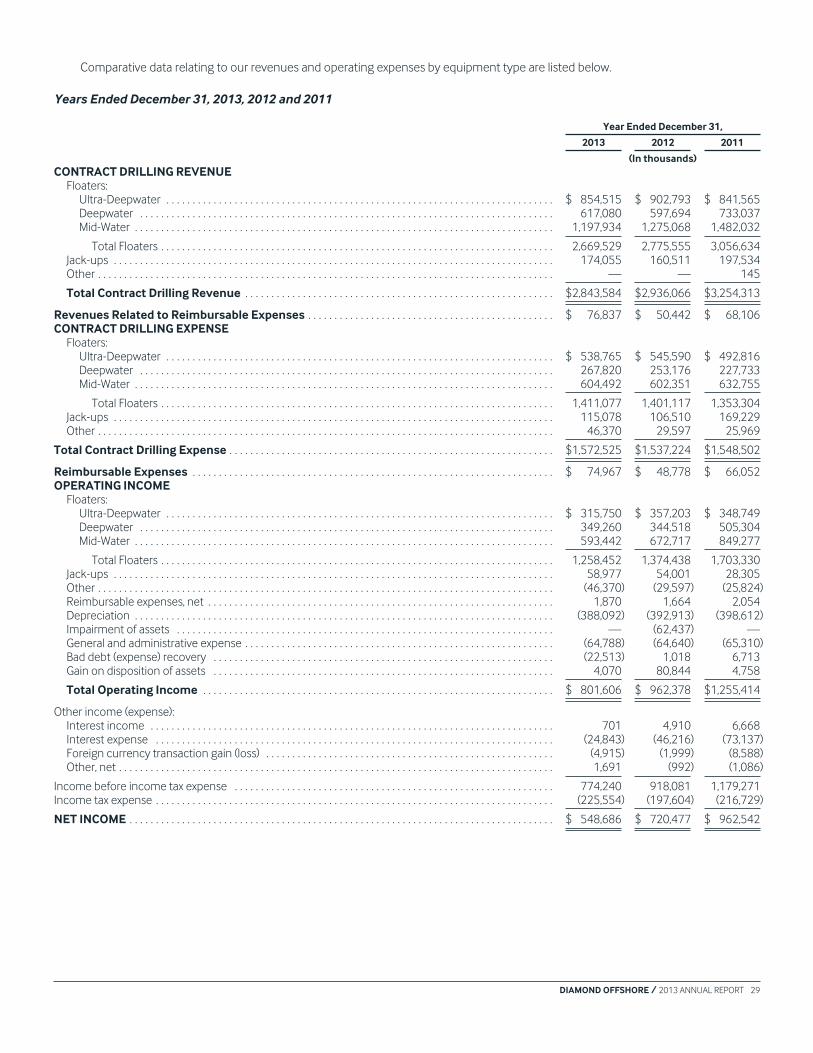
Comparative data relating to our revenues and operating expenses by equipment type are listed below.
Years Ended December 31, 2013, 2012 and 2011
Year Ended December 31,
2013 2012 2011
(In thousands)CONTRACT DRILLING REVENUE
Floaters:
Ultra-Deepwater . . . . . . . . . . . . . . . . . . . . . . . . . . . . . . . . . . . . . . . . . . . . . . . . . . . . . . . . . . . . . . . . . . . . . . . . . . $ 854,515 $ 902,793 $ 841,565
Deepwater . . . . . . . . . . . . . . . . . . . . . . . . . . . . . . . . . . . . . . . . . . . . . . . . . . . . . . . . . . . . . . . . . . . . . . . . . . . . . . . 617,080 597,694 733,037
Mid-Water . . . . . . . . . . . . . . . . . . . . . . . . . . . . . . . . . . . . . . . . . . . . . . . . . . . . . . . . . . . . . . . . . . . . . . . . . . . . . . . . 1,197,934 1,275,068 1,482,032
Total Floaters . . . . . . . . . . . . . . . . . . . . . . . . . . . . . . . . . . . . . . . . . . . . . . . . . . . . . . . . . . . . . . . . . . . . . . . . . . . 2,669,529 2,775,555 3,056,634
Jack-ups . . . . . . . . . . . . . . . . . . . . . . . . . . . . . . . . . . . . . . . . . . . . . . . . . . . . . . . . . . . . . . . . . . . . . . . . . . . . . . . . . . . . 174,055 160,511 197,534
Other . . . . . . . . . . . . . . . . . . . . . . . . . . . . . . . . . . . . . . . . . . . . . . . . . . . . . . . . . . . . . . . . . . . . . . . . . . . . . . . . . . . . . . . — — 145
Total Contract Drilling Revenue . . . . . . . . . . . . . . . . . . . . . . . . . . . . . . . . . . . . . . . . . . . . . . . . . . . . . . . . . . . $2,843,584 $2,936,066 $3,254,313
Revenues Related to Reimbursable Expenses . . . . . . . . . . . . . . . . . . . . . . . . . . . . . . . . . . . . . . . . . . . . . . . $ 76,837 $ 50,442 $ 68,106
CONTRACT DRILLING EXPENSEFloaters:
Ultra-Deepwater . . . . . . . . . . . . . . . . . . . . . . . . . . . . . . . . . . . . . . . . . . . . . . . . . . . . . . . . . . . . . . . . . . . . . . . . . . $ 538,765 $ 545,590 $ 492,816
Deepwater . . . . . . . . . . . . . . . . . . . . . . . . . . . . . . . . . . . . . . . . . . . . . . . . . . . . . . . . . . . . . . . . . . . . . . . . . . . . . . . 267,820 253,176 227,733
Mid-Water . . . . . . . . . . . . . . . . . . . . . . . . . . . . . . . . . . . . . . . . . . . . . . . . . . . . . . . . . . . . . . . . . . . . . . . . . . . . . . . . 604,492 602,351 632,755
Total Floaters . . . . . . . . . . . . . . . . . . . . . . . . . . . . . . . . . . . . . . . . . . . . . . . . . . . . . . . . . . . . . . . . . . . . . . . . . . . 1,411,077 1,401,117 1,353,304
Jack-ups . . . . . . . . . . . . . . . . . . . . . . . . . . . . . . . . . . . . . . . . . . . . . . . . . . . . . . . . . . . . . . . . . . . . . . . . . . . . . . . . . . . . 115,078 106,510 169,229
Other . . . . . . . . . . . . . . . . . . . . . . . . . . . . . . . . . . . . . . . . . . . . . . . . . . . . . . . . . . . . . . . . . . . . . . . . . . . . . . . . . . . . . . . 46,370 29,597 25,969
Total Contract Drilling Expense . . . . . . . . . . . . . . . . . . . . . . . . . . . . . . . . . . . . . . . . . . . . . . . . . . . . . . . . . . . . . . $1,572,525 $1,537,224 $1,548,502
Reimbursable Expenses . . . . . . . . . . . . . . . . . . . . . . . . . . . . . . . . . . . . . . . . . . . . . . . . . . . . . . . . . . . . . . . . . . . . . $ 74,967 $ 48,778 $ 66,052
OPERATING INCOMEFloaters:
Ultra-Deepwater . . . . . . . . . . . . . . . . . . . . . . . . . . . . . . . . . . . . . . . . . . . . . . . . . . . . . . . . . . . . . . . . . . . . . . . . . . $ 315,750 $ 357,203 $ 348,749
Deepwater . . . . . . . . . . . . . . . . . . . . . . . . . . . . . . . . . . . . . . . . . . . . . . . . . . . . . . . . . . . . . . . . . . . . . . . . . . . . . . . 349,260 344,518 505,304
Mid-Water . . . . . . . . . . . . . . . . . . . . . . . . . . . . . . . . . . . . . . . . . . . . . . . . . . . . . . . . . . . . . . . . . . . . . . . . . . . . . . . . 593,442 672,717 849,277
Total Floaters . . . . . . . . . . . . . . . . . . . . . . . . . . . . . . . . . . . . . . . . . . . . . . . . . . . . . . . . . . . . . . . . . . . . . . . . . . . 1,258,452 1,374,438 1,703,330
Jack-ups . . . . . . . . . . . . . . . . . . . . . . . . . . . . . . . . . . . . . . . . . . . . . . . . . . . . . . . . . . . . . . . . . . . . . . . . . . . . . . . . . . . . 58,977 54,001 28,305
Other . . . . . . . . . . . . . . . . . . . . . . . . . . . . . . . . . . . . . . . . . . . . . . . . . . . . . . . . . . . . . . . . . . . . . . . . . . . . . . . . . . . . . . . (46,370) (29,597) (25,824)
Reimbursable expenses, net . . . . . . . . . . . . . . . . . . . . . . . . . . . . . . . . . . . . . . . . . . . . . . . . . . . . . . . . . . . . . . . . . . 1,870 1,664 2,054
Depreciation . . . . . . . . . . . . . . . . . . . . . . . . . . . . . . . . . . . . . . . . . . . . . . . . . . . . . . . . . . . . . . . . . . . . . . . . . . . . . . . . (388,092) (392,913) (398,612)
Impairment of assets . . . . . . . . . . . . . . . . . . . . . . . . . . . . . . . . . . . . . . . . . . . . . . . . . . . . . . . . . . . . . . . . . . . . . . . . — (62,437) —
General and administrative expense . . . . . . . . . . . . . . . . . . . . . . . . . . . . . . . . . . . . . . . . . . . . . . . . . . . . . . . . . . . (64,788) (64,640) (65,310)
Bad debt (expense) recovery . . . . . . . . . . . . . . . . . . . . . . . . . . . . . . . . . . . . . . . . . . . . . . . . . . . . . . . . . . . . . . . . . (22,513) 1,018 6,713
Gain on disposition of assets . . . . . . . . . . . . . . . . . . . . . . . . . . . . . . . . . . . . . . . . . . . . . . . . . . . . . . . . . . . . . . . . . 4,070 80,844 4,758
Total Operating Income . . . . . . . . . . . . . . . . . . . . . . . . . . . . . . . . . . . . . . . . . . . . . . . . . . . . . . . . . . . . . . . . . . . $ 801,606 $ 962,378 $1,255,414
Other income (expense):
Interest income . . . . . . . . . . . . . . . . . . . . . . . . . . . . . . . . . . . . . . . . . . . . . . . . . . . . . . . . . . . . . . . . . . . . . . . . . . . . . 701 4,910 6,668
Interest expense . . . . . . . . . . . . . . . . . . . . . . . . . . . . . . . . . . . . . . . . . . . . . . . . . . . . . . . . . . . . . . . . . . . . . . . . . . . . (24,843) (46,216) (73,137)
Foreign currency transaction gain (loss) . . . . . . . . . . . . . . . . . . . . . . . . . . . . . . . . . . . . . . . . . . . . . . . . . . . . . . . (4,915) (1,999) (8,588)
Other, net . . . . . . . . . . . . . . . . . . . . . . . . . . . . . . . . . . . . . . . . . . . . . . . . . . . . . . . . . . . . . . . . . . . . . . . . . . . . . . . . . . . 1,691 (992) (1,086)
Income before income tax expense . . . . . . . . . . . . . . . . . . . . . . . . . . . . . . . . . . . . . . . . . . . . . . . . . . . . . . . . . . . . . 774,240 918,081 1,179,271
Income tax expense . . . . . . . . . . . . . . . . . . . . . . . . . . . . . . . . . . . . . . . . . . . . . . . . . . . . . . . . . . . . . . . . . . . . . . . . . . . . (225,554) (197,604) (216,729)
NET INCOME . . . . . . . . . . . . . . . . . . . . . . . . . . . . . . . . . . . . . . . . . . . . . . . . . . . . . . . . . . . . . . . . . . . . . . . . . . . . . . . . . $ 548,686 $ 720,477 $ 962,542
DIAMOND OFFSHORE / 2013 ANNUAL REPORT 29
The following is a summary of the most significant transfers of our rigs during 2011, 2012 and 2013 between the geographic areas
in which we operate:
Rig Rig Type Relocation Details Date
Floaters:Ocean Monarch . . . . . . . . . . . . . . . . . . . . . . . . . . . . Ultra-Deepwater GOM to Vietnam September 2011
Ocean Monarch . . . . . . . . . . . . . . . . . . . . . . . . . . . . Ultra-Deepwater Vietnam to Singapore (shipyard survey) August 2012
Ocean Confidence . . . . . . . . . . . . . . . . . . . . . . . . . Ultra-Deepwater Congo to Angola January 2013
Ocean America . . . . . . . . . . . . . . . . . . . . . . . . . . . . . Deepwater Australia to Singapore (shipyard survey) July 2013
Ocean Valiant . . . . . . . . . . . . . . . . . . . . . . . . . . . . . . Deepwater Cameroon to Canary Islands (shipyard survey) October 2013
Ocean America . . . . . . . . . . . . . . . . . . . . . . . . . . . . . Deepwater Singapore to Australia November 2013
Ocean Epoch . . . . . . . . . . . . . . . . . . . . . . . . . . . . . . Mid-Water Malaysia (a) February 2011
Ocean Yorktown . . . . . . . . . . . . . . . . . . . . . . . . . . . Mid-Water Brazil to GOM August 2011
Ocean Yorktown . . . . . . . . . . . . . . . . . . . . . . . . . . . Mid-Water GOM to Mexico December 2011
Ocean Guardian . . . . . . . . . . . . . . . . . . . . . . . . . . . . Mid-Water Falkland Islands to U.K. January 2012
Ocean Saratoga . . . . . . . . . . . . . . . . . . . . . . . . . . . . Mid-Water GOM to Guyana January 2012
Ocean Saratoga . . . . . . . . . . . . . . . . . . . . . . . . . . . . Mid-Water Guyana to GOM May 2012
Ocean Whittington . . . . . . . . . . . . . . . . . . . . . . . . . Mid-Water Brazil to GOM (a) May 2012
Ocean Apex . . . . . . . . . . . . . . . . . . . . . . . . . . . . . . . . Mid-Water Singapore shipyard (b ) September 2012
Ocean Ambassador . . . . . . . . . . . . . . . . . . . . . . . . . Mid-Water Brazil to GOM October 2012
Ocean Lexington . . . . . . . . . . . . . . . . . . . . . . . . . . . Mid-Water Brazil to Trinidad March 2013
Ocean Patriot . . . . . . . . . . . . . . . . . . . . . . . . . . . . . . Mid-Water Vietnam to Philippines May 2013
Ocean Saratoga . . . . . . . . . . . . . . . . . . . . . . . . . . . . Mid-Water GOM to Nicaragua August 2013
Ocean Quest . . . . . . . . . . . . . . . . . . . . . . . . . . . . . . . Mid-Water Brazil to Malaysia November 2013
Ocean Patriot . . . . . . . . . . . . . . . . . . . . . . . . . . . . . . Mid-Water Philippines to Singapore (shipyard upgrade) November 2013
Ocean Saratoga . . . . . . . . . . . . . . . . . . . . . . . . . . . . Mid-Water Nicaragua to GOM December 2013
Jack-ups:Ocean Scepter . . . . . . . . . . . . . . . . . . . . . . . . . . . . . Jack-up Brazil to GOM October 2011
Ocean Titan . . . . . . . . . . . . . . . . . . . . . . . . . . . . . . . . Jack-up GOM to Mexico November 2011
Ocean Scepter . . . . . . . . . . . . . . . . . . . . . . . . . . . . . Jack-up GOM to Mexico December 2011
Ocean Columbia . . . . . . . . . . . . . . . . . . . . . . . . . . . Jack-up Sold March 2012
Ocean Heritage . . . . . . . . . . . . . . . . . . . . . . . . . . . . Jack-up Sold April 2012
Ocean Drake . . . . . . . . . . . . . . . . . . . . . . . . . . . . . . . Jack-up Sold May 2012
Ocean Champion . . . . . . . . . . . . . . . . . . . . . . . . . . . Jack-up Sold May 2012
Ocean Crusader . . . . . . . . . . . . . . . . . . . . . . . . . . . . Jack-up Sold May 2012
Ocean Sovereign . . . . . . . . . . . . . . . . . . . . . . . . . . . Jack-up Sold June 2012
Ocean Spur . . . . . . . . . . . . . . . . . . . . . . . . . . . . . . . . Jack-up Egypt to Ecuador; two year bareboat charter August 2012
Ocean Spartan . . . . . . . . . . . . . . . . . . . . . . . . . . . . . Jack-up GOM (a) (c) December 2012
Ocean King . . . . . . . . . . . . . . . . . . . . . . . . . . . . . . . . Jack-up Montenegro to GOM December 2012
(a) Rig is cold stacked.
(b) Rig formerly operated as the Ocean Bounty and was cold stacked in July 2009. Rig has been used in the construction of a
deepwater floater, the Ocean Apex, in Singapore.
(c) Rig held for sale at December 31, 2013.
Overview
Customer Credit Issues
During 2013, based on our assessment of the financial condition of two of our customers, Niko Resources Ltd., or Niko, and OGX
Petróleo e Gás Ltda., or OGX, and our expectations regarding the probability of collection of amounts due to us from them, we recorded
$22.5 million in bad debt expense to fully reserve all outstanding receivables they owed us at June 30, 2013. In addition, during the
second half of 2013, a total of four of our rigs were contracted to Niko and OGX, for an aggregate 337 revenue earning days during the
period. We did not recognize revenue associated with these revenue earning days due to our assessment that collection of the amounts
due was not reasonably assured, resulting in the “unrecognized revenue” referred to below.
In December 2013, we entered into a settlement agreement with Niko, which we refer to as the Settlement Agreement, whereby
Niko will be released from certain obligations under the dayrate contracts for the Ocean Monarch and Ocean Lexington, subject to and
effective upon the full payment of amounts owed to us under the Settlement Agreement and subject to its other conditions. In
30 DIAMOND OFFSHORE / 2013 ANNUAL REPORT

accordance with the terms of the Settlement Agreement, we received $25.0 million in cash during the fourth quarter of 2013, which we
recognized as revenue against invoices due to us. Niko is further obligated to make future periodic payments to us pursuant to the
Settlement Agreement totaling an aggregate of $55.0 million, payable at various times through September 2017. We plan to recognize
these amounts in revenue as they are received due to the uncertainty regarding their timing and collection.
The following table sets forth the number of revenue earning days, the unrecognized revenue and the incremental effect on our
historical results of operations for the comparative years ended December 31, 2013 and 2012 associated with the four rigs contracted to
Niko or OGX during the second half of 2013 as discussed above:
For the Year Ended December 31, 2013
Rig Type
RevenueRecognized
in 2012
RevenueEarningDays (a)
PotentialRevenue (b)
UnrecognizedRevenue (c)
RevenueRecognized
Variance inRevenue
Recognized (d)
(In millions, except number of days)
Ultra-Deepwater Floater . . . . . . . . . . . . . . . . . . . . . . . . . . . . . . $127.0 170 $125.4 $(30.5) (e) $ 94.9 $ (32.1)
Deepwater Floater . . . . . . . . . . . . . . . . . . . . . . . . . . . . . . . . . . . 79.4 31 112.3 (9.3) 103.0 23.6
Mid-Water Floaters . . . . . . . . . . . . . . . . . . . . . . . . . . . . . . . . . . . 217.8 136 157.5 (58.4) 99.1 (118.7)
$424.2 337 $395.2 $(98.2) $297.0 $(127.2)
(a) Represents revenue earning days, defined as a 24-hour period during which a rig earns a dayrate after commencement of
operations, attributable to the Ocean Monarch, Ocean Star, Ocean Lexington and Ocean Quest, under their contracts to Niko or
OGX during the period from July 1, 2013 through December 31, 2013.
(b) Represents the amount of revenue that would have been earned during 2013, were it not for these credit issues, by our four rigs
under contract to Niko or OGX, including revenue associated with revenue earning days for these rigs during the period from July 1,
2013 to December 31, 2013.
(c) Represents contract drilling revenue earned by the four rigs under contract to Niko or OGX during the period from July 1, 2013
through December 31, 2013, which was not recognized in accordance with revenue recognition principles.
(d) Represents the change in contract drilling revenue recognized, comparing the years ended December 31, 2013 and 2012,
attributable to the four rigs contracted to Niko or OGX during the second half of 2013.
(e) Net of a $25.0 million payment recognized as revenue for the Ocean Monarch pursuant to the Settlement Agreement with Niko.
2013 Compared to 2012
Operating Income. Operating income decreased $160.8 million, or 17%, in 2013, compared to 2012, primarily due to a $92.5
million, or 3%, reduction in contract drilling revenue, a $35.3 million increase in contract drilling expense and recognition of $22.5 million
of bad debt expense in 2013, combined with the absence of an aggregate $76.5 million pre-tax gain on the sale of six of our jack-up rigs
during 2012 . These negative contributors to operating income were partially offset by the absence of a $62.4 million impairment loss
recognized in the fourth quarter of 2012.
Contract drilling revenue for our ultra-deepwater and mid-water fleets decreased a combined $125.4 million during 2013,
compared to 2012, while revenue earned by our deepwater floaters and jack-up rigs increased an aggregate $32.9 million. Revenue
earning days for our drilling fleet decreased an aggregate 415 days in 2013, compared to 2012, including 337 fewer revenue earning
days for the Ocean Monarch, Ocean Star, Ocean Lexington and Ocean Quest in the second half of 2013, during which these rigs were
contracted to Niko or OGX but no revenue was recognized, and 87 fewer days attributable to the jack-up rigs that we sold in 2012.
In general, the comparability of contract drilling expenses between years is impacted by significant events or changes in our rig
fleet, including but not limited to the relocation of rigs between geographic locations and related changes in operating cost structures
which differ between regions, the cost to mobilize such rigs, the number and extent of shipyard surveys and related repairs, the stacking
of rigs and rising labor costs. Total contract drilling expense for our rig fleet during 2013 increased by $35.3 million, compared to 2012,
reflecting higher labor and personnel-related costs ($38.1 million), primarily related to mid-2013 pay increases and costs associated with
additional crews for the Ocean Onyx and Ocean BlackHawk and for our new rigs expected to be delivered in 2014, repair and
maintenance costs ($23.7 million) and inspection costs ($10.1 million). The impact of these 2013 cost increases were partially offset by
decreased costs associated with the mobilization of rigs ($21.9 million), freight ($11.5 million) and other rig operating costs ($3.3 million).
Impairment of Assets. In late 2012, our management adopted a plan to actively market for sale three of our mid-water
semisubmersibles, the Ocean Epoch, the Ocean New Era and the Ocean Whittington, and the jack-up rig Ocean Spartan. As a result of
this decision, we recognized an impairment loss of $62.4 million in the fourth quarter of 2012 to write down the aggregate net book
value of these rigs to their estimated recoverable amounts.
DIAMOND OFFSHORE / 2013 ANNUAL REPORT 31

Interest Expense. Interest expense decreased $21.4 million in 2013, compared to 2012, primarily due to a $36.6 million increase in
interest capitalized on eligible construction projects during 2013 partially offset by incremental interest expense of $7.0 million for the
senior unsecured notes that we issued in 2013 and an increase of $7.7 million in interest expense associated with uncertain tax positions,
primarily in the Mexico tax jurisdiction.
Income Tax Expense Our effective tax rate for 2013 was 29.1%, compared to a 21.5% effective tax rate for 2012. The higher effective
tax rate in 2013 was due to differences in the mix of our domestic and international pre-tax earnings and losses, as well as the mix of
international tax jurisdictions in which we operate. Income tax expense for 2013 was also negatively impacted by a provision of
$56.9 million related to an uncertain tax position in Egypt, partially offset by the recognition of the impact of The American Taxpayer
Relief Act of 2012, which reduced 2013 income tax expense by $27.5 million.
As our rigs frequently operate in different tax jurisdictions as they move from contract to contract, our effective tax rate can
fluctuate substantially and our historical effective tax rates may not be sustainable and could increase materially.
2012 Compared to 2011
Operating Income. Operating income decreased $293.0 million, or 23%, during 2012, compared to 2011, primarily due to a
$318.2 million, or 10%, reduction in total contract drilling revenue and a $62.4 million impairment loss on certain assets held for sale,
partially offset by an $11.3 million, or 1%, decrease in contract drilling expense and a $76.5 million pre-tax gain on the sale of six jack-up
rigs in 2012. Both revenue earning days and average daily revenue earned by our deepwater and mid-water floaters declined during
2012, compared to 2011, and resulted in a $342.3 million reduction in revenue, while favorable market conditions at that time for our
ultra-deepwater floaters resulted in a $61.2 million increase in contract drilling revenue. Revenue for our jack-up fleet decreased $37.0
million during 2012, compared to 2011, primarily due to the 2012 sale of three jack-up rigs that operated during 2011.
Aggregate contract drilling expense for our mid-water floater and jack-up fleets decreased $93.1 million during 2012 compared to
the prior year, primarily due to the movement of certain of our rigs to other operating regions with lower cost structures, combined with
lower repair and inspection costs, as well as the absence of operating costs in 2012 for the recently sold jack-up rigs. The overall
decrease in contract drilling expense during 2012 was partially offset by a combined $78.2 million increase in contract drilling expense
for our ultra-deepwater and deepwater floaters, primarily due to higher personnel related, inspection, and shorebase support costs in
2012.
Interest Expense. Interest expense decreased $26.9 million in 2012 compared to 2011, primarily due to $26.5 million in incremental
interest costs capitalized during 2012 related to our continuing rig construction projects, which included a fourth drillship under
construction and the Ocean Apex.
Income Tax Expense Our effective tax rate for 2012 was 21.5%, compared to an 18.4% effective tax rate for 2011. The higher
effective tax rate in 2012 was primarily the result of differences in the mix of our domestic and international pre-tax earnings and losses,
as well as the mix of international tax jurisdictions in which we operate and the impact of a tax law provision that expired at the end of
2011. This provision allowed us to defer recognition of certain foreign earnings for U.S. tax purposes during 2011, which deferral was
unavailable in 2012. Our 2011 tax expense also included the reversal of $15 million of U.S. income tax expense, originally recognized in
2010, related to our intention at that time to repatriate certain foreign earnings, which changed in 2011 subsequent to our decision to
build new drillships overseas.
Contract Drilling Revenue and Expense by Equipment Type
2013 Compared to 2012
Ultra-Deepwater Floaters. Revenue generated by our ultra-deepwater floaters decreased $48.3 million in 2013, compared to 2012,
primarily due to lower average daily revenue earned ($25.5 million), 83 fewer revenue earning days ($29.8 million), and a $17.9 million
decrease in amortized mobilization revenue, partially offset by $25.0 million in revenue recognized in connection with the Settlement
Agreement with Niko. Average daily revenue decreased in 2013, compared to 2012, primarily due to a contract extension for the Ocean
Rover during the second quarter of 2012 at a significantly lower dayrate than previously earned and lower revenue earned by the Ocean
Clipper as a result of incremental revenue earning days at a reduced performance rate, equipment penalties assessed against revenue
and the absence of additional revenue associated with the rig working outside its normal operating zone. Total revenue earning days for
our ultra-deepwater floaters decreased during 2013, compared to 2012, primarily due to incremental unplanned downtime
(225 additional days), partially offset by a reduction in downtime for shipyard projects and inspections (128 fewer days) and mobilization
of rigs (21 fewer days). Mobilization revenue decreased primarily due to the absence in 2013 of $16.3 million in amortized mobilization
revenue, which was recognized during 2012 in connection with the Ocean Monarch’s mobilization to Vietnam.
32 DIAMOND OFFSHORE / 2013 ANNUAL REPORT
Contract drilling expense incurred by our ultra-deepwater floaters decreased $6.8 million during 2013, compared to 2012, primarily
due to lower amortized mobilization costs ($21.8 million) and freight costs ($8.8 million), partially offset by higher costs associated with
rig personnel ($18.8 million) and repairs and maintenance ($5.1 million).
Deepwater Floaters. Revenue generated by our deepwater floaters increased $19.4 million during 2013, compared to 2012, as a
result of higher average daily revenue earned ($52.4 million), partially offset by 75 fewer revenue earning days ($27.7 million) and lower
amortized mobilization revenue ($5.4 million). Average daily revenue earned by our deepwater floaters during 2013 increased primarily
due to both the Ocean Valiant and Ocean Victory working at significantly higher dayrates than those earned in 2012. In contrast, total
revenue earning days for our deepwater floaters declined in 2013 due to incremental unscheduled downtime for repairs (32 additional
days), scheduled shipyard projects (26 additional days) and mobilization of the Ocean America (14 days). Contract drilling expense
increased $14.6 million in 2013, compared to 2012, reflecting higher labor and other personnel-related costs ($8.4 million), shorebase
support costs and overheads ($5.2 million), and repair and maintenance costs ($2.1 million), partially offset by lower costs associated with
the mobilization of rigs ($4.0 million).
Mid-Water Floaters. Revenue generated by our mid-water floaters decreased $77.1 million during 2013, compared to 2012,
primarily as a result of 453 fewer revenue earning days ($119.3 million) and a reduction in amortized mobilization and contract
preparation fees ($8.3 million), partially offset by the effect of higher average daily revenue earned ($50.5 million). The decrease in
revenue earning days during 2013 was primarily due to an increase in planned downtime for shipyard inspections and projects
(322 additional days), additional non-operating days for the Ocean Whittington (102 additional days) and revenue generating days for the
Ocean Quest and Ocean Lexington for which the associated revenue was not recognized (136 days), offset by fewer days for the
mobilization of rigs (114 fewer days). Average daily revenue increased in 2013, compared to 2012, primarily due to new contracts or
contract renewals for the Ocean General, Ocean Patriot, Ocean Nomad and Ocean Vanguard at higher dayrates than previously earned.
Contract drilling expense remained relatively consistent in 2013 compared to 2012, increasing only $2.1 million. During 2013, our
mid-water floaters benefited from cost reductions associated with the cold stacking of the Ocean Whittington and return of the Ocean
Ambassador to the GOM ($47.4 million), combined with the absence of costs associated with the 2012 demobilization of the Ocean
Guardian from the Falkland Islands ($12.1 million) and repair and maintenance activities after arriving in the U.K. ($7.2 million). However,
cost reductions were offset by higher contract drilling expenses for the remainder of our mid-water fleet, primarily for labor and other
personnel-related costs ($8.7 million), repairs and maintenance ($18.8 million), inspections ($13.0 million) and mobilization of rigs
($21.6 million).
Jack-ups. Contract drilling revenue and expense for our jack-up rigs increased $13.5 million and $8.6 million, respectively, in 2013,
compared to 2012. The Ocean King, which was warm stacked in Montenegro in 2010, returned to the GOM in early 2013 and
commenced operations in the second quarter. During 2013, the Ocean King earned revenue and incurred incremental contract drilling
expense of $26.2 million and $14.1 million, respectively, compared to 2012. The increase in both contract drilling revenue and expense
for our jack-up fleet during 2013 was partially offset by the absence of $5.4 million in revenue and $8.4 million in costs attributable to our
six jack-up rigs that we sold in 2012. Revenues in 2013 were further reduced as a result of 81 incremental days of scheduled downtime
for repairs for the Ocean Scepter and Ocean Nugget ($9.5 million).
2012 Compared to 2011
Ultra-Deepwater Floaters. Revenue generated by our ultra-deepwater floaters increased $61.2 million during 2012, compared to
2011, primarily due to higher average daily revenue earned by our ultra-deepwater fleet ($29.9 million) and 88 incremental revenue
earning days ($30.4 million). Average daily revenue earned increased primarily due to higher dayrates earned by the Ocean Monarch
operating offshore Vietnam and Indonesia during 2012, compared to the average dayrate earned by the rig operating in the GOM during
2011. Total revenue earning days increased during 2012 primarily due to the inclusion of 155 incremental revenue earnings days for the
Ocean Monarch, compared to 2011 when the rig incurred downtime associated with a force majeure assertion and subsequent
mobilization of the rig to Vietnam. The increase in aggregate revenue earning days during 2012 was partially offset by downtime
associated with scheduled surveys and shipyard projects, as well as unscheduled downtime for repairs for other rigs in our ultra-
deepwater fleet.
Contract drilling expense in 2012 for our ultra-deepwater fleet included $26.3 million in incremental costs for the Ocean Monarch,
which experienced a higher cost structure operating internationally for the full year, as well as costs associated with its 2012 shipyard
survey, compared to 2011, when the rig was located in the GOM for a portion of the year. In addition, contract drilling expense for our
other ultra-deepwater floaters increased compared to 2011, reflecting higher costs relating to personnel ($28.8 million), inspections
($3.9 million), freight, customs and duties ($3.3 million) and shorebase support ($5.5 million), as well as losses on foreign currency hedges
($3.8 million), partially offset by lower costs incurred for maintenance and repairs ($13.0 million) and amortized mobilization expense
($7.5 million).
DIAMOND OFFSHORE / 2013 ANNUAL REPORT 33

Deepwater Floaters. Revenue generated by our deepwater floaters decreased $135.3 million in 2012, compared to 2011, as a result
of lower average daily revenue earned ($76.5 million), 113 fewer revenue earning days ($47.2 million), and lower recognition of
amortized mobilization revenue ($11.7 million). Average daily revenue earned was negatively impacted by the completion of the Ocean
Valiant’s initial contract offshore Angola in December 2011, which was at a significantly higher dayrate than the rig earned during 2012.
The decline in revenue earning days during 2012 was primarily attributable to 118 days of incremental downtime for shipyard projects
and inspections compared to 2011. Contract drilling expense incurred by our deepwater floaters increased $25.4 million during 2012,
compared to 2011, primarily due to the repair and inspection costs associated with 2012 surveys and shipyard projects for the Ocean
Star and Ocean Victory and higher personnel related costs, partially offset by the absence of certain regional costs associated with the
Ocean Valiant’s contract offshore Angola during 2011.
Mid-Water Floaters. Revenue generated by our mid-water floaters decreased $207.0 million during 2012, compared to 2011,
primarily due to 615 fewer revenue earning days ($166.0 million). The reduction in revenue earning days in 2012, compared to 2011,
reflected 322 incremental downtime days for the Ocean Whittington, which completed its contract in Brazil, as well as unplanned
downtime for repairs and the warm stacking of rigs between contracts (163 additional days), planned downtime for mobilization of rigs
and shipyard projects (51 additional days), and 91 additional cold-stacked days for the Ocean Epoch. Revenue for 2012, compared to the
prior year, was further reduced by a decrease in average daily revenue earned ($27.9 million) and lower amortized mobilization revenue
($13.0 million).
Contract drilling expense for our mid-water floaters decreased $30.4 million during 2012, compared to 2011, and reflected lower
costs for rig maintenance, repairs and inspections ($21.7 million), personnel related expenses ($12.8 million), freight, customs and duties
($5.7 million), revenue-based agency fees ($2.9 million), and shorebase support ($2.2 million). These decreases in contract drilling
expense were partially offset by higher recognized mobilization costs ($10.0 million) and losses on foreign currency hedges
($7.2 million).
Jack-ups. Revenue and contract drilling expense for our jack-up rigs decreased $37.0 million and $62.7 million, respectively, in 2012,
compared to 2011, primarily due to the sale of six jack-up rigs in 2012, which resulted in an incremental reduction of revenue and
contract drilling expense of $37.8 million and $37.5 million, respectively, comparing the two years. The decrease in contract drilling
expense in 2012, compared to 2011, also reflected a $22.0 million reduction in expense for the Ocean Scepter, primarily due to the
absence of costs associated with return of the rig to the GOM in 2011, lower amortized mobilization expenses and the effect of a lower
operating cost structure offshore Mexico than in Brazil.
Liquidity and Capital Resources
We have historically relied principally on our cash flows from operations and cash reserves to meet liquidity needs and fund our
cash requirements. In addition, we currently have available a $750 million credit facility to meet our short-term and long-term liquidity
needs. See “— Credit Agreement and Long-Term Debt — $750 Million Revolving Credit Agreement.” At the date of this report, our
contract drilling backlog was $6.8 billion, of which $2.6 billion is expected to be realized in 2014.
At December 31, 2013, 2012 and 2011, we had cash available for current operations as follows:
December 31,
2013 2012 2011
(In thousands)
Cash and equivalents . . . . . . . . . . . . . . . . . . . . . . . . . . . . . . . . . . . . . . . . . . . . . . . . . . . . . . . . . . . . . . . . . . . . $ 347,011 $ 335,432 $ 333,765
Marketable securities . . . . . . . . . . . . . . . . . . . . . . . . . . . . . . . . . . . . . . . . . . . . . . . . . . . . . . . . . . . . . . . . . . . . 1,750,053 1,150,158 902,414
Total cash available for current operations . . . . . . . . . . . . . . . . . . . . . . . . . . . . . . . . . . . . . . . . . . . . . . $2,097,064 $1,485,590 $1,236,179
A substantial portion of our cash flows has been and is expected to continue to be invested in the enhancement of our drilling fleet.
We determine the amount of cash required to meet our capital commitments by evaluating our rig construction obligations, the need to
upgrade rigs to meet specific customer requirements and our ongoing rig equipment enhancement/replacement programs.
Certain of our international rigs are owned and operated, directly or indirectly, by DOIL, and, as a result of our intention to indefinitely
reinvest the earnings of DOIL to finance our foreign activities, we do not expect such earnings to be available for distribution to our
stockholders or to finance our domestic activities. See “— Market Overview — Critical Accounting Estimates — Income Taxes.” We
expect to utilize the operating cash flows generated by and cash reserves of DOIL and the operating cash flows available to and cash
reserves of Diamond Offshore Drilling, Inc. to meet each entity’s respective working capital requirements and capital commitments.
34 DIAMOND OFFSHORE / 2013 ANNUAL REPORT

However, in light of the significant cash requirements of our capital expansion program in 2014 and 2015, we may also make use of our
credit facility to finance our capital expenditures and working capital requirements and/or to maintain a certain level of operating cash
reserves. In addition, we will make periodic assessments of our capital spending programs based on industry conditions and make
adjustments thereto if required. See “— Cash Flow and Capital Expenditures — Contractual Cash Obligations — Rig Construction” and
“— Credit Agreement and Senior Notes — $750 Million Revolving Credit Agreement.”
We pay dividends at the discretion of our Board of Directors, or Board, and, in recent years, we have a history of paying both regular
quarterly and special cash dividends. See “Market for the Registrant’s Common Equity, Related Stockholder Matters and Issuer Purchases
of Equity Securities – Dividend Policy” in Item 5 of this report. During the three-year period ended December 31, 2013, we paid regular
cash dividends totaling $208.5 million and special cash dividends totaling $1.3 billion. Our Board has adopted a policy to consider paying
special cash dividends, in amounts to be determined, on a quarterly basis. Our Board may, in subsequent quarters, consider paying
additional special cash dividends, in amounts to be determined. Any determination to declare a special cash dividend, as well as the
amount of any special cash dividend that may be declared, will be based on our financial position, earnings, earnings outlook, capital
spending plans and other factors that our Board considers relevant at that time.
On February 5, 2014, we declared a regular cash dividend and a special cash dividend of $0.125 and $0.75, respectively, per share of
our common stock. Both the quarterly and special cash dividends are payable on March 3, 2014 to stockholders of record on
February 19, 2014.
During the three-year period ended December 31, 2013, our primary source of cash was an aggregate $3.8 billion generated from
operating activities, $987.8 million net proceeds from the issuance of senior notes in 2013 and $131.9 million received from the sale of
six drilling rigs in 2012. Cash usage during the same period was primarily for capital expenditures ($2.4 billion), payment of dividends ($1.5
billion) and the purchase of marketable securities, net of sales ($1.1 billion).
We may, from time to time, issue debt or equity securities, or a combination thereof, to finance capital expenditures, the acquisition
of assets and businesses or for general corporate purposes. Our ability to access the capital markets by issuing debt or equity securities
will be dependent on our results of operations, our current financial condition, current market conditions and other factors beyond our
control.
Depending on market and other conditions, we may, from time to time, purchase shares of our common stock in the open market
or otherwise. We did not repurchase any shares of our outstanding common stock during the years ended December 31, 2013, 2012 or
2011. In addition, Loews Corporation, or Loews, has stated that, depending on market and other conditions, it may, from time to time,
purchase shares of our common stock in the open market or otherwise. Loews did not purchase any shares of our outstanding common
stock during the years ended December 31, 2013, 2012 or 2011.
Cash Flow and Capital Expenditures
Our cash flow from operations and capital expenditures for each of the years in the three-year period ended December 31, 2013
were as follows:
Year Ended December 31,
2013 2012 2011
(In thousands)
Cash flow from operations . . . . . . . . . . . . . . . . . . . . . . . . . . . . . . . . . . . . . . . . . . . . . . . . . . . . . . . . . . . . . . . $1,065,988 $1,311,269 $1,420,105
Capital expenditures:
Drillship construction . . . . . . . . . . . . . . . . . . . . . . . . . . . . . . . . . . . . . . . . . . . . . . . . . . . . . . . . . . . . . . . . . $ 130,268 $ 248,346 $ 490,156
Construction of deepwater floaters . . . . . . . . . . . . . . . . . . . . . . . . . . . . . . . . . . . . . . . . . . . . . . . . . . . . . 396,584 153,529 —
Construction of ultra-deepwater floater . . . . . . . . . . . . . . . . . . . . . . . . . . . . . . . . . . . . . . . . . . . . . . . . . 195,578 — —
Ocean Patriot enhancement programs . . . . . . . . . . . . . . . . . . . . . . . . . . . . . . . . . . . . . . . . . . . . . . . . . 29,948 — —
Rig equipment and replacement programs . . . . . . . . . . . . . . . . . . . . . . . . . . . . . . . . . . . . . . . . . . . . . 205,220 300,166 284,600
Total capital expenditures . . . . . . . . . . . . . . . . . . . . . . . . . . . . . . . . . . . . . . . . . . . . . . . . . . . . . . . . . . . $ 957,598 $ 702,041 $ 774,756
Cash Flow. Cash flow from operations decreased approximately $245.3 million during 2013, compared to 2012, primarily due to a
$165.3 million decrease in cash receipts from contract drilling services and higher cash payments related to contract drilling expenses of
$83.2 million, partially offset by lower cash income taxes paid, net of refunds, of $3.3 million.
DIAMOND OFFSHORE / 2013 ANNUAL REPORT 35

Cash flow from operations decreased approximately $108.8 million during 2012, compared to 2011, primarily due to a
$297.4 million decrease in cash receipts from contract drilling services, partially offset by lower cash payments related to contract drilling
expenses of $87.3 million and lower cash income taxes paid, net of refunds, of $102.0 million.
See “— Results of Operations —Years Ended December 31, 2013, 2012 and 2011.”
Capital Expenditures.
As of the date of this report, we expect capital expenditures for 2014 to aggregate approximately $2.1 billion, of which we expect to
spend approximately $1.5 billion and $82.0 million on our current rig construction projects and the Ocean Patriot North Sea
enhancement project, respectively. Our 2014 capital spending estimate also includes approximately $184.0 million expected to be spent
on a service-life-extension project for the Ocean Confidence. We expect to fund our 2014 capital spending from the operating cash flows
generated by and cash reserves of DOIL and the operating cash flows available to and cash reserves of Diamond Offshore Drilling, Inc.
See “— Contractual Cash Obligations — Rig Construction.”
Contractual Cash Obligations — Rig Construction
In May 2013, we entered into an agreement with Hyundai Heavy Industries Co., Ltd., or Hyundai, for the construction of a 10,000
foot dynamically positioned, harsh environment semisubmersible drilling rig. The Ocean GreatWhite is under construction in South Korea
at an estimated cost of $755 million, including capital spares, commissioning and shipyard supervision. The contracted price to Hyundai,
totaling $628.5 million, is payable in two installments, of which the first installment was paid in 2013.
As of February 5, 2014, we are financially obligated under other agreements with several shipyards in connection with the
construction of three ultra-deepwater drillships, the deepwater floater Ocean Apex and the Ocean Patriot North Sea enhancement
project. The Ocean Onyx and the Ocean BlackHawk, the first of our four drillships, were delivered late in the fourth quarter of 2013 and in
late January 2014, respectively. The final installments on these construction contracts were paid in January 2014. See Note 8
“Commitments and Contingencies” to our Consolidated Financial Statements included in Item 1 of Part I of this report for further
discussion of these projects.
The following is a summary of our construction projects as of February 5, 2014, including estimated expenditures to be made
during the remainder of 2014:
Actual Inception-to-Date
ProjectExpected
Delivery (1)
TotalProjectCost (2)
ProjectExpenditures(3)
CapitalizedInterest 2014(4)(5)
(In millions)
New Rig Construction:
Drillships:
Ocean BlackHawk . . . . . . . . . . . . . . . . . . . . . . . . . . . . . . . . . . . . . . . . . . . . . . . . Q1 2014 $ 635 $ 620 $ 27 $ 15
Ocean BlackHornet . . . . . . . . . . . . . . . . . . . . . . . . . . . . . . . . . . . . . . . . . . . . . . . Q2 2014 635 204 26 430
Ocean BlackRhino . . . . . . . . . . . . . . . . . . . . . . . . . . . . . . . . . . . . . . . . . . . . . . . . Q3 2014 645 189 26 456
Ocean BlackLion . . . . . . . . . . . . . . . . . . . . . . . . . . . . . . . . . . . . . . . . . . . . . . . . . Q1 2015 655 171 17 55
2,570 1,184 96 956
Ultra-Deepwater Floater:
Ocean GreatWhite . . . . . . . . . . . . . . . . . . . . . . . . . . . . . . . . . . . . . . . . . . . . . . . . Q1 2016 755 190 7 23
Deepwater Floaters:
Ocean Onyx . . . . . . . . . . . . . . . . . . . . . . . . . . . . . . . . . . . . . . . . . . . . . . . . . . . . . . Q4 2013 366 350 18 16
Ocean Apex . . . . . . . . . . . . . . . . . . . . . . . . . . . . . . . . . . . . . . . . . . . . . . . . . . . . . . Q3 2014 370 269 9 110
$4,061 $1,993 $130 $1,105
Enhancement Project:
Mid-Water Floater Ocean Patriot . . . . . . . . . . . . . . . . . . . . . . . . . . . . . . . . . . . . . . Q2 2014 $ 120 $ 50 $ — $ 70
(1) Represents expected delivery date of vessel from shipyard and does not include additional non-operating days for commissioning,
contract preparation and mobilization to initial area of operation, which will occur prior to the rig being placed in service.
(2) Total project costs include contractual payments for shipyard construction, commissioning, capital spares and project management
costs; amount does not include capitalized interest.
36 DIAMOND OFFSHORE / 2013 ANNUAL REPORT

(3) Represents total project expenditures from inception of project to February 5, 2014, excluding project-to-date capitalized interest.
Project-to-date expenditures include final construction milestone payments of $7.3 million paid to Keppel AmFELS, L.L.C. and an
aggregate $396.1 million paid to Hyundai in January 2014 in connection with the deliveries of the Ocean Onyx and Ocean
BlackHawk, respectively.
(4) Estimated expenditures for 2014, including construction milestone payments, are based on current expected delivery dates for the
rigs under construction, and exclude expected capitalized interest costs.
(5) Construction milestone payments expected to be paid in the remainder of 2014 include:
• $54.1 million payable to Jurong Shipyard Pte Ltd. in connection with the construction of the Ocean Apex;
• $10.2 million payable to Keppel FELS Limited in connection with the Ocean Patriot enhancement project; and
• $393.5 million and $395.4 million payable to Hyundai in the second and third quarter of 2014 upon delivery of the Ocean
BlackHornet and Ocean BlackRhino, respectively.
Credit Agreement and Senior Notes
$750 Million Revolving Credit Agreement. We have a syndicated 5-Year Revolving Credit Agreement, or Credit Agreement, with
Wells Fargo Bank, National Association, as administrative agent and swingline lender. Effective December 9, 2013, we entered into an
extension agreement and amendment to the Credit Agreement, which, among other things, provided for a one-year extension with all of
the existing lenders. The Credit Agreement provides for a $750 million senior unsecured revolving credit facility, for general corporate
purposes, maturing on September 28, 2018. The entire amount of the facility is available for revolving loans. Up to $250 million of the
facility is available for the issuance of performance or other standby letters of credit and up to $75 million is available for swingline loans.
As of December 31, 2013, there were no loans or letters of credit outstanding under the Credit Agreement.
Senior Notes.
Our senior notes are comprised as follows:
Debt Issue
PrincipalAmount
(In millions) Maturity Date
StatedInterest
Rate
SemiannualInterest Payment
Dates
5.15% Senior Notes due 2014 . . . . . . . . . . . . . . . . . . . . . . . . . . . . . . $250.0 September 1, 2014 5.15% March 1 and September 1
4.875% Senior Notes due 2015 . . . . . . . . . . . . . . . . . . . . . . . . . . . . $250.0 July 1, 2015 4.875% January 1 and July 1
5.875% Senior Notes due 2019 . . . . . . . . . . . . . . . . . . . . . . . . . . . . $500.0 May 1, 2019 5.875% May 1 and November 1
3.45% Senior Notes due 2023 . . . . . . . . . . . . . . . . . . . . . . . . . . . . . . $250.0 November 1, 2023 3.45% May 1 and November 1
5.70% Senior Notes due 2039 . . . . . . . . . . . . . . . . . . . . . . . . . . . . . . $500.0 October 15, 2039 5.70% April 15 and October 15
4.875% Senior Notes due 2043 . . . . . . . . . . . . . . . . . . . . . . . . . . . . $750.0 November 1, 2043 4.875% May 1 and November 1
Our 5.15% Senior Notes due 2014, in the aggregate principal amount of $250.0 million, will mature on September 1, 2014.
See Note 9 “Credit Agreement and Senior Notes” to our Consolidated Financial Statements in Item 8 of this report.
Credit Ratings. Our current credit rating is A3 for Moody’s Investors Services and A for Standard & Poor’s. Although our long-term
ratings continue at investment grade levels, lower ratings could result in higher interest rates on future debt issuances.
Contractual Cash Obligations
The following table sets forth our contractual cash obligations at December 31, 2013.
Payments Due By Period
ContractualObligations (1) (2) Total Less than 1 year 1-3 years 4-5 years After 5 years
(In thousands)
Long-term debt (principal and interest) . . . . . . . . . . . . . . . . . . . . . . . . $4,622,939 $ 378,126 $ 468,314 $206,126 $3,570,373
Construction contracts . . . . . . . . . . . . . . . . . . . . . . . . . . . . . . . . . . . . . . 2,088,809 1,253,791 835,018 — —
Operating leases . . . . . . . . . . . . . . . . . . . . . . . . . . . . . . . . . . . . . . . . . . . . 5,742 2,938 2,170 634 —
Total obligations . . . . . . . . . . . . . . . . . . . . . . . . . . . . . . . . . . . . . . . . . . . . $6,717,490 $1,634,855 $1,305,502 $206,760 $3,570,373
DIAMOND OFFSHORE / 2013 ANNUAL REPORT 37

(1) The above table excludes foreign currency forward exchange, or FOREX, contracts in the aggregate notional amount of
$114.1 million outstanding at December 31, 2013. See further information regarding these contracts in “Quantitative and
Qualitative Disclosures About Market Risk — Foreign Exchange Risk” in Item 7A of this report and Note 6 “Derivative Financial
Instruments” to our Consolidated Financial Statements in Item 8 of this report.
(2) The above table excludes $76.3 million of unrecognized tax benefits related to uncertain tax positions as of December 31, 2013 and
an additional $59.8 million and $12.8 million for potential penalties and interest, respectively, related to such uncertain tax positions.
Due to the high degree of uncertainty regarding the timing of future cash outflows associated with the liabilities recognized in these
balances, we are unable to make reasonably reliable estimates of the period of cash settlement with the respective taxing
authorities.
Except for the construction contracts discussed above and referred to in the preceding table, we had no other purchase obligations
for major rig upgrades or any other significant obligations at December 31, 2013, except for those related to our direct rig operations,
which arise during the normal course of business.
Other Commercial Commitments — Letters of Credit
We were contingently liable as of December 31, 2013 in the amount of $78.2 million under certain performance, bid, supersedeas,
tax appeal and customs bonds and letters of credit. Agreements relating to approximately $67.4 million of performance, supersedeas and
customs bonds can require collateral at any time. As of December 31, 2013, we had not been required to make any collateral deposits
with respect to these agreements. The remaining agreements cannot require collateral except in events of default. Banks have issued
letters of credit on our behalf securing certain of these bonds. The table below provides a list of these obligations in U.S. dollar
equivalents and their time to expiration.
For the Years Ending December 31,
Total 2014 2015 Thereafter
(In thousands)
Other Commercial CommitmentsCustoms bonds . . . . . . . . . . . . . . . . . . . . . . . . . . . . . . . . . . . . . . . . . . . . . . . . . . . . . . . . . . . . . . . . . . . $ 1,517 $ 1,517 $ — $ —
Performance bonds . . . . . . . . . . . . . . . . . . . . . . . . . . . . . . . . . . . . . . . . . . . . . . . . . . . . . . . . . . . . . . . . 60,704 11,992 13,638 35,074
Other . . . . . . . . . . . . . . . . . . . . . . . . . . . . . . . . . . . . . . . . . . . . . . . . . . . . . . . . . . . . . . . . . . . . . . . . . . . . . 16,027 16,027 — —
Total obligations . . . . . . . . . . . . . . . . . . . . . . . . . . . . . . . . . . . . . . . . . . . . . . . . . . . . . . . . . . . . . . . . . . . . . $78,248 $29,536 $13,638 $35,074
Off-Balance Sheet Arrangements
At December 31, 2013 and 2012, we had no off-balance sheet debt or other arrangements.
Other
Currency Risk. Some of our subsidiaries conduct a portion of their operations in the local currency of the country where they
conduct operations. Currency environments in which we have significant business operations include Brazil, the U.K., Australia and
Mexico. When possible, we attempt to minimize our currency exchange risk by seeking international contracts payable to us in local
currency in amounts equal to our estimated operating costs payable in local currency, with the balance of the contract payable in U.S.
dollars. At present, however, only a limited number of our contracts are payable both in U.S. dollars and the local currency.
To the extent that we are not able to cover our local currency operating costs with customer payments in the local currency, we
also utilize FOREX contracts to reduce our currency exchange risk. Our FOREX contracts may obligate us to exchange predetermined
amounts of specified foreign currencies at specified foreign exchange rates on specific dates or to net settle the spread between the
contracted foreign currency exchange rate and the spot rate on the contract settlement date, which, for most of our contracts, is the
average spot rate for the contract period.
We record currency transaction gains and losses as “Foreign currency transaction gain (loss)” in our Consolidated Statements of
Operations. Gains and losses arising from the settlement of our FOREX contracts that have been designated as cash flow hedges are
reported as a component of “Contract drilling, excluding depreciation” expense in our Consolidated Statements of Operations.
38 DIAMOND OFFSHORE / 2013 ANNUAL REPORT

Forward-Looking Statements
We or our representatives may, from time to time, either in this report, in periodic press releases or otherwise, make or incorporate
by reference certain written or oral statements that are “forward-looking statements” within the meaning of Section 27A of the Securities
Act of 1933, as amended, or the Securities Act, and Section 21E of the Securities Exchange Act of 1934, as amended, or the Exchange
Act. All statements other than statements of historical fact are, or may be deemed to be, forward-looking statements. Forward-looking
statements include, without limitation, any statement that may project, indicate or imply future results, events, performance or
achievements, and may contain or be identified by the words “expect,” “intend,” “plan,” “predict,” “anticipate,” “estimate,” “believe,”
“should,” “could,” “may,” “might,” “will,” “will be,” “will continue,” “will likely result,” “project,” “forecast,” “budget” and similar expressions. In
addition, any statement concerning future financial performance (including, without limitation, future revenues, earnings or growth
rates), ongoing business strategies or prospects, and possible actions taken by or against us, which may be provided by management, are
also forward-looking statements as so defined. Statements made by us in this report that contain forward-looking statements include,
but are not limited to, information concerning our possible or assumed future results of operations and statements about the following
subjects:
• market conditions and the effect of such conditions on our future results of operations;
• uses of and requirements for financial resources;
• interest rate and foreign exchange risk;
• contractual obligations;
• operations outside the United States;
• effects of the Macondo well blowout;
• business strategy;
• growth opportunities;
• competitive position;
• expected financial position;
• cash flows and contract backlog;
• regular or special dividends;
• financing plans;
• market outlook;
• tax planning;
• debt levels and the impact of changes in the credit markets and credit ratings for our debt;
• budgets for capital and other expenditures;
• timing and duration of required regulatory inspections for our drilling rigs;
• timing and cost of completion of rig upgrades, construction projects and other capital projects;
• delivery dates and drilling contracts related to rig conversion or upgrade projects, construction projects, other capital projects or
rig acquisitions;
• plans and objectives of management;
DIAMOND OFFSHORE / 2013 ANNUAL REPORT 39

• idling drilling rigs or reactivating stacked rigs;
• assets held for sale;
• asset impairment evaluations;
• performance of contracts;
• outcomes of legal proceedings;
• compliance with applicable laws; and
• availability, limits and adequacy of insurance or indemnification.
These types of statements are based on current expectations about future events and inherently are subject to a variety of
assumptions, risks and uncertainties, many of which are beyond our control, that could cause actual results to differ materially from
those expected, projected or expressed in forward-looking statements. These risks and uncertainties include, among others, the
following:
• those described under “Risk Factors” in Item 1A;
• general economic and business conditions;
• worldwide demand for oil and natural gas;
• changes in foreign and domestic oil and gas exploration, development and production activity;
• oil and natural gas price fluctuations and related market expectations;
• the ability of the Organization of Petroleum Exporting Countries, commonly called OPEC, to set and maintain production levels
and pricing, and the level of production in non-OPEC countries;
• policies of various governments regarding exploration and development of oil and gas reserves;
• our inability to obtain contracts for our rigs that do not have contracts;
• the cancellation of contracts included in our reported contract backlog;
• advances in exploration and development technology;
• the worldwide political and military environment, including, for example, in oil-producing regions and in locations where our rigs
are operating or where we have rigs under construction;
• casualty losses;
• operating hazards inherent in drilling for oil and gas offshore;
• the risk of physical damage to rigs and equipment caused by named windstorms in the U.S. Gulf of Mexico;
• industry fleet capacity, including, without limitation, construction of new drilling rig capacity in Brazil;
• market conditions in the offshore contract drilling industry, including, without limitation, dayrates and utilization levels;
• competition;
• changes in foreign, political, social and economic conditions;
40 DIAMOND OFFSHORE / 2013 ANNUAL REPORT
• risks of international operations, compliance with foreign laws and taxation policies and seizure, expropriation, nationalization,
deprivation, malicious damage or other loss of possession or use of equipment and assets;
• risks of potential contractual liabilities pursuant to our various drilling contracts in effect from time to time;
• the ability of customers and suppliers to meet their obligations to us and our subsidiaries;
• the risk that a letter of intent may not result in a definitive agreement;
• foreign exchange and currency fluctuations and regulations, and the inability to repatriate income or capital;
• risks of war, military operations, other armed hostilities, terrorist acts and embargoes;
• changes in offshore drilling technology, which could require significant capital expenditures in order to maintain competitiveness;
• regulatory initiatives and compliance with governmental regulations including, without limitation, regulations pertaining to
climate change, greenhouse gases, carbon emissions or energy use;
• compliance with and liability under environmental laws and regulations;
• potential changes in accounting policies by the Financial Accounting Standards Board, the Securities and Exchange Commission,
or SEC, or regulatory agencies for our industry which may cause us to revise our financial accounting and/or disclosures in the
future, and which may change the way analysts measure our business or financial performance;
• development and exploitation of alternative fuels;
• customer preferences;
• effects of litigation, tax audits and contingencies and the impact of compliance with judicial rulings and jury verdicts;
• cost, availability, limits and adequacy of insurance;
• invalidity of assumptions used in the design of our controls and procedures;
• the results of financing efforts;
• the risk that future regular or special dividends may not be declared;
• adequacy of our sources of liquidity;
• risks resulting from our indebtedness;
• public health threats;
• negative publicity;
• impairments of assets;
• the availability of qualified personnel to operate and service our drilling rigs; and
• various other matters, many of which are beyond our control.
The risks and uncertainties included here are not exhaustive. Other sections of this report and our other filings with the SEC include
additional factors that could adversely affect our business, results of operations and financial performance. Given these risks and
uncertainties, investors should not place undue reliance on forward-looking statements. Forward-looking statements included in this
report speak only as of the date of this report. We expressly disclaim any obligation or undertaking to release publicly any updates or
revisions to any forward-looking statement to reflect any change in our expectations or beliefs with regard to the statement or any
change in events, conditions or circumstances on which any forward-looking statement is based.
DIAMOND OFFSHORE / 2013 ANNUAL REPORT 41

Item 7A. Quantitative and Qualitative Disclosures About Market Risk.
The information included in this Item 7A is considered to constitute “forward-looking statements” for purposes of the statutory safe
harbor provided in Section 27A of the Securities Act and Section 21E of the Exchange Act. See “Management’s Discussion and Analysis
of Financial Condition and Results of Operations — Forward-Looking Statements” in Item 7 of this report.
Our measure of market risk exposure represents an estimate of the change in fair value of our financial instruments. Market risk
exposure is presented for each class of financial instrument held by us at December 31, 2013 and 2012, assuming immediate adverse
market movements of the magnitude described below. We believe that the various rates of adverse market movements represent a
measure of exposure to loss under hypothetically assumed adverse conditions. The estimated market risk exposure represents the
hypothetical loss to future earnings and does not represent the maximum possible loss or any expected actual loss, even under adverse
conditions, because actual adverse fluctuations would likely differ. In addition, since our investment portfolio is subject to change based
on our portfolio management strategy as well as in response to changes in the market, these estimates are not necessarily indicative of
the actual results that may occur.
Exposure to market risk is managed and monitored by our senior management. Senior management approves the overall
investment strategy that we employ and has responsibility to ensure that the investment positions are consistent with that strategy and
the level of risk acceptable to us. We may manage risk by buying or selling instruments or entering into offsetting positions.
Interest Rate Risk
We have exposure to interest rate risk arising from changes in the level or volatility of interest rates. Our investments in marketable
securities are primarily in fixed maturity securities. We monitor our sensitivity to interest rate risk by evaluating the change in the value of
our financial assets and liabilities due to fluctuations in interest rates. The evaluation is performed by applying an instantaneous change
in interest rates by varying magnitudes on a static balance sheet to determine the effect such a change in rates would have on the
recorded market value of our investments and the resulting effect on stockholders’ equity. The analysis presents the sensitivity of the
market value of our financial instruments to selected changes in market rates and prices which we believe are reasonably possible over a
one-year period.
The sensitivity analysis estimates the change in the market value of our interest sensitive assets and liabilities that were held on
December 31, 2013 and 2012, due to instantaneous parallel shifts in the yield curve of 100 basis points, with all other variables held
constant.
The interest rates on certain types of assets and liabilities may fluctuate in advance of changes in market interest rates, while
interest rates on other types may lag behind changes in market rates. Accordingly, the analysis may not be indicative of, is not intended
to provide, and does not provide a precise forecast of the effect of changes in market interest rates on our earnings or stockholders’
equity. Further, the computations do not contemplate any actions we could undertake in response to changes in interest rates.
Our long-term debt, as of December 31, 2013 and 2012, is denominated in U.S. dollars. Our existing debt has been issued at fixed
rates, and as such, interest expense would not be impacted by interest rate shifts. The impact of a 100-basis point increase in interest
rates on fixed rate debt would result in a decrease in market value of $221.5 million and $131.4 million as of December 31, 2013 and
2012, respectively. A 100-basis point decrease would result in an increase in market value of $264.5 million and $151.1 million as of
December 31, 2013 and 2012, respectively.
Foreign Exchange Risk
Foreign exchange rate risk arises from the possibility that changes in foreign currency exchange rates will impact the value of
financial instruments. It is customary for us to enter into FOREX contracts in the normal course of business. These contracts generally
require us to net settle the spread between the contracted foreign currency exchange rate and the spot rate on the contract settlement
date, which for most of our contracts is the average spot rate for the contract period. As of December 31, 2013, we had FOREX contracts
outstanding in the aggregate notional amount of $114.1 million, consisting of $15.3 million in Australian dollars, $72.4 million in Brazilian
reais, $14.2 million in British pounds sterling, $5.9 million in Mexican pesos and $6.3 million in Norwegian kroner. These contracts
generally settle monthly through September 2014. At December 31, 2013, we have presented the fair value of our outstanding FOREX
contracts as a current asset of $1.6 million in “Prepaid expenses and other current assets” and a current liability of $(1.1) million in
“Accrued liabilities” in our Consolidated Balance Sheets included in Item 8 of this report. We have presented the fair value of our
outstanding FOREX contracts at December 31, 2012, as a current asset of $3.6 million in “Prepaid expenses and other current assets” and
a current liability of $(29,137) in “Accrued liabilities” in our Consolidated Balance Sheets included in Item 8 of this report.
42 DIAMOND OFFSHORE / 2013 ANNUAL REPORT

The following table presents our exposure to market risk by category (interest rates and foreign currency exchange rates):
Fair Value Asset (Liability) Market Risk
December 31, December 31,
2013 2012 2013 2012
(In thousands)
Interest rate:
Marketable securities . . . . . . . . . . . . . . . . . . . . . . . . . . . . . . . . . . . . . . . . . . . . . . . $1,750,100(a) $1,150,200(a) $ (2,200)(b) $ (2,200)(b)
Foreign Exchange:
Forward exchange contracts — receivable positions . . . . . . . . . . . . . . . . . . . 1,600(c) 3,600(c) (4,200)(d) (21,600)(d)
Forward exchange contracts — liability positions . . . . . . . . . . . . . . . . . . . . . . (1,100)(c) (29)(c) (16,000)(d) (4,900)(d)
(a) The fair market value of our investment in marketable securities, excluding repurchase agreements, is based on the quoted closing
market prices on December 31, 2013 and 2012.
(b) The calculation of estimated market risk exposure is based on assumed adverse changes in the underlying reference price or index
of an increase in interest rates of 100 basis points at December 31, 2013 and 2012.
(c) The fair value of our foreign currency forward exchange contracts is based on both quoted market prices and valuations derived
from pricing models on December 31, 2013 and 2012.
(d) The calculation of estimated foreign exchange risk assumes an instantaneous 20% decrease in the foreign currency exchange rates
versus the U.S. dollar from their values at December 31, 2013 and 2012, with all other variables held constant.
DIAMOND OFFSHORE / 2013 ANNUAL REPORT 43

Item 8. Financial Statements and Supplementary Data.
REPORT OF INDEPENDENT REGISTERED PUBLIC ACCOUNTING FIRM
To the Board of Directors and Stockholders of
Diamond Offshore Drilling, Inc. and Subsidiaries
Houston, Texas
We have audited the accompanying consolidated balance sheets of Diamond Offshore Drilling, Inc. and subsidiaries (the
“Company”) as of December 31, 2013 and 2012, and the related consolidated statements of operations, comprehensive income,
stockholders’ equity, and cash flows for each of the three years in the period ended December 31, 2013. These financial statements are
the responsibility of the Company’s management. Our responsibility is to express an opinion on the financial statements based on our
audits.
We conducted our audits in accordance with the standards of the Public Company Accounting Oversight Board (United States).
Those standards require that we plan and perform the audit to obtain reasonable assurance about whether the financial statements are
free of material misstatement. An audit includes examining, on a test basis, evidence supporting the amounts and disclosures in the
financial statements. An audit also includes assessing the accounting principles used and significant estimates made by management, as
well as evaluating the overall financial statement presentation. We believe that our audits provide a reasonable basis for our opinion.
In our opinion, such consolidated financial statements present fairly, in all material respects, the financial position of Diamond
Offshore Drilling, Inc. and subsidiaries at December 31, 2013 and 2012, and the results of their operations and their cash flows for each of
the three years in the period ended December 31, 2013, in conformity with accounting principles generally accepted in the United
States of America.
We have also audited, in accordance with the standards of the Public Company Accounting Oversight Board (United States), the
Company’s internal control over financial reporting as of December 31, 2013, based on the criteria established in Internal Control
—Integrated Framework (1992) issued by the Committee of Sponsoring Organizations of the Treadway Commission and our report
dated February 24, 2014, expressed an unqualified opinion on the Company’s internal control over financial reporting.
/s/ Deloitte & Touche LLP
Houston, Texas
February 24, 2014
44 DIAMOND OFFSHORE / 2013 ANNUAL REPORT

REPORT OF INDEPENDENT REGISTERED PUBLIC ACCOUNTING FIRM
To the Board of Directors and Stockholders of
Diamond Offshore Drilling, Inc. and Subsidiaries
Houston, Texas
We have audited the internal control over financial reporting of Diamond Offshore Drilling, Inc. and subsidiaries (the “Company”) as
of December 31, 2013, based on criteria established in Internal Control — Integrated Framework (1992) issued by the Committee of
Sponsoring Organizations of the Treadway Commission. The Company’s management is responsible for maintaining effective internal
control over financial reporting and for its assessment of the effectiveness of internal control over financial reporting, included in the
accompanying Item 9A of this Form 10-K under the heading “Management’s Annual Report on Internal Control Over Financial
Reporting.” Our responsibility is to express an opinion on the Company’s internal control over financial reporting based on our audit.
We conducted our audit in accordance with the standards of the Public Company Accounting Oversight Board (United States).
Those standards require that we plan and perform the audit to obtain reasonable assurance about whether effective internal control
over financial reporting was maintained in all material respects. Our audit included obtaining an understanding of internal control over
financial reporting, assessing the risk that a material weakness exists, testing and evaluating the design and operating effectiveness of
internal control based on the assessed risk, and performing such other procedures as we considered necessary in the circumstances. We
believe that our audit provides a reasonable basis for our opinion.
A company’s internal control over financial reporting is a process designed by, or under the supervision of, the company’s principal
executive and principal financial officers, or persons performing similar functions, and effected by the company’s board of directors,
management, and other personnel to provide reasonable assurance regarding the reliability of financial reporting and the preparation of
financial statements for external purposes in accordance with generally accepted accounting principles. A company’s internal control
over financial reporting includes those policies and procedures that (1) pertain to the maintenance of records that, in reasonable detail,
accurately and fairly reflect the transactions and dispositions of the assets of the company; (2) provide reasonable assurance that
transactions are recorded as necessary to permit preparation of financial statements in accordance with generally accepted accounting
principles, and that receipts and expenditures of the company are being made only in accordance with authorizations of management
and directors of the company; and (3) provide reasonable assurance regarding prevention or timely detection of unauthorized
acquisition, use, or disposition of the company’s assets that could have a material effect on the financial statements.
Because of the inherent limitations of internal control over financial reporting, including the possibility of collusion or improper
management override of controls, material misstatements due to error or fraud may not be prevented or detected on a timely basis.
Also, projections of any evaluation of the effectiveness of the internal control over financial reporting to future periods are subject to the
risk that the controls may become inadequate because of changes in conditions, or that the degree of compliance with the policies or
procedures may deteriorate.
In our opinion, the Company maintained, in all material respects, effective internal control over financial reporting as of
December 31, 2013, based on the criteria established in Internal Control — Integrated Framework (1992) issued by the Committee of
Sponsoring Organizations of the Treadway Commission.
We have also audited, in accordance with the standards of the Public Company Accounting Oversight Board (United States), the
consolidated financial statements as of and for the year ended December 31, 2013 of the Company and our report dated February 24,
2014 expressed an unqualified opinion on those financial statements.
/s/ Deloitte & Touche LLP
Houston, Texas
February 24, 2014
DIAMOND OFFSHORE / 2013 ANNUAL REPORT 45

DIAMOND OFFSHORE DRILLING, INC.AND SUBSIDIARIES
CONSOLIDATED BALANCE SHEETS(In thousands, except share and per share data)
December 31,
2013 2012
ASSETSCurrent assets:
Cash and cash equivalents . . . . . . . . . . . . . . . . . . . . . . . . . . . . . . . . . . . . . . . . . . . . . . . . . . . . . . . . . . . . . . . . . . . . . . . . . $ 347,011 $ 335,432
Marketable securities . . . . . . . . . . . . . . . . . . . . . . . . . . . . . . . . . . . . . . . . . . . . . . . . . . . . . . . . . . . . . . . . . . . . . . . . . . . . . . 1,750,053 1,150,158
Accounts receivable, net of allowance for bad debts . . . . . . . . . . . . . . . . . . . . . . . . . . . . . . . . . . . . . . . . . . . . . . . . . . 469,355 499,660
Prepaid expenses and other current assets . . . . . . . . . . . . . . . . . . . . . . . . . . . . . . . . . . . . . . . . . . . . . . . . . . . . . . . . . . 143,997 136,099
Assets held for sale . . . . . . . . . . . . . . . . . . . . . . . . . . . . . . . . . . . . . . . . . . . . . . . . . . . . . . . . . . . . . . . . . . . . . . . . . . . . . . . . 7,694 11,594
Total current assets . . . . . . . . . . . . . . . . . . . . . . . . . . . . . . . . . . . . . . . . . . . . . . . . . . . . . . . . . . . . . . . . . . . . . . . . . . . . . 2,718,110 2,132,943
Drilling and other property and equipment, net of accumulated depreciation . . . . . . . . . . . . . . . . . . . . . 5,467,227 4,864,972
Other assets . . . . . . . . . . . . . . . . . . . . . . . . . . . . . . . . . . . . . . . . . . . . . . . . . . . . . . . . . . . . . . . . . . . . . . . . . . . . . . . . . . . . . . . 206,097 237,371
Total assets . . . . . . . . . . . . . . . . . . . . . . . . . . . . . . . . . . . . . . . . . . . . . . . . . . . . . . . . . . . . . . . . . . . . . . . . . . . . . . . . . . . . . $8,391,434 $7,235,286
LIABILITIES AND STOCKHOLDERS’ EQUITYCurrent liabilities:
Accounts payable . . . . . . . . . . . . . . . . . . . . . . . . . . . . . . . . . . . . . . . . . . . . . . . . . . . . . . . . . . . . . . . . . . . . . . . . . . . . . . . . . $ 94,151 $ 96,631
Accrued liabilities . . . . . . . . . . . . . . . . . . . . . . . . . . . . . . . . . . . . . . . . . . . . . . . . . . . . . . . . . . . . . . . . . . . . . . . . . . . . . . . . . . 370,671 324,434
Taxes payable . . . . . . . . . . . . . . . . . . . . . . . . . . . . . . . . . . . . . . . . . . . . . . . . . . . . . . . . . . . . . . . . . . . . . . . . . . . . . . . . . . . . . 30,806 64,481
Current portion of long-term debt . . . . . . . . . . . . . . . . . . . . . . . . . . . . . . . . . . . . . . . . . . . . . . . . . . . . . . . . . . . . . . . . . . 249,954 —
Total current liabilities . . . . . . . . . . . . . . . . . . . . . . . . . . . . . . . . . . . . . . . . . . . . . . . . . . . . . . . . . . . . . . . . . . . . . . . . . . . 745,582 485,546
Long-term debt . . . . . . . . . . . . . . . . . . . . . . . . . . . . . . . . . . . . . . . . . . . . . . . . . . . . . . . . . . . . . . . . . . . . . . . . . . . . . . . . . . . . 2,244,189 1,496,066
Deferred tax liability . . . . . . . . . . . . . . . . . . . . . . . . . . . . . . . . . . . . . . . . . . . . . . . . . . . . . . . . . . . . . . . . . . . . . . . . . . . . . . . 525,541 490,946
Other liabilities . . . . . . . . . . . . . . . . . . . . . . . . . . . . . . . . . . . . . . . . . . . . . . . . . . . . . . . . . . . . . . . . . . . . . . . . . . . . . . . . . . . . 238,864 186,334
Total liabilities . . . . . . . . . . . . . . . . . . . . . . . . . . . . . . . . . . . . . . . . . . . . . . . . . . . . . . . . . . . . . . . . . . . . . . . . . . . . . . . . . . 3,754,176 2,658,892
Commitments and contingencies (Note 11)Stockholders’ equity:
Preferred stock (par value $0.01, 25,000,000 shares authorized, none issued and outstanding) . . . . . . . . . . . — —
Common stock (par value $0.01, 500,000,000 shares authorized; 143,952,248 shares issued and
139,035,448 shares outstanding at December 31, 2013; 143,948,370 shares issued and 139,031,570
shares outstanding at December 31, 2012) . . . . . . . . . . . . . . . . . . . . . . . . . . . . . . . . . . . . . . . . . . . . . . . . . . . . . . . . 1,440 1,439
Additional paid-in capital . . . . . . . . . . . . . . . . . . . . . . . . . . . . . . . . . . . . . . . . . . . . . . . . . . . . . . . . . . . . . . . . . . . . . . . . . . . 1,988,720 1,983,957
Retained earnings . . . . . . . . . . . . . . . . . . . . . . . . . . . . . . . . . . . . . . . . . . . . . . . . . . . . . . . . . . . . . . . . . . . . . . . . . . . . . . . . . 2,761,161 2,702,915
Accumulated other comprehensive gain (loss) . . . . . . . . . . . . . . . . . . . . . . . . . . . . . . . . . . . . . . . . . . . . . . . . . . . . . . . 350 2,496
Treasury stock, at cost (4,916,800 shares of common stock at . . . . . . . . . . . . . . . . . . . . . . . . . . . . . . . . . . . . . . . . .
December 31, 2013 and 2012) . . . . . . . . . . . . . . . . . . . . . . . . . . . . . . . . . . . . . . . . . . . . . . . . . . . . . . . . . . . . . . . . . . . . . (114,413) (114,413)
Total stockholders’ equity . . . . . . . . . . . . . . . . . . . . . . . . . . . . . . . . . . . . . . . . . . . . . . . . . . . . . . . . . . . . . . . . . . . . . . . . 4,637,258 4,576,394
Total liabilities and stockholders’ equity . . . . . . . . . . . . . . . . . . . . . . . . . . . . . . . . . . . . . . . . . . . . . . . . . . . . . . . . . . . $8,391,434 $7,235,286
The accompanying notes are an integral part of the consolidated financial statements.
46 DIAMOND OFFSHORE / 2013 ANNUAL REPORT

DIAMOND OFFSHORE DRILLING, INC.AND SUBSIDIARIES
CONSOLIDATED STATEMENTS OF OPERATIONS(In thousands, except per share data)
Year Ended December 31,
2013 2012 2011
Revenues:Contract drilling . . . . . . . . . . . . . . . . . . . . . . . . . . . . . . . . . . . . . . . . . . . . . . . . . . . . . . . . . . . . . . . . . . . . $2,843,584 $2,936,066 $3,254,313
Revenues related to reimbursable expenses . . . . . . . . . . . . . . . . . . . . . . . . . . . . . . . . . . . . . . . . . . 76,837 50,442 68,106
Total revenues . . . . . . . . . . . . . . . . . . . . . . . . . . . . . . . . . . . . . . . . . . . . . . . . . . . . . . . . . . . . . . . . 2,920,421 2,986,508 3,322,419
Operating expenses:Contract drilling, excluding depreciation . . . . . . . . . . . . . . . . . . . . . . . . . . . . . . . . . . . . . . . . . . . . . . 1,572,525 1,537,224 1,548,502
Reimbursable expenses . . . . . . . . . . . . . . . . . . . . . . . . . . . . . . . . . . . . . . . . . . . . . . . . . . . . . . . . . . . . . 74,967 48,778 66,052
Depreciation . . . . . . . . . . . . . . . . . . . . . . . . . . . . . . . . . . . . . . . . . . . . . . . . . . . . . . . . . . . . . . . . . . . . . . . 388,092 392,913 398,612
General and administrative . . . . . . . . . . . . . . . . . . . . . . . . . . . . . . . . . . . . . . . . . . . . . . . . . . . . . . . . . .
Impairment of assets . . . . . . . . . . . . . . . . . . . . . . . . . . . . . . . . . . . . . . . . . . . . . . . . . . . . . . . . . . . . . . .
64,788
—
64,640
62,437
65,310
—
Bad debt expense (recovery) . . . . . . . . . . . . . . . . . . . . . . . . . . . . . . . . . . . . . . . . . . . . . . . . . . . . . . . . 22,513 (1,018) (6,713)
Gain on disposition of assets . . . . . . . . . . . . . . . . . . . . . . . . . . . . . . . . . . . . . . . . . . . . . . . . . . . . . . . . (4,070) (80,844) (4,758)
Total operating expenses . . . . . . . . . . . . . . . . . . . . . . . . . . . . . . . . . . . . . . . . . . . . . . . . . . . . . . 2,118,815 2,024,130 2,067,005
Operating income . . . . . . . . . . . . . . . . . . . . . . . . . . . . . . . . . . . . . . . . . . . . . . . . . . . . . . . . . . . . . . . . . . . . 801,606 962,378 1,255,414
Other income (expense):Interest income . . . . . . . . . . . . . . . . . . . . . . . . . . . . . . . . . . . . . . . . . . . . . . . . . . . . . . . . . . . . . . . . . . . . 701 4,910 6,668
Interest expense . . . . . . . . . . . . . . . . . . . . . . . . . . . . . . . . . . . . . . . . . . . . . . . . . . . . . . . . . . . . . . . . . . . (24,843) (46,216) (73,137)
Foreign currency transaction loss . . . . . . . . . . . . . . . . . . . . . . . . . . . . . . . . . . . . . . . . . . . . . . . . . . . . (4,915) (1,999) (8,588)
Other, net . . . . . . . . . . . . . . . . . . . . . . . . . . . . . . . . . . . . . . . . . . . . . . . . . . . . . . . . . . . . . . . . . . . . . . . . . 1,691 (992) (1,086)
Income before income tax expense . . . . . . . . . . . . . . . . . . . . . . . . . . . . . . . . . . . . . . . . . . . . . . . . . . . 774,240 918,081 1,179,271
Income tax expense . . . . . . . . . . . . . . . . . . . . . . . . . . . . . . . . . . . . . . . . . . . . . . . . . . . . . . . . . . . . . . . . . . (225,554) (197,604) (216,729)
Net income . . . . . . . . . . . . . . . . . . . . . . . . . . . . . . . . . . . . . . . . . . . . . . . . . . . . . . . . . . . . . . . . . . . . . . . . . . . $ 548,686 $ 720,477 $ 962,542
Earnings per share, Basic and Diluted . . . . . . . . . . . . . . . . . . . . . . . . . . . . . . . . . . . . . . . . . . . . . . . . $ 3.95 $ 5.18 $ 6.92
Weighted-average shares outstanding:Shares of common stock . . . . . . . . . . . . . . . . . . . . . . . . . . . . . . . . . . . . . . . . . . . . . . . . . . . . . . . . . . . 139,035 139,029 139,027
Dilutive potential shares of common stock . . . . . . . . . . . . . . . . . . . . . . . . . . . . . . . . . . . . . . . . . . . 29 19 11
Total weighted-average shares outstanding . . . . . . . . . . . . . . . . . . . . . . . . . . . . . . . . . . . . . . . . 139,064 139,048 139,038
Cash dividends declared per share of common stock . . . . . . . . . . . . . . . . . . . . . . . . . . . . . . . . . . . . . . . $ 3.50 $ 3.50 $ 3.50
The accompanying notes are an integral part of the consolidated financial statements.
DIAMOND OFFSHORE / 2013 ANNUAL REPORT 47
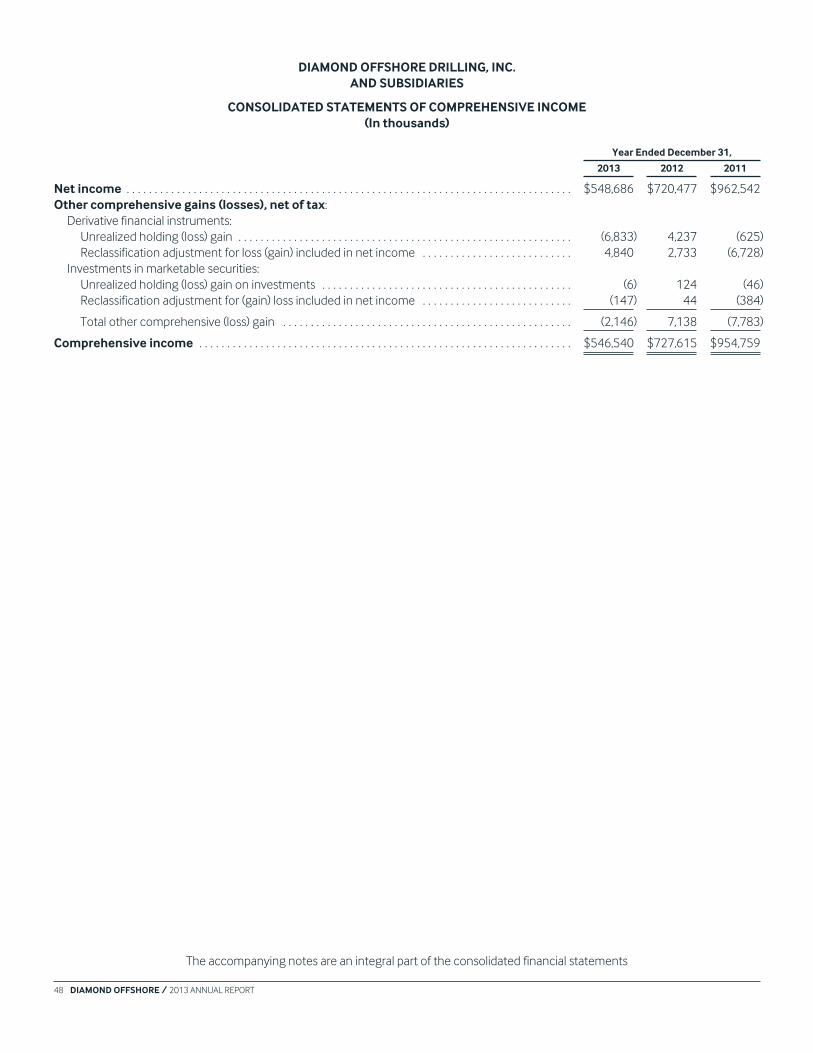
DIAMOND OFFSHORE DRILLING, INC.AND SUBSIDIARIES
CONSOLIDATED STATEMENTS OF COMPREHENSIVE INCOME(In thousands)
Year Ended December 31,
2013 2012 2011
Net income . . . . . . . . . . . . . . . . . . . . . . . . . . . . . . . . . . . . . . . . . . . . . . . . . . . . . . . . . . . . . . . . . . . . . . . . . . . . . . . . $548,686 $720,477 $962,542
Other comprehensive gains (losses), net of tax:
Derivative financial instruments:
Unrealized holding (loss) gain . . . . . . . . . . . . . . . . . . . . . . . . . . . . . . . . . . . . . . . . . . . . . . . . . . . . . . . . . . . . (6,833) 4,237 (625)
Reclassification adjustment for loss (gain) included in net income . . . . . . . . . . . . . . . . . . . . . . . . . . . 4,840 2,733 (6,728)
Investments in marketable securities:
Unrealized holding (loss) gain on investments . . . . . . . . . . . . . . . . . . . . . . . . . . . . . . . . . . . . . . . . . . . . . (6) 124 (46)
Reclassification adjustment for (gain) loss included in net income . . . . . . . . . . . . . . . . . . . . . . . . . . . (147) 44 (384)
Total other comprehensive (loss) gain . . . . . . . . . . . . . . . . . . . . . . . . . . . . . . . . . . . . . . . . . . . . . . . . . . . . (2,146) 7,138 (7,783)
Comprehensive income . . . . . . . . . . . . . . . . . . . . . . . . . . . . . . . . . . . . . . . . . . . . . . . . . . . . . . . . . . . . . . . . . . . $546,540 $727,615 $954,759
The accompanying notes are an integral part of the consolidated financial statements
48 DIAMOND OFFSHORE / 2013 ANNUAL REPORT

DIAMOND OFFSHORE DRILLING, INC.AND SUBSIDIARIES
CONSOLIDATED STATEMENTS OF STOCKHOLDERS’ EQUITY(In thousands, except number of shares)
Common Stock AdditionalPaid-InCapital
RetainedEarnings
AccumulatedOther
ComprehensiveGains (Losses)
Treasury Stock TotalStockholders’
EquityShares Amount Shares Amount
January 1, 2011 . . . . . . . . . . . . . . . . . . . 143,943,624 $1,439 $1,972,550 $1,998,995 $ 3,141 4,916,800 $(114,413) $3,861,712
Net income . . . . . . . . . . . . . . . . . . . . . . . . — — — 962,542 — — — 962,542
Dividends to stockholders ($3.50 per
share) . . . . . . . . . . . . . . . . . . . . . . . . . . . — — — (486,595) — — — (486,595)
Anti-dilution adjustment paid to stock
plan participants ($3.00 per
share) . . . . . . . . . . . . . . . . . . . . . . . . . . . — — — (2,632) — — — (2,632)
Stock options exercised . . . . . . . . . . . . . 385 — — — — — — —
Stock-based compensation, net of
tax . . . . . . . . . . . . . . . . . . . . . . . . . . . . . . — — 5,819 — — — — 5,819
Net loss on derivative financial
instruments . . . . . . . . . . . . . . . . . . . . . — — — — (7,353) — — (7,353)
Net loss on investments . . . . . . . . . . . . . — — — — (430) — — (430)
December 31, 2011 . . . . . . . . . . . . . . . 143,944,009 1,439 1,978,369 2,472,310 (4,642) 4,916,800 (114,413) 4,333,063
Net income . . . . . . . . . . . . . . . . . . . . . . . . — — — 720,477 — — — 720,477
Dividends to stockholders ($3.50 per
share) . . . . . . . . . . . . . . . . . . . . . . . . . . . — — — (486,603) — — — (486,603)
Anti-dilution adjustment paid to stock
plan participants ($3.00 per
share) . . . . . . . . . . . . . . . . . . . . . . . . . . . — — — (3,269) — — — (3,269)
Stock options exercised . . . . . . . . . . . . . 4,361 — 148 — — — — 148
Stock-based compensation, net of
tax . . . . . . . . . . . . . . . . . . . . . . . . . . . . . . — — 5,440 — — — — 5,440
Net gain on derivative financial
instruments . . . . . . . . . . . . . . . . . . . . . — — — — 6,970 — — 6,970
Net gain on investments . . . . . . . . . . . . — — — — 168 — — 168
December 31, 2012 . . . . . . . . . . . . . . . 143,948,370 1,439 1,983,957 2,702,915 2,496 4,916,800 (114,413) 4,576,394
Net income . . . . . . . . . . . . . . . . . . . . . . . . — — — 548,686 — — — 548,686
Dividends to stockholders ($3.50 per
share) . . . . . . . . . . . . . . . . . . . . . . . . . . . — — — (486,620) — — — (486,620)
Anti-dilution adjustment paid to stock
plan participants ($3.00 per
share) . . . . . . . . . . . . . . . . . . . . . . . . . . . — — — (3,820) — — — (3,820)
Stock options exercised . . . . . . . . . . . . . 3,878 1 109 — — — — 110
Stock-based compensation, net of
tax . . . . . . . . . . . . . . . . . . . . . . . . . . . . . . — — 4,654 — — — — 4,654
Net gain on derivative financial
instruments . . . . . . . . . . . . . . . . . . . . . — — — — (1,993) — — (1,993)
Net gain on investments . . . . . . . . . . . . — — — — (153) — — (153)
December 31, 2013 . . . . . . . . . . . . . . . 143,952,248 $1,440 $1,988,720 $2,761,161 $ 350 4,916,800 $(114,413) $4,637,258
The accompanying notes are an integral part of the consolidated financial statements.
DIAMOND OFFSHORE / 2013 ANNUAL REPORT 49

DIAMOND OFFSHORE DRILLING, INC.AND SUBSIDIARIES
CONSOLIDATED STATEMENTS OF CASH FLOWS(In thousands)
Year Ended December 31,
2013 2012 2011
Operating activities:
Net income . . . . . . . . . . . . . . . . . . . . . . . . . . . . . . . . . . . . . . . . . . . . . . . . . . . . . . . . . . . . . . . . . . . . . . . . $ 548,686 $ 720,477 $ 962,542
Adjustments to reconcile net income to net cash provided by operating activities:
Depreciation . . . . . . . . . . . . . . . . . . . . . . . . . . . . . . . . . . . . . . . . . . . . . . . . . . . . . . . . . . . . . . . . . . . . . 388,092 392,913 398,612
Impairment of assets . . . . . . . . . . . . . . . . . . . . . . . . . . . . . . . . . . . . . . . . . . . . . . . . . . . . . . . . . . . . . — 62,437 —
Gain on disposition of assets . . . . . . . . . . . . . . . . . . . . . . . . . . . . . . . . . . . . . . . . . . . . . . . . . . . . . . (4,070) (80,844) (4,758)
Bad debt expense (recovery) . . . . . . . . . . . . . . . . . . . . . . . . . . . . . . . . . . . . . . . . . . . . . . . . . . . . . . 22,513 (1,018) (6,713)
Loss (gain) on foreign currency forward exchange contracts . . . . . . . . . . . . . . . . . . . . . . . . . . 6,501 4,302 (7,206)
Deferred tax provision . . . . . . . . . . . . . . . . . . . . . . . . . . . . . . . . . . . . . . . . . . . . . . . . . . . . . . . . . . . . 34,101 (51,472) 2,141
Accretion of discounts on marketable securities . . . . . . . . . . . . . . . . . . . . . . . . . . . . . . . . . . . . . (707) 4,622 1,586
Stock-based compensation expense . . . . . . . . . . . . . . . . . . . . . . . . . . . . . . . . . . . . . . . . . . . . . . . 3,573 4,357 4,956
Deferred income, net . . . . . . . . . . . . . . . . . . . . . . . . . . . . . . . . . . . . . . . . . . . . . . . . . . . . . . . . . . . . . (54,274) 1,767 (32,219)
Deferred expenses, net . . . . . . . . . . . . . . . . . . . . . . . . . . . . . . . . . . . . . . . . . . . . . . . . . . . . . . . . . . . 25,604 67,824 53,317
Long-term employee remuneration programs . . . . . . . . . . . . . . . . . . . . . . . . . . . . . . . . . . . . . . 8,966 7,611 3,944
Other assets, noncurrent . . . . . . . . . . . . . . . . . . . . . . . . . . . . . . . . . . . . . . . . . . . . . . . . . . . . . . . . . . (4,922) (2,794) 2,220
Other liabilities, noncurrent . . . . . . . . . . . . . . . . . . . . . . . . . . . . . . . . . . . . . . . . . . . . . . . . . . . . . . . . (5,296) 3,614 6,921
(Payments of) proceeds from settlement of foreign currency forward exchange contracts
designated as accounting hedges . . . . . . . . . . . . . . . . . . . . . . . . . . . . . . . . . . . . . . . . . . . . . . . . . (6,501) (4,302) 7,206
Bank deposits denominated in nonconvertible currencies . . . . . . . . . . . . . . . . . . . . . . . . . . . . . . (12,741) — —
Other . . . . . . . . . . . . . . . . . . . . . . . . . . . . . . . . . . . . . . . . . . . . . . . . . . . . . . . . . . . . . . . . . . . . . . . . . . . . . . 1,954 1,258 319
Changes in operating assets and liabilities:
Accounts receivable . . . . . . . . . . . . . . . . . . . . . . . . . . . . . . . . . . . . . . . . . . . . . . . . . . . . . . . . . . . . . . 7,905 65,074 67,498
Prepaid expenses and other current assets . . . . . . . . . . . . . . . . . . . . . . . . . . . . . . . . . . . . . . . . . 10,066 (8,960) (6,406)
Accounts payable and accrued liabilities . . . . . . . . . . . . . . . . . . . . . . . . . . . . . . . . . . . . . . . . . . . . 46,752 10,354 (9,842)
Taxes payable . . . . . . . . . . . . . . . . . . . . . . . . . . . . . . . . . . . . . . . . . . . . . . . . . . . . . . . . . . . . . . . . . . . . 49,786 114,049 (24,013)
Net cash provided by operating activities . . . . . . . . . . . . . . . . . . . . . . . . . . . . . . . . . . . . . . . . . . . 1,065,988 1,311,269 1,420,105
Investing activities:
Capital expenditures (including rig construction) . . . . . . . . . . . . . . . . . . . . . . . . . . . . . . . . . . . . (957,598) (702,041) (774,756)
Proceeds from disposition of assets, net of disposal costs . . . . . . . . . . . . . . . . . . . . . . . . . . . . 4,900 138,495 5,603
Proceeds from sale and maturities of marketable securities . . . . . . . . . . . . . . . . . . . . . . . . . . 4,650,085 2,725,118 5,362,138
Purchases of marketable securities . . . . . . . . . . . . . . . . . . . . . . . . . . . . . . . . . . . . . . . . . . . . . . . . (5,249,462) (2,977,290) (5,653,665)
Net cash used in investing activities . . . . . . . . . . . . . . . . . . . . . . . . . . . . . . . . . . . . . . . . . . . . . . (1,552,075) (815,718) (1,060,680)
Financing activities:
Issuance of senior notes . . . . . . . . . . . . . . . . . . . . . . . . . . . . . . . . . . . . . . . . . . . . . . . . . . . . . . . . . . 997,805 — —
Debt issuance costs and arrangement fees . . . . . . . . . . . . . . . . . . . . . . . . . . . . . . . . . . . . . . . . . (9,973) (3,838) —
Payment of dividends . . . . . . . . . . . . . . . . . . . . . . . . . . . . . . . . . . . . . . . . . . . . . . . . . . . . . . . . . . . . . (490,331) (490,245) (490,057)
Other . . . . . . . . . . . . . . . . . . . . . . . . . . . . . . . . . . . . . . . . . . . . . . . . . . . . . . . . . . . . . . . . . . . . . . . . . . . 165 199 4
Net cash used in financing activities . . . . . . . . . . . . . . . . . . . . . . . . . . . . . . . . . . . . . . . . . . . . . 497,666 (493,884) (490,053)
Net change in cash and cash equivalents . . . . . . . . . . . . . . . . . . . . . . . . . . . . . . . . . . . . . . . . . . . 11,579 1,667 (130,628)
Cash and cash equivalents, beginning of year . . . . . . . . . . . . . . . . . . . . . . . . . . . . . . . . . . . . . . . 335,432 333,765 464,393
Cash and cash equivalents, end of year . . . . . . . . . . . . . . . . . . . . . . . . . . . . . . . . . . . . . . . . . . . . . $ 347,011 $ 335,432 $ 333,765
The accompanying notes are an integral part of the consolidated financial statements.
50 DIAMOND OFFSHORE / 2013 ANNUAL REPORT
DIAMOND OFFSHORE DRILLING, INC.AND SUBSIDIARIES
NOTES TO CONSOLIDATED FINANCIAL STATEMENTS
1. General Information
Diamond Offshore Drilling, Inc. is a leader in offshore drilling, providing contract drilling services to the energy industry around the
globe with a fleet of 45 offshore drilling rigs, including five rigs under construction. Our fleet consists of 33 semisubmersibles, two of
which are under construction, seven jack-ups, one of which is held for sale, and five dynamically positioned drillships, three of which are
under construction. At December 31, 2013, one of our jack-up rigs, the Ocean Spartan, was reported as “Asset held for sale” in our
Consolidated Balance Sheets. Unless the context otherwise requires, references in these Notes to “Diamond Offshore,” “we,” “us” or “our”
mean Diamond Offshore Drilling, Inc. and our consolidated subsidiaries. We were incorporated in Delaware in 1989.
As of February 18, 2014, Loews Corporation, or Loews, owned 50.4% of the outstanding shares of our common stock.
Principles of Consolidation
Our consolidated financial statements include the accounts of Diamond Offshore Drilling, Inc. and our subsidiaries after elimination
of intercompany transactions and balances.
Use of Estimates in the Preparation of Financial Statements
The preparation of financial statements in conformity with accounting principles generally accepted in the United States, or U.S., or
GAAP, requires management to make estimates and assumptions that affect the reported amounts of assets and liabilities and
disclosure of contingent assets and liabilities at the date of the financial statements and the reported amount of revenues and expenses
during the reporting period. Actual results could differ from those estimated.
Reclassifications
Certain amounts applicable to the prior periods have been reclassified to conform to the classifications currently followed. Such
reclassifications did not affect earnings.
Cash and Cash Equivalents
We consider short-term, highly liquid investments that have an original maturity of three months or less and deposits in money
market mutual funds that are readily convertible into cash to be cash equivalents. We had bank deposits denominated in Egyptian
pounds totaling $14.3 million at December 31, 2013. However, the local currency is not readily convertible into U.S. dollars or other
currencies at this time. While we believe that a portion of these amounts will be used to fund local operations and obligations in Egyptian
pounds in the short term, we reclassified $12.7 million to “Other assets” in our Consolidated Balance Sheets at December 31, 2013.
The effect of exchange rate changes on cash balances held in foreign currencies was not material for the years ended
December 31, 2013, 2012 and 2011.
Marketable Securities
We classify our investments in marketable securities as available for sale and they are stated at fair value in our Consolidated
Balance Sheets. Accordingly, any unrealized gains and losses, net of taxes, are reported in our Consolidated Balance Sheets in
“Accumulated other comprehensive gain (loss)” until realized. The cost of debt securities is adjusted for amortization of premiums and
accretion of discounts to maturity and such adjustments are included in our Consolidated Statements of Operations in “Interest income.”
The sale and purchase of securities are recorded on the date of the trade. The cost of debt securities sold is based on the specific
identification method. Realized gains or losses, as well as any declines in value that are judged to be other than temporary, are reported
in our Consolidated Statements of Operations in “Other income (expense) — Other, net.”
Provision for Bad Debts
We record a provision for bad debts on a case-by-case basis when facts and circumstances indicate that a customer receivable may
not be collectible. In establishing these reserves, we consider historical and other factors that predict collectability, including write-offs,
recoveries and the monitoring of credit quality. Such provision is reported as a component of “Operating expense” in our Consolidated
Statements of Operations. See Note 2.
DIAMOND OFFSHORE / 2013 ANNUAL REPORT 51

DIAMOND OFFSHORE DRILLING, INC.AND SUBSIDIARIES
NOTES TO CONSOLIDATED FINANCIAL STATEMENTS — (Continued)
Derivative Financial Instruments
Our derivative financial instruments consist primarily of foreign currency forward exchange, or FOREX, contracts which we may
designate as cash flow hedges. In accordance with GAAP, each derivative contract is stated in the balance sheet at its fair value with gains
and losses reflected in the income statement except that, to the extent the derivative qualifies for and is designated as an accounting
hedge, the gains and losses are reflected in income in the same period as offsetting gains and losses on the qualifying hedged positions.
Designated hedges are expected to be highly effective, and therefore, adjustments to record the carrying value of the effective portion of
our derivative financial instruments to their fair value are recorded as a component of “Accumulated other comprehensive gain (loss),” or
AOCGL, in our Consolidated Balance Sheets. The effective portion of the cash flow hedge will remain in AOCGL until it is reclassified into
earnings in the period or periods during which the hedged transaction affects earnings or it is determined that the hedged transaction
will not occur. We report such realized gains and losses as a component of “Contract drilling, excluding depreciation” expense in our
Consolidated Statements of Operations to offset the impact of foreign currency fluctuations in our expenditures in local foreign
currencies in the countries in which we operate.
Adjustments to record the carrying value of the ineffective portion of our derivative financial instruments to fair value and realized
gains or losses upon settlement of derivative contracts not designated as cash flow hedges are reported as “Foreign currency transaction
gain (loss)” in our Consolidated Statements of Operations. See Notes 6 and 7.
Assets Held For Sale
In 2012, our management adopted a plan to actively market for sale three mid-water semisubmersibles, the Ocean Epoch, the
Ocean New Era and the Ocean Whittington, and one jack-up rig, the Ocean Spartan. This decision was based on management’s review of
our drilling fleet at the end of 2012 and their assessment that three of these rigs had no short-term outlook for work due to their age and
capabilities. These rigs were put on the market for sale at the end of 2012.
In connection with the reclassification of these rigs to “Assets held for sale,” we measured the fair value of each rig in the disposal
group using a probability-weighted cash flow analysis that utilized significant unobservable inputs, representing a Level 3 fair value
measurement, which included assumptions for estimated proceeds that may be received upon disposition of the rig and estimated costs
to sell. For our three mid-water semisubmersibles in the disposal group, we determined, at that time, that, due to the expected resale
market for rigs of this type and age, the highest and best use of these rigs would be for sale as scrap. Based on our analyses, we
determined that the carrying values of the mid-water semisubmersible rigs in the disposal group were impaired, as the carrying value for
each exceeded its aggregate fair value, and recognized an impairment loss in the fourth quarter of 2012. We determined that the
carrying value of the Ocean Spartan was not impaired.
These rigs were not sold during 2013. The three mid-water semisubmersible rigs have been transferred to “Drilling and Other
Property and Equipment” at their aggregate fair value of $3.9 million. Only the Ocean Spartan was reported as “Assets Held for Sale” at
December 31, 2013. We reported “Assets held for sale” aggregating $7.7 million and $11.6 million in our Consolidated Balance Sheets at
December 31, 2013 and 2012, respectively. See “Impairment of Long-Lived Assets” and Note 7.
Drilling and Other Property and Equipment
We carry our drilling and other property and equipment at cost. Maintenance and routine repairs are charged to income currently
while replacements and betterments, which upgrade or increase the functionality of our existing equipment and that significantly extend
the useful life of an existing asset, are capitalized. Significant judgments, assumptions and estimates may be required in determining
whether or not such replacements and betterments meet the criteria for capitalization and in determining useful lives and salvage values
of such assets. Changes in these judgments, assumptions and estimates could produce results that differ from those reported.
Historically, the amount of capital additions requiring significant judgments, assumptions or estimates has not been significant. During
the years ended December 31, 2013 and 2012, we capitalized $302.0 million and $220.3 million, respectively, in replacements and
betterments of our drilling fleet, resulting from numerous projects ranging from $25,000 to $40 million per project.
Costs incurred for major rig upgrades and/or the construction of rigs are accumulated in construction work-in-progress, with no
depreciation recorded on the additions, until the month the upgrade or newbuild is completed and the rig is placed in service. Upon
retirement or sale of a rig, the cost and related accumulated depreciation are removed from the respective accounts and any gains or
52 DIAMOND OFFSHORE / 2013 ANNUAL REPORT

DIAMOND OFFSHORE DRILLING, INC.AND SUBSIDIARIES
NOTES TO CONSOLIDATED FINANCIAL STATEMENTS — (Continued)
losses are included in our results of operations as “Gain on disposition of assets.” Depreciation is recognized up to applicable salvage
values by applying the straight-line method over the remaining estimated useful lives from the year the asset is placed in service. Drilling
rigs and equipment are depreciated over their estimated useful lives ranging from 3 to 30 years.
Capitalized Interest
We capitalize interest cost for qualifying construction and upgrade projects. During the three years ended December 31, 2013, we
capitalized interest on qualifying expenditures, primarily related to our rig construction projects. See Note 8.
A reconciliation of our total interest cost to “Interest expense” as reported in our Consolidated Statements of Operations is as
follows:
For the Year Ended December 31,
2013 2012 2011
(In thousands)
Total interest cost including amortization of debt issuance costs . . . . . . . . . . . . . . . . . . . . . . $ 99,080 $ 83,890 $ 84,349
Capitalized interest . . . . . . . . . . . . . . . . . . . . . . . . . . . . . . . . . . . . . . . . . . . . . . . . . . . . . . . . . . . . . . . (74,237) (37,674) (11,212)
Total interest expense as reported . . . . . . . . . . . . . . . . . . . . . . . . . . . . . . . . . . . . . . . . . . . . . . . $ 24,843 $ 46,216 $ 73,137
Asset Retirement Obligations
At December 31, 2013 and 2012, we had no asset retirement obligations.
Impairment of Long-Lived Assets
We evaluate our property and equipment for impairment whenever changes in circumstances indicate that the carrying amount of
an asset may not be recoverable (such as cold stacking a rig or excess spending over budget on a newbuild, construction project or
major rig upgrade). We utilize an undiscounted probability-weighted cash flow analysis in testing an asset for potential impairment. Our
assumptions and estimates underlying this analysis include the following:
• dayrate by rig;
• utilization rate by rig (expressed as the actual percentage of time per year that the rig would be used);
• the per day operating cost for each rig if active, warm stacked or cold stacked;
• the estimated annual cost for rig replacements and/or enhancement programs;
• the estimated maintenance, inspection or other costs associated with a rig returning to work;
• salvage value for each rig; and
• estimated proceeds that may be received on disposition of the rig.
Based on these assumptions and estimates, we develop a matrix using several different utilization/dayrate scenarios, to each of
which we have assigned a probability of occurrence. The sum of our utilization scenarios (which include active, warm stacked and cold
stacked) and probability of occurrence scenarios both equal 100% in the aggregate. We reevaluate our cold-stacked rigs annually, by
updating the matrices for each rig and modifying our assumptions, giving consideration to the length of time the rig has been cold
stacked, the current and expected market for the type of rig and expectations of future oil and gas prices.
At December 31, 2012, our four cold-stacked rigs were reported as “Assets held for sale” and had an aggregate net book value of
$11.6 million. In connection with the presentation of these rigs as held for sale at the end of 2012, we recognized an impairment loss of
$62.4 million. These four rigs remained cold stacked at December 31, 2013. We did not record any impairment with respect to our cold-
stacked rigs at December 31, 2013. See “Assets Held for Sale.”
DIAMOND OFFSHORE / 2013 ANNUAL REPORT 53

DIAMOND OFFSHORE DRILLING, INC.AND SUBSIDIARIES
NOTES TO CONSOLIDATED FINANCIAL STATEMENTS — (Continued)
Management’s assumptions are an inherent part of our asset impairment evaluation and the use of different assumptions could
produce results that differ from those reported.
Fair Value of Financial Instruments
We believe that the carrying amount of our current financial instruments approximates fair value because of the short maturity of
these instruments. For non-current financial instruments we use quoted market prices, when available, and discounted cash flows to
estimate fair value. See Note 7.
Debt Issuance Costs
Debt issuance costs are included in our Consolidated Balance Sheets in “Other assets” and are amortized over the respective terms
of the related debt.
Income Taxes
We account for income taxes in accordance with accounting standards that require the recognition of the amount of taxes payable
or refundable for the current year and an asset and liability approach in recognizing the amount of deferred tax liabilities and assets for
the future tax consequences of events that have been currently recognized in our financial statements or tax returns. In each of our tax
jurisdictions we recognize a current tax liability or asset for the estimated taxes payable or refundable on tax returns for the current year
and a deferred tax asset or liability for the estimated future tax effects attributable to temporary differences and carryforwards. Deferred
tax assets are reduced by a valuation allowance, if necessary, which is determined by the amount of any tax benefits that, based on
available evidence, are not expected to be realized under a “more likely than not” approach. We make judgments regarding future events
and related estimates especially as they pertain to the forecasting of our effective tax rate, the potential realization of deferred tax assets
such as utilization of foreign tax credits, and exposure to the disallowance of items deducted on tax returns upon audit.
We record interest related to accrued unrecognized tax positions in interest expense and recognize penalties associated with
uncertain tax positions in our tax expense. See Note 13.
Treasury Stock
Depending on market conditions, we may, from time to time, purchase shares of our common stock in the open market or
otherwise. We account for the purchase of treasury stock using the cost method, which reports the cost of the shares acquired in
“Treasury stock” as a deduction from stockholders’ equity in our Consolidated Balance Sheets. We did not repurchase any shares of our
outstanding common stock during 2013, 2012 or 2011.
Comprehensive Income (Loss)
Comprehensive income (loss) is the change in equity of a business enterprise during a period from transactions and other events
and circumstances except those transactions resulting from investments by owners and distributions to owners. Comprehensive income
(loss) for the three years ended December 31, 2013, 2012 and 2011 includes net income (loss) and unrealized holding gains and losses
on marketable securities and financial derivatives designated as cash flow accounting hedges. See Note 10.
Foreign Currency
Our functional currency is the U.S. dollar. Foreign currency transaction gains and losses are reported as “Foreign currency
transaction gain (loss)” in our Consolidated Statements of Operations and include, when applicable, unrealized gains and losses to record
the carrying value of our FOREX contracts not designated as accounting hedges, as well as realized gains and losses from the settlement
of such contracts. For the years ended December 31, 2013, 2012 and 2011, we recognized aggregate net foreign currency gains (losses)
of $(4.9) million, $(2.0) million and $(8.6) million, respectively. See Note 6.
54 DIAMOND OFFSHORE / 2013 ANNUAL REPORT

DIAMOND OFFSHORE DRILLING, INC.AND SUBSIDIARIES
NOTES TO CONSOLIDATED FINANCIAL STATEMENTS — (Continued)
Revenue Recognition
We recognize revenue from dayrate drilling contracts as services are performed. In connection with such drilling contracts, we may
receive fees (either lump-sum or dayrate) for the mobilization of equipment. We earn these fees as services are performed over the initial
term of the related drilling contracts. We defer mobilization fees received, as well as direct and incremental mobilization costs incurred,
and amortize each, on a straight-line basis, over the term of the related drilling contracts (which is the period we estimate to be benefited
from the mobilization activity). Straight-line amortization of mobilization revenues and related costs over the term of the related drilling
contracts (which generally range from 2 to 60 months) is consistent with the timing of net cash flows generated from the actual drilling
services performed. Absent a contract, mobilization costs are recognized currently.
Some of our drilling contracts require downtime before the start of the contract to prepare the rig to meet customer requirements.
At times, we may be compensated by the customer for such work (either lump-sum or dayrate). These fees are generally earned as
services are performed over the initial term of the related drilling contracts. We defer contract preparation fees received, as well as direct
and incremental costs associated with the contract preparation activities and amortize each, on a straight-line basis, over the term of the
related drilling contracts (which we estimate to be benefited from the contract preparation activity).
From time to time, we may receive fees from our customers for capital improvements to our rigs (either lump-sum or dayrate). We
defer such fees received in “Accrued liabilities” and “Other liabilities” in our Consolidated Balance Sheets and recognize these fees into
income on a straight-line basis over the period of the related drilling contract. We capitalize the costs of such capital improvements and
depreciate them over the estimated useful life of the improvement.
We record reimbursements received for the purchase of supplies, equipment, personnel services and other services provided at the
request of our customers in accordance with a contract or agreement, for the gross amount billed to the customer, as “Revenues related
to reimbursable expenses” in our Consolidated Statements of Operations.
2. Supplemental Financial Information
Consolidated Balance Sheet Information
Accounts receivable, net of allowance for bad debts, consists of the following:
December 31,
2013 2012
(In thousands)
Trade receivables . . . . . . . . . . . . . . . . . . . . . . . . . . . . . . . . . . . . . . . . . . . . . . . . . . . . . . . . . . . . . . . . . . . . . . . . . . . $473,013 $478,930
Value added tax receivables . . . . . . . . . . . . . . . . . . . . . . . . . . . . . . . . . . . . . . . . . . . . . . . . . . . . . . . . . . . . . . . . . . 19,407 13,884
Amounts held in escrow . . . . . . . . . . . . . . . . . . . . . . . . . . . . . . . . . . . . . . . . . . . . . . . . . . . . . . . . . . . . . . . . . . . . . 3,066 11,555
Interest receivable . . . . . . . . . . . . . . . . . . . . . . . . . . . . . . . . . . . . . . . . . . . . . . . . . . . . . . . . . . . . . . . . . . . . . . . . . . 7 6
Related party receivables . . . . . . . . . . . . . . . . . . . . . . . . . . . . . . . . . . . . . . . . . . . . . . . . . . . . . . . . . . . . . . . . . . . . 587 527
Other . . . . . . . . . . . . . . . . . . . . . . . . . . . . . . . . . . . . . . . . . . . . . . . . . . . . . . . . . . . . . . . . . . . . . . . . . . . . . . . . . . . . . . 615 216
496,695 505,118
Allowance for bad debts . . . . . . . . . . . . . . . . . . . . . . . . . . . . . . . . . . . . . . . . . . . . . . . . . . . . . . . . . . . . . . . . . . . . . (27,340) (5,458)
Total . . . . . . . . . . . . . . . . . . . . . . . . . . . . . . . . . . . . . . . . . . . . . . . . . . . . . . . . . . . . . . . . . . . . . . . . . . . . . . . . . . . . $469,355 $499,660
DIAMOND OFFSHORE / 2013 ANNUAL REPORT 55

DIAMOND OFFSHORE DRILLING, INC.AND SUBSIDIARIES
NOTES TO CONSOLIDATED FINANCIAL STATEMENTS — (Continued)
An analysis of the changes in our provision for bad debts for each of the three years ended December 31, 2013, 2012 and 2011 is
as follows (see Note 7):
For the Year Ended December 31,
2013 2012 2011
(In thousands)
Allowance for bad debts, beginning of year . . . . . . . . . . . . . . . . . . . . . . . . . . . . . . . . . . . . . . . . . . . $ 5,458 $ 6,867 $ 31,908
Bad debt expense:
Provision for bad debts . . . . . . . . . . . . . . . . . . . . . . . . . . . . . . . . . . . . . . . . . . . . . . . . . . . . . . . . . 22,513 — 5,688
Recovery of bad debts . . . . . . . . . . . . . . . . . . . . . . . . . . . . . . . . . . . . . . . . . . . . . . . . . . . . . . . . . — (1,018) (12,401)
Total bad debt expense (recovery) . . . . . . . . . . . . . . . . . . . . . . . . . . . . . . . . . . . . . . . . . . . . 22,513 (1,018) (6,713)
Write off of uncollectible accounts against reserve . . . . . . . . . . . . . . . . . . . . . . . . . . . . . . . . . . (509) (391) (18,380)
Other(1) . . . . . . . . . . . . . . . . . . . . . . . . . . . . . . . . . . . . . . . . . . . . . . . . . . . . . . . . . . . . . . . . . . . . . . . . . (122) — 52
Allowance for bad debts, end of year . . . . . . . . . . . . . . . . . . . . . . . . . . . . . . . . . . . . . . . . . . . . . . . . . $27,340 $ 5,458 $ 6,867
(1) Includes revaluation adjustments for non-U.S. dollar denominated receivables, which have been recorded as “Foreign currency
transaction gain (loss)” in our Consolidated Statements of Operations.
Prepaid expenses and other current assets consist of the following:
December 31,
2013 2012
(In thousands)
Rig spare parts and supplies . . . . . . . . . . . . . . . . . . . . . . . . . . . . . . . . . . . . . . . . . . . . . . . . . . . . . . . . . . . . . . . . . . $ 52,439 $ 57,558
Deferred mobilization costs . . . . . . . . . . . . . . . . . . . . . . . . . . . . . . . . . . . . . . . . . . . . . . . . . . . . . . . . . . . . . . . . . . 20,274 38,074
Prepaid insurance . . . . . . . . . . . . . . . . . . . . . . . . . . . . . . . . . . . . . . . . . . . . . . . . . . . . . . . . . . . . . . . . . . . . . . . . . . . 12,503 12,549
Deferred tax assets . . . . . . . . . . . . . . . . . . . . . . . . . . . . . . . . . . . . . . . . . . . . . . . . . . . . . . . . . . . . . . . . . . . . . . . . . . 10,221 8,619
Prepaid taxes . . . . . . . . . . . . . . . . . . . . . . . . . . . . . . . . . . . . . . . . . . . . . . . . . . . . . . . . . . . . . . . . . . . . . . . . . . . . . . . 42,058 5,950
FOREX contracts . . . . . . . . . . . . . . . . . . . . . . . . . . . . . . . . . . . . . . . . . . . . . . . . . . . . . . . . . . . . . . . . . . . . . . . . . . . . 1,562 3,627
Other . . . . . . . . . . . . . . . . . . . . . . . . . . . . . . . . . . . . . . . . . . . . . . . . . . . . . . . . . . . . . . . . . . . . . . . . . . . . . . . . . . . . . . 4,940 9,722
Total . . . . . . . . . . . . . . . . . . . . . . . . . . . . . . . . . . . . . . . . . . . . . . . . . . . . . . . . . . . . . . . . . . . . . . . . . . . . . . . . . . . . $143,997 $136,099
Accrued liabilities consist of the following:
December 31,
2013 2012
(In thousands)
Rig operating expenses . . . . . . . . . . . . . . . . . . . . . . . . . . . . . . . . . . . . . . . . . . . . . . . . . . . . . . . . . . . . . . . . . . . . . . $ 87,307 $ 70,078
Payroll and benefits . . . . . . . . . . . . . . . . . . . . . . . . . . . . . . . . . . . . . . . . . . . . . . . . . . . . . . . . . . . . . . . . . . . . . . . . . 121,387 88,612
Deferred revenue . . . . . . . . . . . . . . . . . . . . . . . . . . . . . . . . . . . . . . . . . . . . . . . . . . . . . . . . . . . . . . . . . . . . . . . . . . . 26,975 71,699
Accrued capital project/upgrade costs . . . . . . . . . . . . . . . . . . . . . . . . . . . . . . . . . . . . . . . . . . . . . . . . . . . . . . . . 86,274 56,595
Interest payable . . . . . . . . . . . . . . . . . . . . . . . . . . . . . . . . . . . . . . . . . . . . . . . . . . . . . . . . . . . . . . . . . . . . . . . . . . . . . 28,324 21,219
Personal injury and other claims . . . . . . . . . . . . . . . . . . . . . . . . . . . . . . . . . . . . . . . . . . . . . . . . . . . . . . . . . . . . . . 9,687 10,312
FOREX contracts . . . . . . . . . . . . . . . . . . . . . . . . . . . . . . . . . . . . . . . . . . . . . . . . . . . . . . . . . . . . . . . . . . . . . . . . . . . .
Other . . . . . . . . . . . . . . . . . . . . . . . . . . . . . . . . . . . . . . . . . . . . . . . . . . . . . . . . . . . . . . . . . . . . . . . . . . . . . . . . . . . . . .
1,143
9,574
29
5,890
Total . . . . . . . . . . . . . . . . . . . . . . . . . . . . . . . . . . . . . . . . . . . . . . . . . . . . . . . . . . . . . . . . . . . . . . . . . . . . . . . . . . . . $370,671 $324,434
56 DIAMOND OFFSHORE / 2013 ANNUAL REPORT

DIAMOND OFFSHORE DRILLING, INC.AND SUBSIDIARIES
NOTES TO CONSOLIDATED FINANCIAL STATEMENTS — (Continued)
Consolidated Statement of Cash Flows Information
Noncash investing activities excluded from the Consolidated Statements of Cash Flows and other supplemental cash flow
information is as follows:
December 31,
2013 2012 2011
(In thousands)
Accrued but unpaid capital expenditures at period end . . . . . . . . . . . . . . . . . . . . . . . . . . . . . . . $86,274 $56,595 $ 37,325
Income tax benefits related to exercise of stock options . . . . . . . . . . . . . . . . . . . . . . . . . . . . . . 1,081 1,083 863
Cash interest payments(1)(2) . . . . . . . . . . . . . . . . . . . . . . . . . . . . . . . . . . . . . . . . . . . . . . . . . . . . . . 82,938 83,125 82,938
Cash income taxes paid, net of refunds:
U.S. federal . . . . . . . . . . . . . . . . . . . . . . . . . . . . . . . . . . . . . . . . . . . . . . . . . . . . . . . . . . . . . . . . . . . . . 62,000 71,000 94,843
Foreign . . . . . . . . . . . . . . . . . . . . . . . . . . . . . . . . . . . . . . . . . . . . . . . . . . . . . . . . . . . . . . . . . . . . . . . . 78,041 72,249 150,465
State . . . . . . . . . . . . . . . . . . . . . . . . . . . . . . . . . . . . . . . . . . . . . . . . . . . . . . . . . . . . . . . . . . . . . . . . . . 190 243 210
(1) Interest payments, net of amounts capitalized, were $16.5 million, $46.2 million and $71.9 million for the years ended December 31,
2013, 2012 and 2011, respectively.
(2) Interest paid on Internal Revenue Service assessments was $0.2 million during the year ended December 31, 2012.
3. Stock-Based Compensation
Our Second Amended and Restated 2000 Stock Option Plan, as amended, or Stock Plan, provides for the issuance of either
incentive stock options or non-qualified stock options to our employees, consultants and non-employee directors. Our Stock Plan also
authorizes the award of stock appreciation rights, or SARs, in tandem with stock options or separately. The maximum aggregate number
of shares of our common stock for which stock options or SARs may be granted is 1,500,000 shares. The exercise price per share may
not be less than the fair market value of the common stock on the date of grant. Generally, stock options and SARs vest ratably over a
four year period and expire in ten years.
Total compensation cost recognized for Stock Plan transactions, consisting solely of awards of SARs, for the years ended
December 31, 2013, 2012 and 2011 was $3.9 million, $4.7 million and $5.0 million, respectively. Tax benefits recognized for the years
ended December 31, 2013, 2012 and 2011 related thereto were $1.3 million, $1.6 million and $1.7 million, respectively.
The fair value of SARs granted under the Stock Plan during each of the years ended December 31, 2013, 2012 and 2011 was
estimated using the Black Scholes pricing model.
The following are the weighted average assumptions used in estimating the fair value of our SARs:
Year Ended December 31,
2013 2012 2011
Expected life of SARs (in years) . . . . . . . . . . . . . . . . . . . . . . . . . . . . . . . . . . . . . . . . . . . . . . . . . . . . . . 7 6 5
Expected volatility . . . . . . . . . . . . . . . . . . . . . . . . . . . . . . . . . . . . . . . . . . . . . . . . . . . . . . . . . . . . . . . . . 18.24% 33.45% 30.37%
Dividend yield . . . . . . . . . . . . . . . . . . . . . . . . . . . . . . . . . . . . . . . . . . . . . . . . . . . . . . . . . . . . . . . . . . . . . .75% .78% .76%
Risk free interest rate . . . . . . . . . . . . . . . . . . . . . . . . . . . . . . . . . . . . . . . . . . . . . . . . . . . . . . . . . . . . . . 1.61% .89% 1.54%
Expected life of SARs is based on historical data as is the expected volatility. The dividend yield is based on the current approved
regular dividend rate in effect and the current market price at the time of grant. Risk free interest rates are determined using the U.S.
Treasury yield curve at time of grant with a term equal to the expected life of the SARs.
DIAMOND OFFSHORE / 2013 ANNUAL REPORT 57

DIAMOND OFFSHORE DRILLING, INC.AND SUBSIDIARIES
NOTES TO CONSOLIDATED FINANCIAL STATEMENTS — (Continued)
A summary of activity under the Stock Plan as of December 31, 2013 and changes during the year then ended is as follows:
Number ofAwards
Weighted-AverageExercise Price
Weighted-AverageRemaining
ContractualTerm
(Years)Aggregate Intrinsic
Value
(In Thousands)
Awards outstanding at January 1, 2013 . . . . . . . . . . 1,229,480 $80.32
Granted . . . . . . . . . . . . . . . . . . . . . . . . . . . . . . . . . . . . 233,625 $66.95
Exercised . . . . . . . . . . . . . . . . . . . . . . . . . . . . . . . . . . . (15,091) $59.58
Forfeited . . . . . . . . . . . . . . . . . . . . . . . . . . . . . . . . . . . (24,283) $67.51
Expired . . . . . . . . . . . . . . . . . . . . . . . . . . . . . . . . . . . . . (31,072) $94.01
Awards outstanding at December 31, 2013 . . . . . . 1,392,659 $78.22 7.0 $460
Awards exercisable at December 31, 2013 . . . . . . . 973,918 $83.32 6.0 $438
The weighted-average grant date fair values per share of awards granted during the years ended December 31, 2013, 2012 and
2011 were $13.74, $19.01 and $18.17, respectively. The total intrinsic value of awards exercised during the years ended December 31,
2013, 2012 and 2011 was $162,000, $147,000 and $28,000, respectively. The total fair value of awards vested during the years ended
December 31, 2013, 2012 and 2011 was $4.1 million, $5.2 million and $5.4 million, respectively. As of December 31, 2013 there was
$5.1 million of total unrecognized compensation cost related to nonvested stock awards granted under the Stock Plan which we expect
to recognize over a weighted average period of 2.4 years.
4. Earnings Per Share
A reconciliation of the numerators and the denominators of the basic and diluted per-share computations follows:
Year Ended December 31,
2013 2012 2011
(In thousands, except per share data)
Net income — basic and diluted (numerator): . . . . . . . . . . . . . . . . . . . . . . . . . . . . . . . . $548,686 $720,477 $962,542
Weighted-average shares — basic (denominator): . . . . . . . . . . . . . . . . . . . . . . . . . . . 139,035 139,029 139,027
Effect of dilutive potential shares
Stock options and stock appreciation rights . . . . . . . . . . . . . . . . . . . . . . . . . . . . . . . . 29 19 11
Weighted-average shares including conversions — diluted(denominator): . . . . . . . . . . . . . . . . . . . . . . . . . . . . . . . . . . . . . . . . . . . . . . . . . . . . . . . . . . . . . 139,064 139,048 139,038
Earnings per share:Basic . . . . . . . . . . . . . . . . . . . . . . . . . . . . . . . . . . . . . . . . . . . . . . . . . . . . . . . . . . . . . . . . . . . . . . . $ 3.95 $ 5.18 $ 6.92
Diluted . . . . . . . . . . . . . . . . . . . . . . . . . . . . . . . . . . . . . . . . . . . . . . . . . . . . . . . . . . . . . . . . . . . . . $ 3.95 $ 5.18 $ 6.92
The following table sets forth the share effects of stock options and the number of SARs excluded from our computations of diluted
earnings per share, or EPS, as the inclusion of such potentially dilutive shares would have been antidilutive for the periods presented:
Year Ended December 31,
2013 2012 2011
(In thousands)
Employee and director:
Stock options . . . . . . . . . . . . . . . . . . . . . . . . . . . . . . . . . . . . . . . . . . . . . . . . . . . . . . . . . . . . . . . . . . . . . . . . . . . . 18 18 19
SARs . . . . . . . . . . . . . . . . . . . . . . . . . . . . . . . . . . . . . . . . . . . . . . . . . . . . . . . . . . . . . . . . . . . . . . . . . . . . . . . . . . . . 956 853 847
58 DIAMOND OFFSHORE / 2013 ANNUAL REPORT
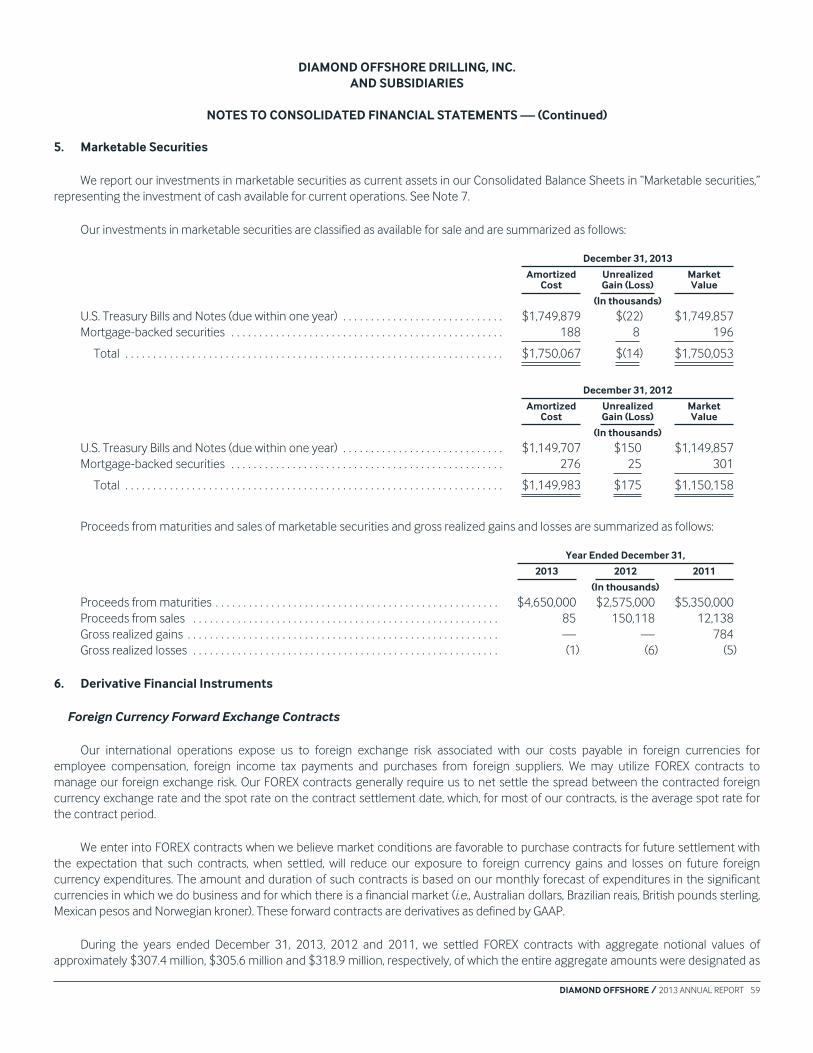
DIAMOND OFFSHORE DRILLING, INC.AND SUBSIDIARIES
NOTES TO CONSOLIDATED FINANCIAL STATEMENTS — (Continued)
5. Marketable Securities
We report our investments in marketable securities as current assets in our Consolidated Balance Sheets in “Marketable securities,”
representing the investment of cash available for current operations. See Note 7.
Our investments in marketable securities are classified as available for sale and are summarized as follows:
December 31, 2013
AmortizedCost
UnrealizedGain (Loss)
MarketValue
(In thousands)
U.S. Treasury Bills and Notes (due within one year) . . . . . . . . . . . . . . . . . . . . . . . . . . . . . $1,749,879 $(22) $1,749,857
Mortgage-backed securities . . . . . . . . . . . . . . . . . . . . . . . . . . . . . . . . . . . . . . . . . . . . . . . . . 188 8 196
Total . . . . . . . . . . . . . . . . . . . . . . . . . . . . . . . . . . . . . . . . . . . . . . . . . . . . . . . . . . . . . . . . . . . . $1,750,067 $(14) $1,750,053
December 31, 2012
AmortizedCost
UnrealizedGain (Loss)
MarketValue
(In thousands)
U.S. Treasury Bills and Notes (due within one year) . . . . . . . . . . . . . . . . . . . . . . . . . . . . . $1,149,707 $150 $1,149,857
Mortgage-backed securities . . . . . . . . . . . . . . . . . . . . . . . . . . . . . . . . . . . . . . . . . . . . . . . . . 276 25 301
Total . . . . . . . . . . . . . . . . . . . . . . . . . . . . . . . . . . . . . . . . . . . . . . . . . . . . . . . . . . . . . . . . . . . . $1,149,983 $175 $1,150,158
Proceeds from maturities and sales of marketable securities and gross realized gains and losses are summarized as follows:
Year Ended December 31,
2013 2012 2011
(In thousands)
Proceeds from maturities . . . . . . . . . . . . . . . . . . . . . . . . . . . . . . . . . . . . . . . . . . . . . . . . . . . $4,650,000 $2,575,000 $5,350,000
Proceeds from sales . . . . . . . . . . . . . . . . . . . . . . . . . . . . . . . . . . . . . . . . . . . . . . . . . . . . . . . 85 150,118 12,138
Gross realized gains . . . . . . . . . . . . . . . . . . . . . . . . . . . . . . . . . . . . . . . . . . . . . . . . . . . . . . . . — — 784
Gross realized losses . . . . . . . . . . . . . . . . . . . . . . . . . . . . . . . . . . . . . . . . . . . . . . . . . . . . . . . (1) (6) (5)
6. Derivative Financial Instruments
Foreign Currency Forward Exchange Contracts
Our international operations expose us to foreign exchange risk associated with our costs payable in foreign currencies for
employee compensation, foreign income tax payments and purchases from foreign suppliers. We may utilize FOREX contracts to
manage our foreign exchange risk. Our FOREX contracts generally require us to net settle the spread between the contracted foreign
currency exchange rate and the spot rate on the contract settlement date, which, for most of our contracts, is the average spot rate for
the contract period.
We enter into FOREX contracts when we believe market conditions are favorable to purchase contracts for future settlement with
the expectation that such contracts, when settled, will reduce our exposure to foreign currency gains and losses on future foreign
currency expenditures. The amount and duration of such contracts is based on our monthly forecast of expenditures in the significant
currencies in which we do business and for which there is a financial market (i.e., Australian dollars, Brazilian reais, British pounds sterling,
Mexican pesos and Norwegian kroner). These forward contracts are derivatives as defined by GAAP.
During the years ended December 31, 2013, 2012 and 2011, we settled FOREX contracts with aggregate notional values of
approximately $307.4 million, $305.6 million and $318.9 million, respectively, of which the entire aggregate amounts were designated as
DIAMOND OFFSHORE / 2013 ANNUAL REPORT 59

DIAMOND OFFSHORE DRILLING, INC.AND SUBSIDIARIES
NOTES TO CONSOLIDATED FINANCIAL STATEMENTS — (Continued)
an accounting hedge. During the years ended December 31, 2013, 2012 and 2011, we did not enter into or settle any FOREX contracts
that were not designated as accounting hedges.
The following table presents the amounts recognized in our Consolidated Statements of Operations related to our FOREX contracts
designated as hedging instruments for the years ended December 31, 2013, 2012 and 2011.
Amount of (Loss) Gain Recognized in Income
For the Years Ended December 31,
Location of (Loss) Gain Recognized in Income 2013 2012 2011
(In thousands)
Contract drilling expense . . . . . . . . . . . . . . . . . . . . . . . . . . . . . . . . . . . . . . . . . . . . . . . . . . . . $(6,501) $(4,302) $7,206
As of December 31, 2013, we had FOREX contracts outstanding in the aggregate notional amount of $114.1 million, consisting of
$15.3 million in Australian dollars, $72.4 million in Brazilian reais, $14.2 million in British pounds sterling, $5.9 million in Mexican pesos and
$6.3 million in Norwegian kroner. These contracts generally settle monthly through September 2014. As of December 31, 2013, all
outstanding derivative contracts had been designated as cash flow hedges.
We have International Swap Dealers Association, or ISDA, contracts, which are standardized master legal arrangements that
establish key terms and conditions, which govern certain derivative transactions. Historically, our FOREX contracts have been with two
counterparties and have been governed under such ISDA agreements. There are no requirements to post collateral under these
contracts; however, they do contain credit-risk related contingent provisions including credit support provisions and the net settlement
of amounts owed in the event of early terminations. Additionally, should our credit rating fall below a specified rating immediately
following the merger of Diamond Offshore Drilling, Inc. with another entity, the counterparty may require all outstanding derivatives
under the ISDA contract to be settled immediately at current market value. Our ISDA arrangements also include master netting
agreements to further manage counterparty credit risk associated with our FOREX contracts. We have elected not to offset the fair value
amounts recorded for our derivative contracts under these agreements in our Consolidated Balance Sheets as of December 31, 2013
and 2012; however, there would have been no significant differences in our Consolidated Balance Sheets if the estimated fair values
were presented on a net basis for these periods.
The following table presents the fair values of our FOREX contracts at December 31, 2013 and 2012.
Balance Sheet Location Fair Value Balance Sheet Location Fair Value
December 31,2013
December 31,2012
December 31,2013
December 31,2012
(In thousands) (In thousands)
Prepaid expenses and other current
assets . . . . . . . . . . . . . . . . . . . . . . . . . $1,562 $3,627 Accrued liabilities $(1,143) $(29)
Treasury Lock Agreements
In connection with the offering of our senior unsecured notes in 2013, we entered into two treasury lock agreements in October
2013 for notional amounts totaling $500 million and designated such contracts as cash flow hedges of interest rate risk. The agreements
were settled in November 2013 upon the completion of the offering of the senior notes for a net gain of $26,728, before tax. The gain
has been recorded as a component of AOCGL and is being amortized to interest expense over the terms of the respective unsecured
senior notes. See Note 9.
60 DIAMOND OFFSHORE / 2013 ANNUAL REPORT

DIAMOND OFFSHORE DRILLING, INC.AND SUBSIDIARIES
NOTES TO CONSOLIDATED FINANCIAL STATEMENTS — (Continued)
The following table presents the amounts recognized in our Consolidated Balance Sheets and Consolidated Statements of
Operations related to our derivative contracts designated as cash flow hedges for the years ended December 31, 2013, 2012 and 2011.
For the years ended December 31,
2013 2012 2011
(In thousands)
FOREX contracts:Amount of (loss) gain recognized in AOCGL on derivative (effective
portion) . . . . . . . . . . . . . . . . . . . . . . . . . . . . . . . . . . . . . . . . . . . . . . . . . . . . . . . . . . $ (10,542) $ 6,519 $ (962)
Location of (loss) gain reclassified from AOCGL into income (effective
portion) . . . . . . . . . . . . . . . . . . . . . . . . . . . . . . . . . . . . . . . . . . . . . . . . . . . . . . . . . .
Contract drilling,
excluding
depreciation
Contract drilling,
excluding
depreciation
Contract drilling,
excluding
depreciation
Amount of (loss) gain reclassified from AOCGL into income (effective
portion) . . . . . . . . . . . . . . . . . . . . . . . . . . . . . . . . . . . . . . . . . . . . . . . . . . . . . . . . . . $ (7,449) $ (4,205) $ 10,351
Location of loss recognized in income on derivative (ineffective portion
and amount excluded from effectiveness testing) . . . . . . . . . . . . . . . . . . . .
Foreign currency
transaction gain
(loss)
Foreign currency
transaction gain
(loss)
Foreign currency
transaction gain
(loss)
Amount of loss recognized in income on derivative (ineffective portion
and amount excluded from effectiveness testing) . . . . . . . . . . . . . . . . . . . . $ (104) $ (17) $ (85)
Treasury lock agreements:Amount of gain recognized in AOCGL on derivative (effective portion) . . . . $ 27 $ — $ —
Location of gain reclassified from AOCGL into income (effective
portion) . . . . . . . . . . . . . . . . . . . . . . . . . . . . . . . . . . . . . . . . . . . . . . . . . . . . . . . . . . Interest expense Interest expense Interest expense
Amount of gain reclassified from AOCGL into income (effective portion) . . $ 1 $ — $ —
As of December 31, 2013, the estimated amount of net unrealized gains associated with our FOREX contracts and treasury lock
agreements that will be reclassified to earnings during the next twelve months was $0.5 million and $8,000, respectively. The net
unrealized gains associated with our FOREX contracts will be reclassified to contract drilling expense to the extent fully effective. During
the years ended December 30, 2013, 2012 and 2011 we did not reclassify any amounts from AOCGL due to the probability of an
underlying forecasted transaction not occurring.
7. Financial Instruments and Fair Value Disclosures
Concentrations of Credit and Market Risk
Financial instruments which potentially subject us to significant concentrations of credit or market risk consist primarily of periodic
temporary investments of excess cash, trade accounts receivable and investments in debt securities, including mortgage-backed
securities. We generally place our excess cash investments in U.S. government backed short-term money market instruments through
several financial institutions. At times, such investments may be in excess of the insurable limit. We periodically evaluate the relative
credit standing of these financial institutions as part of our investment strategy.
Most of our investments in debt securities are U.S. government securities with minimal credit risk. However, we are exposed to
market risk due to price volatility associated with interest rate fluctuations.
Concentrations of credit risk with respect to our trade accounts receivable are limited primarily due to the entities comprising our
customer base. Since the market for our services is the offshore oil and gas industry, this customer base consists primarily of major and
independent oil and gas companies and government-owned oil companies. During 2013 and 2012, our largest customer in Brazil,
Petróleo Brasileiro S.A. (a Brazilian multinational energy company that is majority-owned by the Brazilian government), accounted for
$154.5 million and $116.4 million, or 35% and 24%, respectively, of our total consolidated gross trade accounts receivable balance. Our
second largest customer in Brazil, OGX Petróleo e Gás Ltda. (a privately owned Brazilian oil and natural gas company that filed for
bankruptcy in October 2013), or OGX, accounted for $80.3 million or 17% of our total consolidated gross trade accounts receivable
balance at December 31, 2012. Our accounts receivable balance from OGX was fully reserved at December 31, 2013.
DIAMOND OFFSHORE / 2013 ANNUAL REPORT 61

DIAMOND OFFSHORE DRILLING, INC.AND SUBSIDIARIES
NOTES TO CONSOLIDATED FINANCIAL STATEMENTS — (Continued)
In general, before working for a customer with whom we have not had a prior business relationship and/or whose financial stability
may be uncertain to us, we perform a credit review on that company. Based on that analysis, we may require that the customer present a
letter of credit, prepay or provide other credit enhancements. We record a provision for bad debts on a case-by-case basis when facts
and circumstances indicate that a customer receivable may not be collectible and, historically, losses on our trade receivables have been
infrequent occurrences.
During 2013, based on our assessment of the financial condition of two of our customers, Niko Resources Ltd., or Niko, and OGX,
and our expectations regarding the probability of collection of amounts due to us from them, we recorded $22.5 million in bad debt
expense to fully reserve all outstanding receivables they owed us at June 30, 2013. With the exception of the settlement discussed below,
we did not recognize revenue associated with these customers during the second half of 2013. See Note 2.
In December 2013, we entered into a settlement agreement with Niko, which we refer to as the Settlement Agreement, whereby
Niko will be released from certain obligations under the dayrate contracts for the Ocean Monarch and Ocean Lexington, subject to and
effective upon the full payment of amounts owed to us under the Settlement Agreement and subject to its other conditions. In
accordance with the terms of the Settlement Agreement, we received $25.0 million in cash during the fourth quarter of 2013, which we
recognized as revenue against invoices due us. Niko is further obligated to make future periodic payments to us pursuant to the
Settlement Agreement totaling an aggregate of $55.0 million, payable at various times through September 2017. We plan to recognize
these amounts in revenue as they are received due to the uncertainty regarding their timing and collection.
Fair Values
Fair value is defined as the exchange price that would be received for an asset or paid to transfer a liability (an exit price) in the principal
or most advantageous market for the asset or liability in an orderly transaction between market participants on the measurement date. The
fair value hierarchy prescribed by GAAP requires an entity to maximize the use of observable inputs and minimize the use of unobservable
inputs when measuring fair value. There are three levels of inputs that may be used to measure fair value:
Level 1 Quoted prices for identical instruments in active markets. Level 1 assets include short-term investments such as
money market funds, U.S. Treasury Bills and Treasury notes. Our Level 1 assets at December 31, 2013 consisted of
cash held in money market funds of $281.3 million, time deposits of $30.0 million and investments in U.S. Treasury
securities of $1,749.9 million. Our Level 1 assets at December 31, 2012 consisted of cash held in money market
funds of $264.9 million, time deposits of $20.0 million and investments in U.S. Treasury securities of $1,149.9 million.
Level 2 Quoted market prices for similar instruments in active markets; quoted prices for identical or similar instruments in
markets that are not active; and model-derived valuations in which all significant inputs and significant value drivers
are observable in active markets. Level 2 assets and liabilities include residential mortgage-backed securities and
over-the-counter FOREX contracts. Our residential mortgage-backed securities were valued using a model-derived
valuation technique based on the quoted closing market prices received from a financial institution. Our FOREX
contracts are valued based on quoted market prices, which are derived from observable inputs including current
spot and forward rates, less the contract rate multiplied by the notional amount. The inputs used in our valuation are
obtained from a Bloomberg curve analysis which uses par coupon swap rates to calculate implied forward rates so
that projected floating rate cash flows can be calculated. The valuation techniques underlying the models are widely
accepted in the financial services industry and do not involve significant judgment.
Level 3 Valuations derived from valuation techniques in which one or more significant inputs or significant value drivers are
unobservable. Level 3 assets and liabilities generally include financial instruments whose value is determined using
pricing models, discounted cash flow methodologies, or similar techniques, as well as instruments for which the
determination of fair value requires significant management judgment or estimation or for which there is a lack of
transparency as to the inputs used. Our Level 3 assets at December 31, 2013 and 2012 consisted of nonrecurring
measurements of certain rigs held for sale for which we recorded an impairment loss in 2012. The value of these rigs
was determined using a present value technique which utilized unobservable inputs such as assumptions for
estimated proceeds that may be received on disposition of each rig and estimated costs to sell. See Note 1.
62 DIAMOND OFFSHORE / 2013 ANNUAL REPORT

DIAMOND OFFSHORE DRILLING, INC.AND SUBSIDIARIES
NOTES TO CONSOLIDATED FINANCIAL STATEMENTS — (Continued)
Market conditions could cause an instrument to be reclassified among Levels 1, 2 and 3. Our policy regarding fair value
measurements of financial instruments transferred into and out of levels is to reflect the transfers as having occurred at the beginning of
the reporting period. There were no transfers between fair value levels during the years ended December 31, 2013 and 2012.
Certain of our assets and liabilities are required to be measured at fair value on a recurring basis in accordance with GAAP. In
addition, certain assets and liabilities may be recorded at fair value on a nonrecurring basis. Generally, we record assets at fair value on a
nonrecurring basis as a result of impairment charges. We did not record any impairment charges related to assets measured at fair value
on a nonrecurring basis during the year ended December 31, 2013.
December 31, 2013
Fair Value Measurements Using Assets at FairValue
Total Lossesfor YearEndedLevel 1 Level 2 Level 3
(In thousands)
Recurring fair value measurements:Assets:
Short-term investments . . . . . . . . . . . . . . . . . . . . . . . . . . . . $2,061,154 $ — $ — $2,061,154 $—
FOREX contracts . . . . . . . . . . . . . . . . . . . . . . . . . . . . . . . . . . . — 1,562 — 1,562 —
Mortgage-backed securities . . . . . . . . . . . . . . . . . . . . . . . . — 197 — 197 —
Total assets . . . . . . . . . . . . . . . . . . . . . . . . . . . . . . . . . . . . . $2,061,154 $ 1,759 $ — $2,062,913 $—
Liabilities:FOREX contracts . . . . . . . . . . . . . . . . . . . . . . . . . . . . . . . . . . . $ — $(1,143) $ — $ (1,143) $—
Nonrecurring fair value measurements:Assets:
Impaired assets . . . . . . . . . . . . . . . . . . . . . . . . . . . . . . . . . . . . $ — $ — $3,900 $ 3,900 $—
December 31, 2012
Fair Value Measurements Using Assets at FairValue
Total Lossesfor YearEndedLevel 1 Level 2 Level 3
(In thousands)
Recurring fair value measurements:Assets:
Short-term investments . . . . . . . . . . . . . . . . . . . . . . . . . . . . . $1,434,751 $ — $ — $1,434,751 $ —
FOREX contracts . . . . . . . . . . . . . . . . . . . . . . . . . . . . . . . . . . . — 3,627 — 3,627 —
Mortgage-backed securities . . . . . . . . . . . . . . . . . . . . . . . . . — 301 — 301 —
Total assets . . . . . . . . . . . . . . . . . . . . . . . . . . . . . . . . . . . . . . $1,434,751 $3,928 $ — $1,438,679 $ —
Liabilities:FOREX contracts . . . . . . . . . . . . . . . . . . . . . . . . . . . . . . . . . . . $ — $ (29) $ — $ (29) $ —
Nonrecurring fair value measurements:Assets:
Assets held for sale . . . . . . . . . . . . . . . . . . . . . . . . . . . . . . . . . $ — $ — $3,900 $ 3,900 $(62,437)
We have presented the loss related to assets held for sale in “Impairment of assets” in our Consolidated Statements of Operations
for the year ended December 31, 2012.
We believe that the carrying amounts of our other financial assets and liabilities (excluding long-term debt), which are not measured
at fair value in our Consolidated Balance Sheets, approximate fair value based on the following assumptions:
• Cash and cash equivalents — The carrying amounts approximate fair value because of the short maturity of these instruments.
• Accounts receivable and accounts payable — The carrying amounts approximate fair value based on the nature of the instruments.
DIAMOND OFFSHORE / 2013 ANNUAL REPORT 63
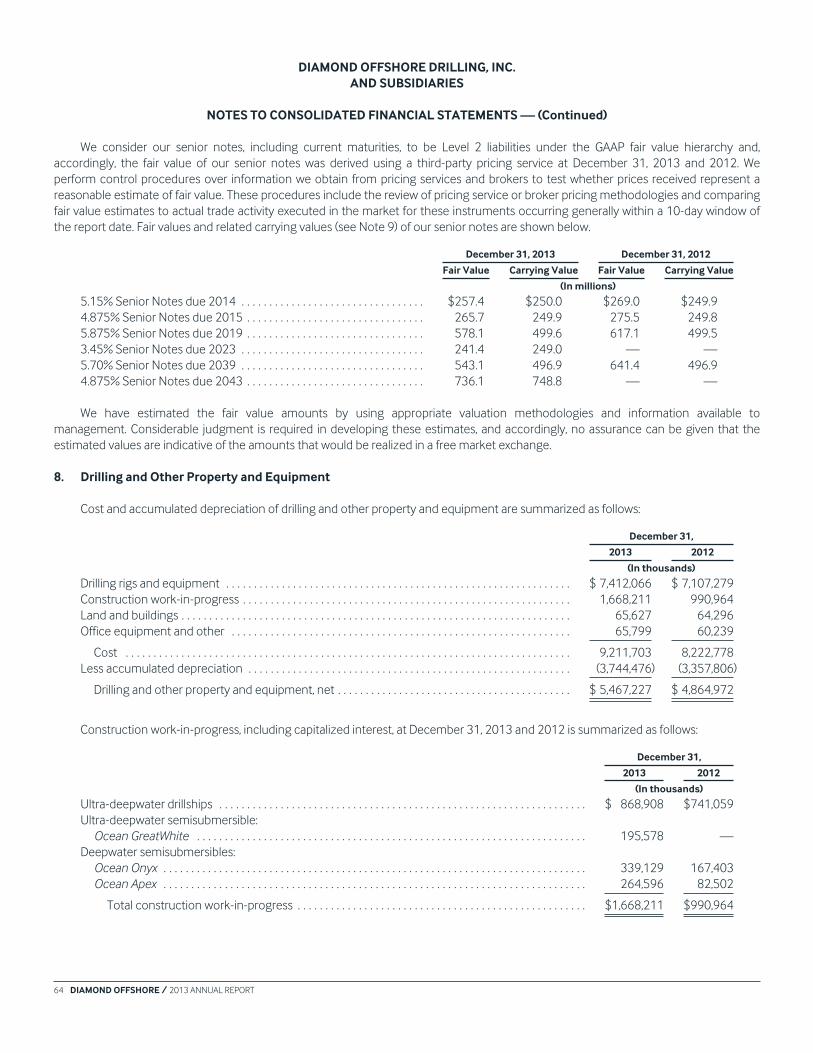
DIAMOND OFFSHORE DRILLING, INC.AND SUBSIDIARIES
NOTES TO CONSOLIDATED FINANCIAL STATEMENTS — (Continued)
We consider our senior notes, including current maturities, to be Level 2 liabilities under the GAAP fair value hierarchy and,
accordingly, the fair value of our senior notes was derived using a third-party pricing service at December 31, 2013 and 2012. We
perform control procedures over information we obtain from pricing services and brokers to test whether prices received represent a
reasonable estimate of fair value. These procedures include the review of pricing service or broker pricing methodologies and comparing
fair value estimates to actual trade activity executed in the market for these instruments occurring generally within a 10-day window of
the report date. Fair values and related carrying values (see Note 9) of our senior notes are shown below.
December 31, 2013 December 31, 2012
Fair Value Carrying Value Fair Value Carrying Value
(In millions)
5.15% Senior Notes due 2014 . . . . . . . . . . . . . . . . . . . . . . . . . . . . . . . . . $257.4 $250.0 $269.0 $249.9
4.875% Senior Notes due 2015 . . . . . . . . . . . . . . . . . . . . . . . . . . . . . . . . 265.7 249.9 275.5 249.8
5.875% Senior Notes due 2019 . . . . . . . . . . . . . . . . . . . . . . . . . . . . . . . . 578.1 499.6 617.1 499.5
3.45% Senior Notes due 2023 . . . . . . . . . . . . . . . . . . . . . . . . . . . . . . . . . 241.4 249.0 — —
5.70% Senior Notes due 2039 . . . . . . . . . . . . . . . . . . . . . . . . . . . . . . . . . 543.1 496.9 641.4 496.9
4.875% Senior Notes due 2043 . . . . . . . . . . . . . . . . . . . . . . . . . . . . . . . . 736.1 748.8 — —
We have estimated the fair value amounts by using appropriate valuation methodologies and information available to
management. Considerable judgment is required in developing these estimates, and accordingly, no assurance can be given that the
estimated values are indicative of the amounts that would be realized in a free market exchange.
8. Drilling and Other Property and Equipment
Cost and accumulated depreciation of drilling and other property and equipment are summarized as follows:
December 31,
2013 2012
(In thousands)
Drilling rigs and equipment . . . . . . . . . . . . . . . . . . . . . . . . . . . . . . . . . . . . . . . . . . . . . . . . . . . . . . . . . . . . . . $ 7,412,066 $ 7,107,279
Construction work-in-progress . . . . . . . . . . . . . . . . . . . . . . . . . . . . . . . . . . . . . . . . . . . . . . . . . . . . . . . . . . . 1,668,211 990,964
Land and buildings . . . . . . . . . . . . . . . . . . . . . . . . . . . . . . . . . . . . . . . . . . . . . . . . . . . . . . . . . . . . . . . . . . . . . . 65,627 64,296
Office equipment and other . . . . . . . . . . . . . . . . . . . . . . . . . . . . . . . . . . . . . . . . . . . . . . . . . . . . . . . . . . . . . 65,799 60,239
Cost . . . . . . . . . . . . . . . . . . . . . . . . . . . . . . . . . . . . . . . . . . . . . . . . . . . . . . . . . . . . . . . . . . . . . . . . . . . . . . . . 9,211,703 8,222,778
Less accumulated depreciation . . . . . . . . . . . . . . . . . . . . . . . . . . . . . . . . . . . . . . . . . . . . . . . . . . . . . . . . . . (3,744,476) (3,357,806)
Drilling and other property and equipment, net . . . . . . . . . . . . . . . . . . . . . . . . . . . . . . . . . . . . . . . . . . $ 5,467,227 $ 4,864,972
Construction work-in-progress, including capitalized interest, at December 31, 2013 and 2012 is summarized as follows:
December 31,
2013 2012
(In thousands)
Ultra-deepwater drillships . . . . . . . . . . . . . . . . . . . . . . . . . . . . . . . . . . . . . . . . . . . . . . . . . . . . . . . . . . . . . . . . . . $ 868,908 $741,059
Ultra-deepwater semisubmersible:
Ocean GreatWhite . . . . . . . . . . . . . . . . . . . . . . . . . . . . . . . . . . . . . . . . . . . . . . . . . . . . . . . . . . . . . . . . . . . . . . 195,578 —
Deepwater semisubmersibles:
Ocean Onyx . . . . . . . . . . . . . . . . . . . . . . . . . . . . . . . . . . . . . . . . . . . . . . . . . . . . . . . . . . . . . . . . . . . . . . . . . . . . 339,129 167,403
Ocean Apex . . . . . . . . . . . . . . . . . . . . . . . . . . . . . . . . . . . . . . . . . . . . . . . . . . . . . . . . . . . . . . . . . . . . . . . . . . . . 264,596 82,502
Total construction work-in-progress . . . . . . . . . . . . . . . . . . . . . . . . . . . . . . . . . . . . . . . . . . . . . . . . . . . . $1,668,211 $990,964
64 DIAMOND OFFSHORE / 2013 ANNUAL REPORT

DIAMOND OFFSHORE DRILLING, INC.AND SUBSIDIARIES
NOTES TO CONSOLIDATED FINANCIAL STATEMENTS — (Continued)
During 2013, we entered into a shipyard contract for the construction of the Ocean GreatWhite, an ultra-deepwater, harsh
environment semisubmersible. See Note 11.
9. Credit Agreement and Senior Notes
Credit Agreement
We have a syndicated 5-Year Revolving Credit Agreement, or Credit Agreement, with Wells Fargo Bank, National Association, as
administrative agent and swingline lender. Effective December 9, 2013, we entered into an extension agreement and amendment to the
Credit Agreement, which, among other things, provided for a one-year extension with all of the existing lenders. The Credit Agreement
provides for a $750 million senior unsecured revolving credit facility for general corporate purposes, maturing on September 28, 2018.
The entire amount of the facility is available for revolving loans. Up to $250 million of the facility is available for the issuance of
performance or other standby letters of credit and up to $75 million is available for swingline loans.
Revolving loans under the Credit Agreement bear interest, at our option, at a rate per annum based on either an alternate base rate,
or ABR, or a Eurodollar Rate, as defined in the Credit Agreement, plus the applicable interest margin for an ABR loan or a Eurodollar loan.
The ABR is the greatest of (i) the prime rate, (ii) the federal funds rate plus 0.50% and (iii) the daily one-month Eurodollar Rate plus 1.00%.
The applicable interest margin for ABR loans varies from 0% to 0.25%. The applicable interest margin for Eurodollar loans varies between
0.75% and 1.25%.
Swingline loans bear interest, at our option, at a rate per annum equal to (i) the ABR plus the applicable interest margin for ABR loans
or (ii) the daily one-month Eurodollar Rate plus the applicable interest margin for Eurodollar loans.
Under our Credit Agreement, we also pay, based on our current credit ratings, and as applicable, other customary fees including, but
not limited to, a commitment fee on the unused commitments under the Credit Agreement, varying between 0.06% and 0.20% per
annum, and a fronting fee to the issuing bank for each letter of credit. Participation fees for letters of credit are dependent upon the type
of letter of credit issued, varying between 0.375% and 0.625% per annum for performance letters of credit, and between 0.75% and
1.25% per annum for all other letters of credit. Changes in credit ratings could lower or raise the fees that we pay under the Credit
Agreement.
The Credit Agreement contains customary covenants including, but not limited to, maintenance of a ratio of consolidated
indebtedness to total capitalization, as defined in the Credit Agreement, of not more than 60% at the end of each fiscal quarter, as well as
limitations on liens; mergers, consolidations, liquidation and dissolution; changes in lines of business; swap agreements; transactions with
affiliates; and subsidiary indebtedness.
Based on our current credit ratings at December 31, 2013, the applicable margin on ABR loans and Eurodollar loans would have
been 0.00% and 0.875%, respectively. As of December 31, 2013, there were no amounts outstanding under the Credit Agreement.
Senior Notes
At December 31, 2013, our senior notes were comprised of the following debt issues:
Principal Amount Interest Rate SemiannualInterest Payment
DatesDebt Issue (In millions) Maturity Date Coupon Effective
5.15% Senior Notes due 2014 . . . . . . . . . . . . . . . $250.0 September 1, 2014 5.15% 5.18% March 1 and September 1
4.875% Senior Notes due 2015 . . . . . . . . . . . . . . $250.0 July 1, 2015 4.875% 4.90% January 1 and July 1
5.875% Senior Notes due 2019 . . . . . . . . . . . . . . $500.0 May 1, 2019 5.875% 5.89% May 1 and November 1
3.45% Senior Notes due 2023 . . . . . . . . . . . . . . . $250.0 November 1, 2023 3.45% 3.50% May 1 and November 1
5.70% Senior Notes due 2039 . . . . . . . . . . . . . . . $500.0 October 15, 2039 5.70% 5.75% April 15 and October 15
4.875% Senior Notes due 2043 . . . . . . . . . . . . . . $750.0 November 1, 2043 4.875% 4.89% May 1 and November 1
DIAMOND OFFSHORE / 2013 ANNUAL REPORT 65

DIAMOND OFFSHORE DRILLING, INC.AND SUBSIDIARIES
NOTES TO CONSOLIDATED FINANCIAL STATEMENTS — (Continued)
At December 31, 2013 and 2012, the carrying value of our senior notes was as follows:
December 31,
2013 2012
(In thousands)
5.15% Senior Notes due 2014 . . . . . . . . . . . . . . . . . . . . . . . . . . . . . . . . . . . . . . . . . . . . . . . . . . . . . . . . . . . . $ 249,954 $ 249,882
4.875% Senior Notes due 2015 . . . . . . . . . . . . . . . . . . . . . . . . . . . . . . . . . . . . . . . . . . . . . . . . . . . . . . . . . . . 249,898 249,837
5.875% Senior Notes due 2019 . . . . . . . . . . . . . . . . . . . . . . . . . . . . . . . . . . . . . . . . . . . . . . . . . . . . . . . . . . . 499,551 499,480
3.45% Senior Notes due 2023 . . . . . . . . . . . . . . . . . . . . . . . . . . . . . . . . . . . . . . . . . . . . . . . . . . . . . . . . . . . . 248,988 —
5.70% Senior Notes due 2039 . . . . . . . . . . . . . . . . . . . . . . . . . . . . . . . . . . . . . . . . . . . . . . . . . . . . . . . . . . . . 496,919 496,867
4.875% Senior Notes due 2043 . . . . . . . . . . . . . . . . . . . . . . . . . . . . . . . . . . . . . . . . . . . . . . . . . . . . . . . . . . . 748,833 —
Total senior notes, net of unamortized discount . . . . . . . . . . . . . . . . . . . . . . . . . . . . . . . . . . . . . . . . . . $2,494,143 $1,496,066
Less: Current portion of long-term debt . . . . . . . . . . . . . . . . . . . . . . . . . . . . . . . . . . . . . . . . . . . . . . . . . . . . 249,954 —
Total Long-term debt . . . . . . . . . . . . . . . . . . . . . . . . . . . . . . . . . . . . . . . . . . . . . . . . . . . . . . . . . . . . . . . . . . $2,244,189 $1,496,066
As of December 31, 2013, the aggregate annual maturity of our senior notes was as follows:
AggregatePrincipalAmount
(In thousands)
Years Ending December 31,2014 . . . . . . . . . . . . . . . . . . . . . . . . . . . . . . . . . . . . . . . . . . . . . . . . . . . . . . . . . . . . . . . . . . . . . . . . . . . . . . . . . . . . . . . . . . . . . $ 250,000
2015 . . . . . . . . . . . . . . . . . . . . . . . . . . . . . . . . . . . . . . . . . . . . . . . . . . . . . . . . . . . . . . . . . . . . . . . . . . . . . . . . . . . . . . . . . . . . . 250,000
2016 . . . . . . . . . . . . . . . . . . . . . . . . . . . . . . . . . . . . . . . . . . . . . . . . . . . . . . . . . . . . . . . . . . . . . . . . . . . . . . . . . . . . . . . . . . . . . —
2017 . . . . . . . . . . . . . . . . . . . . . . . . . . . . . . . . . . . . . . . . . . . . . . . . . . . . . . . . . . . . . . . . . . . . . . . . . . . . . . . . . . . . . . . . . . . . . —
2018 . . . . . . . . . . . . . . . . . . . . . . . . . . . . . . . . . . . . . . . . . . . . . . . . . . . . . . . . . . . . . . . . . . . . . . . . . . . . . . . . . . . . . . . . . . . . . —
Thereafter . . . . . . . . . . . . . . . . . . . . . . . . . . . . . . . . . . . . . . . . . . . . . . . . . . . . . . . . . . . . . . . . . . . . . . . . . . . . . . . . . . . . . . . . . 2,000,000
Total maturities of senior notes . . . . . . . . . . . . . . . . . . . . . . . . . . . . . . . . . . . . . . . . . . . . . . . . . . . . . . . . . . . . . . . . . . . 2,500,000
Less: unamortized discounts . . . . . . . . . . . . . . . . . . . . . . . . . . . . . . . . . . . . . . . . . . . . . . . . . . . . . . . . . . . . . . . . . . . . . . . . (5,857)
Total maturities of senior notes, net of unamortized discount . . . . . . . . . . . . . . . . . . . . . . . . . . . . . . . . . . . . . . . . $2,494,143
2013 Debt Issues. On November 5, 2013, we completed the issuance of $1.0 billion aggregate principal amount of senior notes
consisting of $250.0 million aggregate principal amount of 3.45% senior unsecured notes due 2023, or 2023 Notes, and $750.0 million
aggregate principal amount of 4.875% senior unsecured notes due 2043, or 2043 Notes, and, collectively, the New Notes, for general
corporate purposes, including redemption, repurchase or retirement of our 5.15% senior notes due September 1, 2014, or 2014 Notes,
and our 4.875% senior notes due July 1, 2015, or 2015 Notes. The transaction resulted in net proceeds to us of $987.8 million after
deducting underwriting discounts, commissions and estimated expenses.
The 2023 Notes bear interest at 3.45% per year and mature on November 1, 2023. The 2043 Notes bear interest at 4.875% per year
and mature on November 1, 2043. Interest on the New Notes is payable semiannually in arrears on May 1 and November 1 of each year,
beginning May 1, 2014. The New Notes are unsecured and unsubordinated obligations of Diamond Offshore Drilling, Inc., and rank
equally in right of payment to all of its existing and future unsecured and unsubordinated indebtedness, and are effectively subordinated
to all existing and future obligations of our subsidiaries. We have the right to redeem all or a portion of the New Notes for cash at any
time or from time to time, on at least 15 days but not more than 60 days prior written notice, at a make-whole redemption price specified
in the governing indenture (if applicable) plus accrued and unpaid interest to, but excluding, the date of redemption.
Other Debt. Our 2014 Notes, 2015 Notes, 5.875% Senior Notes due 2019 and 5.70% Senior Notes due 2039 are all unsecured and
unsubordinated obligations of Diamond Offshore Drilling, Inc. and rank equal in right of payment to its existing and future unsecured and
unsubordinated indebtedness, and are effectively subordinated to all existing and future obligations of our subsidiaries. We have the right
to redeem all or a portion of these notes for cash at any time or from time to time, on at least 15 days but not more than 60 days prior
written notice, at the redemption price specified in the governing indenture plus accrued and unpaid interest to the date of redemption.
66 DIAMOND OFFSHORE / 2013 ANNUAL REPORT

DIAMOND OFFSHORE DRILLING, INC.AND SUBSIDIARIES
NOTES TO CONSOLIDATED FINANCIAL STATEMENTS — (Continued)
Our 2014 Notes, in the aggregate principal amount of $250.0 million, will mature on September 1, 2014. Accordingly, the aggregate
$249.9 million accreted value of our 2014 Notes has been presented as “Current portion of long-term debt” in our Consolidated Balance
Sheets at December 31, 2013.
10. Other Comprehensive Income (Loss)
The following table sets forth the components of “Other comprehensive income (loss)” and the related income tax effects thereon
for the three years ended December 31, 2013 and the cumulative balances in AOCGL by component at December 31, 2013, 2012 and
2011.
Unrealized Gain (Loss) on
DerivativeFinancial
InstrumentsMarketableSecurities
TotalAOCGL
(In thousands)
Balance at January 1, 2011 . . . . . . . . . . . . . . . . . . . . . . . . . . . . . . . . . . . . . . . . . . . . . . . . . . . . . . $ 2,733 $ 408 $ 3,141
Unrealized gain (loss) before reclassifications, after tax of $337 and $15 . . . . . . . . . . . (625) (46) (671)
Reclassification adjustments for items included in Net Income, after tax of $3,623
and $205 . . . . . . . . . . . . . . . . . . . . . . . . . . . . . . . . . . . . . . . . . . . . . . . . . . . . . . . . . . . . . . . . . (6,728) (384) (7,112)
Total other comprehensive income (loss) . . . . . . . . . . . . . . . . . . . . . . . . . . . . . . . . . . . . (7,353) (430) (7,783)
Balance at December 31, 2011 . . . . . . . . . . . . . . . . . . . . . . . . . . . . . . . . . . . . . . . . . . . . . . . . . . (4,620) (22) (4,642)
Unrealized gain (loss) before reclassifications, after tax of $(2,282) and $(28) . . . . . . . 4,237 124 4,361
Reclassification adjustments for items included in Net Income, after tax of $(1,472)
and $(1) . . . . . . . . . . . . . . . . . . . . . . . . . . . . . . . . . . . . . . . . . . . . . . . . . . . . . . . . . . . . . . . . . . 2,733 44 2,777
Total other comprehensive income (loss) . . . . . . . . . . . . . . . . . . . . . . . . . . . . . . . . . . . . 6,970 168 7,138
Balance at December 31, 2012 . . . . . . . . . . . . . . . . . . . . . . . . . . . . . . . . . . . . . . . . . . . . . . . . . . 2,350 146 2,496
Unrealized gain (loss) before reclassifications, after tax of $3,682 and $18 . . . . . . . . . (6,833) (6) (6,839)
Reclassification adjustments for items included in Net Income, after tax of $(2,608)
and $18 . . . . . . . . . . . . . . . . . . . . . . . . . . . . . . . . . . . . . . . . . . . . . . . . . . . . . . . . . . . . . . . . . . 4,840 (147) 4,693
Total other comprehensive income (loss) . . . . . . . . . . . . . . . . . . . . . . . . . . . . . . . . . . . . (1,993) (153) (2,146)
Balance at December 31, 2013 . . . . . . . . . . . . . . . . . . . . . . . . . . . . . . . . . . . . . . . . . . . . . . . . . . $ 357 $ (7) $ 350
The following table presents the line items in our Consolidated Statements of Operations affected by reclassification adjustments
out of AOCGL.
Major Components of AOCGL Year Ended December 31,Consolidated Statements of
Operations Line Items
2013 2012 2011(In thousands)
Derivative financial instruments:Unrealized (gain) loss on FOREX contracts . . . . . . . . . . . . . . . . . $(7,449) $(4,205) $10,351
Contract drilling, excluding
depreciation
Unrealized loss (gain) on Treasury Lock Agreements . . . . . . . . 1 — — Interest expense
2,608 1,472 (3,623) Income tax expense
$(4,840) $(2,733) $ 6,728 Net of tax
Marketable securities:Unrealized (gain) loss on marketable securities . . . . . . . . . . . . . $ 165 $ (45) $ 589 Other, net
(18) 1 (205) Income tax expense
$ 147 $ (44) $ 384 Net of tax
DIAMOND OFFSHORE / 2013 ANNUAL REPORT 67

DIAMOND OFFSHORE DRILLING, INC.AND SUBSIDIARIES
NOTES TO CONSOLIDATED FINANCIAL STATEMENTS — (Continued)
11. Commitments and Contingencies
Various claims have been filed against us in the ordinary course of business, including claims by offshore workers alleging personal
injuries. With respect to each claim or exposure, we have made an assessment, in accordance with GAAP, of the probability that the
resolution of the matter would ultimately result in a loss. When we determine that an unfavorable resolution of a matter is probable and
such amount of loss can be determined, we record a liability for the amount of the estimated loss at the time that both of these criteria
are met. Our management believes that we have recorded adequate accruals for any liabilities that may reasonably be expected to result
from these claims.
Litigation. We are one of several unrelated defendants in lawsuits filed in state courts alleging that defendants manufactured,
distributed or utilized drilling mud containing asbestos and, in our case, allowed such drilling mud to have been utilized aboard our
offshore drilling rigs. The plaintiffs seek, among other things, an award of unspecified compensatory and punitive damages. The
manufacture and use of asbestos-containing drilling mud had already ceased before we acquired any of the drilling rigs addressed in
these lawsuits. We believe that we are not liable for the damages asserted and we expect to receive complete defense and indemnity
with respect to a majority of the lawsuits from Murphy Exploration & Production Company pursuant to the terms of our 1992 asset
purchase agreement with them. We also believe that we are not liable for the damages asserted in the remaining lawsuits pursuant to
the terms of our 1989 asset purchase agreement with Diamond M Corporation, and we filed a declaratory judgment action in Texas state
court against NuStar Energy LP, or NuStar, the successor to Diamond M Corporation, seeking a judicial determination that we did not
assume liability for these claims. We obtained summary judgment on our claims in the declaratory judgment action, but NuStar appealed
the trial court’s decision, and the appellate court has remanded the case to trial. We are unable to estimate our potential exposure, if any,
to these lawsuits at this time but do not believe that ultimate liability, if any, resulting from this litigation will have a material effect on our
consolidated financial condition, results of operations and cash flows.
Various other claims have been filed against us in the ordinary course of business. In the opinion of our management, no pending
or known threatened claims, actions or proceedings against us are expected to have a material adverse effect on our consolidated
financial condition, results of operations and cash flows.
We intend to defend these matters vigorously; however, we cannot predict with certainty the outcome or effect of any litigation
matters specifically described above or any other pending litigation or claims. There can be no assurance as to the ultimate outcome of
these lawsuits.
NPI Arrangement. We received payments measured by a percentage net profits interest (of primarily 27%) under an overriding
royalty interest in certain developmental oil-and-gas producing properties, or NPI, which we believe is a real property interest. Our drilling
program related to the NPI was completed in 2011, and the balance of the amounts due to us under the NPI was received in
2013. However, the customer who conveyed the NPI to us filed a voluntary petition for reorganization under Chapter 11 of the
Bankruptcy Code in August of 2012. Certain parties (including the debtor) in the bankruptcy proceedings have questioned whether our
NPI, and certain amounts we received under it since the filing of the bankruptcy, should be included in the debtor’s estate under the
bankruptcy proceeding. We filed a declaratory judgment action in the bankruptcy court seeking a declaration that our NPI, and
payments that we received from it since the filing of the bankruptcy, are not part of the bankruptcy estate. Once discovery is concluded
in the bankruptcy court, the federal district court will hold a trial to determine the nature of our NPI. We will vigorously defend our rights
and pursue our interests in this matter.
Personal Injury Claims. Our deductibles for marine liability insurance coverage, including personal injury claims, which primarily
result from Jones Act liability in the Gulf of Mexico, are currently $10.0 million for the first occurrence, with no aggregate deductible, and
vary in amounts ranging between $5.0 million and, if aggregate claims exceed certain thresholds, up to $100.0 million for each
subsequent occurrence, depending on the nature, severity and frequency of claims which might arise during the policy year. The Jones
Act is a federal law that permits seamen to seek compensation for certain injuries during the course of their employment on a vessel and
governs the liability of vessel operators and marine employers for the work-related injury or death of an employee. We engage outside
consultants to assist us in estimating our aggregate liability for personal injury claims based on our historical losses and utilizing various
actuarial models. We allocate a portion of the aggregate liability to “Accrued liabilities” based on an estimate of claims expected to be
paid within the next twelve months with the residual recorded as “Other liabilities.” At December 31, 2013, our estimated liability for
personal injury claims was $35.5 million, of which $9.5 million and $26.0 million were recorded in “Accrued liabilities” and “Other
68 DIAMOND OFFSHORE / 2013 ANNUAL REPORT

DIAMOND OFFSHORE DRILLING, INC.AND SUBSIDIARIES
NOTES TO CONSOLIDATED FINANCIAL STATEMENTS — (Continued)
liabilities,” respectively, in our Consolidated Balance Sheets. At December 31, 2012, our estimated liability for personal injury claims was
$36.1 million, of which $9.9 million and $26.2 million were recorded in “Accrued liabilities” and “Other liabilities,” respectively, in our
Consolidated Balance Sheets. The eventual settlement or adjudication of these claims could differ materially from our estimated
amounts due to uncertainties such as:
• the severity of personal injuries claimed;
• significant changes in the volume of personal injury claims;
• the unpredictability of legal jurisdictions where the claims will ultimately be litigated;
• inconsistent court decisions; and
• the risks and lack of predictability inherent in personal injury litigation.
Purchase Obligations.
Ultra-Deepwater Floater Construction. In May 2013, we entered into an agreement with Hyundai Heavy Industries Co., Ltd., or
Hyundai, for the construction of a 10,000 foot dynamically positioned, harsh environment semisubmersible drilling rig. The Ocean
GreatWhite is under construction in South Korea at an estimated cost of $755 million, including commissioning, capital spares and
project management costs. The contracted price to Hyundai, totaling $628.5 million, is payable in two installments, of which the first
installment of $188.6 million was paid in 2013. The final installment of $439.9 million is due upon delivery of the rig, which is expected to
occur in the first quarter of 2016.
Drillship Construction. We are financially obligated under four separate turnkey construction contracts with Hyundai for the
construction of four ultra-deepwater drillships. We expect the aggregate cost of the construction of our drillships, including
commissioning, capital spares and project management costs, to be approximately $2.6 billion. The contracted price of each drillship is
payable to Hyundai in two installments, with final payment due on delivery of each drillship. We have paid the first installment for each of
the four drillships, aggregating $647.6 million. The Ocean Black Hawk, the first of our four drillships to be completed, was delivered in late
January 2014, and we paid the final installment due to Hyundai of $396.1 million upon delivery of the drillship. The Ocean BlackHornet is
expected to be delivered in the second quarter of 2014 at which time the second installment of approximately $394 million will be
payable to Hyundai. The Ocean BlackRhino and Ocean BlackLion are expected to be delivered in the third quarter of 2014 and first
quarter of 2015, respectively, at which times approximately $395 million will be payable to Hyundai for each rig.
Ocean Onyx Construction. We were obligated under a vessel modification agreement with Keppel AmFELS, L.L.C., or Keppel, for the
construction of the Ocean Onyx, a moored semisubmersible deepwater rig, which was delivered late in the fourth quarter of 2013. We
estimate the aggregate cost for the construction of the Ocean Onyx to be approximately $366.0 million, including commissioning, capital
spares and project management costs. The contracted price due to Keppel was payable in 11 installments based on the occurrence of
certain events as detailed in the vessel modification agreement. As of December 31, 2013, we had paid the first ten installments, of which
we paid $73.0 million and $65.7 million in 2013 and 2012, respectively. We paid the final installment payable to Keppel under the
construction agreement of $7.3 million in January 2014.
Ocean Apex Construction. We are obligated under a vessel modification agreement with Jurong Shipyard Pte Ltd, or Jurong, for the
construction of the Ocean Apex, a moored semisubmersible deepwater rig, which is expected to be delivered in the third quarter of 2014
at an aggregate cost of approximately $370.0 million, including commissioning, capital spares and project management costs. The
contracted price due to Jurong is payable in 12 installments based on the occurrence of certain events as detailed in the vessel
modification agreement. We have paid the first seven installments, of which we paid $54.1 million and $27.0 million in 2013 and 2012,
respectively. The remaining $54.1 million in aggregate milestone payments is payable to Jurong during 2014 as construction milestones
are met.
Ocean Patriot Enhancements. In February 2013, we entered into a vessel modification agreement with Keppel FELS Limited, or
Keppel Singapore, for enhancements to the Ocean Patriot that will enable the rig to work in the North Sea. We estimate the cost of the
DIAMOND OFFSHORE / 2013 ANNUAL REPORT 69

DIAMOND OFFSHORE DRILLING, INC.AND SUBSIDIARIES
NOTES TO CONSOLIDATED FINANCIAL STATEMENTS — (Continued)
enhancement project to be approximately $120.0 million, including shipyard costs, owner-furnished equipment and labor,
commissioning and capital spares. Construction work commenced in Singapore in the fourth quarter of 2013 and is expected to be
completed in the second quarter of 2014. The contracted price due Keppel Singapore is approximately $29.0 million, payable in seven
installments based on the occurrence of certain events as detailed in the vessel modification agreement. We paid the first four
installments due to Keppel Singapore aggregating $18.8 million in 2013. The remaining $10.2 million in aggregate milestone payments
are payable to Keppel Singapore during 2014 as construction milestones are met.
At December 31, 2013 and 2012, we had no other purchase obligations for major rig upgrades or any other significant obligations,
except for those related to our direct rig operations, which arise during the normal course of business.
Operating Leases. We lease office and yard facilities, housing, equipment and vehicles under operating leases, which expire at
various times through the year 2018. Total rent expense amounted to $13.5 million, $10.8 million and $9.3 million for the years ended
December 31, 2013, 2012 and 2011, respectively. Future minimum rental payments under leases are approximately $2.9 million and
$1.6 million for the years 2014 and 2015, respectively, and $1.2 million in the aggregate for the years 2016 to 2018. There are no
minimum future rental payments under operating leases after 2018.
Letters of Credit and Other. We were contingently liable as of December 31, 2013 in the amount of $78.2 million under certain
performance, bid, supersedeas, tax appeal and custom bonds and letters of credit. Agreements relating to approximately $67.4 million of
performance, security, supersedeas and customs bonds can require collateral at any time. As of December 31, 2013, we had not been
required to make any collateral deposits with respect to these agreements. The remaining agreements cannot require collateral except
in events of default. On our behalf, banks have issued letters of credit securing certain of these bonds.
12. Related-Party Transactions
Transactions with Loews. We are party to a services agreement with Loews, or the Services Agreement, pursuant to which Loews
performs certain administrative and technical services on our behalf. Such services include personnel, internal auditing, accounting, and
cash management services, in addition to advice and assistance with respect to preparation of tax returns and obtaining insurance. Under
the Services Agreement, we are required to reimburse Loews for (i) allocated personnel costs (such as salaries, employee benefits and
payroll taxes) of the Loews personnel actually providing such services and (ii) all out-of-pocket expenses related to the provision of such
services. The Services Agreement may be terminated at our option upon 30 days’ notice to Loews and at the option of Loews upon six
months’ notice to us. In addition, we have agreed to indemnify Loews for all claims and damages arising from the provision of services by
Loews under the Services Agreement unless due to the gross negligence or willful misconduct of Loews. We were charged $1.0 million, $0.8
million and $1.1 million by Loews for these support functions during the years ended December 31, 2013, 2012 and 2011, respectively.
Transactions with Other Related Parties. We hire marine vessels and helicopter transportation services at the prevailing market rate
from subsidiaries of SEACOR Holdings Inc. and Era Group Inc. The Executive Chairman of the Board of Directors of SEACOR Holdings Inc.
and the Non-Executive Chairman of the Board of Directors of Era Group Inc. is also a member of our Board of Directors. We paid
$0.1 million in each of the three years ended December 31, 2013 for the hire of such vessels and such services.
During the years ended December 31, 2013, 2012 and 2011, we made payments of $1.6 million, $1.0 million and $1.2 million,
respectively, to Ernst & Young LLP for tax and other consulting services. The wife of our President and Chief Executive Officer is an audit
partner at this firm.
13. Income Taxes
Our income tax expense is a function of the mix between our domestic and international pre-tax earnings or losses, as well as the
mix of international tax jurisdictions in which we operate. Certain of our international rigs are owned and operated indirectly, by Diamond
Offshore International Limited, or DOIL, a foreign subsidiary which we wholly own. It is our intention to indefinitely reinvest future
earnings of DOIL and its foreign subsidiaries to finance foreign activities. Accordingly, we have not made a provision for U.S. income taxes
on approximately $2.4 billion of undistributed foreign earnings and profits. Although we do not intend to repatriate the earnings of DOIL,
and have not provided U.S. income taxes for such earnings, except to the extent that such earnings were immediately subject to U.S.
income taxes, these earnings could become subject to U.S. income tax if remitted, or if deemed remitted as a dividend; however, it is not
practical to estimate this potential liability.
70 DIAMOND OFFSHORE / 2013 ANNUAL REPORT
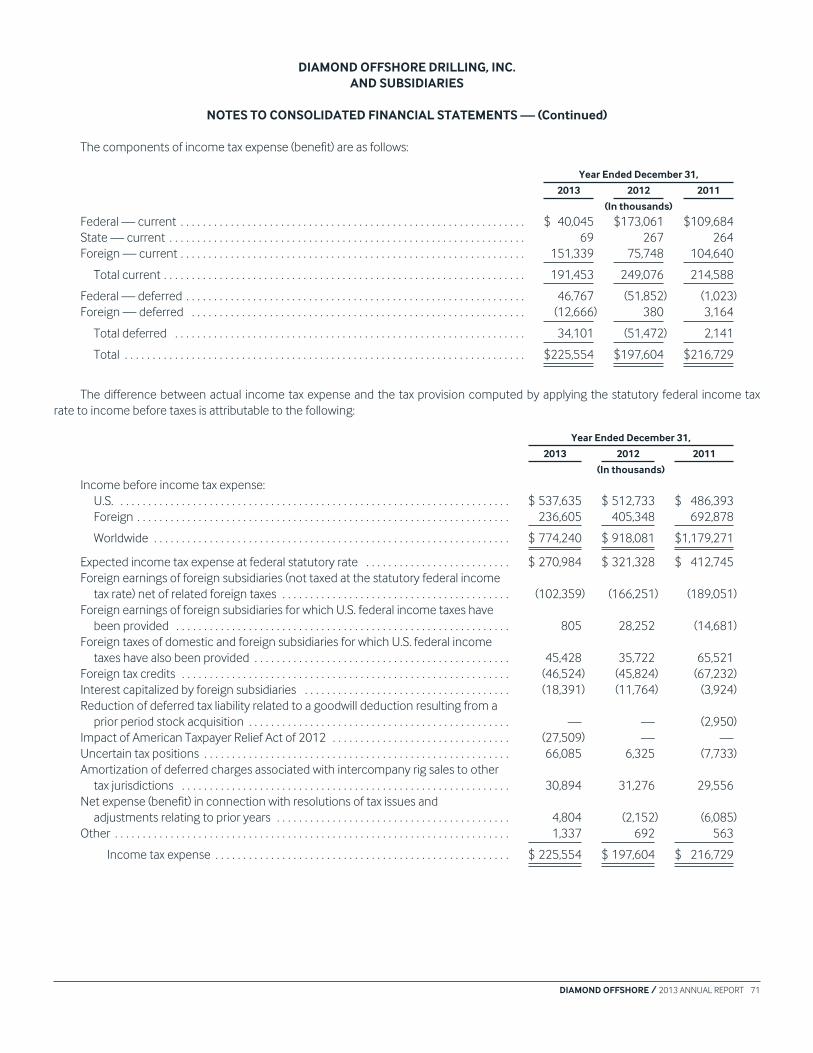
DIAMOND OFFSHORE DRILLING, INC.AND SUBSIDIARIES
NOTES TO CONSOLIDATED FINANCIAL STATEMENTS — (Continued)
The components of income tax expense (benefit) are as follows:
Year Ended December 31,
2013 2012 2011
(In thousands)
Federal — current . . . . . . . . . . . . . . . . . . . . . . . . . . . . . . . . . . . . . . . . . . . . . . . . . . . . . . . . . . . . . . $ 40,045 $173,061 $109,684
State — current . . . . . . . . . . . . . . . . . . . . . . . . . . . . . . . . . . . . . . . . . . . . . . . . . . . . . . . . . . . . . . . . 69 267 264
Foreign — current . . . . . . . . . . . . . . . . . . . . . . . . . . . . . . . . . . . . . . . . . . . . . . . . . . . . . . . . . . . . . . 151,339 75,748 104,640
Total current . . . . . . . . . . . . . . . . . . . . . . . . . . . . . . . . . . . . . . . . . . . . . . . . . . . . . . . . . . . . . . . . . 191,453 249,076 214,588
Federal — deferred . . . . . . . . . . . . . . . . . . . . . . . . . . . . . . . . . . . . . . . . . . . . . . . . . . . . . . . . . . . . . 46,767 (51,852) (1,023)
Foreign — deferred . . . . . . . . . . . . . . . . . . . . . . . . . . . . . . . . . . . . . . . . . . . . . . . . . . . . . . . . . . . . (12,666) 380 3,164
Total deferred . . . . . . . . . . . . . . . . . . . . . . . . . . . . . . . . . . . . . . . . . . . . . . . . . . . . . . . . . . . . . . . 34,101 (51,472) 2,141
Total . . . . . . . . . . . . . . . . . . . . . . . . . . . . . . . . . . . . . . . . . . . . . . . . . . . . . . . . . . . . . . . . . . . . . . . . $225,554 $197,604 $216,729
The difference between actual income tax expense and the tax provision computed by applying the statutory federal income tax
rate to income before taxes is attributable to the following:
Year Ended December 31,
2013 2012 2011
(In thousands)
Income before income tax expense:
U.S. . . . . . . . . . . . . . . . . . . . . . . . . . . . . . . . . . . . . . . . . . . . . . . . . . . . . . . . . . . . . . . . . . . . . . . $ 537,635 $ 512,733 $ 486,393
Foreign . . . . . . . . . . . . . . . . . . . . . . . . . . . . . . . . . . . . . . . . . . . . . . . . . . . . . . . . . . . . . . . . . . . 236,605 405,348 692,878
Worldwide . . . . . . . . . . . . . . . . . . . . . . . . . . . . . . . . . . . . . . . . . . . . . . . . . . . . . . . . . . . . . . . . $ 774,240 $ 918,081 $1,179,271
Expected income tax expense at federal statutory rate . . . . . . . . . . . . . . . . . . . . . . . . . . $ 270,984 $ 321,328 $ 412,745
Foreign earnings of foreign subsidiaries (not taxed at the statutory federal income
tax rate) net of related foreign taxes . . . . . . . . . . . . . . . . . . . . . . . . . . . . . . . . . . . . . . . . . (102,359) (166,251) (189,051)
Foreign earnings of foreign subsidiaries for which U.S. federal income taxes have
been provided . . . . . . . . . . . . . . . . . . . . . . . . . . . . . . . . . . . . . . . . . . . . . . . . . . . . . . . . . . . . 805 28,252 (14,681)
Foreign taxes of domestic and foreign subsidiaries for which U.S. federal income
taxes have also been provided . . . . . . . . . . . . . . . . . . . . . . . . . . . . . . . . . . . . . . . . . . . . . . 45,428 35,722 65,521
Foreign tax credits . . . . . . . . . . . . . . . . . . . . . . . . . . . . . . . . . . . . . . . . . . . . . . . . . . . . . . . . . . . (46,524) (45,824) (67,232)
Interest capitalized by foreign subsidiaries . . . . . . . . . . . . . . . . . . . . . . . . . . . . . . . . . . . . . (18,391) (11,764) (3,924)
Reduction of deferred tax liability related to a goodwill deduction resulting from a
prior period stock acquisition . . . . . . . . . . . . . . . . . . . . . . . . . . . . . . . . . . . . . . . . . . . . . . . — — (2,950)
Impact of American Taxpayer Relief Act of 2012 . . . . . . . . . . . . . . . . . . . . . . . . . . . . . . . . (27,509) — —
Uncertain tax positions . . . . . . . . . . . . . . . . . . . . . . . . . . . . . . . . . . . . . . . . . . . . . . . . . . . . . . . 66,085 6,325 (7,733)
Amortization of deferred charges associated with intercompany rig sales to other
tax jurisdictions . . . . . . . . . . . . . . . . . . . . . . . . . . . . . . . . . . . . . . . . . . . . . . . . . . . . . . . . . . . 30,894 31,276 29,556
Net expense (benefit) in connection with resolutions of tax issues and
adjustments relating to prior years . . . . . . . . . . . . . . . . . . . . . . . . . . . . . . . . . . . . . . . . . . 4,804 (2,152) (6,085)
Other . . . . . . . . . . . . . . . . . . . . . . . . . . . . . . . . . . . . . . . . . . . . . . . . . . . . . . . . . . . . . . . . . . . . . . . 1,337 692 563
Income tax expense . . . . . . . . . . . . . . . . . . . . . . . . . . . . . . . . . . . . . . . . . . . . . . . . . . . . . $ 225,554 $ 197,604 $ 216,729
DIAMOND OFFSHORE / 2013 ANNUAL REPORT 71

DIAMOND OFFSHORE DRILLING, INC.AND SUBSIDIARIES
NOTES TO CONSOLIDATED FINANCIAL STATEMENTS — (Continued)
Deferred Income Taxes. Significant components of our deferred income tax assets and liabilities are as follows:
December 31,
2013 2012
(In thousands)
Deferred tax assets:
Net operating loss carryforwards, or NOLs . . . . . . . . . . . . . . . . . . . . . . . . . . . . . . . . . . . . . . . . . . . . . . . . . $ 12,038 $ 24,067
Worker’s compensation and other current accruals . . . . . . . . . . . . . . . . . . . . . . . . . . . . . . . . . . . . . . . . . 17,269 16,929
Disputed receivables reserved . . . . . . . . . . . . . . . . . . . . . . . . . . . . . . . . . . . . . . . . . . . . . . . . . . . . . . . . . . . . 3,516 956
Deferred compensation . . . . . . . . . . . . . . . . . . . . . . . . . . . . . . . . . . . . . . . . . . . . . . . . . . . . . . . . . . . . . . . . . . 14,020 9,051
Foreign contribution taxes . . . . . . . . . . . . . . . . . . . . . . . . . . . . . . . . . . . . . . . . . . . . . . . . . . . . . . . . . . . . . . . 5,749 6,780
Mobilization . . . . . . . . . . . . . . . . . . . . . . . . . . . . . . . . . . . . . . . . . . . . . . . . . . . . . . . . . . . . . . . . . . . . . . . . . . . . 1,673 4,736
Nonqualified stock options and SARs . . . . . . . . . . . . . . . . . . . . . . . . . . . . . . . . . . . . . . . . . . . . . . . . . . . . . . 9,584 8,698
Deferred deductions . . . . . . . . . . . . . . . . . . . . . . . . . . . . . . . . . . . . . . . . . . . . . . . . . . . . . . . . . . . . . . . . . . . . . 8,577 —
Interest -Uncertain Tax Positions . . . . . . . . . . . . . . . . . . . . . . . . . . . . . . . . . . . . . . . . . . . . . . . . . . . . . . . . . . 1,008 206
Other . . . . . . . . . . . . . . . . . . . . . . . . . . . . . . . . . . . . . . . . . . . . . . . . . . . . . . . . . . . . . . . . . . . . . . . . . . . . . . . . . . 1,714 1,434
Total deferred tax assets(1) . . . . . . . . . . . . . . . . . . . . . . . . . . . . . . . . . . . . . . . . . . . . . . . . . . . . . . . . . . . . . 75,148 72,857
Valuation allowance for NOLs . . . . . . . . . . . . . . . . . . . . . . . . . . . . . . . . . . . . . . . . . . . . . . . . . . . . . . . . . . . . . (7,321) (22,876)
Net deferred tax assets . . . . . . . . . . . . . . . . . . . . . . . . . . . . . . . . . . . . . . . . . . . . . . . . . . . . . . . . . . . . . . . . 67,827 49,981
Deferred tax liabilities:
Depreciation . . . . . . . . . . . . . . . . . . . . . . . . . . . . . . . . . . . . . . . . . . . . . . . . . . . . . . . . . . . . . . . . . . . . . . . . . . . . (578,742) (526,606)
Unbilled revenue . . . . . . . . . . . . . . . . . . . . . . . . . . . . . . . . . . . . . . . . . . . . . . . . . . . . . . . . . . . . . . . . . . . . . . . . (4,371) (5,649)
Undistributed earnings of foreign subsidiaries . . . . . . . . . . . . . . . . . . . . . . . . . . . . . . . . . . . . . . . . . . . . . . (24) (24)
Other . . . . . . . . . . . . . . . . . . . . . . . . . . . . . . . . . . . . . . . . . . . . . . . . . . . . . . . . . . . . . . . . . . . . . . . . . . . . . . . . . . (9) (29)
Total deferred tax liabilities . . . . . . . . . . . . . . . . . . . . . . . . . . . . . . . . . . . . . . . . . . . . . . . . . . . . . . . . . . . . . (583,146) (532,308)
Net deferred tax liability . . . . . . . . . . . . . . . . . . . . . . . . . . . . . . . . . . . . . . . . . . . . . . . . . . . . . . . . . . . . . $(515,319) $(482,327)
(1) $10.2 million and $8.6 million reflected in “Prepaid expenses and other current assets” in our Consolidated Balance Sheets at
December 31, 2013 and 2012, respectively. See Note 2.
We record a valuation allowance to derecognize a portion of our deferred tax assets, which we do not expect to be ultimately
realized. A summary of changes in the valuation allowance is as follows:
For the Year Ended December 31,
2013 2012 2011
(In thousands)
Valuation allowance as of January 1 . . . . . . . . . . . . . . . . . . . . . . . . . . . . . . . . . . . . . . . . . . . . . . . . . $ 22,876 $26,353 $32,102
Establishment of valuation allowances:
Foreign tax credits . . . . . . . . . . . . . . . . . . . . . . . . . . . . . . . . . . . . . . . . . . . . . . . . . . . . . . . . . . . . . . . — — (186)
Net operating losses . . . . . . . . . . . . . . . . . . . . . . . . . . . . . . . . . . . . . . . . . . . . . . . . . . . . . . . . . . . . . 25 946 1,844
Releases of valuation allowances in various jurisdictions . . . . . . . . . . . . . . . . . . . . . . . . . . . . . . . (15,580) (4,423) (7,407)
Valuation allowance as of December 31 . . . . . . . . . . . . . . . . . . . . . . . . . . . . . . . . . . . . . . . . . . . . . $ 7,321 $22,876 $26,353
72 DIAMOND OFFSHORE / 2013 ANNUAL REPORT

DIAMOND OFFSHORE DRILLING, INC.AND SUBSIDIARIES
NOTES TO CONSOLIDATED FINANCIAL STATEMENTS — (Continued)
Net Operating Loss Carryforwards — As of December 31, 2013, we had recorded a deferred tax asset of $12.0 million for the benefit
of NOL carryforwards related to our international operations. Approximately $11.2 million of this deferred tax asset relates to NOL
carryforwards that have an indefinite life. The remaining $0.8 million relates to NOL carryforwards of our Mexican entities. Unless utilized,
the tax benefits of these Mexican NOL carryforwards will expire between 2021 and 2023 as follows:
Year Expiring
Tax Benefit ofNOL
Carryforwards(In millions)
2021 . . . . . . . . . . . . . . . . . . . . . . . . . . . . . . . . . . . . . . . . . . . . . . . . . . . . . . . . . . . . . . . . . . . . . . . . . . . . . . . . . . . . . . . . . . . . . . . . $0.2
2022 . . . . . . . . . . . . . . . . . . . . . . . . . . . . . . . . . . . . . . . . . . . . . . . . . . . . . . . . . . . . . . . . . . . . . . . . . . . . . . . . . . . . . . . . . . . . . . . . 0.2
2023 . . . . . . . . . . . . . . . . . . . . . . . . . . . . . . . . . . . . . . . . . . . . . . . . . . . . . . . . . . . . . . . . . . . . . . . . . . . . . . . . . . . . . . . . . . . . . . . . 0.4
Total . . . . . . . . . . . . . . . . . . . . . . . . . . . . . . . . . . . . . . . . . . . . . . . . . . . . . . . . . . . . . . . . . . . . . . . . . . . . . . . . . . . . . . . . . . . . . . $0.8
As of December 31, 2013, a valuation allowance of $7.3 million has been recorded for our NOLs as only $4.7 million of the deferred
tax asset is more likely than not to be realized.
Unrecognized Tax Benefits. Our income tax returns are subject to review and examination in the various jurisdictions in which we
operate and we are currently contesting various tax assessments. We accrue for income tax contingencies, or uncertain tax positions,
that we believe are more likely than not exposures. A reconciliation of the beginning and ending amount of unrecognized tax benefits,
gross of tax carryforwards and excluding interest and penalties, and is as follows:
For the Year Ended December 31,
2013 2012 2011
(In thousands)
Balance, beginning of period . . . . . . . . . . . . . . . . . . . . . . . . . . . . . . . . . . . . . . . . . . . . . . . . . . . . . . $(67,150) $(62,936) $(75,311)
Additions for current year tax positions . . . . . . . . . . . . . . . . . . . . . . . . . . . . . . . . . . . . . . . . . . . (1,724) (3,837) (913)
Additions for prior year tax positions . . . . . . . . . . . . . . . . . . . . . . . . . . . . . . . . . . . . . . . . . . . . . (31,264) (5,136) —
Reductions for prior year tax positions . . . . . . . . . . . . . . . . . . . . . . . . . . . . . . . . . . . . . . . . . . . 7,280 4,759 4,770
Reductions related to statute of limitation expirations . . . . . . . . . . . . . . . . . . . . . . . . . . . . . 1,937 — 8,518
Balance, end of period . . . . . . . . . . . . . . . . . . . . . . . . . . . . . . . . . . . . . . . . . . . . . . . . . . . . . . . . . . . . $(90,921) $(67,150) $(62,936)
At December 31, 2013, $6.3 million and $82.6 million of the net liability for uncertain tax positions were reflected in “Other assets”
and “Other liabilities,” respectively. At December 31, 2012, $7.0 million and $55.4 million of the net liability for uncertain tax positions
were reflected in “Other assets” and “Other liabilities,” respectively. Of the net unrecognized tax benefits at December 31, 2013, 2012 and
2011, all $76.3 million, $48.4 million and $41.2 million, respectively, would affect the effective tax rates if recognized.
The following table presents the amount of accrued interest and penalties at December 31, 2013 and 2012 related to uncertain tax
positions:
December 31,
2013 2012
(In thousands)
Uncertain tax positions net, excluding interest and penalties . . . . . . . . . . . . . . . . . . . . . . . . . . . . . . . . . . . . $ (76,303) $(48,353)
Accrued interest on uncertain tax positions . . . . . . . . . . . . . . . . . . . . . . . . . . . . . . . . . . . . . . . . . . . . . . . . . (12,786) (7,029)
Accrued penalties on uncertain tax positions . . . . . . . . . . . . . . . . . . . . . . . . . . . . . . . . . . . . . . . . . . . . . . . . (59,797) (21,662)
Uncertain tax positions net, including interest and penalties . . . . . . . . . . . . . . . . . . . . . . . . . . . . . . . . . . . . . $(148,886) $(77,044)
DIAMOND OFFSHORE / 2013 ANNUAL REPORT 73

DIAMOND OFFSHORE DRILLING, INC.AND SUBSIDIARIES
NOTES TO CONSOLIDATED FINANCIAL STATEMENTS — (Continued)
We record interest related to accrued uncertain tax positions in interest expense and recognize penalties associated with uncertain
tax positions in tax expense. Interest expense and penalties recognized during the three years ended December 31, 2013 related to
uncertain tax positions are as follows:
For the Year Ended December 31,
2013 2012 2011
(In thousands)
Net increase (decrease) in interest expense related to unrecognized tax positions . . . . . . . . . $ 5,758 $(1,902) $ 245
Net increase (decrease) in penalties related to unrecognized tax positions . . . . . . . . . . . . . . . . 38,136 (787) (3,039)
In several of the international locations in which we operate, certain of our wholly-owned subsidiaries enter into agreements with
other of our wholly-owned subsidiaries to provide specialized services and equipment in support of our foreign operations. We apply a
transfer pricing methodology to determine the amount to be charged for providing the services and equipment. In most cases, there are
alternative transfer pricing methodologies that could be applied to these transactions and, if applied, could result in different chargeable
amounts. Taxing authorities in the various foreign locations in which we operate could apply one of the alternative transfer pricing
methodologies which could result in an increase to our income tax liabilities with respect to tax returns that remain subject to
examination.
Tax Returns and Examinations. We file income tax returns in the U.S. federal jurisdiction, various state jurisdictions and various
foreign jurisdictions. Tax years that remain subject to examination by these jurisdictions include years 2003 to 2012. We are currently
under audit in several of these jurisdictions. We do not anticipate that any adjustments resulting from the tax audit of any of these years
will have a material impact on our consolidated results of operations, financial condition and cash flows.
U.S. Tax Jurisdiction. In May 2013, we were notified by the Department of the Treasury that the Internal Revenue Service audit of our
2010 corporate tax return was completed without adjustment.
Brazil Tax Jurisdiction. In March 2013, the Brazilian tax authorities began an audit of our income tax returns for the years 2009 and
2010. In addition, we are continuing to defend tax assessments by the Brazilian tax authorities for the years 2000, 2004, 2005 and 2007.
In February 2012, the tax authorities concluded their audit of our income tax return for the 2007 tax year for which we received an
assessment of R$35.1 million (approximately equal to USD $15 million at December 31, 2013) for income tax, including interest and
penalties. We contested the assessment and a court in Brazil ruled to cancel the assessment. However, the Brazilian tax authorities have
appealed the ruling, and we are awaiting the outcome of the appeal. We have not accrued any tax expense related to this assessment.
In December 2009, we received an assessment of approximately $26.0 million for the years 2004 and 2005, including interest and
penalty. We contested the tax assessment in January 2010 and are awaiting the outcome of the appeal. As required by GAAP, only the
portion of the tax benefit that has a greater than 50% likelihood of being realized upon settlement is to be recognized. Consequently, we
have accrued approximately $9.9 million of expense attributable to the portion of the tax assessment we determined to be an uncertain
tax position, of which approximately $3.4 million is interest related and approximately $2.8 million is penalty related.
In addition, the tax auditors have issued an assessment for tax year 2000 of approximately $1.5 million, including interest and
penalty. We have appealed the tax assessment and are awaiting the outcome of the appeal.
During 2011, unrecognized tax benefits were reduced by approximately $6.8 million due to the lapse in the applicable statute of
limitations for the 2006 tax year, of which $1.1 million was interest and $2.0 million was penalty.
Mexico Tax Jurisdiction. The tax authorities in Mexico previously audited our income tax returns for the years 2004 and 2006 and
had issued assessments for tax years 2004 and 2006 of approximately $22.9 million and $24.4 million, respectively, including interest and
penalties, which we had appealed. In 2013 the Mexican tax authorities initiated a tax amnesty program whereby income tax assessments,
including penalties and interest, could be partially or completely waived. Under the tax amnesty, we were able to settle our tax liabilities
for the years 2004 and 2006 for a net cash cost of $3.7 million. As a result of increases in uncertain tax positions for later years, we
recorded an additional $13.2 million of expense, including $5.0 million of interest and $2.7 million of penalties.
74 DIAMOND OFFSHORE / 2013 ANNUAL REPORT
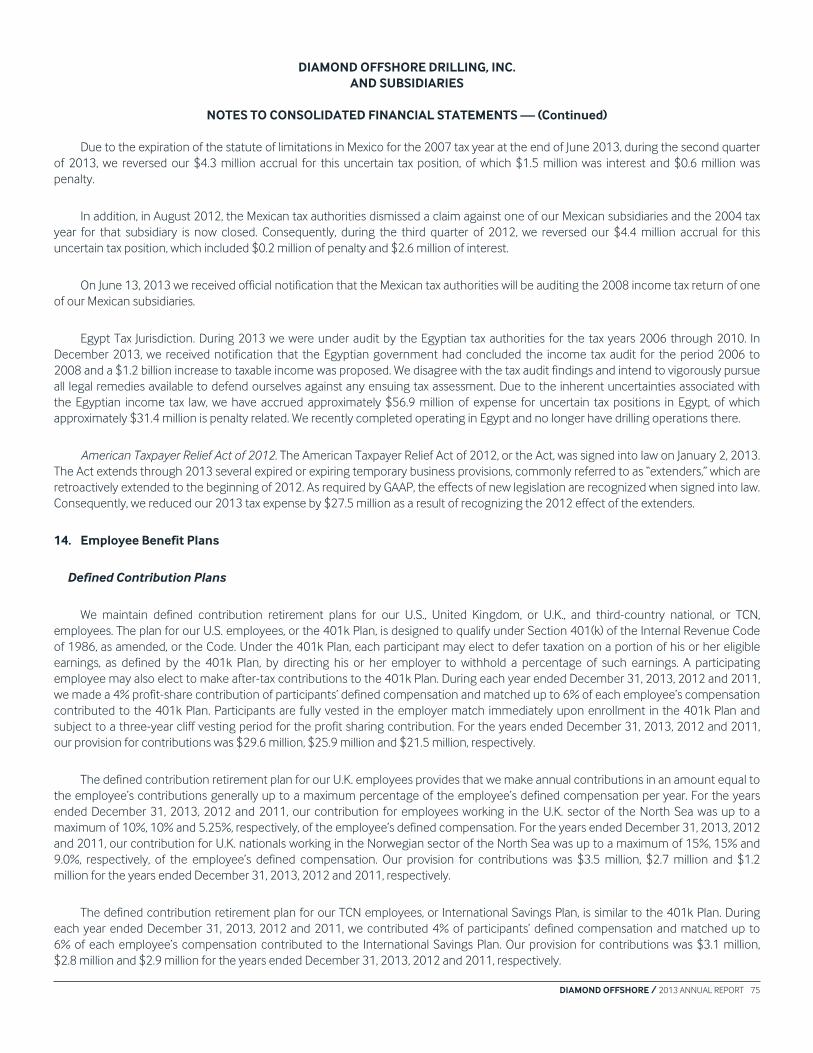
DIAMOND OFFSHORE DRILLING, INC.AND SUBSIDIARIES
NOTES TO CONSOLIDATED FINANCIAL STATEMENTS — (Continued)
Due to the expiration of the statute of limitations in Mexico for the 2007 tax year at the end of June 2013, during the second quarter
of 2013, we reversed our $4.3 million accrual for this uncertain tax position, of which $1.5 million was interest and $0.6 million was
penalty.
In addition, in August 2012, the Mexican tax authorities dismissed a claim against one of our Mexican subsidiaries and the 2004 tax
year for that subsidiary is now closed. Consequently, during the third quarter of 2012, we reversed our $4.4 million accrual for this
uncertain tax position, which included $0.2 million of penalty and $2.6 million of interest.
On June 13, 2013 we received official notification that the Mexican tax authorities will be auditing the 2008 income tax return of one
of our Mexican subsidiaries.
Egypt Tax Jurisdiction. During 2013 we were under audit by the Egyptian tax authorities for the tax years 2006 through 2010. In
December 2013, we received notification that the Egyptian government had concluded the income tax audit for the period 2006 to
2008 and a $1.2 billion increase to taxable income was proposed. We disagree with the tax audit findings and intend to vigorously pursue
all legal remedies available to defend ourselves against any ensuing tax assessment. Due to the inherent uncertainties associated with
the Egyptian income tax law, we have accrued approximately $56.9 million of expense for uncertain tax positions in Egypt, of which
approximately $31.4 million is penalty related. We recently completed operating in Egypt and no longer have drilling operations there.
American Taxpayer Relief Act of 2012. The American Taxpayer Relief Act of 2012, or the Act, was signed into law on January 2, 2013.
The Act extends through 2013 several expired or expiring temporary business provisions, commonly referred to as “extenders,” which are
retroactively extended to the beginning of 2012. As required by GAAP, the effects of new legislation are recognized when signed into law.
Consequently, we reduced our 2013 tax expense by $27.5 million as a result of recognizing the 2012 effect of the extenders.
14. Employee Benefit Plans
Defined Contribution Plans
We maintain defined contribution retirement plans for our U.S., United Kingdom, or U.K., and third-country national, or TCN,
employees. The plan for our U.S. employees, or the 401k Plan, is designed to qualify under Section 401(k) of the Internal Revenue Code
of 1986, as amended, or the Code. Under the 401k Plan, each participant may elect to defer taxation on a portion of his or her eligible
earnings, as defined by the 401k Plan, by directing his or her employer to withhold a percentage of such earnings. A participating
employee may also elect to make after-tax contributions to the 401k Plan. During each year ended December 31, 2013, 2012 and 2011,
we made a 4% profit-share contribution of participants’ defined compensation and matched up to 6% of each employee’s compensation
contributed to the 401k Plan. Participants are fully vested in the employer match immediately upon enrollment in the 401k Plan and
subject to a three-year cliff vesting period for the profit sharing contribution. For the years ended December 31, 2013, 2012 and 2011,
our provision for contributions was $29.6 million, $25.9 million and $21.5 million, respectively.
The defined contribution retirement plan for our U.K. employees provides that we make annual contributions in an amount equal to
the employee’s contributions generally up to a maximum percentage of the employee’s defined compensation per year. For the years
ended December 31, 2013, 2012 and 2011, our contribution for employees working in the U.K. sector of the North Sea was up to a
maximum of 10%, 10% and 5.25%, respectively, of the employee’s defined compensation. For the years ended December 31, 2013, 2012
and 2011, our contribution for U.K. nationals working in the Norwegian sector of the North Sea was up to a maximum of 15%, 15% and
9.0%, respectively, of the employee’s defined compensation. Our provision for contributions was $3.5 million, $2.7 million and $1.2
million for the years ended December 31, 2013, 2012 and 2011, respectively.
The defined contribution retirement plan for our TCN employees, or International Savings Plan, is similar to the 401k Plan. During
each year ended December 31, 2013, 2012 and 2011, we contributed 4% of participants’ defined compensation and matched up to
6% of each employee’s compensation contributed to the International Savings Plan. Our provision for contributions was $3.1 million,
$2.8 million and $2.9 million for the years ended December 31, 2013, 2012 and 2011, respectively.
DIAMOND OFFSHORE / 2013 ANNUAL REPORT 75

DIAMOND OFFSHORE DRILLING, INC.AND SUBSIDIARIES
NOTES TO CONSOLIDATED FINANCIAL STATEMENTS — (Continued)
Deferred Compensation and Supplemental Executive Retirement Plan
Our Amended and Restated Diamond Offshore Management Company Supplemental Executive Retirement Plan, or Supplemental
Plan, provides benefits to a select group of our management or other highly compensated employees to compensate such employees
for any portion of our base salary contribution and/or matching contribution under the 401k Plan that could not be contributed to that
plan because of limitations within the Code. Our provision for contributions to the Supplemental Plan for the years ended December 31,
2013, 2012 and 2011 was approximately $261,000, $256,000 and $245,000, respectively.
15. Segments and Geographic Area Analysis
Although we provide contract drilling services with different types of offshore drilling rigs and also provide such services in many
geographic locations, we have aggregated these operations into one reportable segment based on the similarity of economic
characteristics due to the nature of the revenue earning process as it relates to the offshore drilling industry over the operating lives of
our drilling rigs.
Revenues from contract drilling services by equipment-type are listed below:
Year Ended December 31,
2013 2012 2011
(In thousands)
Floaters:
Ultra-Deepwater . . . . . . . . . . . . . . . . . . . . . . . . . . . . . . . . . . . . . . . . . . . . . . . . . . . . . . . . $ 854,515 $ 902,793 $ 841,565
Deepwater . . . . . . . . . . . . . . . . . . . . . . . . . . . . . . . . . . . . . . . . . . . . . . . . . . . . . . . . . . . . . . 617,080 597,694 733,037
Mid-Water . . . . . . . . . . . . . . . . . . . . . . . . . . . . . . . . . . . . . . . . . . . . . . . . . . . . . . . . . . . . . . 1,197,934 1,275,068 1,482,032
Total Floaters . . . . . . . . . . . . . . . . . . . . . . . . . . . . . . . . . . . . . . . . . . . . . . . . . . . . . . . . . 2,669,529 2,775,555 3,056,634
Jack-ups . . . . . . . . . . . . . . . . . . . . . . . . . . . . . . . . . . . . . . . . . . . . . . . . . . . . . . . . . . . . . . . . . . 174,055 160,511 197,534
Other . . . . . . . . . . . . . . . . . . . . . . . . . . . . . . . . . . . . . . . . . . . . . . . . . . . . . . . . . . . . . . . . . . . . . — — 145
Total contract drilling revenues . . . . . . . . . . . . . . . . . . . . . . . . . . . . . . . . . . . . . . 2,843,584 2,936,066 3,254,313
Revenues related to reimbursable expenses . . . . . . . . . . . . . . . . . . . . . . . . . . . . . . . . . . 76,837 50,442 68,106
Total revenues . . . . . . . . . . . . . . . . . . . . . . . . . . . . . . . . . . . . . . . . . . . . . . . . . . . . . $2,920,421 $2,986,508 $3,322,419
Geographic Areas
Our drilling rigs are highly mobile and may be moved to other markets throughout the world in response to market conditions or
customer needs. At December 31, 2013, our actively-marketed drilling rigs were en route to or located offshore 12 countries in addition
to the United States. Revenues by geographic area are presented by attributing revenues to the individual country or areas where the
services were performed.
Year Ended December 31,
2013 2012 2011
(In thousands)
United States . . . . . . . . . . . . . . . . . . . . . . . . . . . . . . . . . . . . . . . . . . . . . . . . . . . . . . . . . . . . . . $ 330,471 $ 173,961 $ 323,381
International:
South America . . . . . . . . . . . . . . . . . . . . . . . . . . . . . . . . . . . . . . . . . . . . . . . . . . . . . . . . . . 1,219,287 1,427,927 1,736,798
Europe/Africa/Mediterranean . . . . . . . . . . . . . . . . . . . . . . . . . . . . . . . . . . . . . . . . . . . . 731,888 662,995 749,128
Australia/Asia . . . . . . . . . . . . . . . . . . . . . . . . . . . . . . . . . . . . . . . . . . . . . . . . . . . . . . . . . . . 438,814 524,957 451,364
Mexico . . . . . . . . . . . . . . . . . . . . . . . . . . . . . . . . . . . . . . . . . . . . . . . . . . . . . . . . . . . . . . . . . 199,961 196,668 61,748
2,589,950 2,812,547 2,999,038
Total revenues . . . . . . . . . . . . . . . . . . . . . . . . . . . . . . . . . . . . . . . . . . . . . . . . . . . . . . . . $2,920,421 $2,986,508 $3,322,419
76 DIAMOND OFFSHORE / 2013 ANNUAL REPORT

DIAMOND OFFSHORE DRILLING, INC.AND SUBSIDIARIES
NOTES TO CONSOLIDATED FINANCIAL STATEMENTS — (Continued)
An individual international country may, from time to time, comprise a material percentage of our total contract drilling revenues
from unaffiliated customers. For the years ended December 31, 2013, 2012 and 2011, individual countries that comprised 5% or more of
our total contract drilling revenues from unaffiliated customers are listed below.
Year Ended December 31,
2013 2012 2011
Brazil . . . . . . . . . . . . . . . . . . . . . . . . . . . . . . . . . . . . . . . . . . . . . . . . . . . . . . . . . . . . . . . . . . . . . . . . . . . . . 38.3% 46.1% 49.4%
United Kingdom . . . . . . . . . . . . . . . . . . . . . . . . . . . . . . . . . . . . . . . . . . . . . . . . . . . . . . . . . . . . . . . . . . . 7.9% 6.9% 4.6%
Australia . . . . . . . . . . . . . . . . . . . . . . . . . . . . . . . . . . . . . . . . . . . . . . . . . . . . . . . . . . . . . . . . . . . . . . . . . . 3.2% 6.7% 6.7%
Mexico . . . . . . . . . . . . . . . . . . . . . . . . . . . . . . . . . . . . . . . . . . . . . . . . . . . . . . . . . . . . . . . . . . . . . . . . . . . 6.9% 6.6% 1.9%
Angola . . . . . . . . . . . . . . . . . . . . . . . . . . . . . . . . . . . . . . . . . . . . . . . . . . . . . . . . . . . . . . . . . . . . . . . . . . . 3.8% 2.7% 9.6%
Indonesia . . . . . . . . . . . . . . . . . . . . . . . . . . . . . . . . . . . . . . . . . . . . . . . . . . . . . . . . . . . . . . . . . . . . . . . . . 4.4% 2.4% 5.0%
The following table presents our long-lived tangible assets by geographic location as of December 31, 2013, 2012 and 2011. A
substantial portion of our assets is comprised of rigs that are mobile, and therefore asset locations at the end of the period are not
necessarily indicative of the geographic distribution of the earnings generated by such assets during the periods and may vary from
period to period due to the relocation of rigs. In circumstances where our drilling rigs were in transit at the end of a calendar year, they
have been presented in the tables below within the geographic area in which they were expected to operate.
December 31,
2013 2012 2011
(In thousands)
Drilling and other property and equipment, net:
United States(1) . . . . . . . . . . . . . . . . . . . . . . . . . . . . . . . . . . . . . . . . . . . . . . . . . . . . . . . . $ 611,731 $ 444,984 $ 283,049
International:
Australia/Asia/Middle East(2) . . . . . . . . . . . . . . . . . . . . . . . . . . . . . . . . . . . . . . . . . . . . 2,078,348 1,474,999 1,212,461
South America . . . . . . . . . . . . . . . . . . . . . . . . . . . . . . . . . . . . . . . . . . . . . . . . . . . . . . . . . . 1,690,976 1,827,247 1,979,303
Europe/Africa/Mediterranean . . . . . . . . . . . . . . . . . . . . . . . . . . . . . . . . . . . . . . . . . . . . 793,097 799,194 852,300
Mexico . . . . . . . . . . . . . . . . . . . . . . . . . . . . . . . . . . . . . . . . . . . . . . . . . . . . . . . . . . . . . . . . . 293,075 318,548 340,356
4,855,496 4,419,988 4,384,420
Total . . . . . . . . . . . . . . . . . . . . . . . . . . . . . . . . . . . . . . . . . . . . . . . . . . . . . . . . . . . . . . . . . $5,467,227 $4,864,972 $4,667,469
(1) Long-lived tangible assets in the United States region as of December 31, 2013, 2012 and 2011 include $339.1 million, $167.4
million and $14.6 million, respectively, in construction work-in-progress for the Ocean Onyx under construction in Brownsville,
Texas.
(2) Long-lived tangible assets in the Australia/Asia/Middle East region include $1,064.5 million, $741.1 million and $490.2 million in
construction work-in-progress for our four drillships and the Ocean GreatWhite under construction in South Korea as of
December 31, 2013, 2012 and 2011, respectively, and $264.6 million and $82.5 million for the Ocean Apex under construction in
Singapore as of December 31, 2013 and 2012, respectively.
DIAMOND OFFSHORE / 2013 ANNUAL REPORT 77

DIAMOND OFFSHORE DRILLING, INC.AND SUBSIDIARIES
NOTES TO CONSOLIDATED FINANCIAL STATEMENTS — (Continued)
The following table presents the countries in which material concentrations of our long-lived tangible assets were located as of
December 31, 2013, 2012 and 2011:
December 31,
2013 2012 2011
Brazil . . . . . . . . . . . . . . . . . . . . . . . . . . . . . . . . . . . . . . . . . . . . . . . . . . . . . . . . . . . . . . . . . . . . . . . . . . . . . 30.2% 37.3% 41.9%
South Korea . . . . . . . . . . . . . . . . . . . . . . . . . . . . . . . . . . . . . . . . . . . . . . . . . . . . . . . . . . . . . . . . . . . . . . 19.5% 15.2% 10.5%
United States . . . . . . . . . . . . . . . . . . . . . . . . . . . . . . . . . . . . . . . . . . . . . . . . . . . . . . . . . . . . . . . . . . . . . 11.2% 9.1% 6.1%
Singapore . . . . . . . . . . . . . . . . . . . . . . . . . . . . . . . . . . . . . . . . . . . . . . . . . . . . . . . . . . . . . . . . . . . . . . . . . 8.2% 1.8% —
Angola . . . . . . . . . . . . . . . . . . . . . . . . . . . . . . . . . . . . . . . . . . . . . . . . . . . . . . . . . . . . . . . . . . . . . . . . . . . 6.3% — 8.0%
Mexico . . . . . . . . . . . . . . . . . . . . . . . . . . . . . . . . . . . . . . . . . . . . . . . . . . . . . . . . . . . . . . . . . . . . . . . . . . . 5.4% 6.5% 7.3%
Indonesia . . . . . . . . . . . . . . . . . . . . . . . . . . . . . . . . . . . . . . . . . . . . . . . . . . . . . . . . . . . . . . . . . . . . . . . . . 5.2% 6.8% 3.4%
Egypt . . . . . . . . . . . . . . . . . . . . . . . . . . . . . . . . . . . . . . . . . . . . . . . . . . . . . . . . . . . . . . . . . . . . . . . . . . . . . 4.0% 4.7% 5.5%
Vietnam . . . . . . . . . . . . . . . . . . . . . . . . . . . . . . . . . . . . . . . . . . . . . . . . . . . . . . . . . . . . . . . . . . . . . . . . . . 0.6% 1.4% 6.6%
Republic of Congo . . . . . . . . . . . . . . . . . . . . . . . . . . . . . . . . . . . . . . . . . . . . . . . . . . . . . . . . . . . . . . . . . — 7.4% —
As of December 31, 2013, 2012 and 2011, no other countries had more than a 5% concentration of our long-lived tangible assets.
Major Customers
Our customer base includes major and independent oil and gas companies and government-owned oil companies. Revenues from
our major customers for the years ended December 31, 2013, 2012 and 2011 that contributed more than 10% of our total revenues are
as follows:
Year Ended December 31,
Customer 2013 2012 2011
Petróleo Brasileiro S.A. . . . . . . . . . . . . . . . . . . . . . . . . . . . . . . . . . . . . . . . . . . . . . . . . . . . . . . . . . . . . . 33.6% 33.3% 35.0%
OGX Petróleo e Gás Ltda. . . . . . . . . . . . . . . . . . . . . . . . . . . . . . . . . . . . . . . . . . . . . . . . . . . . . . . . . . . . 2.4% 12.5% 14.1%
16. Unaudited Quarterly Financial Data
Unaudited summarized financial data by quarter for the years ended December 31, 2013 and 2012 is shown below.
FirstQuarter
SecondQuarter
ThirdQuarter
FourthQuarter
(In thousands, except per share data)
2013Revenues . . . . . . . . . . . . . . . . . . . . . . . . . . . . . . . . . . . . . . . . . . . . . . . . . . . . . . . . . $729,741 $758,018 $706,165 $726,497
Operating income . . . . . . . . . . . . . . . . . . . . . . . . . . . . . . . . . . . . . . . . . . . . . . . . . . 213,726 262,859 137,352 187,669
Income before income tax expense . . . . . . . . . . . . . . . . . . . . . . . . . . . . . . . . . . 206,179 256,301 131,565 180,195
Net income . . . . . . . . . . . . . . . . . . . . . . . . . . . . . . . . . . . . . . . . . . . . . . . . . . . . . . . 175,989 185,334 94,748 92,615
Net income per share, basic and diluted . . . . . . . . . . . . . . . . . . . . . . . . . . . . . . $ 1.27 $ 1.33 $ 0.68 $ 0.67
2012Revenues . . . . . . . . . . . . . . . . . . . . . . . . . . . . . . . . . . . . . . . . . . . . . . . . . . . . . . . . . $768,642 $738,188 $729,141 $750,537
Operating income(a) . . . . . . . . . . . . . . . . . . . . . . . . . . . . . . . . . . . . . . . . . . . . . . . 265,410 257,184 244,822 194,962
Income before income tax expense . . . . . . . . . . . . . . . . . . . . . . . . . . . . . . . . . . 251,435 246,758 234,847 185,041
Net income . . . . . . . . . . . . . . . . . . . . . . . . . . . . . . . . . . . . . . . . . . . . . . . . . . . . . . . 185,169 201,461 178,186 155,661
Net income per share, basic and diluted . . . . . . . . . . . . . . . . . . . . . . . . . . . . . . $ 1.33 $ 1.45 $ 1.28 $ 1.12
(a) Results for the fourth quarter of 2012 include a $62.4 million impairment charge related to rigs transferred to “Assets held for sale”
in our Consolidated Balance Sheets at December 31, 2012. See Note 1.
78 DIAMOND OFFSHORE / 2013 ANNUAL REPORT

Item 9. Changes in and Disagreements with Accountants on Accounting and Financial Disclosure.
Not applicable.
Item 9A. Controls and Procedures
Disclosure Controls and Procedures
We maintain a system of disclosure controls and procedures which are designed to ensure that information required to be
disclosed by us in reports that we file or submit under the federal securities laws, including this report, is recorded, processed,
summarized and reported on a timely basis. These disclosure controls and procedures include controls and procedures designed to
ensure that information required to be disclosed by us under the federal securities laws is accumulated and communicated to our
management on a timely basis to allow decisions regarding required disclosure.
Our Chief Executive Officer, or CEO, and Chief Financial Officer, or CFO, participated in an evaluation by our management of the
effectiveness of our disclosure controls and procedures (as defined in Exchange Act Rules 13a-15(e) and 15d-15(e)) as of December 31,
2013. Based on their participation in that evaluation, our CEO and CFO concluded that our disclosure controls and procedures were
effective as of December 31, 2013.
Internal Control Over Financial Reporting
Management’s Annual Report on Internal Control Over Financial Reporting
Our management is responsible for establishing and maintaining adequate internal control over financial reporting (as defined in
Exchange Act Rules 13a-15(f) and 15d-15(f)) for Diamond Offshore Drilling, Inc. Our internal control system was designed to provide
reasonable assurance to our management and Board of Directors regarding the preparation and fair presentation of published financial
statements.
There are inherent limitations to the effectiveness of any control system, however well designed, including the possibility of human
error and the possible circumvention or overriding of controls. Further, the design of a control system must reflect the fact that there are
resource constraints, and the benefits of controls must be considered relative to their costs. Management must make judgments with
respect to the relative cost and expected benefits of any specific control measure. The design of a control system also is based in part
upon assumptions and judgments made by management about the likelihood of future events, and there can be no assurance that a
control will be effective under all potential future conditions. As a result, even an effective system of internal controls can provide no
more than reasonable assurance with respect to the fair presentation of financial statements and the processes under which they were
prepared.
Our management assessed the effectiveness of our internal control over financial reporting as of December 31, 2013. In making
this assessment, our management used the criteria set forth by the Committee of Sponsoring Organizations of the Treadway
Commission (COSO) in Internal Control — Integrated Framework (1992). Based on this assessment our management believes that, as of
December 31, 2013, our internal control over financial reporting was effective.
Deloitte & Touche LLP, the registered public accounting firm that audited our financial statements included in this Annual Report
on Form 10-K, has issued an attestation report on the effectiveness of our internal control over financial reporting. The attestation report
of Deloitte & Touche LLP is included at the beginning of Item 8 of this Form 10-K.
Changes in Internal Control Over Financial Reporting
There were no changes in our internal control over financial reporting identified in connection with the foregoing evaluation that
occurred during our fourth fiscal quarter of 2013 that have materially affected, or are reasonably likely to materially affect, our internal
control over financial reporting.
Item 9B. Other Information.
Not applicable.
DIAMOND OFFSHORE / 2013 ANNUAL REPORT 79
PART III
Reference is made to the information responsive to Items 10, 11, 12, 13 and 14 of this Part III contained in our definitive proxy
statement for our 2014 Annual Meeting of Stockholders, which is incorporated herein by reference.
Item 10. Directors, Executive Officers and Corporate Governance.
Item 11. Executive Compensation.
Item 12. Security Ownership of Certain Beneficial Owners and Management and Related Stockholder Matters.
Item 13. Certain Relationships and Related Transactions, and Director Independence.
Item 14. Principal Accountant Fees and Services.
PART IV
Item 15. Exhibits and Financial Statement Schedules.
(a) Index to Financial Statements, Financial Statement Schedules and Exhibits
(1) Financial Statements
Page
Report of Independent Registered Public Accounting Firm . . . . . . . . . . . . . . . . . . . . . . . . . . . . . . . . . . . . . . . . . . . . . . . . . . . . . . . 44
Consolidated Balance Sheets . . . . . . . . . . . . . . . . . . . . . . . . . . . . . . . . . . . . . . . . . . . . . . . . . . . . . . . . . . . . . . . . . . . . . . . . . . . . . . . . . . 46
Consolidated Statements of Operations . . . . . . . . . . . . . . . . . . . . . . . . . . . . . . . . . . . . . . . . . . . . . . . . . . . . . . . . . . . . . . . . . . . . . . . . 47
Consolidated Statements of Comprehensive Income . . . . . . . . . . . . . . . . . . . . . . . . . . . . . . . . . . . . . . . . . . . . . . . . . . . . . . . . . . . . 48
Consolidated Statements of Stockholders’ Equity . . . . . . . . . . . . . . . . . . . . . . . . . . . . . . . . . . . . . . . . . . . . . . . . . . . . . . . . . . . . . . . . 49
Consolidated Statements of Cash Flows . . . . . . . . . . . . . . . . . . . . . . . . . . . . . . . . . . . . . . . . . . . . . . . . . . . . . . . . . . . . . . . . . . . . . . . . 50
Notes to Consolidated Financial Statements . . . . . . . . . . . . . . . . . . . . . . . . . . . . . . . . . . . . . . . . . . . . . . . . . . . . . . . . . . . . . . . . . . . . 51
(2) Exhibit Index . . . . . . . . . . . . . . . . . . . . . . . . . . . . . . . . . . . . . . . . . . . . . . . . . . . . . . . . . . . . . . . . . . . . . . . . . . . . . . . . . . . . . . . . . . . . 82
See the Exhibit Index for a list of those exhibits filed herewith, which Exhibit Index also includes and identifies management
contracts or compensatory plans or arrangements required to be filed as exhibits to this Form 10-K by Item 601 of Regulation S-K.
80 DIAMOND OFFSHORE / 2013 ANNUAL REPORT

SIGNATURES
Pursuant to the requirements of Section 13 or 15(d) of the Securities Exchange Act of 1934, the registrant has duly caused this
report to be signed on its behalf by the undersigned, thereunto duly authorized, on February 24, 2014.
DIAMOND OFFSHORE DRILLING, INC.
By: /s/ GARY T. KRENEK
Gary T. KrenekSenior Vice President and Chief Financial Officer
Pursuant to the requirements of the Securities Exchange Act of 1934, this report has been signed below by the following
persons on behalf of the registrant and in the capacities and on the dates indicated.
Signature Title Date
/s/ LAWRENCE R. DICKERSON*
Lawrence R. Dickerson
President, Chief Executive Officer and Director
(Principal Executive Officer)
February 24, 2014
/s/ GARY T. KRENEK*
Gary T. Krenek
Senior Vice President and Chief Financial Officer
(Principal Financial Officer)
February 24, 2014
/s/ BETH G. GORDON*
Beth G. Gordon
Controller (Principal Accounting Officer) February 24, 2014
/s/ JAMES S. TISCH*
James S. Tisch
Chairman of the Board February 24, 2014
/s/ JOHN R. BOLTON*
John R. Bolton
Director February 24, 2014
/s/ CHARLES L. FABRIKANT*
Charles L. Fabrikant
Director February 24, 2014
/s/ PAUL G. GAFFNEY II*
Paul G. Gaffney II
Director February 24, 2014
/s/ EDWARD GREBOW*
Edward Grebow
Director February 24, 2014
/s/ HERBERT C. HOFMANN*
Herbert C. Hofmann
Director February 24, 2014
/s/ CLIFFORD M. SOBEL*
Clifford M. Sobel
Director February 24, 2014
/s/ ANDREW H. TISCH*
Andrew H. Tisch
Director February 24, 2014
/s/ RAYMOND S. TROUBH*
Raymond S. Troubh
Director February 24, 2014
*By: /s/ WILLIAM C. LONG
William C. LongAttorney-in-fact
DIAMOND OFFSHORE / 2013 ANNUAL REPORT 81
EXHIBIT INDEX
Exhibit No. Description
3.1 Amended and Restated Certificate of Incorporation of Diamond Offshore Drilling, Inc. (incorporated by reference to
Exhibit 3.1 to our Quarterly Report on Form 10-Q for the quarterly period ended June 30, 2003) (SEC File No. 1-13926).
3.2 Amended and Restated By-laws (as amended through October 4, 2013) of Diamond Offshore Drilling, Inc. (incorporated
by reference to Exhibit 3.1 to our Current Report on Form 8-K filed October 8, 2013).
4.1 Indenture, dated as of February 4, 1997, between Diamond Offshore Drilling, Inc. and The Bank of New York Mellon
(formerly known as The Bank of New York) (as successor to The Chase Manhattan Bank), as Trustee (incorporated by
reference to Exhibit 4.1 to our Annual Report on Form 10-K for the fiscal year ended December 31, 2001)
(SEC File No. 1-13926).
4.2 Fourth Supplemental Indenture, dated as of August 27, 2004, between Diamond Offshore Drilling, Inc. and The Bank of
New York Mellon (formerly known as The Bank of New York) (as successor to JPMorgan Chase Bank), as Trustee
(incorporated by reference to Exhibit 4.2 to our Current Report on Form 8-K filed September 1, 2004)
(SEC File No. 1-13926).
4.3 Fifth Supplemental Indenture, dated as of June 14, 2005, between Diamond Offshore Drilling, Inc. and The Bank of New
York Mellon (formerly known as The Bank of New York) (as successor to JPMorgan Chase Bank, National Association), as
Trustee (incorporated by reference to Exhibit 4.2 to our Current Report on Form 8-K filed June 16, 2005)
(SEC File No. 1-13926).
4.4 Sixth Supplemental Indenture, dated as of May 4, 2009, between Diamond Offshore Drilling, Inc. and The Bank of New
York Mellon, as Trustee (incorporated by reference to Exhibit 4.2 to our Current Report on Form 8-K filed May 4, 2009).
4.5 Seventh Supplemental Indenture, dated as of October 8, 2009, between Diamond Offshore Drilling, Inc. and The Bank of
New York Mellon, as Trustee (incorporated by reference to Exhibit 4.2 to our Current Report on Form 8-K filed October 8,
2009).
4.6 Eighth Supplemental Indenture, dated as of November 5, 2013, between Diamond Offshore Drilling, Inc. and The Bank of
New York Mellon, as Trustee (incorporated by reference to Exhibit 4.2 to our Current Report on Form 8-K filed
November 5, 2013).
10.1 Registration Rights Agreement (the “Registration Rights Agreement”) dated October 16, 1995 between Loews and
Diamond Offshore Drilling, Inc. (incorporated by reference to Exhibit 10.1 to our Annual Report on Form 10-K for the fiscal
year ended December 31, 2001) (SEC File No. 1-13926).
10.2 Amendment to the Registration Rights Agreement, dated September 16, 1997, between Loews and Diamond Offshore
Drilling, Inc. (incorporated by reference to Exhibit 10.2 to our Annual Report on Form 10-K for the fiscal year ended
December 31, 1997) (SEC File No. 1-13926).
10.3 Services Agreement, dated October 16, 1995, between Loews and Diamond Offshore Drilling, Inc. (incorporated by
reference to Exhibit 10.3 to our Annual Report on Form 10-K for the fiscal year ended December 31, 2001)
(SEC File No. 1-13926).
10.4+ Amended and Restated Diamond Offshore Management Company Supplemental Executive Retirement Plan effective as
of January 1, 2007 (incorporated by reference to Exhibit 10.4 to our Annual Report on Form 10-K for the fiscal year ended
December 31, 2006) (SEC File No. 1-13926).
10.5+ Diamond Offshore Management Bonus Program, as amended and restated, and dated as of December 31, 1997
(incorporated by reference to Exhibit 10.6 to our Annual Report on Form 10-K for the fiscal year ended December 31,
1997) (SEC File No. 1-13926).
10.6+ Second Amended and Restated Diamond Offshore Drilling, Inc. 2000 Stock Option Plan, as amended (incorporated by
reference to Exhibit 10.6 to our Annual Report on Form 10-K for the fiscal year ended December 31, 2007)
(SEC File No. 1-13926).
10.7+ Form of Stock Option Certificate for grants to executive officers, other employees and consultants pursuant to the
Second Amended and Restated Diamond Offshore Drilling, Inc. 2000 Stock Option Plan (incorporated by reference to
Exhibit 10.1 to our Current Report on Form 8-K filed October 1, 2004) (SEC File No. 1-13926).
10.8+ Form of Stock Option Certificate for grants to non-employee directors pursuant to the Second Amended and Restated
Diamond Offshore Drilling, Inc. 2000 Stock Option Plan (incorporated by reference to Exhibit 10.2 to our Current Report
on Form 8-K filed October 1, 2004) (SEC File No. 1-13926).
82 DIAMOND OFFSHORE / 2013 ANNUAL REPORT
Exhibit No. Description
10.9+ The Diamond Offshore Drilling, Inc. Incentive Compensation Plan for Executive Officers (Amended and Restated as of
March 20, 2012) (incorporated by reference to Exhibit A attached to our definitive proxy statement on Schedule 14A filed
March 29, 2012).
10.10+ Form of Award Certificate for stock appreciation right grants to the Company’s executive officers, other employees and
consultants pursuant to the Second Amended and Restated Diamond Offshore Drilling, Inc. 2000 Stock Option Plan
(incorporated by reference to Exhibit 10.1 to our Current Report on Form 8-K filed April 28, 2006) (SEC File No. 1-13926).
10.11+ Form of Award Certificate for stock appreciation right grants to non-employee directors pursuant to the Second
Amended and Restated Diamond Offshore Drilling, Inc. 2000 Stock Option Plan (incorporated by reference to Exhibit 10.1
to our Quarterly Report on Form 10-Q for the quarterly period ended March 31, 2007) (SEC File No. 1-13926).
10.12+ Employment Agreement between Diamond Offshore Management Company and Lawrence R. Dickerson dated as of
December 15, 2006 (incorporated by reference to Exhibit 10.1 to our Current Report on Form 8-K filed December 21,
2006) (SEC File No. 1-13926).
10.13+ Employment Agreement between Diamond Offshore Management Company and Gary T. Krenek dated as of
December 15, 2006 (incorporated by reference to Exhibit 10.2 to our Current Report on Form 8-K filed December 21,
2006) (SEC File No. 1-13926).
10.14+ Employment Agreement between Diamond Offshore Management Company and John M. Vecchio dated as of
December 15, 2006 (incorporated by reference to Exhibit 10.15 to our Annual Report on Form 10-K for the fiscal year
ended December 31, 2006) (SEC File No. 1-13926).
10.15+ Employment Agreement between Diamond Offshore Management Company and William C. Long dated as of
December 15, 2006 (incorporated by reference to Exhibit 10.16 to our Annual Report on Form 10-K for the fiscal year
ended December 31, 2006) (SEC File No. 1-13926).
10.16+ Employment Agreement between Diamond Offshore Management Company and Lyndol L. Dew dated as of
December 15, 2006 (incorporated by reference to Exhibit 10.17 to our Annual Report on Form 10-K for the fiscal year
ended December 31, 2006) (SEC File No. 1-13926).
10.17+ Employment Agreement between Diamond Offshore Management Company and Beth G. Gordon dated as of January 3,
2007 (incorporated by reference to Exhibit 10.19 to our Annual Report on Form 10-K for the fiscal year ended
December 31, 2006) (SEC File No. 1-13926).
10.18+ Amendment to Employment Agreement, dated June 16, 2008, between Diamond Offshore Management Company and
Lawrence R. Dickerson (incorporated by reference to Exhibit 10.1 to our Quarterly Report on Form 10-Q for the quarterly
period ended September 30, 2008) (SEC File No. 1-13926).
10.19 5-Year Revolving Credit Agreement, dated as of September 28, 2012, among Diamond Offshore Drilling, Inc., Wells Fargo
Bank, National Association, as administrative agent and swingline lender, the issuing banks named therein and the lenders
named therein (incorporated by reference to Exhibit 10.1 to our Current Report on Form 8-K filed October 1, 2012).
10.20* Extension Agreement and Amendment No. 1 to Credit Agreement, dated as of December 9, 2013, among Diamond
Offshore Drilling, Inc., Wells Fargo Bank, National Association, as an issuing bank, as swingline lender and as administrative
agent for the lenders, and the lenders named therein.
10.21+ Retirement Agreement and General Release between Diamond Offshore Management Company and Lawrence R.
Dickerson dated September 23, 2013 (incorporated by reference to Exhibit 10.1 to our Quarterly Report on Form 10-Q for
the quarterly period ended September 30, 2013).
12.1* Statement re Computation of Ratios.
21.1* List of Subsidiaries of Diamond Offshore Drilling, Inc.
23.1* Consent of Deloitte & Touche LLP.
24.1* Powers of Attorney.
31.1* Rule 13a-14(a) Certification of the Chief Executive Officer.
31.2* Rule 13a-14(a) Certification of the Chief Financial Officer.
32.1* Section 1350 Certification of the Chief Executive Officer and Chief Financial Officer.
DIAMOND OFFSHORE / 2013 ANNUAL REPORT 83

Exhibit No. Description
101.INS** XBRL Instance Document.
101.SCH** XBRL Taxonomy Extension Schema Document.
101.CAL** XBRL Taxonomy Calculation Linkbase Document.
101.LAB** XBRL Taxonomy Label Linkbase Document.
101.PRE** XBRL Presentation Linkbase Document.
101.DEF** XBRL Taxonomy Extension Definition.
* Filed or furnished herewith.
** The documents formatted in XBRL (Extensible Business Reporting Language) and attached as Exhibit 101 to this report are deemed
not filed or part of a registration statement or prospectus for purposes of sections 11 or 12 of the Securities Act, are deemed not
filed for purposes of section 18 of the Exchange Act, and otherwise, not subject to liability under these sections.
+ Management contracts or compensatory plans or arrangements.
84 DIAMOND OFFSHORE / 2013 ANNUAL REPORT

BOARD OF DIRECTORS
James S. Tisch
Chairman of the Board,
Diamond Offshore Drilling, Inc.
President & Chief Executive Officer,
Loews Corporation
Marc Edwards
President & Chief Executive Officer,
Diamond Offshore Drilling, Inc.
John R. Bolton
Senior Fellow,
American Enterprise Institute
Charles L. Fabrikant
Executive Chairman,
SEACOR Holdings Inc.
Paul G. Gaffney II
President Emeritus,
Monmouth University
Edward Grebow
Managing Director,
Morgan Joseph TriArtisan LLC
Herbert C. Hofmann
Retired, former Senior Vice President,
Loews Corporation
Clifford M. Sobel
Managing Partner,
Valor Capital Group LLC
Andrew H. Tisch
Co-Chairman of the Board,
Loews Corporation
Raymond S. Troubh
Financial Consultant
EXECUTIVE OFFICERS
Marc Edwards
President & Chief Executive Officer
John M. Vecchio
Executive Vice President
Lyndol L. Dew
Senior Vice President,
Worldwide Operations
Gary T. Krenek
Senior Vice President &
Chief Financial Officer
William C. Long
Senior Vice President,
General Counsel & Secretary
Beth G. Gordon
Controller
SENIOR MANAGEMENT
Mark F. Baudoin
Senior Vice President,
South America
Stephen G. Elwood
Senior Vice President,
Tax
Karl S. Sellers
Senior Vice President,
Technical Services
Duane A. Beair
Vice President,
Purchasing & Materials Control
R. Lynn Charles
Vice President,
Human Resources
Tri C. Le
Vice President,
Subsea
James R. Moore
Vice President,
Operations
Steven A. Nelson
Vice President,
Operations
Morrison R. Plaisance
Vice President,
Regulatory Affairs
Jon L. Richards
Vice President,
Operations
D. Scott Vaughn
Vice President,
Health, Safety & Environment
Terence W. Waldorf
Vice President, Deputy General Counsel
& Assistant Secretary
Scott L. Kornblau
Treasurer
CORPORATE INFORMATION
Corporate Headquarters
15415 Katy Freeway
Houston, TX 77094
(281) 492-5300
www.diamondoffshore.com
Investor Relations
Darren Daugherty
Director, Investor Relations
15415 Katy Freeway
Houston, TX 77094
(281) 492-5370
Notice of Annual Meeting
The Annual Meeting of Stockholders will
be held on Tuesday, May 20, 2014, at
8:30 AM at the offices of Loews Corporation,
667 Madison Avenue, New York, NY 10065.
Transfer Agent & Registrar
Computershare
PO Box 30170
College Station, TX 77842
(877) 812-4207 www.computershare.com/investor
Stock Exchange Listing
New York Stock Exchange
Trading Symbol “DO”
Independent Auditors
Deloitte & Touche LLP
Design / Rigsby Hull, Houston
Printing / RR Donnelley
Photographer / Drew Donovan