Embed Size (px)
Citation preview
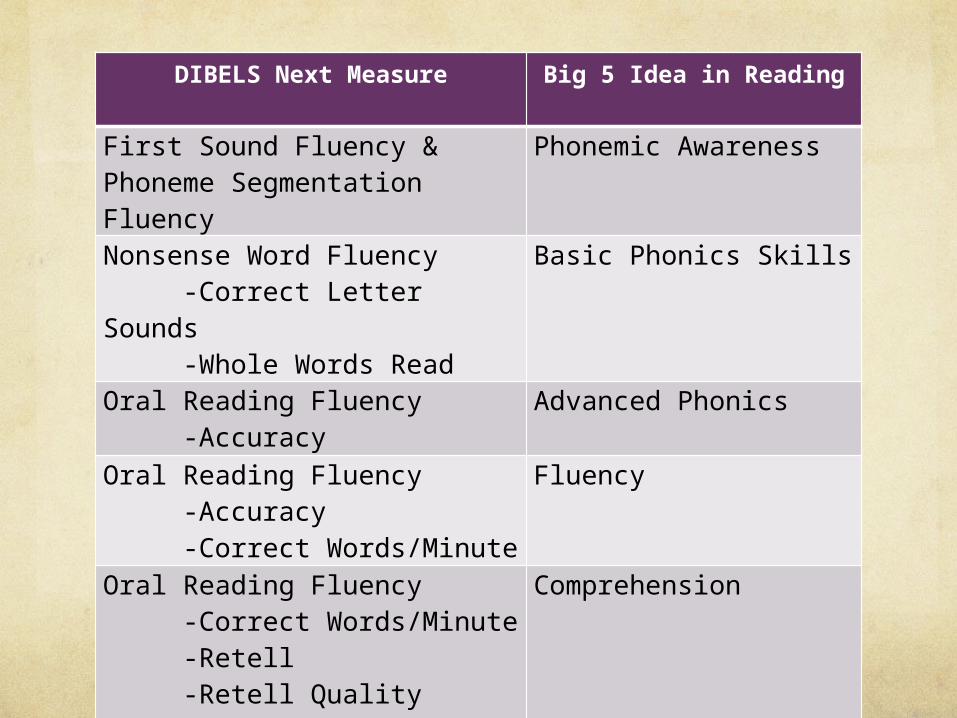
DIBELS Next Measure Big 5 Idea in Reading
First Sound Fluency & Phoneme Segmentation Fluency
Phonemic Awareness
Nonsense Word Fluency -Correct Letter Sounds -Whole Words Read
Basic Phonics Skills
Oral Reading Fluency -Accuracy
Advanced Phonics
Oral Reading Fluency -Accuracy -Correct Words/Minute
Fluency
Oral Reading Fluency -Correct Words/Minute -Retell -Retell QualityDAZE
Comprehension
Essential Questions
How do we use DIBELS with an outcomes-driven model?How are the data results different?How do we read the new reports?How can we use the information to plan instruction and change reading outcomes?How can we use the results to evaluate progress?How can we use the results to evaluate the effectiveness of our programs?

Composite Score
Replaces old instructional recommendation
Composite Score Benchmarks
Composite Score Formula Worksheets
Red Partner: Figuring 1st & 4th Grade

New Benchmarks
Look at new benchmarks. What’s different?
Benchmarks for each measure but only certain measures factor into the overall composite score – see formula worksheets
For example, retell quality doesn’t figure into formula

How do we use DIBELS with an outcomes-
driven model?Identify the
Need for Support
Validate the Need for Support
Plan Support
Evaluate Effectiveness of Support
Review Outcomes
Implement
Support
Benchmark Assessment
Progress Monitoring
Benchmark Assessment
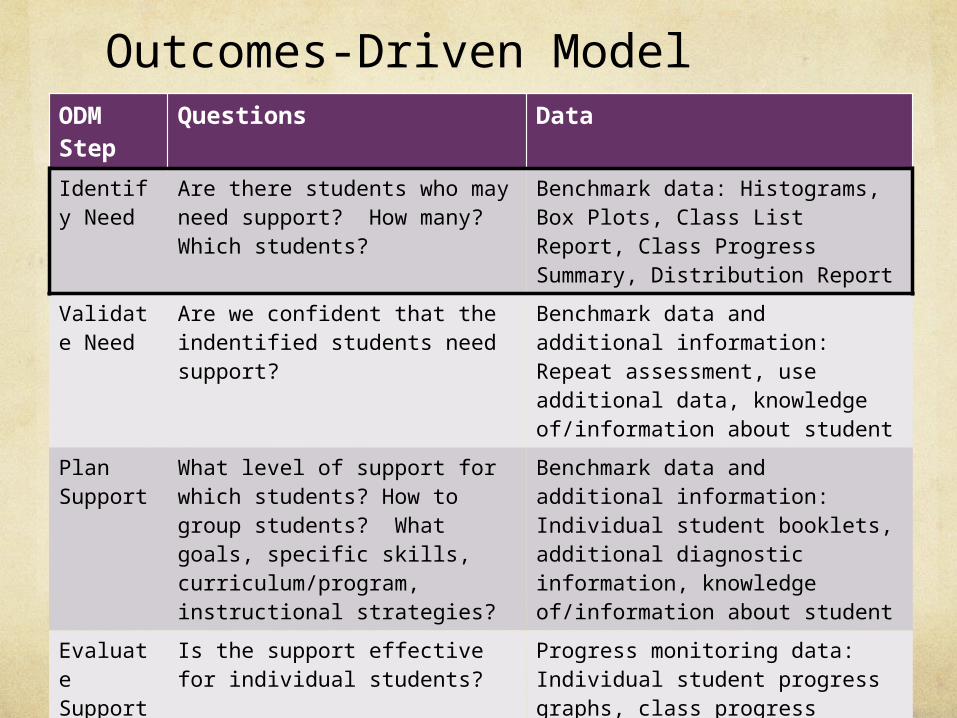
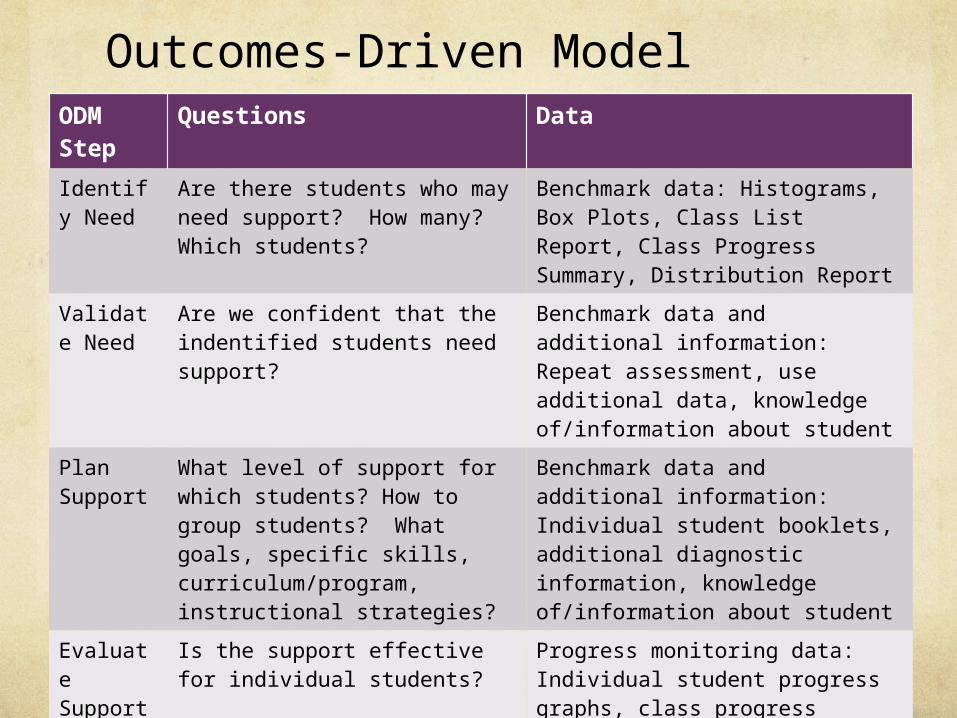
Outcomes-Driven ModelODM Step
Questions Data
Identify Need
Are there students who may need support? How many? Which students?
Benchmark data: Histograms, Box Plots, Class List Report, Class Progress Summary, Distribution Report
Validate Need
Are we confident that the indentified students need support?
Benchmark data and additional information: Repeat assessment, use additional data, knowledge of/information about student
Plan Support
What level of support for which students? How to group students? What goals, specific skills, curriculum/program, instructional strategies?
Benchmark data and additional information: Individual student booklets, additional diagnostic information, knowledge of/information about student
Evaluate Support
Is the support effective for individual students?
Progress monitoring data: Individual student progress graphs, class progress graphs, student history report
Evaluate Outcomes
As a school/district: How effectives is our core (benchmark) support? How effective is our supplemental (strategic) support? How effective is our intervention (intensive) support?
Benchmark data: Summary Report, Histograms, Cross-Year Box Plots, Summary of Effectiveness Reports, Distribution Report
Step 1: Identify Need for Support
What do you know?Are there students who may need additional instructional support to achieve benchmark goals?
How many students may need additional instructional support?
Which students may need additional instructional support?
What data to use?Histograms
Box Plots
Class Lists

Histograms
Summarizes the distribution of scores of all children in a grade within a school or district relative to the progressive benchmark goal for the time.
Student performance is depicted in 3 categories according to students who have met benchmarks, making progress toward benchmarks, or are seriously below benchmarks
Yearly Box Plot
Summarize the distribution of performance in a class at a single point in time. The box depicts the range of scores for a school or district relative to the benchmark.

Practice Activity
Blue Partner: Review Histograms and Box Plot Samples for 1st grade. Be prepared to report out the following:
What do you know from the data?
What are the implications for curriculum and instruction, professional development and teacher support?

Class List & Grade List Reports
Provide information on individual students at a given assessment period.
3 types of reports
Need for Support
District Percentile
National DIBELS Data System Percentile
How do we get to them on the website?
Class List: Need for Support
Need for Support recommendations are provided for individual measures and the DIBELS Next Composite Score.
Class List: District Percentile
Calculated based on the scores of students in your district's DIBELS Data System account during the selected year.
Class List: National DIBELS Data System
PercentileCalculated based on student scores from the Sentinel Schools Project conducted by the Center on Teaching and Learning at the University of Oregon during 2010-2011 school year.

Highlight Reports?

Class Progress Summary
Student scores for one class over an academic year
Practice Activity
5 min. to analyze your own class list reports
What do we know from the data?
Which students may need additional support?
What current instructional recommendations do you have for students that are struggling?

Distribution Report
Disaggregated results by school, class, or demographics
Would need to add demographic information for each student through “edit class demographics” function.

Outcomes-Driven ModelODM Step
Questions Data
Identify Need
Are there students who may need support? How many? Which students?
Benchmark data: Histograms, Box Plots, Class List Report, Class Progress Summary, Distribution Report
Validate Need
Are we confident that the indentified students need support?
Benchmark data and additional information: Repeat assessment, use additional data, knowledge of/information about student
Plan Support
What level of support for which students? How to group students? What goals, specific skills, curriculum/program, instructional strategies?
Benchmark data and additional information: Individual student booklets, additional diagnostic information, knowledge of/information about student
Evaluate Support
Is the support effective for individual students?
Progress monitoring data: Individual student progress graphs, class progress graphs, student history report
Evaluate Outcomes
As a school/district: How effectives is our core (benchmark) support? How effective is our supplemental (strategic) support? How effective is our intervention (intensive) support?
Benchmark data: Summary Report, Histograms, Cross-Year Box Plots, Summary of Effectiveness Reports, Distribution Report

Step 2: Validate the Need for Support
What do you need to know?Are we reasonably confident the student needs instructional support?
Rule out any reasons for poor performance such as bad day, confused on directions, ill, shy, etc.
What data can you use?Repeat assessments using progress monitoring booklets
At least 2 more times, not on same day but within 1 week

Outcomes-Driven ModelODM Step
Questions Data
Identify Need
Are there students who may need support? How many? Which students?
Benchmark data: Histograms, Box Plots, Class List Report, Class Progress Summary, Distribution Report
Validate Need
Are we confident that the indentified students need support?
Benchmark data and additional information: Repeat assessment, use additional data, knowledge of/information about student
Plan Support
What level of support for which students? How to group students? What goals, specific skills, curriculum/program, instructional strategies?
Benchmark data and additional information: Individual student booklets, additional diagnostic information, knowledge of/information about student
Evaluate Support
Is the support effective for individual students?
Progress monitoring data: Individual student progress graphs, class progress graphs, student history report
Evaluate Outcomes
As a school/district: How effectives is our core (benchmark) support? How effective is our supplemental (strategic) support? How effective is our intervention (intensive) support?
Benchmark data: Summary Report, Histograms, Cross-Year Box Plots, Summary of Effectiveness Reports, Distribution Report

Step 3: Plan for Support
Decisions/Questions
What are the goals of instruction?
How much instruction support is needed?
How will children be grouped for support?
What specific skills should we teach?
What instructional curriculum/program to use?
What specific instructional strategies to use?
Big Ideas & Instructional Goals
Instructional goals should be guided by the five Big Ideas:
Phonemic Awareness
Alphabetic Principal (Phonics)
Accuracy and Fluency with Connected Text (Fluency)
Vocabulary
Reading Comprehension

Considerations in Planning Instruction
Think about what DIBELS results indicate…
Are my students on track? What do I need to target for my instruction?
Look at student booklets/patterns of errors for additional direction.
Example 1: Are students not reaching benchmark on NWF because they don’t know letter-sound correspondences or because they are not blending sounds together?
Example 2: Are students not reaching benchmark on ORF because they are accurate but not fluent OR because they have low fluency?

Try it out… (green partner)
Kindergarten Classroom
Spring
50% at benchmark on PSF and NWF
Goal???

Try it out… (green partner)
First-Grade Classroom
80% at benchmark on ORF, 40% on NWF
Goal???
Try it out… (green partner)
Second Grade Classroom
Fall
90% benchmark on NWF, 40% benchmark on ORF
Goal???

Try it out… (green partner)
Third Grade Classroom
95% benchmark on ORF, 45% benchmark on DAZE
Goal???
How much instructional support?
What level of support is needed to change your student’s reading trajectory?
Double dose of reading instruction?
Before/after school tutoring?
Preteach/reteach?
Different materials?
What factors can YOU alter to meet your students needs?
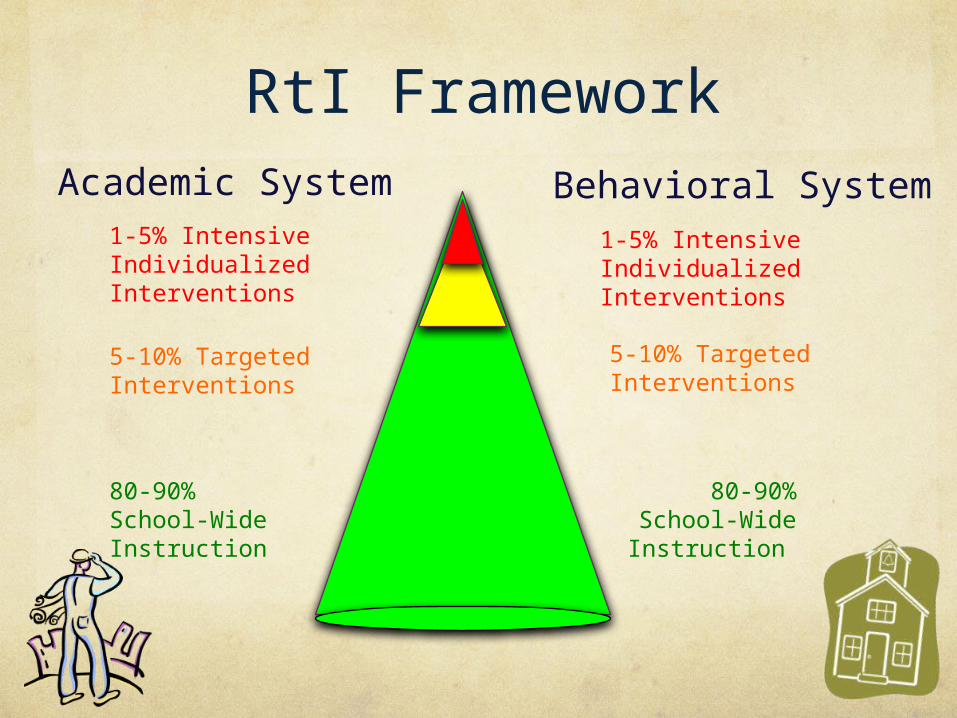
RtI FrameworkAcademic System
1-5% Intensive Individualized Interventions
5-10% Targeted Interventions
5-10% Targeted Interventions
1-5% Intensive Individualized Interventions
80-90% School-Wide Instruction
80-90% School-Wide Instruction
Behavioral System

How will students be groups for instruction?
Students with same composite score or overall instructional recommendation DO NOT necessarily have the same instructional needs.
Students who have scores within the same range on a measure DO NOT necessarily have the same instructional needs.
Grouping Students
Analyze student performance across all measures
Group students with similar instructional needs
Its important to consider how each DIBELS Measure relates to the BIG Ideas of reading instruction and to each other

Considerations for Groupings
You MUST look at the scoring protocol – a number is NOT enough information for grouping purposes
Ask yourselfIs the student accurate but slow?
How accurate?
Are there any error patterns?
Is a problem fluency-based?
Is the student making multiple errors and performing at a slow pace?

Considerations for Groupings
Are additional diagnostic assessments, placement tests, and/or work samples needed?
What student factors do I need to consider? (behavioral needs, attendance, etc)
What personnel resources do I have an what does my schedule/time allotment for instruction look like?

Grouping Worksheets
Sample 1st grade
http://esu6-readingnews.wikispaces.com/

Practice Activity
Choose one of your class list reports (or Class Progress Summary) and look for students that will have similar skills needs.
See if you can think through some students that may be in the same groups.

Planning Support
DIBELS may be used to identify general area(s) in need of instruction (e.g., alphabetic principle)
Additional data may be needed for making decisions about which particular skills within a big idea that you should target (e.g., short u and e)

Diagnostics?
For specific skill level use:Error analysis of DIBELS
Knowledge of student performance in class
Program assessments
Supplementary assessments
The primary questions are:What can the child do?
What specific skills does the child need?
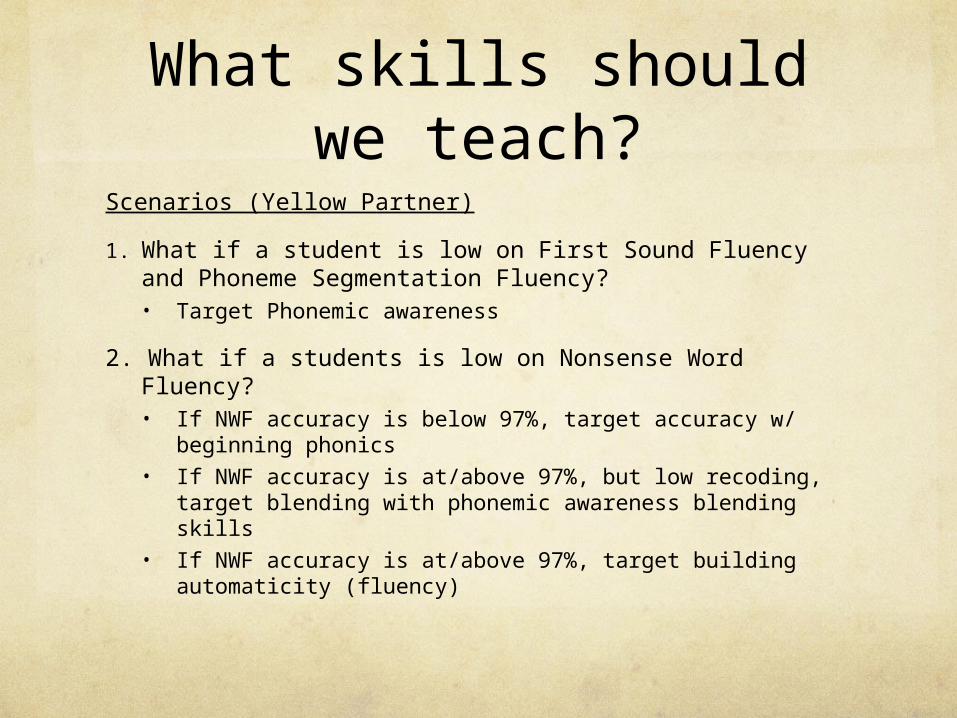
What skills should we teach?
Scenarios (Yellow Partner)
1. What if a student is low on First Sound Fluency and Phoneme Segmentation Fluency?• Target Phonemic awareness
2. What if a students is low on Nonsense Word Fluency?• If NWF accuracy is below 97%, target accuracy w/
beginning phonics• If NWF accuracy is at/above 97%, but low recoding,
target blending with phonemic awareness blending skills
• If NWF accuracy is at/above 97%, target building automaticity (fluency)
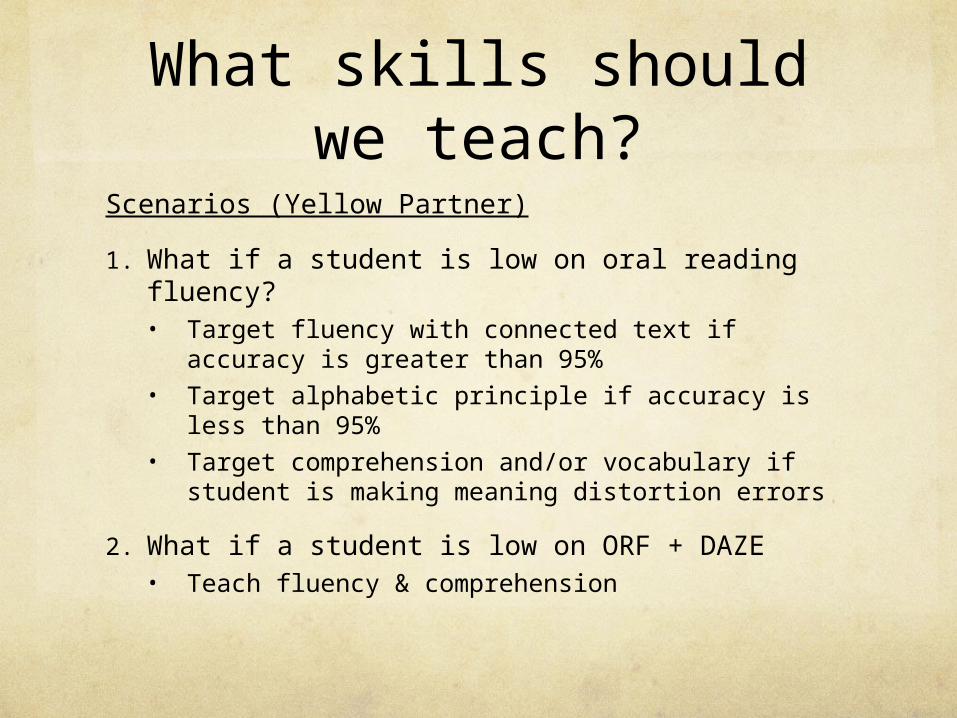
What skills should we teach?
Scenarios (Yellow Partner)
1. What if a student is low on oral reading fluency?• Target fluency with connected text if accuracy is
greater than 95%• Target alphabetic principle if accuracy is less than
95%• Target comprehension and/or vocabulary if
student is making meaning distortion errors
2. What if a student is low on ORF + DAZE• Teach fluency & comprehension
Practice Activity
Identify 2 students on your class list
Determine what they need for instructional support
Share out with shoulder partner

Outcomes-Driven ModelODM Step
Questions Data
Identify Need
Are there students who may need support? How many? Which students?
Benchmark data: Histograms, Box Plots, Class List Report, Class Progress Summary, Distribution Report
Validate Need
Are we confident that the indentified students need support?
Benchmark data and additional information: Repeat assessment, use additional data, knowledge of/information about student
Plan Support
What level of support for which students? How to group students? What goals, specific skills, curriculum/program, instructional strategies?
Benchmark data and additional information: Individual student booklets, additional diagnostic information, knowledge of/information about student
Evaluate Support
Is the support effective for individual students?
Progress monitoring data: Individual student progress graphs, class progress graphs, student history report
Evaluate Outcomes
As a school/district: How effectives is our core (benchmark) support? How effective is our supplemental (strategic) support? How effective is our intervention (intensive) support?
Benchmark data: Summary Report, Histograms, Cross-Year Box Plots, Summary of Effectiveness Reports, Distribution Report

Step 4: Evaluate & Modify Support
What do you need to know?
Is the additional instructional support effective in getting the students on track to achieve the next benchmark goal?
What data can you use?
Progress Monitoring Booklets or Graphs
Individual Student Performance Profiles (not ready yet)
Class Progress Graph
DIBELS PM Graphs
Review a Sample Graph
What advantage do you have for using their aimline?
What disadvantage do you have for using their aimline?
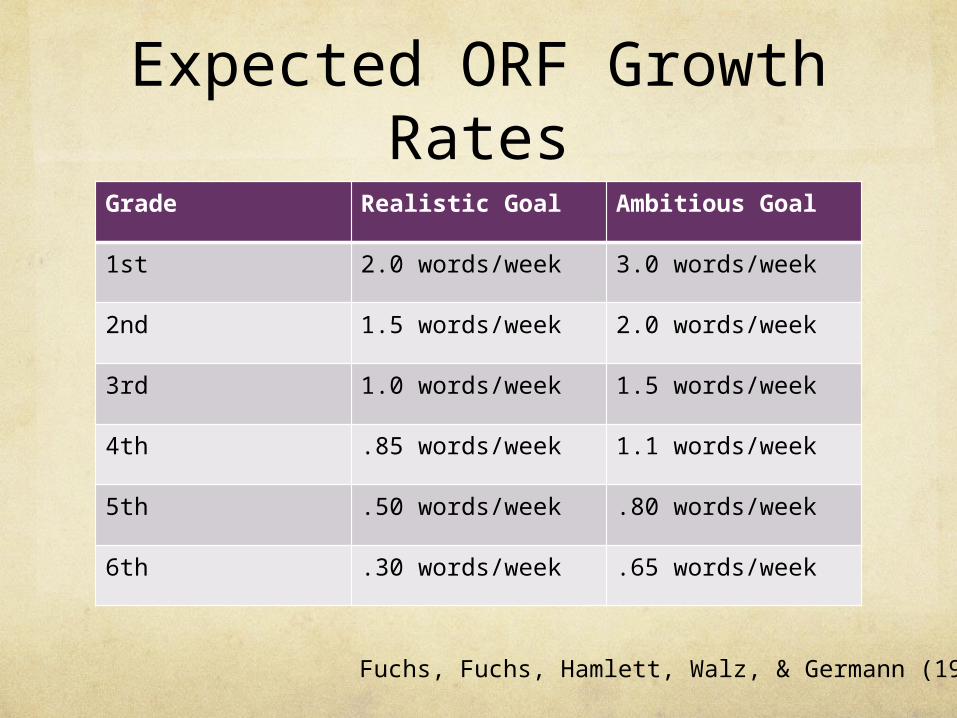
Expected ORF Growth Rates
Grade Realistic Goal Ambitious Goal
1st 2.0 words/week 3.0 words/week
2nd 1.5 words/week 2.0 words/week
3rd 1.0 words/week 1.5 words/week
4th .85 words/week 1.1 words/week
5th .50 words/week .80 words/week
6th .30 words/week .65 words/week
Fuchs, Fuchs, Hamlett, Walz, & Germann (1993)

Growth Rates for NWF & PSF
No scientific guidelines on ambitious growth rates for NWF or PSF at this time
Tentative Guidelines:PSF – 2-3 segments/week
NWF – 2-3 letter sounds/week

Individual Student Problem Solving AgendaApril’s Sample Agenda

Class Progress Graph
Student scores for one class and measure, graphed over time.
Look at the class progress graph you brought.
How would this report provide you with information about individual students?
Student History Report
Brown Partner: Look at Student History Report
What does this report tell you?
How might it be helpful in evaluating support provided?
Outcomes-Driven ModelODM Step
Questions Data
Identify Need
Are there students who may need support? How many? Which students?
Benchmark data: Histograms, Box Plots, Class List Report, Class Progress Summary, Distribution Report
Validate Need
Are we confident that the indentified students need support?
Benchmark data and additional information: Repeat assessment, use additional data, knowledge of/information about student
Plan Support
What level of support for which students? How to group students? What goals, specific skills, curriculum/program, instructional strategies?
Benchmark data and additional information: Individual student booklets, additional diagnostic information, knowledge of/information about student
Evaluate Support
Is the support effective for individual students?
Progress monitoring data: Individual student progress graphs, class progress graphs, student history report
Evaluate Outcomes
As a school/district: How effectives is our core (benchmark) support? How effective is our supplemental (strategic) support? How effective is our intervention (intensive) support?
Benchmark data: Summary Report, Histograms, Cross-Year Box Plots, Summary of Effectiveness Reports, Distribution Report

Review Systems Level Outcomes
What do we need to know?
How is the curriculum/program working?
Who is the curriculum/program working for?
Are we doing better this year than last year?
What data can you use?
Summary Report
Histograms
Cross-Year Box Plots
Summary of Effectiveness Reports
Summary Report
Means and progress over time by school or district
5 min. to analyze your own report. Ask yourself:
What does the data tell you?
Why might this be happening?
What do we need to do about it?

Histograms
Summarizes the distribution of scores of all children in a grade within a school or district relative to the progressive benchmark goal for the time.
Student performance is depicted in 3 categories according to students who have met benchmarks, making progress toward benchmarks, or are seriously below benchmarks
Compare Histograms during beginning, middle, and end of the year.
Cross-Year Box Plots
Distribution of benchmark scores by measure across multiple assessment periods and years.
Orange Partner: Look at the sample cross-year box plot.
What does the data tell us?
What do we need to do about it?
Summary of Effectiveness Reports
Progress of students by Composite Score or Instructional Recommendation over time.
Helps us determine 3 things:1. How effective is our core instruction?
2. How effective is our strategic instruction?
3. How effective is our intervention instruction?

How effective is our core instruction?
Core Program is effective if it:Meets the needs of 80% of all students in the school.
Supports 95-100% of benchmark students to make adequate progress and achieve the benchmark.

How effective is our supplemental support?
Supplemental Program is effective if it:Meets the need of 5-10% of students that need supplemental instruction.
Supports 80-100% of strategic students to achieve the benchmark goal.

How effective is ourintervention support?
Core Program is effective if it:Meets the needs of 5% of students in the school that need intensive instruction.
Supports 80%-100% of intensive students to reduce the risk of reading difficulty to strategic or achieve the benchmark goal.

What is adequate progress?
Benchmark StudentsEffective core instruction should:
Support 95% of benchmark students to maintain benchmark.
Strategic StudentsEffective supplemental support should:
Support 80% of strategic students to achieve benchmark
Intensive StudentsEffective interventions should:
Support 80% of intensive students to achieve strategic or benchmark benchmark
Partner Activity
Purple PartnerLook at Summary of effectiveness sample report
Determine the effectiveness of:Core Instruction
Supplemental Instruction
Intervention Instruction
What else did you notice?

Outcomes-Driven ModelODM Step
Questions Data
Identify Need
Are there students who may need support? How many? Which students?
Benchmark data: Histograms, Box Plots, Class List Report, Class Progress Summary, Distribution Report
Validate Need
Are we confident that the indentified students need support?
Benchmark data and additional information: Repeat assessment, use additional data, knowledge of/information about student
Plan Support
What level of support for which students? How to group students? What goals, specific skills, curriculum/program, instructional strategies?
Benchmark data and additional information: Individual student booklets, additional diagnostic information, knowledge of/information about student
Evaluate Support
Is the support effective for individual students?
Progress monitoring data: Individual student progress graphs, class progress graphs, student history report
Evaluate Outcomes
As a school/district: How effectives is our core (benchmark) support? How effective is our supplemental (strategic) support? How effective is our intervention (intensive) support?
Benchmark data: Summary Report, Histograms, Cross-Year Box Plots, Summary of Effectiveness Reports, Distribution Report
What information do you plan to share with your district?

Thank you!Evaluation at www.esu6pdsurveys.wikispaces.com