Embed Size (px)
Citation preview
DIC Report 2018Financial Section Year ended December 31, 2017
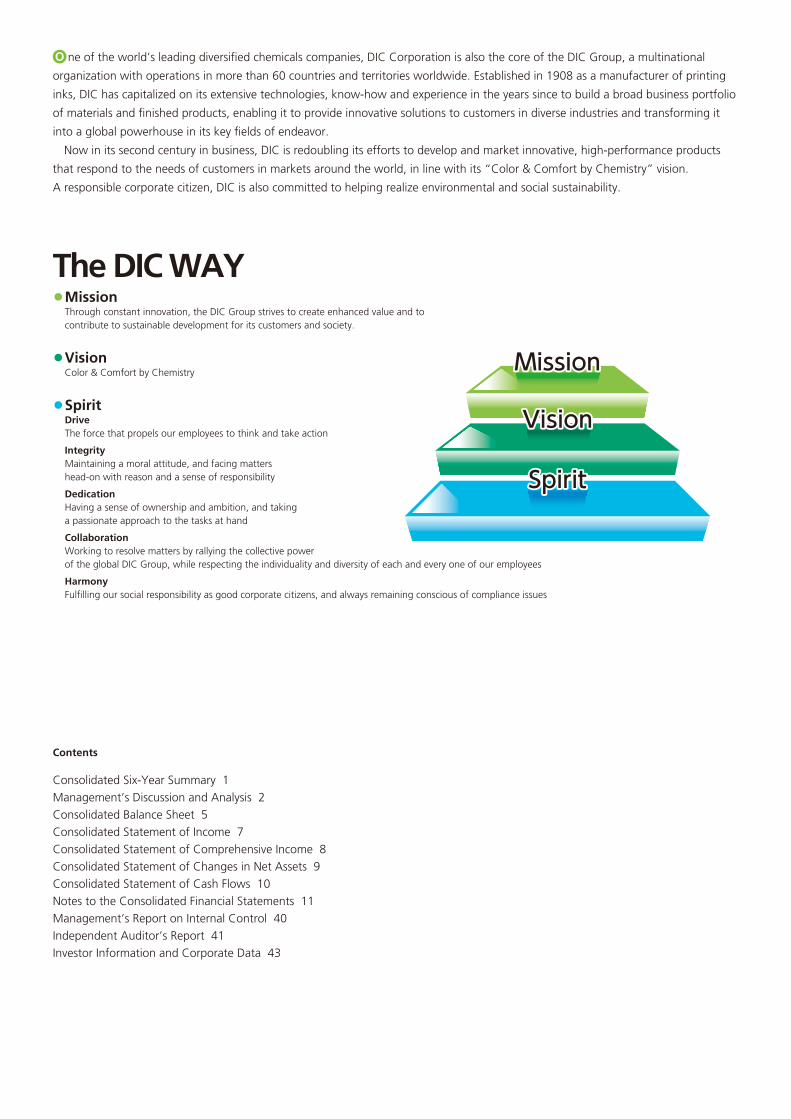
• Mission Through constant innovation, the DIC Group strives to create enhanced value and to
contribute to sustainable development for its customers and society.
• Vision Color & Comfort by Chemistry
• Spirit Drive The force that propels our employees to think and take action
Integrity Maintaining a moral attitude, and facing matters
head-on with reason and a sense of responsibility
Dedication Having a sense of ownership and ambition, and taking
a passionate approach to the tasks at hand
Collaboration Working to resolve matters by rallying the collective power
of the global DIC Group, while respecting the individuality and diversity of each and every one of our employees
Harmony Fulfi lling our social responsibility as good corporate citizens, and always remaining conscious of compliance issues
The DIC WAY
ne of the world’s leading diversifi ed chemicals companies, DIC Corporation is also the core of the DIC Group, a multinational
organization with operations in more than 60 countries and territories worldwide. Established in 1908 as a manufacturer of printing
inks, DIC has capitalized on its extensive technologies, know-how and experience in the years since to build a broad business portfolio
of materials and fi nished products, enabling it to provide innovative solutions to customers in diverse industries and transforming it
into a global powerhouse in its key fi elds of endeavor.
Now in its second century in business, DIC is redoubling its efforts to develop and market innovative, high-performance products
that respond to the needs of customers in markets around the world, in line with its “Color & Comfort by Chemistry” vision.
A responsible corporate citizen, DIC is also committed to helping realize environmental and social sustainability.
O
Contents
Consolidated Six-Year Summary 1Management’s Discussion and Analysis 2Consolidated Balance Sheet 5Consolidated Statement of Income 7Consolidated Statement of Comprehensive Income 8Consolidated Statement of Changes in Net Assets 9Consolidated Statement of Cash Flows 10Notes to the Consolidated Financial Statements 11Management’s Report on Internal Control 40Independent Auditor’s Report 41Investor Information and Corporate Data 43
1 Consolidated Six-Year Summary
Millions of yen, except for per share information
Thousands of U.S. dollars,
except for per share information
(Note 8)Dec. 2017 Dec. 2016 Dec. 2015 Dec. 2014 Dec. 2013 Mar. 2013 Dec. 2017
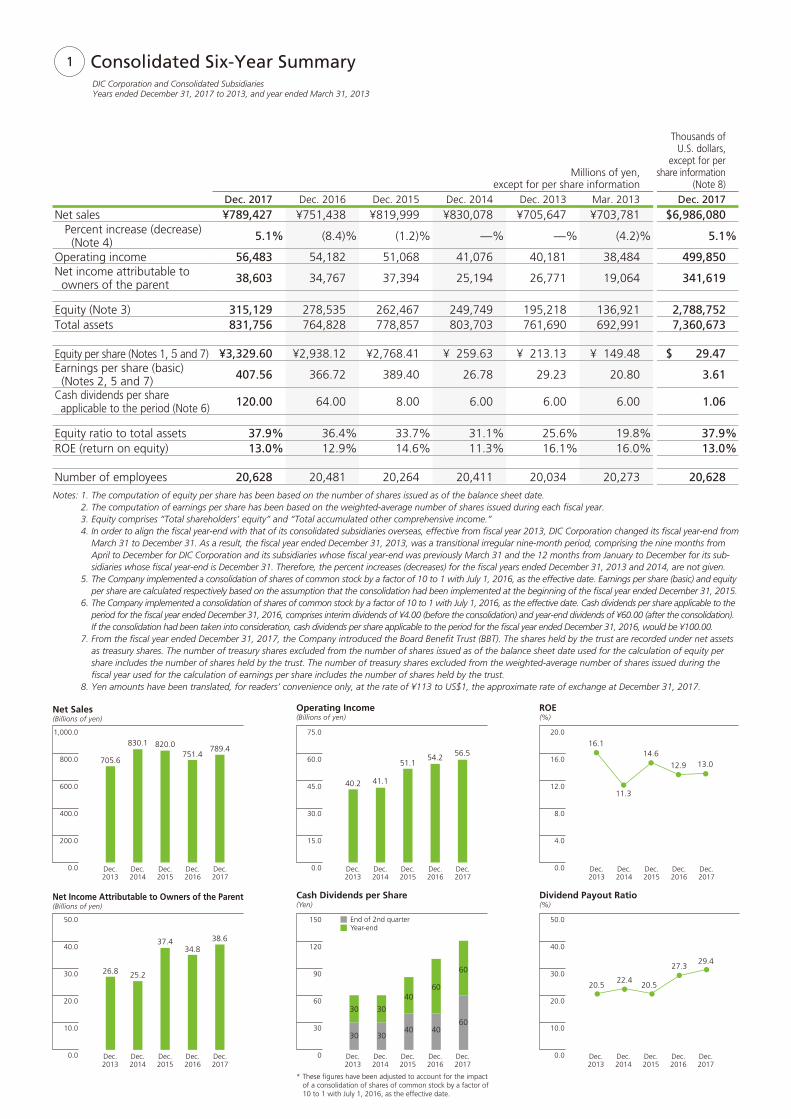
Net sales ¥789,427 ¥751,438 ¥819,999 ¥830,078 ¥705,647 ¥703,781 $6,986,080 Percent increase (decrease)
(Note 4) 5.1% (8.4)% (1.2)% —% —% (4.2)% 5.1%
Operating income 56,483 54,182 51,068 41,076 40,181 38,484 499,850Net income attributable to owners of the parent 38,603 34,767 37,394 25,194 26,771 19,064 341,619
Equity (Note 3) 315,129 278,535 262,467 249,749 195,218 136,921 2,788,752Total assets 831,756 764,828 778,857 803,703 761,690 692,991 7,360,673
Equity per share (Notes 1, 5 and 7) ¥3,329.60 ¥2,938.12 ¥2,768.41 ¥ 259.63 ¥ 213.13 ¥ 149.48 $ 29.47Earnings per share (basic) (Notes 2, 5 and 7) 407.56 366.72 389.40 26.78 29.23 20.80 3.61
Cash dividends per share applicable to the period (Note 6) 120.00 64.00 8.00 6.00 6.00 6.00 1.06
Equity ratio to total assets 37.9% 36.4% 33.7% 31.1% 25.6% 19.8% 37.9%ROE (return on equity) 13.0% 12.9% 14.6% 11.3% 16.1% 16.0% 13.0%
Number of employees 20,628 20,481 20,264 20,411 20,034 20,273 20,628
DIC Corporation and Consolidated SubsidiariesYears ended December 31, 2017 to 2013, and year ended March 31, 2013
(Billions of yen)Net Sales
(Billions of yen)Operating Income
(%)ROE
800.0
1,000.0
400.0
600.0
200.0
16.0
8.0
12.0
4.0
0.0
20.0
0.0
60.0
75.0
45.0
30.0
15.0
0.0
(Billions of yen)Net Income Attributable to Owners of the Parent
(Yen)Cash Dividends per Share
40.0
50.0
20.0
30.0
10.0
0.0
120
150
90
60
30
0
(%)Dividend Payout Ratio
40.0
50.0
30.0
20.0
10.0
0.0
End of 2nd quarterYear-end
* These figures have been adjusted to account for the impact of a consolidation of shares of common stock by a factor of 10 to 1 with July 1, 2016, as the effective date.
56.5
40.2 41.1
51.154.2
13.0
29.4
22.420.520.5
27.3
16.1
11.3
14.6
12.9
789.4
705.6
830.1 820.0751.4
Dec.2015
Dec.2013
Dec.2014
Dec.2017
Dec.2016
Dec.2015
Dec.2013
Dec.2014
Dec.2017
Dec.2016
Dec.2015
Dec.2013
Dec.2014
Dec.2017
Dec.2016
Dec.2015
Dec.2013
Dec.2014
Dec.2017
Dec.2016
Dec.2015
Dec.2013
Dec.2014
Dec.2017
Dec.2016
38.6
26.8 25.2
37.434.8
Dec.2015
Dec.2013
Dec.2014
Dec.2017
Dec.2016
60
30 3040 40
60
30 30
4060
Notes: 1. The computation of equity per share has been based on the number of shares issued as of the balance sheet date. 2. The computation of earnings per share has been based on the weighted-average number of shares issued during each fi scal year. 3. Equity comprises “Total shareholders’ equity” and “Total accumulated other comprehensive income.” 4. In order to align the fi scal year-end with that of its consolidated subsidiaries overseas, effective from fi scal year 2013, DIC Corporation changed its fi scal year-end from
March 31 to December 31. As a result, the fi scal year ended December 31, 2013, was a transitional irregular nine-month period, comprising the nine months from April to December for DIC Corporation and its subsidiaries whose fi scal year-end was previously March 31 and the 12 months from January to December for its sub-sidiaries whose fi scal year-end is December 31. Therefore, the percent increases (decreases) for the fi scal years ended December 31, 2013 and 2014, are not given.
5. The Company implemented a consolidation of shares of common stock by a factor of 10 to 1 with July 1, 2016, as the effective date. Earnings per share (basic) and equity per share are calculated respectively based on the assumption that the consolidation had been implemented at the beginning of the fi scal year ended December 31, 2015.
6. The Company implemented a consolidation of shares of common stock by a factor of 10 to 1 with July 1, 2016, as the effective date. Cash dividends per share applicable to the period for the fi scal year ended December 31, 2016, comprises interim dividends of ¥4.00 (before the consolidation) and year-end dividends of ¥60.00 (after the consolidation). If the consolidation had been taken into consideration, cash dividends per share applicable to the period for the fi scal year ended December 31, 2016, would be ¥100.00.
7. From the fi scal year ended December 31, 2017, the Company introduced the Board Benefi t Trust (BBT). The shares held by the trust are recorded under net assets as treasury shares. The number of treasury shares excluded from the number of shares issued as of the balance sheet date used for the calculation of equity per share includes the number of shares held by the trust. The number of treasury shares excluded from the weighted-average number of shares issued during the fi scal year used for the calculation of earnings per share includes the number of shares held by the trust.
8. Yen amounts have been translated, for readers’ convenience only, at the rate of ¥113 to US$1, the approximate rate of exchange at December 31, 2017.
2
This document presents consolidated results for fi scal year 2017, comprising the accounts for the year ended De-cember 31, 2017, of DIC and its domestic and overseas subsidiaries.
While economic conditions worldwide recovered gradually in fi scal year 2017, ended December 31, 2017,
economic uncertainty, fl uctuations in the fi nancial and capital markets and the direction of oil prices, among
others, continued to warrant caution. Moderate recovery persisted in the economies of North America and
Europe. A revival was seen in Asia. Japan’s economy also continued to rally steadily.
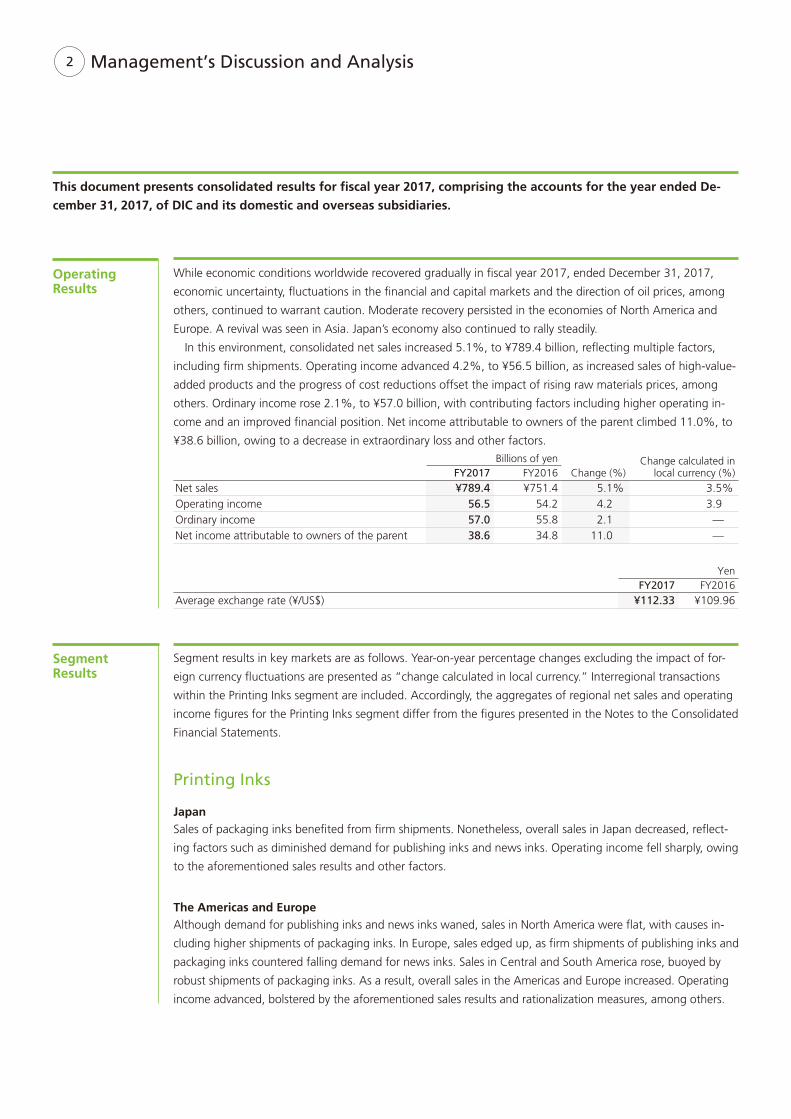
In this environment, consolidated net sales increased 5.1%, to ¥789.4 billion, refl ecting multiple factors,
including fi rm shipments. Operating income advanced 4.2%, to ¥56.5 billion, as increased sales of high-value-
added products and the progress of cost reductions offset the impact of rising raw materials prices, among
others. Ordinary income rose 2.1%, to ¥57.0 billion, with contributing factors including higher operating in-
come and an improved fi nancial position. Net income attributable to owners of the parent climbed 11.0%, to
¥38.6 billion, owing to a decrease in extraordinary loss and other factors.
Billions of yenChange (%)
Change calculated in local currency (%)FY2017 FY2016
Net sales ¥789.4 ¥751.4 5.1% 3.5%Operating income 56.5 54.2 4.2 3.9Ordinary income 57.0 55.8 2.1 —Net income attributable to owners of the parent 38.6 34.8 11.0 —
YenFY2017 FY2016
Average exchange rate (¥/US$) ¥112.33 ¥109.96
Operating Results
Management’s Discussion and Analysis
Segment Results
Segment results in key markets are as follows. Year-on-year percentage changes excluding the impact of for-
eign currency fl uctuations are presented as “change calculated in local currency.” Interregional transactions
within the Printing Inks segment are included. Accordingly, the aggregates of regional net sales and operating
income fi gures for the Printing Inks segment differ from the fi gures presented in the Notes to the Consolidated
Financial Statements.
Printing Inks
JapanSales of packaging inks benefi ted from fi rm shipments. Nonetheless, overall sales in Japan decreased, refl ect-
ing factors such as diminished demand for publishing inks and news inks. Operating income fell sharply, owing
to the aforementioned sales results and other factors.
The Americas and EuropeAlthough demand for publishing inks and news inks waned, sales in North America were fl at, with causes in-
cluding higher shipments of packaging inks. In Europe, sales edged up, as fi rm shipments of publishing inks and
packaging inks countered falling demand for news inks. Sales in Central and South America rose, buoyed by
robust shipments of packaging inks. As a result, overall sales in the Americas and Europe increased. Operating
income advanced, bolstered by the aforementioned sales results and rationalization measures, among others.
3
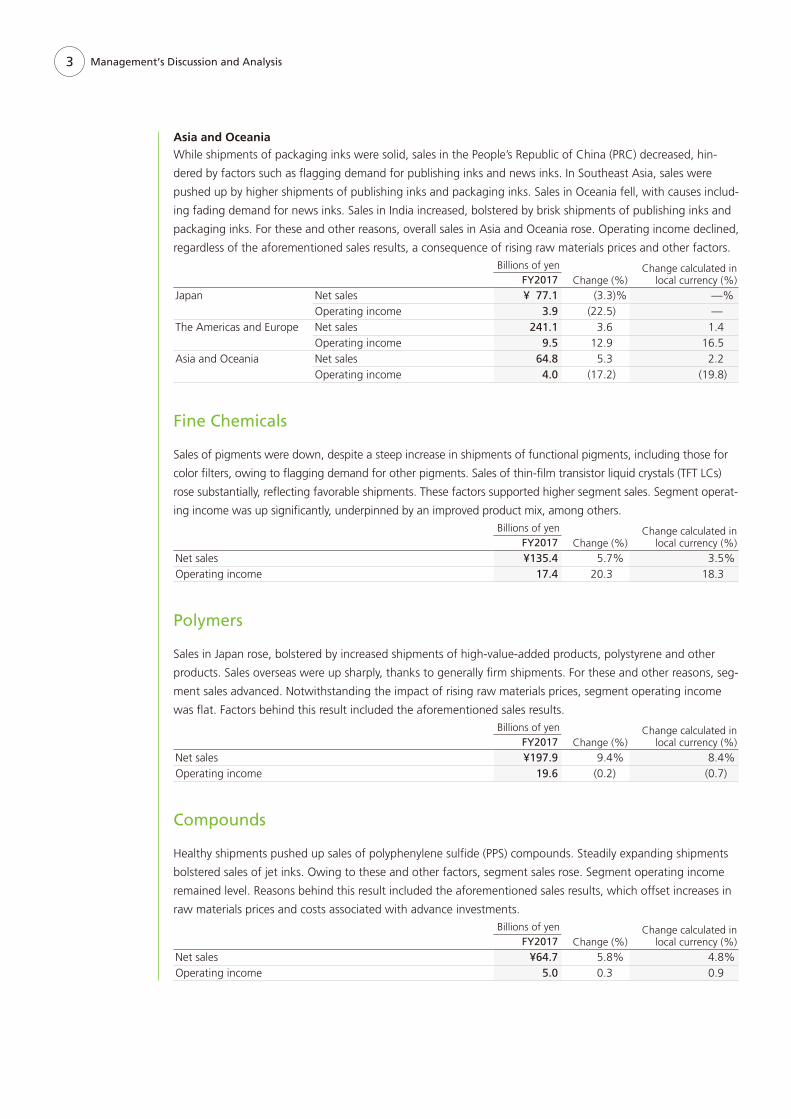
Asia and OceaniaWhile shipments of packaging inks were solid, sales in the People’s Republic of China (PRC) decreased, hin-
dered by factors such as fl agging demand for publishing inks and news inks. In Southeast Asia, sales were
pushed up by higher shipments of publishing inks and packaging inks. Sales in Oceania fell, with causes includ-
ing fading demand for news inks. Sales in India increased, bolstered by brisk shipments of publishing inks and
packaging inks. For these and other reasons, overall sales in Asia and Oceania rose. Operating income declined,
regardless of the aforementioned sales results, a consequence of rising raw materials prices and other factors.Billions of yen
Change (%)Change calculated in
local currency (%)FY2017Japan Net sales ¥ 77.1 (3.3)% —%
Operating income 3.9 (22.5) —The Americas and Europe Net sales 241.1 3.6 1.4
Operating income 9.5 12.9 16.5Asia and Oceania Net sales 64.8 5.3 2.2
Operating income 4.0 (17.2) (19.8)
Fine Chemicals
Sales of pigments were down, despite a steep increase in shipments of functional pigments, including those for
color fi lters, owing to fl agging demand for other pigments. Sales of thin-fi lm transistor liquid crystals (TFT LCs)
rose substantially, refl ecting favorable shipments. These factors supported higher segment sales. Segment operat-
ing income was up signifi cantly, underpinned by an improved product mix, among others.Billions of yen
Change (%)Change calculated in
local currency (%)FY2017Net sales ¥135.4 5.7% 3.5%Operating income 17.4 20.3 18.3
Polymers
Sales in Japan rose, bolstered by increased shipments of high-value-added products, polystyrene and other
products. Sales overseas were up sharply, thanks to generally fi rm shipments. For these and other reasons, seg-
ment sales advanced. Notwithstanding the impact of rising raw materials prices, segment operating income
was fl at. Factors behind this result included the aforementioned sales results.Billions of yen
Change (%)Change calculated in
local currency (%)FY2017Net sales ¥197.9 9.4% 8.4%Operating income 19.6 (0.2) (0.7)
Compounds
Healthy shipments pushed up sales of polyphenylene sulfi de (PPS) compounds. Steadily expanding shipments
bolstered sales of jet inks. Owing to these and other factors, segment sales rose. Segment operating income
remained level. Reasons behind this result included the aforementioned sales results, which offset increases in
raw materials prices and costs associated with advance investments.Billions of yen
Change (%)Change calculated in
local currency (%)FY2017Net sales ¥64.7 5.8% 4.8%Operating income 5.0 0.3 0.9
Management’s Discussion and Analysis
4
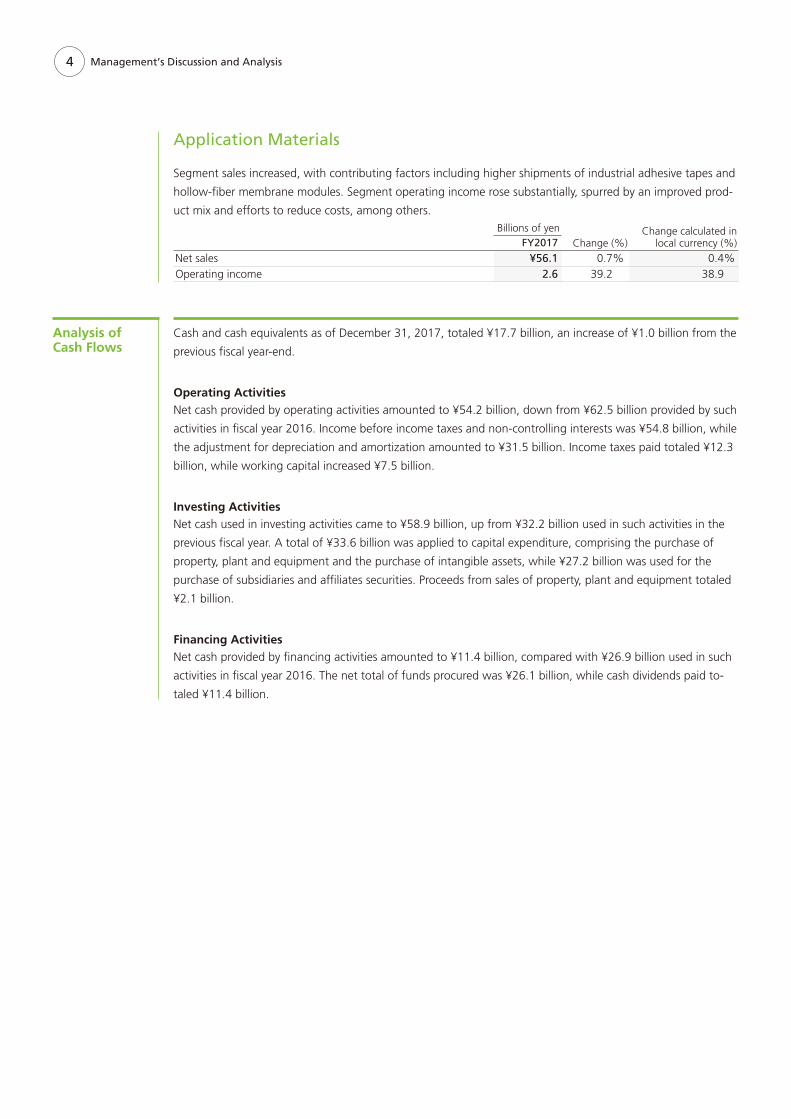
Cash and cash equivalents as of December 31, 2017, totaled ¥17.7 billion, an increase of ¥1.0 billion from the
previous fi scal year-end.
Operating ActivitiesNet cash provided by operating activities amounted to ¥54.2 billion, down from ¥62.5 billion provided by such
activities in fi scal year 2016. Income before income taxes and non-controlling interests was ¥54.8 billion, while
the adjustment for depreciation and amortization amounted to ¥31.5 billion. Income taxes paid totaled ¥12.3
billion, while working capital increased ¥7.5 billion.
Investing ActivitiesNet cash used in investing activities came to ¥58.9 billion, up from ¥32.2 billion used in such activities in the
previous fi scal year. A total of ¥33.6 billion was applied to capital expenditure, comprising the purchase of
property, plant and equipment and the purchase of intangible assets, while ¥27.2 billion was used for the
purchase of subsidiaries and affi liates securities. Proceeds from sales of property, plant and equipment totaled
¥2.1 billion.
Financing ActivitiesNet cash provided by fi nancing activities amounted to ¥11.4 billion, compared with ¥26.9 billion used in such
activities in fi scal year 2016. The net total of funds procured was ¥26.1 billion, while cash dividends paid to-
taled ¥11.4 billion.
Analysis of Cash Flows
Management’s Discussion and Analysis
Application Materials
Segment sales increased, with contributing factors including higher shipments of industrial adhesive tapes and
hollow-fi ber membrane modules. Segment operating income rose substantially, spurred by an improved prod-
uct mix and efforts to reduce costs, among others.Billions of yen
Change (%)Change calculated in
local currency (%)FY2017Net sales ¥56.1 0.7% 0.4%Operating income 2.6 39.2 38.9
5
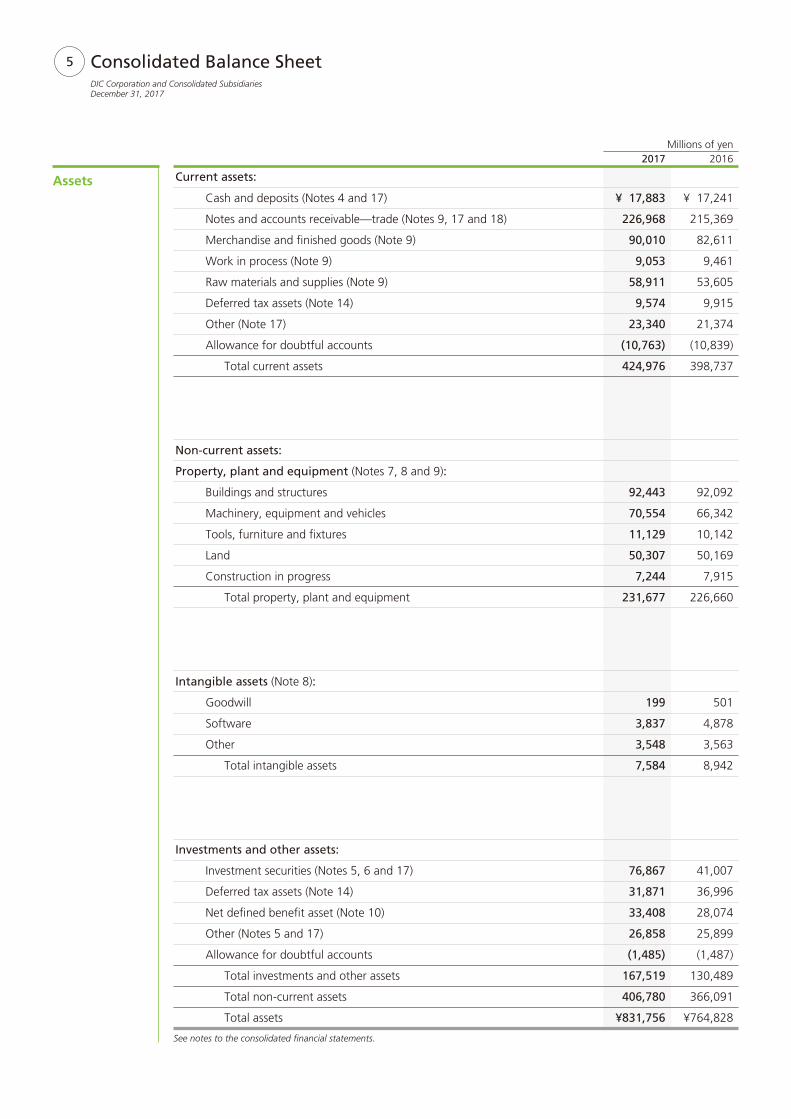
Assets
Millions of yen2017 2016
Current assets:
Cash and deposits (Notes 4 and 17) ¥ 17,883 ¥ 17,241
Notes and accounts receivable—trade (Notes 9, 17 and 18) 226,968 215,369
Merchandise and fi nished goods (Note 9) 90,010 82,611
Work in process (Note 9) 9,053 9,461
Raw materials and supplies (Note 9) 58,911 53,605
Deferred tax assets (Note 14) 9,574 9,915
Other (Note 17) 23,340 21,374
Allowance for doubtful accounts (10,763) (10,839)
Total current assets 424,976 398,737
Non-current assets:
Property, plant and equipment (Notes 7, 8 and 9):
Buildings and structures 92,443 92,092
Machinery, equipment and vehicles 70,554 66,342
Tools, furniture and fi xtures 11,129 10,142
Land 50,307 50,169
Construction in progress 7,244 7,915
Total property, plant and equipment 231,677 226,660
Intangible assets (Note 8):
Goodwill 199 501
Software 3,837 4,878
Other 3,548 3,563
Total intangible assets 7,584 8,942
Investments and other assets:
Investment securities (Notes 5, 6 and 17) 76,867 41,007
Deferred tax assets (Note 14) 31,871 36,996
Net defi ned benefi t asset (Note 10) 33,408 28,074
Other (Notes 5 and 17) 26,858 25,899
Allowance for doubtful accounts (1,485) (1,487)
Total investments and other assets 167,519 130,489
Total non-current assets 406,780 366,091
Total assets ¥831,756 ¥764,828
See notes to the consolidated fi nancial statements.
Consolidated Balance SheetDIC Corporation and Consolidated SubsidiariesDecember 31, 2017
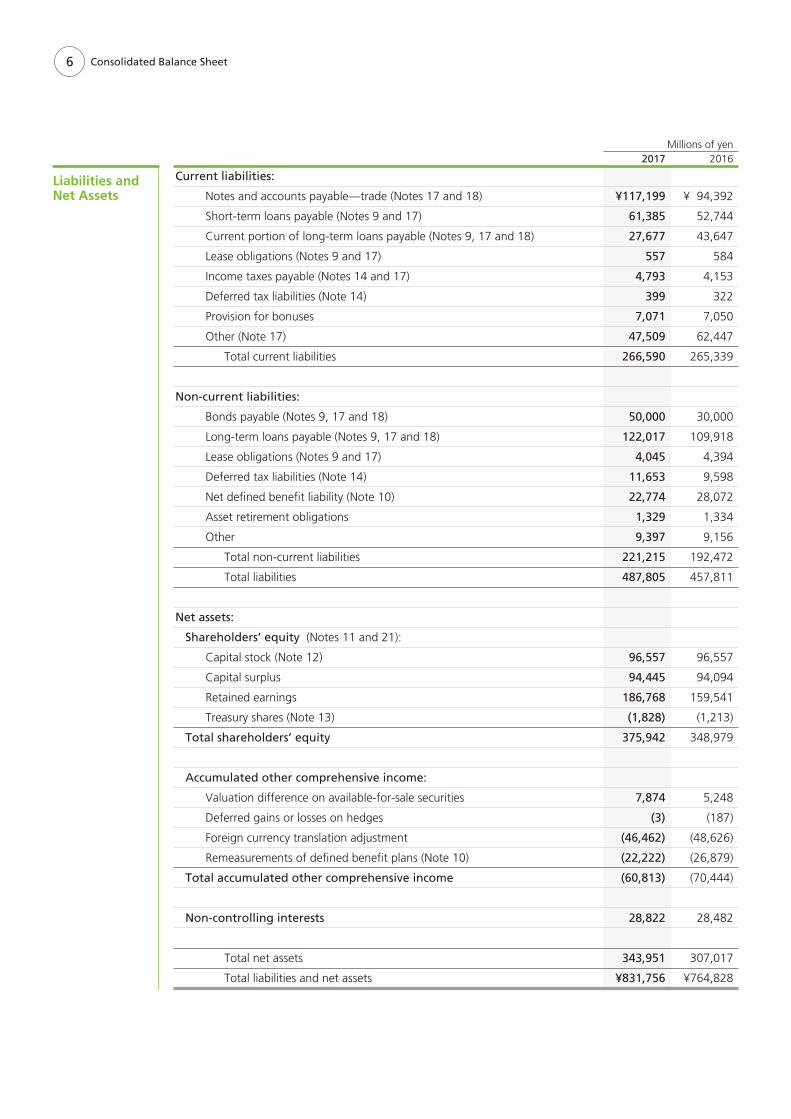
6
Liabilities and Net Assets
Millions of yen2017 2016
Current liabilities:
Notes and accounts payable—trade (Notes 17 and 18) ¥117,199 ¥ 94,392
Short-term loans payable (Notes 9 and 17) 61,385 52,744
Current portion of long-term loans payable (Notes 9, 17 and 18) 27,677 43,647
Lease obligations (Notes 9 and 17) 557 584
Income taxes payable (Notes 14 and 17) 4,793 4,153
Deferred tax liabilities (Note 14) 399 322
Provision for bonuses 7,071 7,050
Other (Note 17) 47,509 62,447
Total current liabilities 266,590 265,339
Non-current liabilities:
Bonds payable (Notes 9, 17 and 18) 50,000 30,000
Long-term loans payable (Notes 9, 17 and 18) 122,017 109,918
Lease obligations (Notes 9 and 17) 4,045 4,394
Deferred tax liabilities (Note 14) 11,653 9,598
Net defi ned benefi t liability (Note 10) 22,774 28,072
Asset retirement obligations 1,329 1,334
Other 9,397 9,156
Total non-current liabilities 221,215 192,472
Total liabilities 487,805 457,811
Net assets:
Shareholders’ equity (Notes 11 and 21):
Capital stock (Note 12) 96,557 96,557
Capital surplus 94,445 94,094
Retained earnings 186,768 159,541
Treasury shares (Note 13) (1,828) (1,213)
Total shareholders’ equity 375,942 348,979
Accumulated other comprehensive income:
Valuation difference on available-for-sale securities 7,874 5,248
Deferred gains or losses on hedges (3) (187)
Foreign currency translation adjustment (46,462) (48,626)
Remeasurements of defi ned benefi t plans (Note 10) (22,222) (26,879)
Total accumulated other comprehensive income (60,813) (70,444)
Non-controlling interests 28,822 28,482
Total net assets 343,951 307,017
Total liabilities and net assets ¥831,756 ¥764,828
Consolidated Balance Sheet
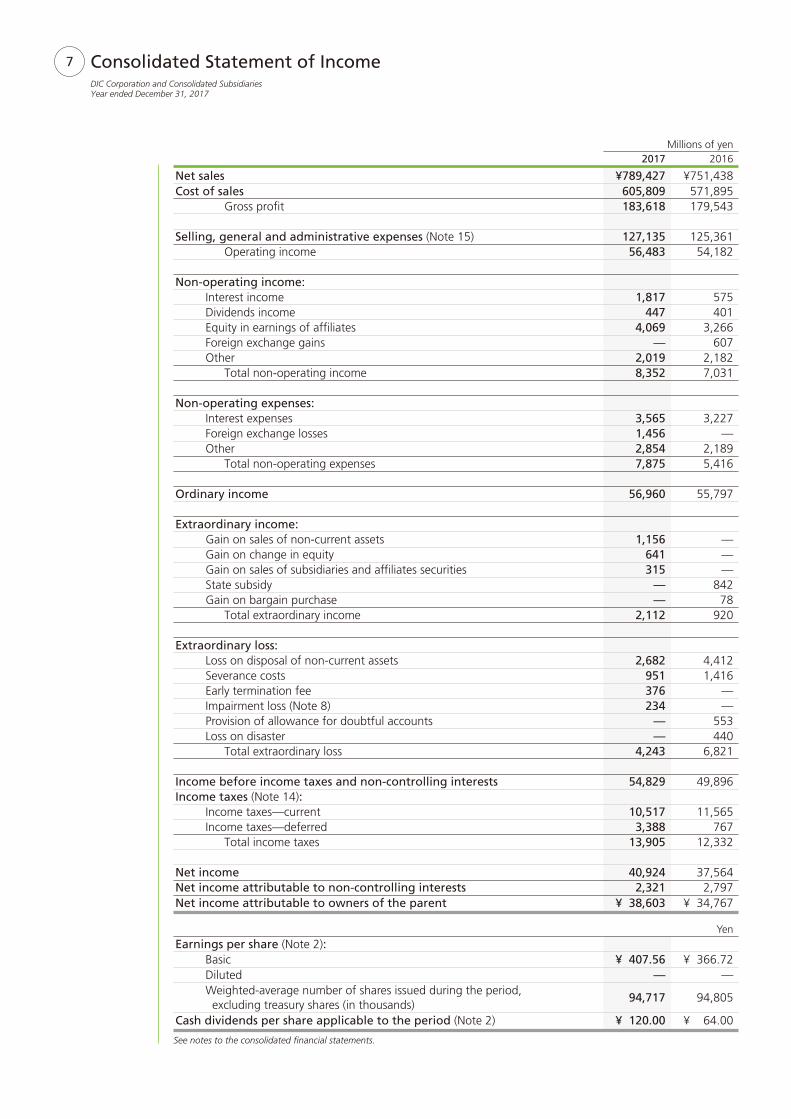
7
Millions of yen2017 2016
Net sales ¥789,427 ¥751,438 Cost of sales 605,809 571,895 Gross profi t 183,618 179,543
Selling, general and administrative expenses (Note 15) 127,135 125,361 Operating income 56,483 54,182
Non-operating income: Interest income 1,817 575 Dividends income 447 401 Equity in earnings of affi liates 4,069 3,266 Foreign exchange gains — 607 Other 2,019 2,182 Total non-operating income 8,352 7,031
Non-operating expenses: Interest expenses 3,565 3,227 Foreign exchange losses 1,456 — Other 2,854 2,189 Total non-operating expenses 7,875 5,416
Ordinary income 56,960 55,797
Extraordinary income: Gain on sales of non-current assets 1,156 — Gain on change in equity 641 — Gain on sales of subsidiaries and affi liates securities 315 — State subsidy — 842 Gain on bargain purchase — 78 Total extraordinary income 2,112 920
Extraordinary loss: Loss on disposal of non-current assets 2,682 4,412 Severance costs 951 1,416 Early termination fee 376 — Impairment loss (Note 8) 234 — Provision of allowance for doubtful accounts — 553 Loss on disaster — 440 Total extraordinary loss 4,243 6,821
Income before income taxes and non-controlling interests 54,829 49,896 Income taxes (Note 14): Income taxes—current 10,517 11,565 Income taxes—deferred 3,388 767 Total income taxes 13,905 12,332
Net income 40,924 37,564 Net income attributable to non-controlling interests 2,321 2,797 Net income attributable to owners of the parent ¥ 38,603 ¥ 34,767
YenEarnings per share (Note 2): Basic ¥ 407.56 ¥ 366.72 Diluted — — Weighted-average number of shares issued during the period,
excluding treasury shares (in thousands)94,717 94,805
Cash dividends per share applicable to the period (Note 2) ¥ 120.00 ¥ 64.00
See notes to the consolidated fi nancial statements.
Consolidated Statement of IncomeDIC Corporation and Consolidated Subsidiaries Year ended December 31, 2017
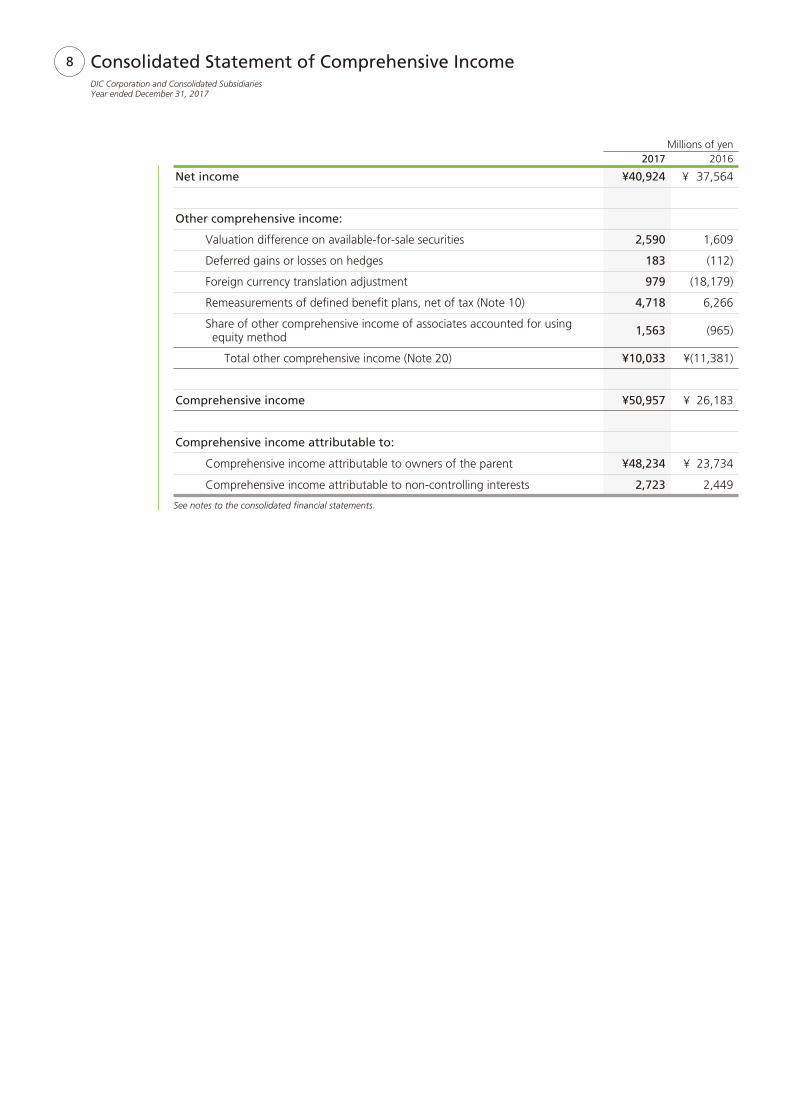
8
Millions of yen2017 2016
Net income ¥40,924 ¥ 37,564
Other comprehensive income:
Valuation difference on available-for-sale securities 2,590 1,609
Deferred gains or losses on hedges 183 (112)
Foreign currency translation adjustment 979 (18,179)
Remeasurements of defi ned benefi t plans, net of tax (Note 10) 4,718 6,266
Share of other comprehensive income of associates accounted for using equity method 1,563 (965)
Total other comprehensive income (Note 20) ¥10,033 ¥(11,381)
Comprehensive income ¥50,957 ¥ 26,183
Comprehensive income attributable to:
Comprehensive income attributable to owners of the parent ¥48,234 ¥ 23,734
Comprehensive income attributable to non-controlling interests 2,723 2,449
See notes to the consolidated fi nancial statements.
Consolidated Statement of Comprehensive IncomeDIC Corporation and Consolidated SubsidiariesYear ended December 31, 2017
9
Millions of yen
Shareholders’ equity
Issuednumber of
common stock (thousands)
Capital stock
Capital surplus
Retained earnings
Treasury shares
Total shareholders’
equity
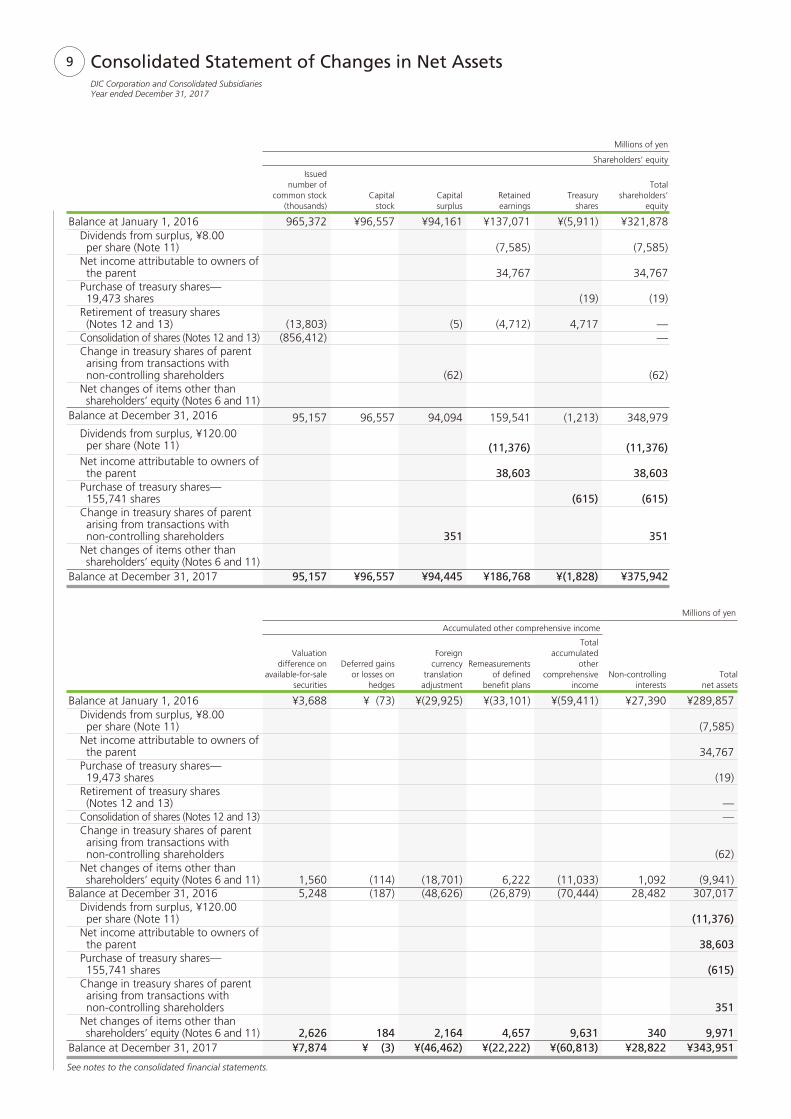
Balance at January 1, 2016 965,372 ¥96,557 ¥94,161 ¥137,071 ¥(5,911) ¥321,878Dividends from surplus, ¥8.00 per share (Note 11) (7,585) (7,585)Net income attributable to owners of the parent 34,767 34,767 Purchase of treasury shares— 19,473 shares (19) (19)Retirement of treasury shares (Notes 12 and 13) (13,803) (5) (4,712) 4,717 —Consolidation of shares (Notes 12 and 13) (856,412) —Change in treasury shares of parent arising from transactions with non-controlling shareholders (62) (62)Net changes of items other than shareholders’ equity (Notes 6 and 11)
Balance at December 31, 2016 95,157 96,557 94,094 159,541 (1,213) 348,979 Dividends from surplus, ¥120.00 per share (Note 11) (11,376) (11,376)Net income attributable to owners of the parent 38,603 38,603 Purchase of treasury shares— 155,741 shares (615) (615)Change in treasury shares of parent arising from transactions with non-controlling shareholders 351 351Net changes of items other than shareholders’ equity (Notes 6 and 11)
Balance at December 31, 2017 95,157 ¥96,557 ¥94,445 ¥186,768 ¥(1,828) ¥375,942
Millions of yen
Accumulated other comprehensive income
Valuation difference on
available-for-sale securities
Deferred gains or losses on
hedges
Foreign currency
translation adjustment
Remeasurements of defi ned
benefi t plans
Total accumulated
other comprehensive
incomeNon-controlling
interestsTotal
net assets
Balance at January 1, 2016 ¥3,688 ¥ (73) ¥(29,925) ¥(33,101) ¥(59,411) ¥27,390 ¥289,857 Dividends from surplus, ¥8.00 per share (Note 11) (7,585)Net income attributable to owners of the parent 34,767 Purchase of treasury shares— 19,473 shares (19)Retirement of treasury shares (Notes 12 and 13) —Consolidation of shares (Notes 12 and 13) —Change in treasury shares of parent arising from transactions with non-controlling shareholders (62)Net changes of items other than shareholders’ equity (Notes 6 and 11) 1,560 (114) (18,701) 6,222 (11,033) 1,092 (9,941)
Balance at December 31, 2016 5,248 (187) (48,626) (26,879) (70,444) 28,482 307,017 Dividends from surplus, ¥120.00 per share (Note 11) (11,376)Net income attributable to owners of the parent 38,603 Purchase of treasury shares— 155,741 shares (615)Change in treasury shares of parent arising from transactions with non-controlling shareholders 351 Net changes of items other than shareholders’ equity (Notes 6 and 11) 2,626 184 2,164 4,657 9,631 340 9,971
Balance at December 31, 2017 ¥7,874 ¥ (3) ¥(46,462) ¥(22,222) ¥(60,813) ¥28,822 ¥343,951
See notes to the consolidated fi nancial statements.
Consolidated Statement of Changes in Net AssetsDIC Corporation and Consolidated SubsidiariesYear ended December 31, 2017
10
Millions of yen2017 2016
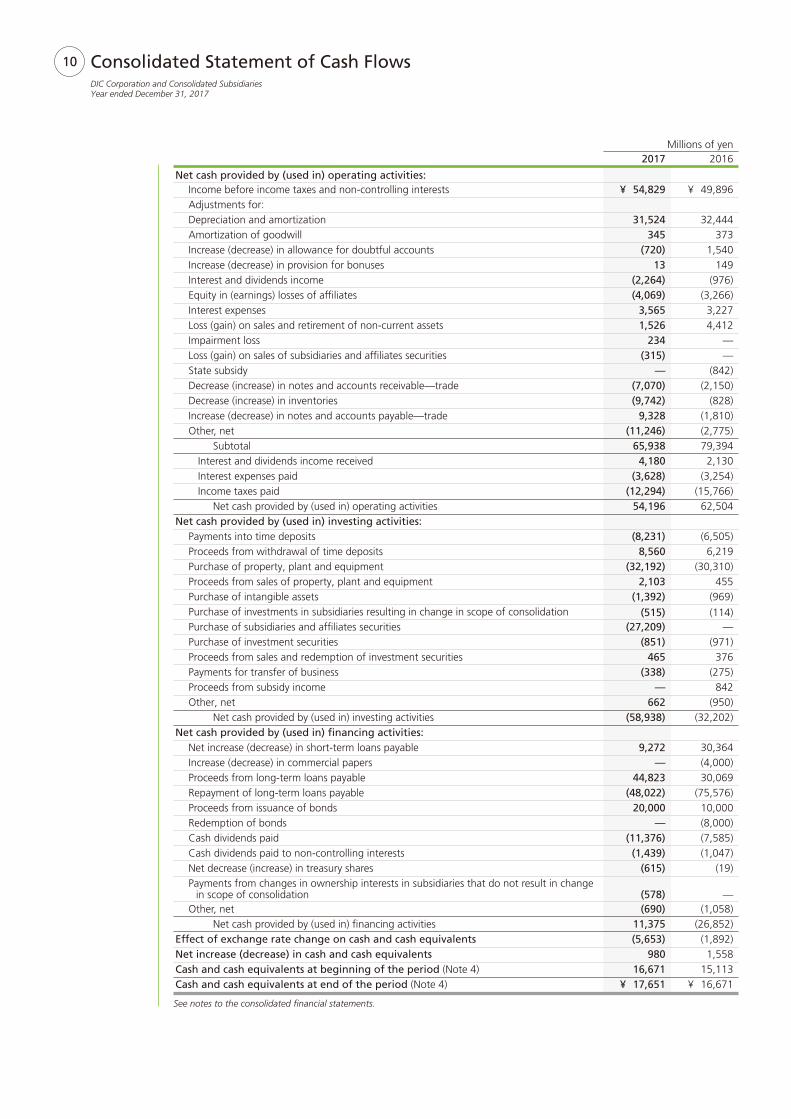
Net cash provided by (used in) operating activities: Income before income taxes and non-controlling interests ¥ 54,829 ¥ 49,896 Adjustments for: Depreciation and amortization 31,524 32,444 Amortization of goodwill 345 373 Increase (decrease) in allowance for doubtful accounts (720) 1,540 Increase (decrease) in provision for bonuses 13 149 Interest and dividends income (2,264) (976) Equity in (earnings) losses of affi liates (4,069) (3,266) Interest expenses 3,565 3,227 Loss (gain) on sales and retirement of non-current assets 1,526 4,412 Impairment loss 234 — Loss (gain) on sales of subsidiaries and affi liates securities (315) — State subsidy — (842) Decrease (increase) in notes and accounts receivable—trade (7,070) (2,150) Decrease (increase) in inventories (9,742) (828) Increase (decrease) in notes and accounts payable—trade 9,328 (1,810) Other, net (11,246) (2,775) Subtotal 65,938 79,394 Interest and dividends income received 4,180 2,130 Interest expenses paid (3,628) (3,254) Income taxes paid (12,294) (15,766) Net cash provided by (used in) operating activities 54,196 62,504 Net cash provided by (used in) investing activities: Payments into time deposits (8,231) (6,505) Proceeds from withdrawal of time deposits 8,560 6,219 Purchase of property, plant and equipment (32,192) (30,310) Proceeds from sales of property, plant and equipment 2,103 455 Purchase of intangible assets (1,392) (969) Purchase of investments in subsidiaries resulting in change in scope of consolidation (515) (114) Purchase of subsidiaries and affi liates securities (27,209) — Purchase of investment securities (851) (971) Proceeds from sales and redemption of investment securities 465 376 Payments for transfer of business (338) (275) Proceeds from subsidy income — 842 Other, net 662 (950) Net cash provided by (used in) investing activities (58,938) (32,202)Net cash provided by (used in) fi nancing activities: Net increase (decrease) in short-term loans payable 9,272 30,364 Increase (decrease) in commercial papers — (4,000) Proceeds from long-term loans payable 44,823 30,069 Repayment of long-term loans payable (48,022) (75,576) Proceeds from issuance of bonds 20,000 10,000 Redemption of bonds — (8,000) Cash dividends paid (11,376) (7,585) Cash dividends paid to non-controlling interests (1,439) (1,047) Net decrease (increase) in treasury shares (615) (19) Payments from changes in ownership interests in subsidiaries that do not result in change in scope of consolidation (578) — Other, net (690) (1,058) Net cash provided by (used in) fi nancing activities 11,375 (26,852)Effect of exchange rate change on cash and cash equivalents (5,653) (1,892)Net increase (decrease) in cash and cash equivalents 980 1,558 Cash and cash equivalents at beginning of the period (Note 4) 16,671 15,113 Cash and cash equivalents at end of the period (Note 4) ¥ 17,651 ¥ 16,671
See notes to the consolidated fi nancial statements.
Consolidated Statement of Cash FlowsDIC Corporation and Consolidated SubsidiariesYear ended December 31, 2017
11 Notes to the Consolidated Financial Statements
The accompanying consolidated fi nancial statements have been prepared in accordance with the provisions
set forth in the Japanese Financial Instruments and Exchange Act and its related accounting regulations, and
in accordance with accounting principles generally accepted in Japan (“Japanese GAAP”), which are different
in certain respects as to application and disclosure requirements of the International Financial Reporting Stan-
dards (“IFRS”).
In preparing these consolidated fi nancial statements, certain reclassifi cations and rearrangements have been
made to the consolidated fi nancial statements issued domestically in order to present them in a form which is
more familiar to readers outside Japan. The consolidated fi nancial statements are stated in Japanese yen, the
currency of the country in which DIC Corporation (the “Company”) is incorporated.
Note 1:
Basis of Presenting Financial Statements
Consolidated fi nancial statements
Under the control or infl uence concept, those companies in which the Company, directly or indirectly, is able to
exercise control over operations are fully consolidated and those companies over which the Company has the
ability to exercise signifi cant infl uence are accounted for by the equity method.
The consolidated fi nancial statements include the accounts of the Company and its signifi cant subsidiaries:
Sun Chemical Group Coöperatief U.A., DIC (China) Co., Ltd., DIC Asia Pacifi c Pte Ltd, SEIKO PMC CORPORA-
TION, DIC INVESTMENTS JAPAN, LLC., DIC Graphics Corporation and 138 other companies in the fi scal year
ended December 31, 2017 (144 other companies in the fi scal year ended December 31, 2016). All signifi -
cant intercompany balances and transactions have been eliminated in consolidation. All material unrealized
profi t included in assets resulting from transactions within the Company and its consolidated subsidiaries (the
“Group”) is eliminated.
Investments in 26 affi liates in the fi scal year ended December 31, 2017 (23 in the fi scal year ended Decem-
ber 31, 2016) are accounted for by the equity method.
Accounting period of consolidated subsidiaries
The closing date of the consolidated subsidiaries is the same as the consolidated closing date.
Cash and cash equivalents
Cash and cash equivalents consist primarily of cash on hand, certifi cates of deposit and short-term investments
with original maturities of three months or less that are readily convertible to known amounts of cash and
have insignifi cant risk of changes in value.
Investment securities
Investment securities are classifi ed and accounted for, depending on management’s intent, into available-for-
sale securities. Available-for-sale securities are carried at fair value as of the balance sheet date, with unrealized
gain and loss, net of applicable taxes, reported in a separate component of net assets. Available-for-sale securi-
ties whose fair values are not readily available are carried at cost. The cost of securities sold is calculated by the
moving-average method.
Allowance for doubtful accounts
Allowance for doubtful accounts of the Company and its domestic consolidated subsidiaries is provided based
on historical experience for normal receivables and on an estimate of collectability of receivables from compa-
nies in fi nancial diffi culty.
Allowance for doubtful accounts of foreign consolidated subsidiaries is provided based on an estimate of
collectability of receivables.
Inventories
Inventories are principally stated at cost, cost being determined by the FIFO method, which evaluates the amount
of the inventories shown in the balance sheet by writing them down based on their decrease in profi tability.
Property, plant and equipment (excluding leased assets)
Property, plant and equipment are carried at cost. Signifi cant renewals and additions are capitalized; mainte-
nance and repairs, and minor renewals and improvements, are charged to income as incurred.
Depreciation of buildings (other than facilities attached to buildings) of the Company and its domestic con-
solidated subsidiaries is calculated principally by the straight-line method. Besides, depreciation of facilities
Note 2:
Summary of Signifi cant Accounting Policies
DIC Corporation and Consolidated SubsidiariesYear ended December 31, 2017
12 Notes to the Consolidated Financial Statements
attached to buildings and structures acquired on or after April 1, 2016, is also calculated by the straight-line
method. Other property, plant and equipment are calculated by the declining-balance method.
Depreciation of property, plant and equipment of foreign consolidated subsidiaries is calculated principally by
the straight-line method. The range of useful lives is principally from 8 to 50 years for buildings and structures
and from 3 to 11 years for machinery, equipment and vehicles.
Intangible assets (excluding leased assets)
Intangible assets are carried at cost less accumulated amortization, and are amortized by the straight-line
method. Goodwill is amortized by the straight-line method over a reasonable period not exceeding 20 years.
Leased assets
For the Company and its domestic consolidated subsidiaries, leased assets related to fi nance leases that do not
transfer ownership of the leased property to the lessee are depreciated on a straight-line basis, with the lease
periods used as their useful lives and no residual value.
Foreign consolidated subsidiaries account for lease transactions in accordance with either the accounting
principles generally accepted in the United States (“U.S. GAAP”) or IFRS.
Retirement and pension plans
The Company and its domestic consolidated subsidiaries account for net defi ned benefi t asset/liability for em-
ployees’ and executive offi cers’ retirement benefi ts. Pension assets are deducted from retirement benefi t obli-
gations and the net amount is recognized based on the estimated amount of payment as of the balance sheet
date. In calculating retirement benefi t obligations, the Company applies a method of attributing expected
retirement benefi ts to each period on a benefi t formula basis. The Company and its domestic consolidated
subsidiaries amortize actuarial gain and loss in the succeeding years primarily by the straight-line method
over stated years that do not exceed the average remaining service period of the eligible employees (15 to 16
years). Past service costs are amortized in the accounting periods when they accrue.
Foreign consolidated subsidiaries are accounted for in accordance with either U.S. GAAP or IFRS. Actuarial
gains and losses are amortized in the succeeding year primarily by the straight-line method over stated years
that do not exceed the average remaining service period of the eligible employees (9 to 28 years). Past service
costs are amortized over 3 to 25 years.
Unrecognized actuarial gains and losses and unrecognized past service costs are recorded in “Remeasure-
ments of defi ned benefi t plans” in net assets after adjusting income tax effect.
Asset retirement obligations
The asset retirement obligation is recognized as the sum of the discounted cash fl ows required for the future
asset retirement and is recorded in the period in which the obligation is incurred if a reasonable estimate can
be made. If a reasonable estimate of the asset retirement obligation cannot be made in the period in which
the asset retirement obligation is incurred, the liability should be recognized when a reasonable estimate of the
asset retirement obligation can be made. Upon initial recognition of a liability for an asset retirement obliga-
tion, an asset retirement cost is capitalized by increasing the carrying amount of the related fi xed asset by the
amount of the liability. The asset retirement cost is subsequently allocated to expense through depreciation
over the remaining useful life of the asset. Over time, the liability is accreted to its present value each period.
Any subsequent revisions to the timing or the amount of the original estimate of undiscounted cash fl ows are
refl ected as an increase or a decrease in the carrying amount of the liability and the capitalized amount of the
related asset retirement cost.
Income taxes
The provision for income taxes is computed based on the pretax income (loss) included in the consolidated
statement of income.
Deferred income taxes are recorded to refl ect the impact of temporary differences between assets and liabili-
ties recognized for fi nancial reporting purposes and such amounts recognized for tax purposes. These deferred
taxes are measured by applying currently enacted tax laws to the temporary differences.
Research and development costs
Research and development costs are charged to income as incurred.
13 Notes to the Consolidated Financial Statements
Basis of translation of fi nancial statements of foreign consolidated subsidiaries
The fi nancial statements of foreign consolidated subsidiaries included in the consolidated fi nancial statements
are translated into Japanese yen based on the following procedures:
(1) Assets and liabilities of foreign consolidated subsidiaries are translated into Japanese yen at the exchange
rates as of the balance sheet date.
(2) Income and expenses are translated into Japanese yen at the average rate during the year.
The differences of translation are included in foreign currency translation adjustment and non-controlling
interests, which are presented as separate components of net assets.
Translation of foreign currency accounts
Receivables and payables denominated in foreign currencies are translated into Japanese yen at the exchange
rates as of the balance sheet date and any difference arising from the translation is recognized in the consoli-
dated statement of income if hedge accounting is not applied.
Derivatives and hedging activities
To hedge risks associated with the fl uctuations of exchange rates, interest rates and commodity prices, the
Group uses foreign currency forward contracts, currency swaps, interest rate swaps, and commodity swaps.
To hedge a part of the risks associated with the fl uctuations of exchange rates for investments in foreign enti-
ties, the Company uses loans denominated in foreign currencies. The Group does not enter into derivatives for
trading or speculative purposes.
Derivative fi nancial instruments and foreign currency transactions are classifi ed and accounted for as follows:
1) all derivatives are recognized as either assets or liabilities and measured at fair value, with gains or losses
recognized in the consolidated statement of income and 2) for derivatives used for hedging purposes,
if derivatives qualify for hedge accounting because of high correlation and effectiveness between the
hedging instruments and the hedged items, gains or losses on derivatives are deferred until maturity of the
hedged transactions.
Receivables and payables denominated in foreign currencies are translated at the contracted rates if the
forward contracts qualify for hedge accounting. Gains and losses related to qualifying hedges of fi rm commit-
ments or anticipated transactions are deferred and recognized in income when the hedged transaction occurs.
If interest rate swaps qualify for hedge accounting and meet certain specifi c matching criteria, they will not be
measured at market value, rather the differential paid or received under the swaps will be recognized in inter-
est expenses or interest income.
Per share information
Earnings per share (basic) is computed by dividing net income attributable to owners of the parent available to
common shareholders by the weighted-average number of shares issued for the period, retroactively adjusted
for stock splits.
The Company implemented the consolidation of shares of common stock by a factor of 10 to 1 with July 1,
2016, as the effective date. Earnings per share (basic) is calculated based on the assumption that the consoli-
dation had been implemented at the beginning of the fi scal year ended December 31, 2016.
Earnings per share (diluted) refl ects the potential dilution that could occur if securities were exercised or con-
verted into common stock. Earnings per share (diluted) assumes full conversion of the outstanding convertible
notes and bonds at the beginning of the year (or at the time of issuance) with an applicable adjustment for
related interest expense, net of tax, and full exercise of outstanding warrants.
Cash dividends per share presented in the accompanying consolidated statement of income are dividends
applicable to the respective years, including dividends to be paid after the end of the year.
Cash dividends per share applicable to the period for the fi scal year ended December 31, 2016, comprises
interim dividends of ¥4.00 (before the consolidation) and year-end dividends of ¥60.00 (after the consolidation).
If the consolidation had been taken into consideration, cash dividends per share applicable to the period for
the fi scal year ended December 31, 2016, would be ¥100.00.
From the fi scal year ended December 31, 2017, the Company introduced the Board Benefi t Trust (BBT). The
shares held by the trust are recorded under net assets as treasury shares. The number of treasury shares exclud-
ed from the number of shares issued as of the balance sheet date used for the calculation of equity per share
includes the number of shares held by the trust. The number of treasury shares excluded from the weighted-
average number of shares issued during the fi scal year used for the calculation of earnings per share includes
the number of shares held by the trust.
14
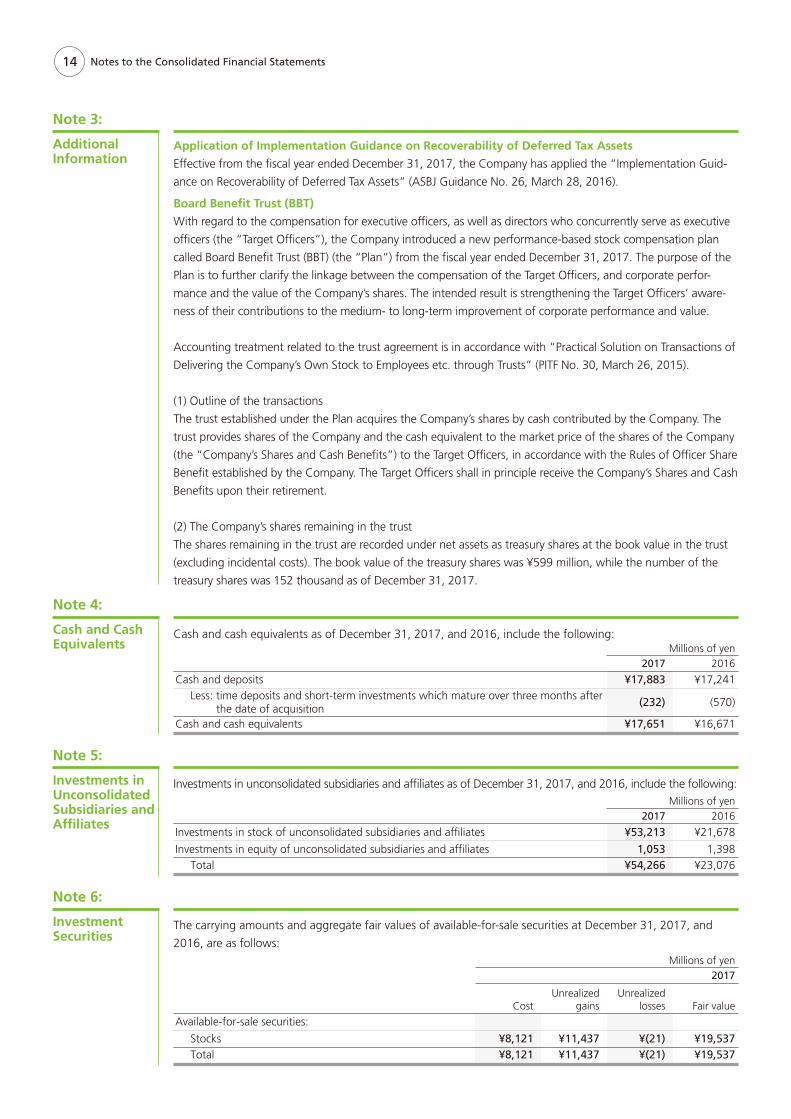
Cash and cash equivalents as of December 31, 2017, and 2016, include the following:Millions of yen
2017 2016
Cash and deposits ¥17,883 ¥17,241Less: time deposits and short-term investments which mature over three months after
the date of acquisition(232) (570)
Cash and cash equivalents ¥17,651 ¥16,671
Note 4:
Cash and Cash Equivalents
Note 5:
Investments in Unconsolidated Subsidiaries and Affi liates
Investments in unconsolidated subsidiaries and affi liates as of December 31, 2017, and 2016, include the following:Millions of yen
2017 2016
Investments in stock of unconsolidated subsidiaries and affi liates ¥53,213 ¥21,678
Investments in equity of unconsolidated subsidiaries and affi liates 1,053 1,398 Total ¥54,266 ¥23,076
The carrying amounts and aggregate fair values of available-for-sale securities at December 31, 2017, and
2016, are as follows:Millions of yen
2017
CostUnrealized
gainsUnrealized
losses Fair value
Available-for-sale securities:
Stocks ¥8,121 ¥11,437 ¥(21) ¥19,537 Total ¥8,121 ¥11,437 ¥(21) ¥19,537
Note 6:
Investment Securities
Notes to the Consolidated Financial Statements
Application of Implementation Guidance on Recoverability of Deferred Tax Assets
Effective from the fi scal year ended December 31, 2017, the Company has applied the “Implementation Guid-
ance on Recoverability of Deferred Tax Assets” (ASBJ Guidance No. 26, March 28, 2016).
Board Benefi t Trust (BBT)
With regard to the compensation for executive offi cers, as well as directors who concurrently serve as executive
offi cers (the “Target Offi cers”), the Company introduced a new performance-based stock compensation plan
called Board Benefi t Trust (BBT) (the “Plan”) from the fi scal year ended December 31, 2017. The purpose of the
Plan is to further clarify the linkage between the compensation of the Target Offi cers, and corporate perfor-
mance and the value of the Company’s shares. The intended result is strengthening the Target Offi cers’ aware-
ness of their contributions to the medium- to long-term improvement of corporate performance and value.
Accounting treatment related to the trust agreement is in accordance with “Practical Solution on Transactions of
Delivering the Company’s Own Stock to Employees etc. through Trusts” (PITF No. 30, March 26, 2015).
(1) Outline of the transactions
The trust established under the Plan acquires the Company’s shares by cash contributed by the Company. The
trust provides shares of the Company and the cash equivalent to the market price of the shares of the Company
(the “Company’s Shares and Cash Benefi ts”) to the Target Offi cers, in accordance with the Rules of Offi cer Share
Benefi t established by the Company. The Target Offi cers shall in principle receive the Company’s Shares and Cash
Benefi ts upon their retirement.
(2) The Company’s shares remaining in the trust
The shares remaining in the trust are recorded under net assets as treasury shares at the book value in the trust
(excluding incidental costs). The book value of the treasury shares was ¥599 million, while the number of the
treasury shares was 152 thousand as of December 31, 2017.
Note 3:
AdditionalInformation
15 Notes to the Consolidated Financial Statements
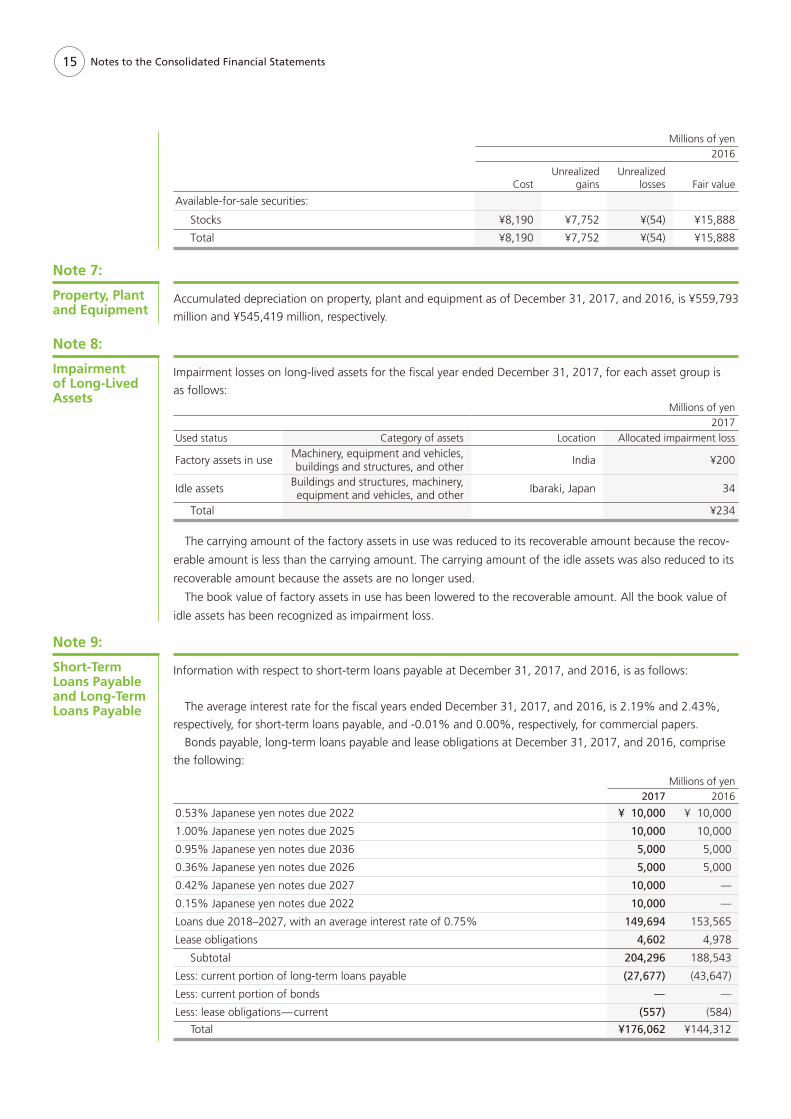
Millions of yen2016
CostUnrealized
gainsUnrealized
losses Fair value
Available-for-sale securities:
Stocks ¥8,190 ¥7,752 ¥(54) ¥15,888
Total ¥8,190 ¥7,752 ¥(54) ¥15,888
Impairment losses on long-lived assets for the fi scal year ended December 31, 2017, for each asset group is
as follows:Millions of yen
2017
Used status Category of assets Location Allocated impairment loss
Factory assets in use Machinery, equipment and vehicles, buildings and structures, and other
India ¥200
Idle assetsBuildings and structures, machinery, equipment and vehicles, and other
Ibaraki, Japan 34
Total ¥234
The carrying amount of the factory assets in use was reduced to its recoverable amount because the recov-
erable amount is less than the carrying amount. The carrying amount of the idle assets was also reduced to its
recoverable amount because the assets are no longer used.
The book value of factory assets in use has been lowered to the recoverable amount. All the book value of
idle assets has been recognized as impairment loss.
Note 8:
Impairment of Long-Lived Assets
Information with respect to short-term loans payable at December 31, 2017, and 2016, is as follows:
The average interest rate for the fi scal years ended December 31, 2017, and 2016, is 2.19% and 2.43%,
respectively, for short-term loans payable, and -0.01% and 0.00%, respectively, for commercial papers.
Bonds payable, long-term loans payable and lease obligations at December 31, 2017, and 2016, comprise
the following:
Millions of yen2017 2016
0.53% Japanese yen notes due 2022 ¥ 10,000 ¥ 10,000
1.00% Japanese yen notes due 2025 10,000 10,000
0.95% Japanese yen notes due 2036 5,000 5,000
0.36% Japanese yen notes due 2026 5,000 5,000
0.42% Japanese yen notes due 2027 10,000 —
0.15% Japanese yen notes due 2022 10,000 —
Loans due 2018–2027, with an average interest rate of 0.75% 149,694 153,565
Lease obligations 4,602 4,978
Subtotal 204,296 188,543
Less: current portion of long-term loans payable (27,677) (43,647)
Less: current portion of bonds — —
Less: lease obligations—current (557) (584)
Total ¥176,062 ¥144,312
Note 9:
Short-Term Loans Payable and Long-Term Loans Payable
Accumulated depreciation on property, plant and equipment as of December 31, 2017, and 2016, is ¥559,793
million and ¥545,419 million, respectively.
Note 7:
Property, Plant and Equipment
16
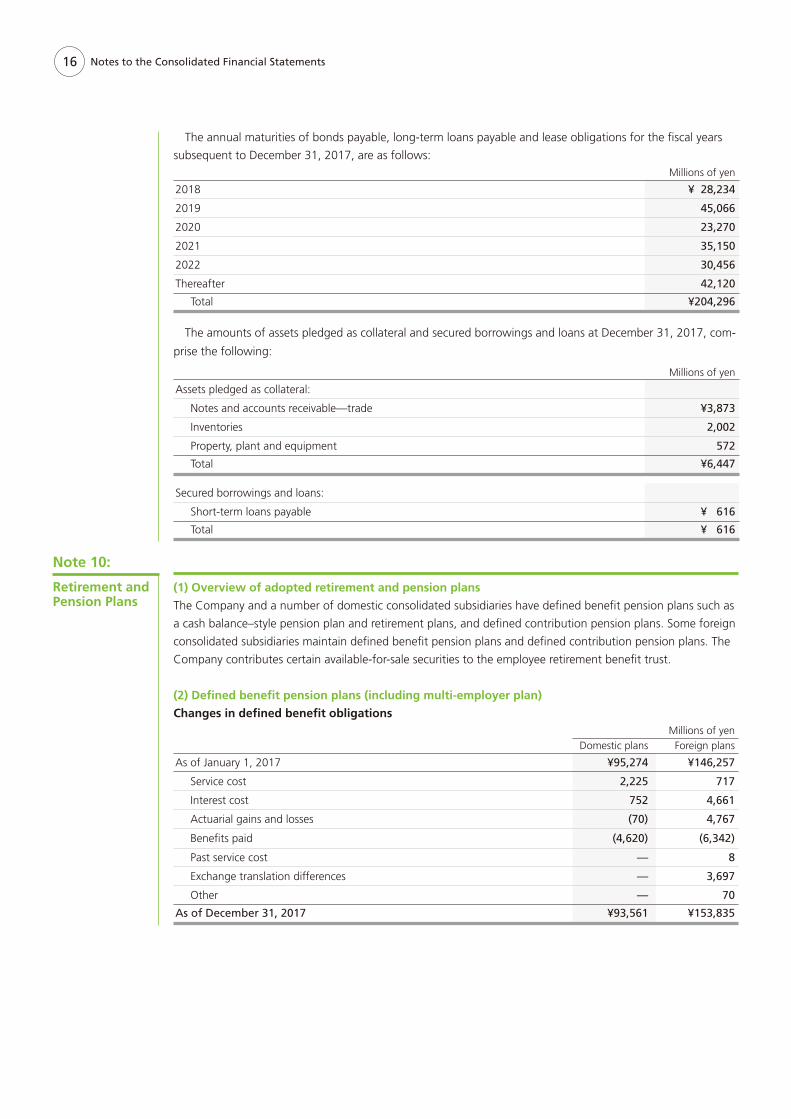
(1) Overview of adopted retirement and pension plans
The Company and a number of domestic consolidated subsidiaries have defi ned benefi t pension plans such as
a cash balance–style pension plan and retirement plans, and defi ned contribution pension plans. Some foreign
consolidated subsidiaries maintain defi ned benefi t pension plans and defi ned contribution pension plans. The
Company contributes certain available-for-sale securities to the employee retirement benefi t trust.
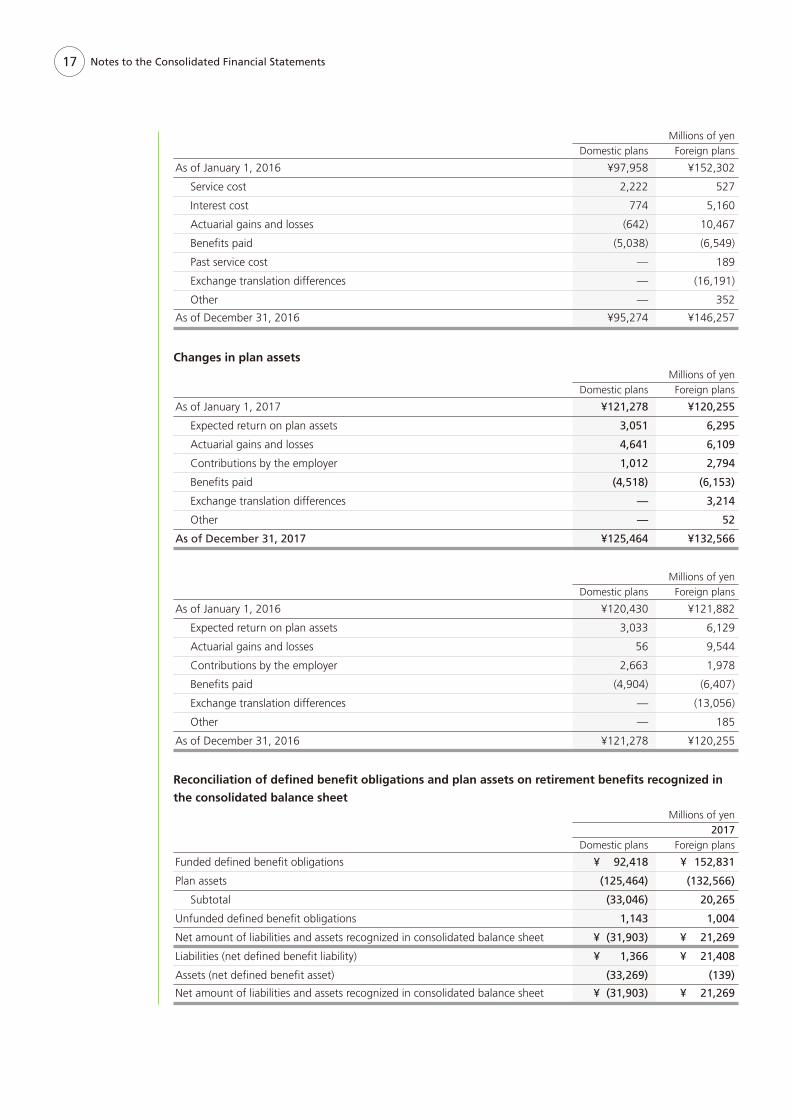
(2) Defi ned benefi t pension plans (including multi-employer plan)
Changes in defi ned benefi t obligationsMillions of yen
Domestic plans Foreign plans
As of January 1, 2017 ¥95,274 ¥146,257
Service cost 2,225 717
Interest cost 752 4,661
Actuarial gains and losses (70) 4,767
Benefi ts paid (4,620) (6,342)
Past service cost — 8
Exchange translation differences — 3,697
Other — 70
As of December 31, 2017 ¥93,561 ¥153,835
Note 10:
Retirement and Pension Plans
Notes to the Consolidated Financial Statements
The annual maturities of bonds payable, long-term loans payable and lease obligations for the fi scal years
subsequent to December 31, 2017, are as follows:Millions of yen
2018 ¥ 28,234
2019 45,066
2020 23,270
2021 35,150
2022 30,456
Thereafter 42,120
Total ¥204,296
The amounts of assets pledged as collateral and secured borrowings and loans at December 31, 2017, com-
prise the following:
Millions of yen
Assets pledged as collateral:
Notes and accounts receivable—trade ¥3,873
Inventories 2,002
Property, plant and equipment 572
Total ¥6,447
Secured borrowings and loans:
Short-term loans payable ¥ 616
Total ¥ 616
17 Notes to the Consolidated Financial Statements
Millions of yenDomestic plans Foreign plans
As of January 1, 2016 ¥97,958 ¥152,302
Service cost 2,222 527
Interest cost 774 5,160
Actuarial gains and losses (642) 10,467
Benefi ts paid (5,038) (6,549)
Past service cost — 189
Exchange translation differences — (16,191)
Other — 352
As of December 31, 2016 ¥95,274 ¥146,257
Changes in plan assetsMillions of yen
Domestic plans Foreign plans
As of January 1, 2017 ¥121,278 ¥120,255
Expected return on plan assets 3,051 6,295
Actuarial gains and losses 4,641 6,109
Contributions by the employer 1,012 2,794
Benefi ts paid (4,518) (6,153)
Exchange translation differences — 3,214
Other — 52
As of December 31, 2017 ¥125,464 ¥132,566
Millions of yenDomestic plans Foreign plans
As of January 1, 2016 ¥120,430 ¥121,882
Expected return on plan assets 3,033 6,129
Actuarial gains and losses 56 9,544
Contributions by the employer 2,663 1,978
Benefi ts paid (4,904) (6,407)
Exchange translation differences — (13,056)
Other — 185
As of December 31, 2016 ¥121,278 ¥120,255
Reconciliation of defi ned benefi t obligations and plan assets on retirement benefi ts recognized in
the consolidated balance sheetMillions of yen
2017Domestic plans Foreign plans
Funded defi ned benefi t obligations ¥ 92,418 ¥ 152,831
Plan assets (125,464) (132,566)
Subtotal (33,046) 20,265
Unfunded defi ned benefi t obligations 1,143 1,004
Net amount of liabilities and assets recognized in consolidated balance sheet ¥ (31,903) ¥ 21,269
Liabilities (net defi ned benefi t liability) ¥ 1,366 ¥ 21,408
Assets (net defi ned benefi t asset) (33,269) (139)
Net amount of liabilities and assets recognized in consolidated balance sheet ¥ (31,903) ¥ 21,269
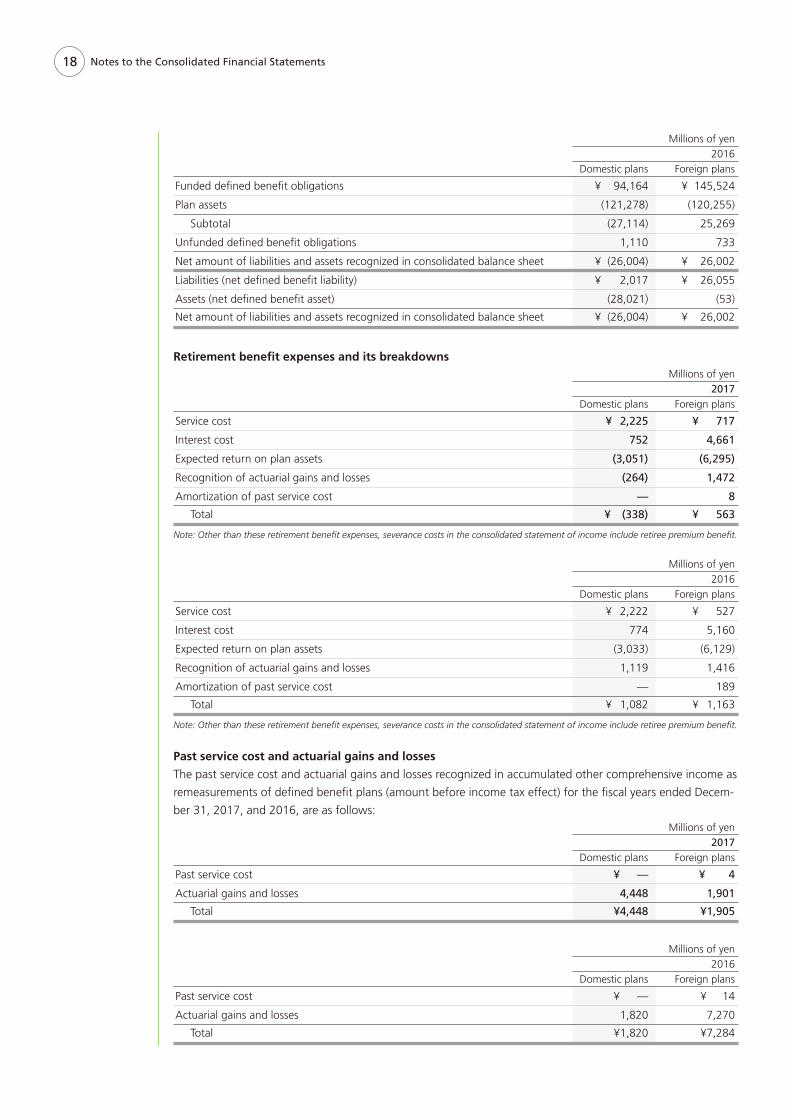
18
Millions of yen2016
Domestic plans Foreign plans
Funded defi ned benefi t obligations ¥ 94,164 ¥ 145,524
Plan assets (121,278) (120,255)
Subtotal (27,114) 25,269
Unfunded defi ned benefi t obligations 1,110 733
Net amount of liabilities and assets recognized in consolidated balance sheet ¥ (26,004) ¥ 26,002
Liabilities (net defi ned benefi t liability) ¥ 2,017 ¥ 26,055
Assets (net defi ned benefi t asset) (28,021) (53)
Net amount of liabilities and assets recognized in consolidated balance sheet ¥ (26,004) ¥ 26,002
Retirement benefi t expenses and its breakdownsMillions of yen
2017Domestic plans Foreign plans
Service cost ¥ 2,225 ¥ 717
Interest cost 752 4,661
Expected return on plan assets (3,051) (6,295)
Recognition of actuarial gains and losses (264) 1,472
Amortization of past service cost — 8
Total ¥ (338) ¥ 563
Note: Other than these retirement benefi t expenses, severance costs in the consolidated statement of income include retiree premium benefi t.
Millions of yen2016
Domestic plans Foreign plans
Service cost ¥ 2,222 ¥ 527
Interest cost 774 5,160
Expected return on plan assets (3,033) (6,129)
Recognition of actuarial gains and losses 1,119 1,416
Amortization of past service cost — 189
Total ¥ 1,082 ¥ 1,163
Note: Other than these retirement benefi t expenses, severance costs in the consolidated statement of income include retiree premium benefi t.
Past service cost and actuarial gains and losses
The past service cost and actuarial gains and losses recognized in accumulated other comprehensive income as
remeasurements of defi ned benefi t plans (amount before income tax effect) for the fi scal years ended Decem-
ber 31, 2017, and 2016, are as follows:Millions of yen
2017Domestic plans Foreign plans
Past service cost ¥ — ¥ 4
Actuarial gains and losses 4,448 1,901
Total ¥4,448 ¥1,905
Millions of yen2016
Domestic plans Foreign plans
Past service cost ¥ — ¥ 14
Actuarial gains and losses 1,820 7,270
Total ¥1,820 ¥7,284
Notes to the Consolidated Financial Statements
19 Notes to the Consolidated Financial Statements
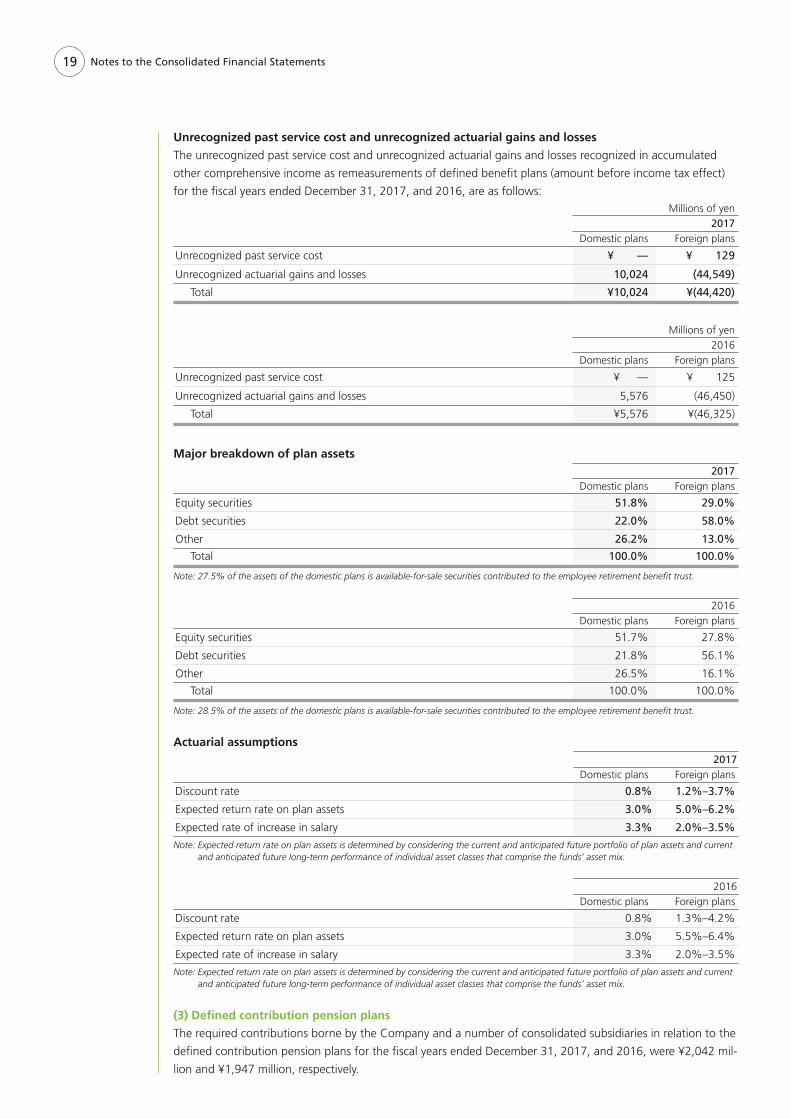
Unrecognized past service cost and unrecognized actuarial gains and losses
The unrecognized past service cost and unrecognized actuarial gains and losses recognized in accumulated
other comprehensive income as remeasurements of defi ned benefi t plans (amount before income tax effect)
for the fi scal years ended December 31, 2017, and 2016, are as follows:Millions of yen
2017Domestic plans Foreign plans
Unrecognized past service cost ¥ — ¥ 129
Unrecognized actuarial gains and losses 10,024 (44,549)
Total ¥10,024 ¥(44,420)
Millions of yen2016
Domestic plans Foreign plans
Unrecognized past service cost ¥ — ¥ 125
Unrecognized actuarial gains and losses 5,576 (46,450)
Total ¥5,576 ¥(46,325)
Major breakdown of plan assets2017
Domestic plans Foreign plans
Equity securities 51.8% 29.0%
Debt securities 22.0% 58.0%
Other 26.2% 13.0%
Total 100.0% 100.0%
Note: 27.5% of the assets of the domestic plans is available-for-sale securities contributed to the employee retirement benefi t trust.
2016Domestic plans Foreign plans
Equity securities 51.7% 27.8%
Debt securities 21.8% 56.1%
Other 26.5% 16.1%
Total 100.0% 100.0%
Note: 28.5% of the assets of the domestic plans is available-for-sale securities contributed to the employee retirement benefi t trust.
Actuarial assumptions2017
Domestic plans Foreign plans
Discount rate 0.8% 1.2%–3.7%
Expected return rate on plan assets 3.0% 5.0%–6.2%
Expected rate of increase in salary 3.3% 2.0%–3.5%
Note: Expected return rate on plan assets is determined by considering the current and anticipated future portfolio of plan assets and current and anticipated future long-term performance of individual asset classes that comprise the funds’ asset mix.
2016Domestic plans Foreign plans
Discount rate 0.8% 1.3%–4.2%
Expected return rate on plan assets 3.0% 5.5%–6.4%
Expected rate of increase in salary 3.3% 2.0%–3.5%
Note: Expected return rate on plan assets is determined by considering the current and anticipated future portfolio of plan assets and current and anticipated future long-term performance of individual asset classes that comprise the funds’ asset mix.
(3) Defi ned contribution pension plans
The required contributions borne by the Company and a number of consolidated subsidiaries in relation to the
defi ned contribution pension plans for the fi scal years ended December 31, 2017, and 2016, were ¥2,042 mil-
lion and ¥1,947 million, respectively.

20
The Company retired its treasury shares on January 15, 2016. In addition, the Company implemented the
consolidation of shares of common stock by a factor of 10 to 1 with July 1, 2016, as the effective date. As a
result, the number of authorized shares as of December 31, 2017, and 2016, are 150,000,000 shares, and the
number of shares issued as of December 31, 2017, and 2016, are 95,156,904 shares.
Note 12:
Capital Stock
Notes to the Consolidated Financial Statements
Japanese companies are subject to the Companies Act of Japan (the “Companies Act”). The signifi cant pro-
visions in the Companies Act that affect fi nancial and accounting matters are summarized below:
(1) Dividends
Under the Companies Act, companies can pay dividends at any time during the fi scal year in addition to the
year-end dividend upon resolution at the shareholders’ meeting. For companies that meet certain criteria such
as: (a) having the board of directors, (b) having independent auditors, (c) having the board of corporate audi-
tors and (d) the term of service of the directors is prescribed as one year rather than two years of normal term
by its articles of incorporation, the board of directors may declare dividends (except for dividends in kind) at
any time during the fi scal year if the company has prescribed so in its articles of incorporation. The Company
meets all the above criteria.
The Companies Act permits companies to distribute dividends in kind (non-cash assets) to shareholders sub-
ject to a certain limitation and additional requirements.
Semiannual interim dividends may also be paid once a year upon resolution by the board of directors if the
articles of incorporation of the company so stipulate. The Companies Act provides certain limitations on the
amounts available for dividends or the purchase of treasury shares. The limitation is defi ned as the amount
available for distribution to the shareholders, but the amount of net assets after dividends must be maintained
at no less than ¥3 million.
(2) Increases/decreases and transfer of common stocks, reserve and surplus
The Companies Act requires that an amount equal to 10% of dividends must be appropriated as a legal
reserve (a component of retained earnings) or as additional paid-in capital (a component of capital surplus)
depending on the equity account charged upon the payment of such dividends until the total of the aggregate
amount of legal reserve and additional paid-in capital equals 25% of the common stock. Under the Compa-
nies Act, the total amount of additional paid-in capital and legal reserve may be reversed without limitation.
The Companies Act also provides that common stock, legal reserve, additional paid-in capital, other capital
surplus and retained earnings can be transferred among the accounts under certain conditions upon resolution
of the shareholders.
(3) Treasury shares and treasury stock acquisition rights
The Companies Act also provides for companies to purchase treasury shares and dispose of such treasury
shares by resolution of the board of directors. The amount of treasury shares purchased cannot exceed the
amount available for distribution to the shareholders which is determined by a specifi c formula.
Under the Companies Act, stock acquisition rights, which were previously presented as a liability, are now
presented as a separate component of equity.
The Companies Act also provides that companies can purchase both treasury stock acquisition rights and
treasury shares. Such treasury stock acquisition rights are presented as a separate component of equity or
deducted directly from stock acquisition rights.
Note 11:
Net Assets
21 Notes to the Consolidated Financial Statements
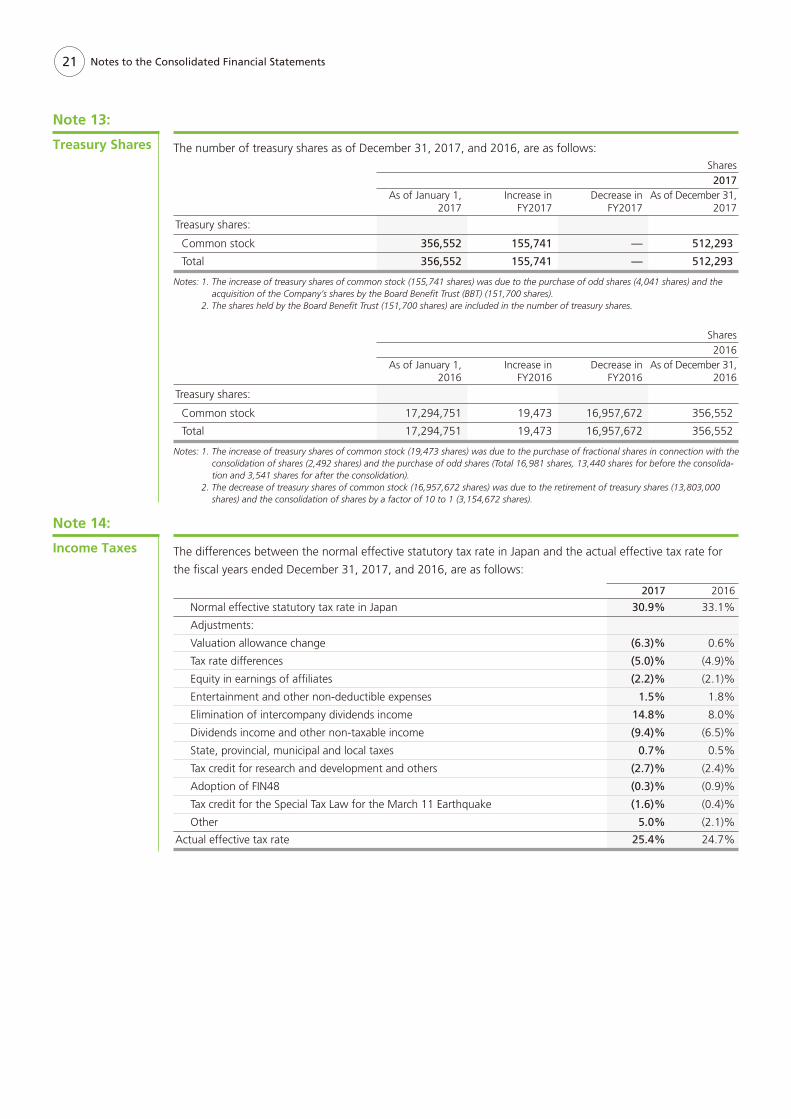
The number of treasury shares as of December 31, 2017, and 2016, are as follows:Shares2017
As of January 1, 2017
Increase in FY2017
Decrease in FY2017
As of December 31, 2017
Treasury shares:
Common stock 356,552 155,741 — 512,293
Total 356,552 155,741 — 512,293
Notes: 1. The increase of treasury shares of common stock (155,741 shares) was due to the purchase of odd shares (4,041 shares) and the acquisition of the Company’s shares by the Board Benefi t Trust (BBT) (151,700 shares).
2. The shares held by the Board Benefi t Trust (151,700 shares) are included in the number of treasury shares.
Shares2016
As of January 1, 2016
Increase in FY2016
Decrease in FY2016
As of December 31, 2016
Treasury shares:
Common stock 17,294,751 19,473 16,957,672 356,552
Total 17,294,751 19,473 16,957,672 356,552
Notes: 1. The increase of treasury shares of common stock (19,473 shares) was due to the purchase of fractional shares in connection with the consolidation of shares (2,492 shares) and the purchase of odd shares (Total 16,981 shares, 13,440 shares for before the consolida-tion and 3,541 shares for after the consolidation).
2. The decrease of treasury shares of common stock (16,957,672 shares) was due to the retirement of treasury shares (13,803,000 shares) and the consolidation of shares by a factor of 10 to 1 (3,154,672 shares).
Note 13:
Treasury Shares
The differences between the normal effective statutory tax rate in Japan and the actual effective tax rate for
the fi scal years ended December 31, 2017, and 2016, are as follows:
2017 2016
Normal effective statutory tax rate in Japan 30.9% 33.1%
Adjustments:
Valuation allowance change (6.3)% 0.6%
Tax rate differences (5.0)% (4.9)%
Equity in earnings of affi liates (2.2)% (2.1)%
Entertainment and other non-deductible expenses 1.5% 1.8%
Elimination of intercompany dividends income 14.8% 8.0%
Dividends income and other non-taxable income (9.4)% (6.5)%
State, provincial, municipal and local taxes 0.7% 0.5%
Tax credit for research and development and others (2.7)% (2.4)%
Adoption of FIN48 (0.3)% (0.9)%
Tax credit for the Special Tax Law for the March 11 Earthquake (1.6)% (0.4)%
Other 5.0% (2.1)%
Actual effective tax rate 25.4% 24.7%
Note 14:
Income Taxes
22
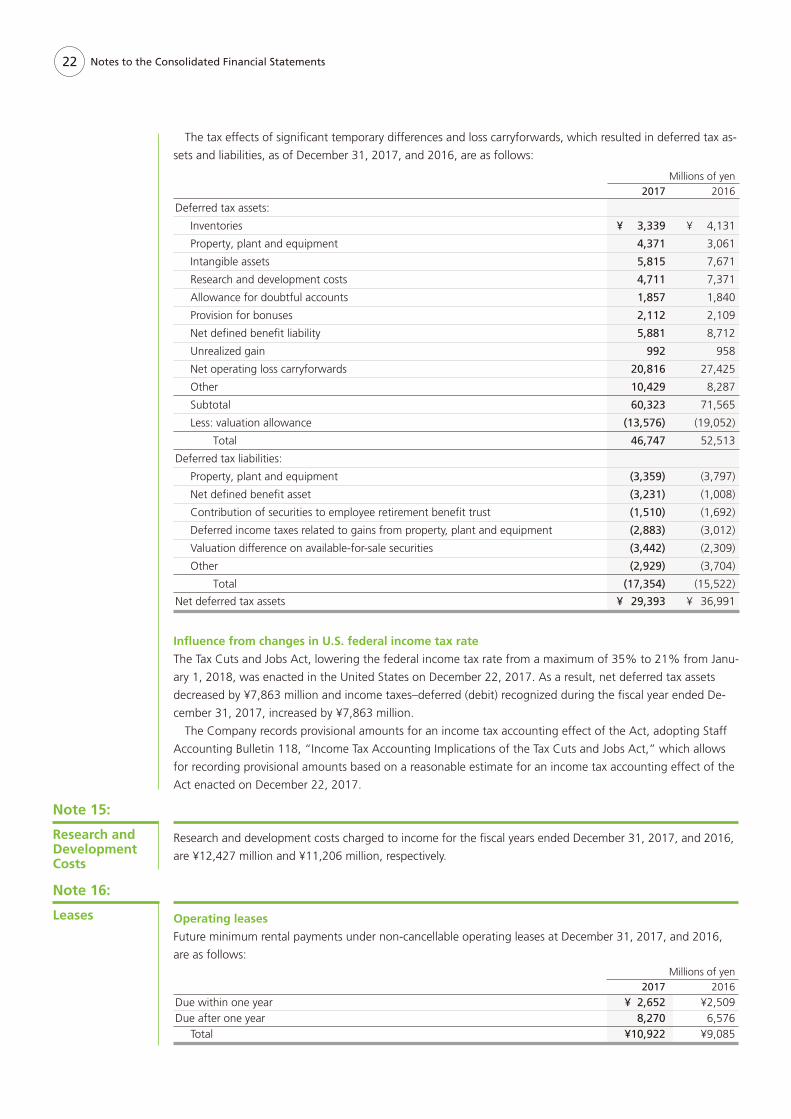
Research and development costs charged to income for the fi scal years ended December 31, 2017, and 2016,
are ¥12,427 million and ¥11,206 million, respectively.
Note 15:
Research and Development Costs
Operating leases
Future minimum rental payments under non-cancellable operating leases at December 31, 2017, and 2016,
are as follows:Millions of yen
2017 2016
Due within one year ¥ 2,652 ¥2,509Due after one year 8,270 6,576 Total ¥10,922 ¥9,085
The tax effects of signifi cant temporary differences and loss carryforwards, which resulted in deferred tax as-
sets and liabilities, as of December 31, 2017, and 2016, are as follows:
Millions of yen2017 2016
Deferred tax assets:
Inventories ¥ 3,339 ¥ 4,131
Property, plant and equipment 4,371 3,061
Intangible assets 5,815 7,671
Research and development costs 4,711 7,371
Allowance for doubtful accounts 1,857 1,840
Provision for bonuses 2,112 2,109
Net defi ned benefi t liability 5,881 8,712
Unrealized gain 992 958
Net operating loss carryforwards 20,816 27,425
Other 10,429 8,287
Subtotal 60,323 71,565
Less: valuation allowance (13,576) (19,052)
Total 46,747 52,513
Deferred tax liabilities:
Property, plant and equipment (3,359) (3,797)
Net defi ned benefi t asset (3,231) (1,008)
Contribution of securities to employee retirement benefi t trust (1,510) (1,692)
Deferred income taxes related to gains from property, plant and equipment (2,883) (3,012)
Valuation difference on available-for-sale securities (3,442) (2,309)
Other (2,929) (3,704)
Total (17,354) (15,522)
Net deferred tax assets ¥ 29,393 ¥ 36,991
Infl uence from changes in U.S. federal income tax rate
The Tax Cuts and Jobs Act, lowering the federal income tax rate from a maximum of 35% to 21% from Janu-
ary 1, 2018, was enacted in the United States on December 22, 2017. As a result, net deferred tax assets
decreased by ¥7,863 million and income taxes–deferred (debit) recognized during the fi scal year ended De-
cember 31, 2017, increased by ¥7,863 million.
The Company records provisional amounts for an income tax accounting effect of the Act, adopting Staff
Accounting Bulletin 118, “Income Tax Accounting Implications of the Tax Cuts and Jobs Act,” which allows
for recording provisional amounts based on a reasonable estimate for an income tax accounting effect of the
Act enacted on December 22, 2017.
Note 16:
Leases
Notes to the Consolidated Financial Statements
23 Notes to the Consolidated Financial Statements
Note 17:
Financial Instruments
Group policy for fi nancial instruments
The Group manages funds with safe and secure fi nancial assets. Means of fi nancings include direct fi nancing
such as the issuance of bonds and commercial papers and liquidation of receivables, as well as indirect fi nancing
such as short- and long-term bank borrowings, the terms of which are determined based on fi nancial market
conditions and balance of account at the time.
Nature and extent of risks arising from fi nancial instruments
Receivables such as trade notes and accounts receivable are exposed to customer credit risk. In addition, some
of such receivables are denominated in foreign currencies and are exposed to the market risk of fl uctuation in
foreign currency exchange rates. Investment securities, mainly the stocks of customers and suppliers, are ex-
posed to the risk of market price fl uctuations.
Payment terms of payables, such as trade notes and accounts payable, are less than one year. In addition,
some of such payables are denominated in foreign currencies and are exposed to the market risk of fl uctuation
in foreign currency exchange rates.
Funds needed for operations are mainly procured as short-term loans payable, whereas funds needed for
capital expenditure and investment are mainly procured as long-term loans payable, bonds payable and lease
obligations with regard to fi nance lease transactions. A part of such bank loans, bonds and lease obligations
are exposed to market risks from changes in variable interest rates. Trade accounts payable and loans payable
of the Company are also exposed to liquidity risk that the Company cannot meet its contractual obligations in
full on maturity dates.
Risk management for fi nancial instruments
The Company manages its credit risk from trade notes and accounts receivable on the basis of internal guide-
lines, which include the monitoring of payment terms and balances of customers by the sales and business
administration departments to identify the default risk of customers at an early stage. The consolidated subsid-
iaries of the Company manage the exposure to credit risk on their own in accordance with their internal guide-
lines. Investment securities are managed by monitoring market values, the fi nancial position of issuers and
considering the relationship with customers and suppliers on a regular basis. The Group also tries to mitigate
liquidity risk by arranging lines of credit with fi nancial institutions, along with adequate fi nancial planning.
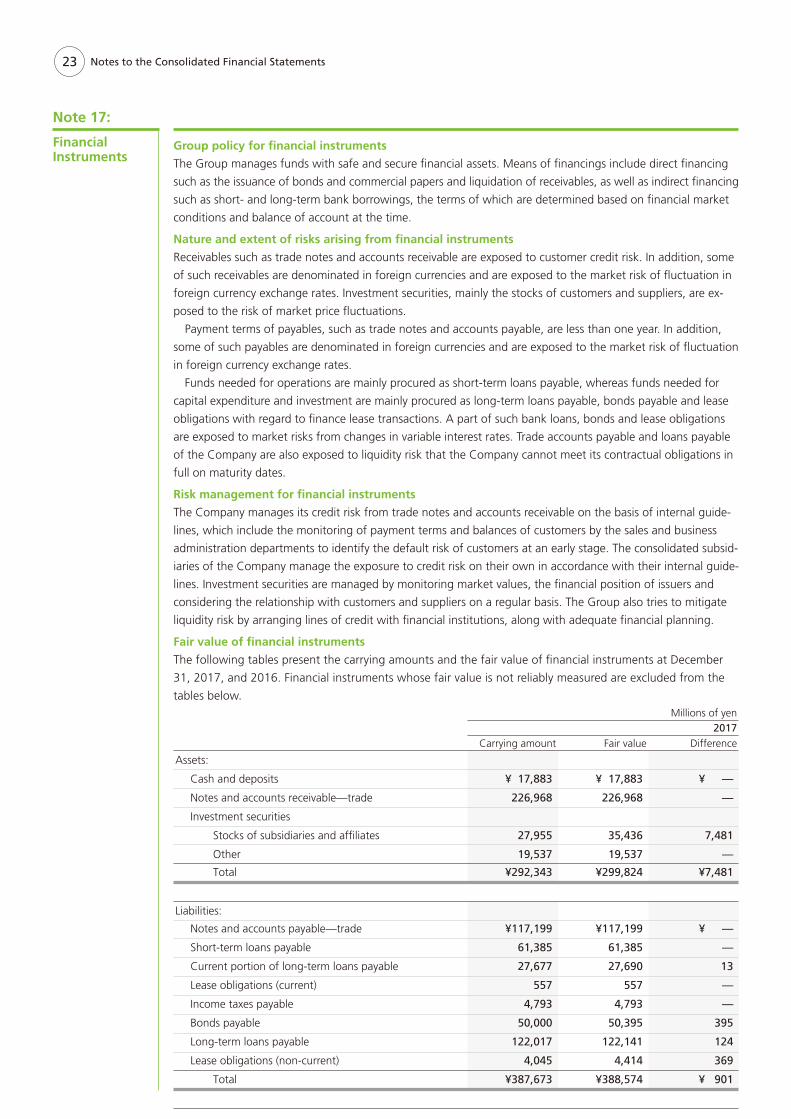
Fair value of fi nancial instruments
The following tables present the carrying amounts and the fair value of fi nancial instruments at December
31, 2017, and 2016. Financial instruments whose fair value is not reliably measured are excluded from the
tables below.Millions of yen
2017Carrying amount Fair value Difference
Assets:
Cash and deposits ¥ 17,883 ¥ 17,883 ¥ —
Notes and accounts receivable—trade 226,968 226,968 —
Investment securities
Stocks of subsidiaries and affi liates 27,955 35,436 7,481
Other 19,537 19,537 —
Total ¥292,343 ¥299,824 ¥7,481
Liabilities:
Notes and accounts payable—trade ¥117,199 ¥117,199 ¥ —
Short-term loans payable 61,385 61,385 —
Current portion of long-term loans payable 27,677 27,690 13
Lease obligations (current) 557 557 —
Income taxes payable 4,793 4,793 —
Bonds payable 50,000 50,395 395
Long-term loans payable 122,017 122,141 124
Lease obligations (non-current) 4,045 4,414 369
Total ¥387,673 ¥388,574 ¥ 901
24 Notes to the Consolidated Financial Statements
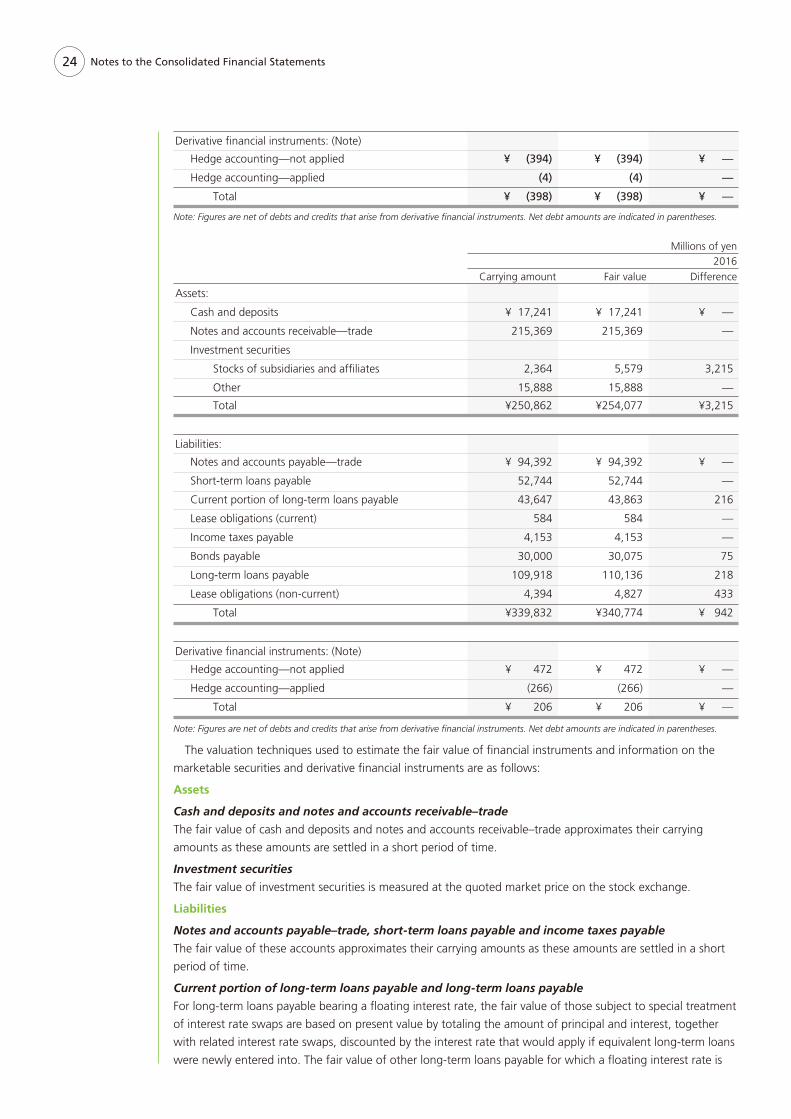
Derivative fi nancial instruments: (Note)
Hedge accounting—not applied ¥ (394) ¥ (394) ¥ —
Hedge accounting—applied (4) (4) —
Total ¥ (398) ¥ (398) ¥ —
Note: Figures are net of debts and credits that arise from derivative fi nancial instruments. Net debt amounts are indicated in parentheses.
Millions of yen2016
Carrying amount Fair value Difference
Assets:
Cash and deposits ¥ 17,241 ¥ 17,241 ¥ —
Notes and accounts receivable—trade 215,369 215,369 —
Investment securities
Stocks of subsidiaries and affi liates 2,364 5,579 3,215
Other 15,888 15,888 —
Total ¥250,862 ¥254,077 ¥3,215
Liabilities:
Notes and accounts payable—trade ¥ 94,392 ¥ 94,392 ¥ —
Short-term loans payable 52,744 52,744 —
Current portion of long-term loans payable 43,647 43,863 216
Lease obligations (current) 584 584 —
Income taxes payable 4,153 4,153 —
Bonds payable 30,000 30,075 75
Long-term loans payable 109,918 110,136 218
Lease obligations (non-current) 4,394 4,827 433
Total ¥339,832 ¥340,774 ¥ 942
Derivative fi nancial instruments: (Note)
Hedge accounting—not applied ¥ 472 ¥ 472 ¥ —
Hedge accounting—applied (266) (266) —
Total ¥ 206 ¥ 206 ¥ —
Note: Figures are net of debts and credits that arise from derivative fi nancial instruments. Net debt amounts are indicated in parentheses.
The valuation techniques used to estimate the fair value of fi nancial instruments and information on the
marketable securities and derivative fi nancial instruments are as follows:
Assets
Cash and deposits and notes and accounts receivable–trade
The fair value of cash and deposits and notes and accounts receivable–trade approximates their carrying
amounts as these amounts are settled in a short period of time.
Investment securities
The fair value of investment securities is measured at the quoted market price on the stock exchange.
Liabilities
Notes and accounts payable–trade, short-term loans payable and income taxes payable
The fair value of these accounts approximates their carrying amounts as these amounts are settled in a short
period of time.
Current portion of long-term loans payable and long-term loans payable
For long-term loans payable bearing a fl oating interest rate, the fair value of those subject to special treatment
of interest rate swaps are based on present value by totaling the amount of principal and interest, together
with related interest rate swaps, discounted by the interest rate that would apply if equivalent long-term loans
were newly entered into. The fair value of other long-term loans payable for which a fl oating interest rate is
25 Notes to the Consolidated Financial Statements
applied approximates their carrying amount, due to the fact that the market rate of interest is quickly factored
in while credit status of the Company remains unchanged.
On the other hand, the fair value of long-term loans payable for which a fi xed interest rate is applied is de-
termined by discounting the cash fl ows related to the long-term loans payable. The discount rate applied for
the calculation above is the interest rate that may be currently available to the Group for loans payable with
similar terms and conditions.
Bonds payable
The fair value is measured at the quoted market prices.
Lease obligations (current) and lease obligations (non-current)
The fair value of these accounts is determined by discounting the cash fl ows related to the lease obligations.
The discount rate applied for the calculation above is the interest rate that may be currently available to the
Group for lease obligations with similar terms and conditions.
Derivative fi nancial instruments
Please see Note 18 “Derivative Financial Instruments” for more information.
Financial instruments whose fair value is not reliably measured
There are no market prices for non-listed stocks and others (carrying amounts as of December 31, 2017, and
2016, are ¥29,375 million and ¥22,755 million, respectively) whose future cash fl ows cannot be estimated.
The fair value of such non-listed stocks and others is not reliably determinable and thus is excluded from in-
vestment securities.
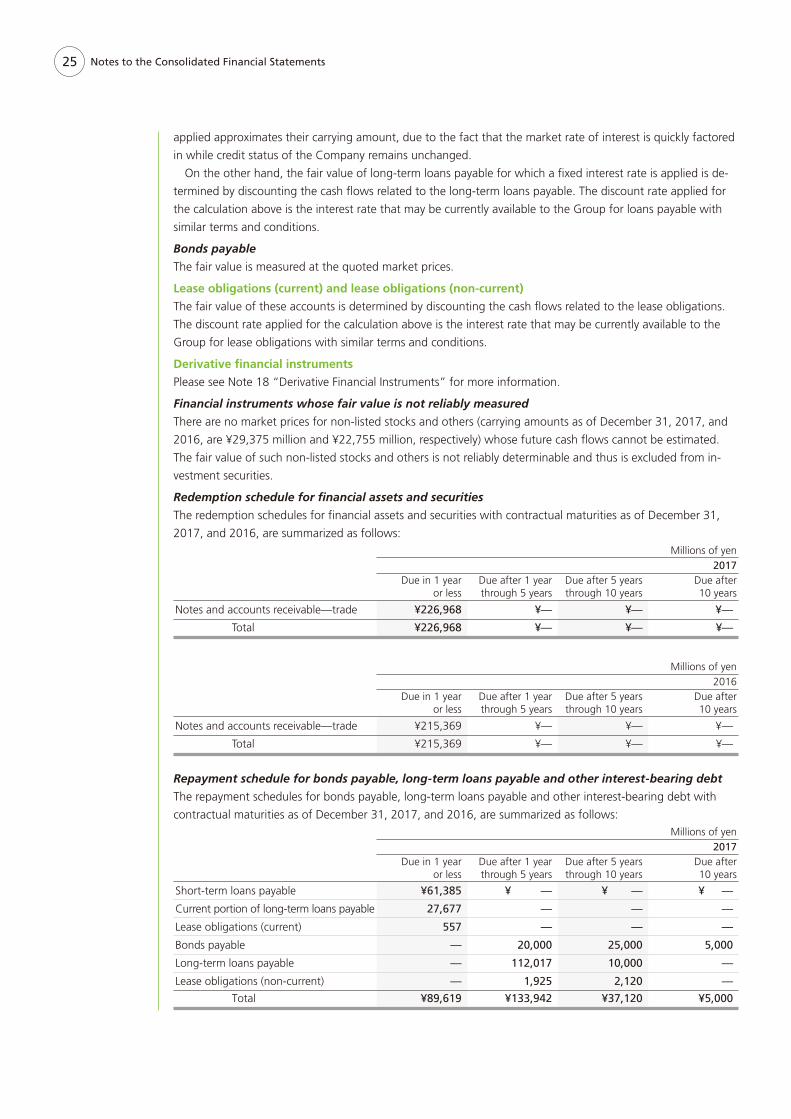
Redemption schedule for fi nancial assets and securities
The redemption schedules for fi nancial assets and securities with contractual maturities as of December 31,
2017, and 2016, are summarized as follows:Millions of yen
2017Due in 1 year
or lessDue after 1 year through 5 years
Due after 5 years through 10 years
Due after10 years
Notes and accounts receivable—trade ¥226,968 ¥— ¥— ¥—
Total ¥226,968 ¥— ¥— ¥—
Millions of yen2016
Due in 1 year or less
Due after 1 year through 5 years
Due after 5 years through 10 years
Due after10 years
Notes and accounts receivable—trade ¥215,369 ¥— ¥— ¥—
Total ¥215,369 ¥— ¥— ¥—
Repayment schedule for bonds payable, long-term loans payable and other interest-bearing debt
The repayment schedules for bonds payable, long-term loans payable and other interest-bearing debt with
contractual maturities as of December 31, 2017, and 2016, are summarized as follows:Millions of yen
2017Due in 1 year
or lessDue after 1 year through 5 years
Due after 5 years through 10 years
Due after10 years
Short-term loans payable ¥61,385 ¥ — ¥ — ¥ —
Current portion of long-term loans payable 27,677 — — —
Lease obligations (current) 557 — — —
Bonds payable — 20,000 25,000 5,000
Long-term loans payable — 112,017 10,000 —
Lease obligations (non-current) — 1,925 2,120 —
Total ¥89,619 ¥133,942 ¥37,120 ¥5,000
26
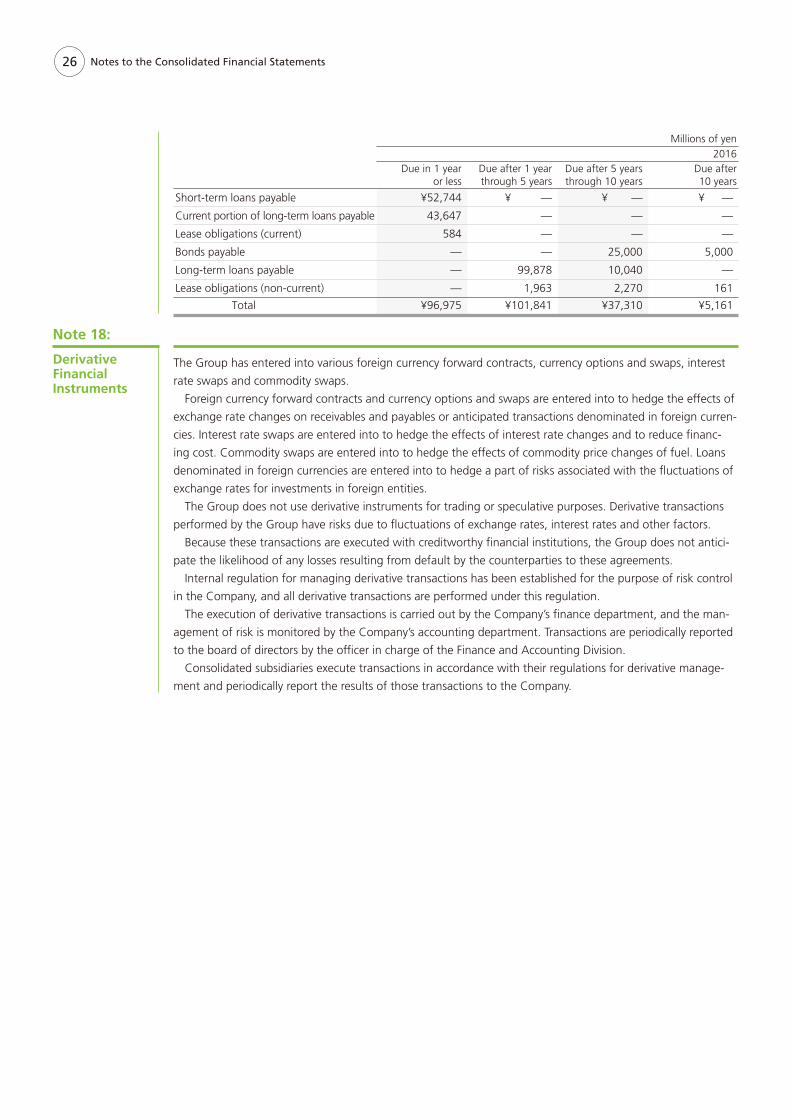
The Group has entered into various foreign currency forward contracts, currency options and swaps, interest
rate swaps and commodity swaps.
Foreign currency forward contracts and currency options and swaps are entered into to hedge the effects of
exchange rate changes on receivables and payables or anticipated transactions denominated in foreign curren-
cies. Interest rate swaps are entered into to hedge the effects of interest rate changes and to reduce fi nanc-
ing cost. Commodity swaps are entered into to hedge the effects of commodity price changes of fuel. Loans
denominated in foreign currencies are entered into to hedge a part of risks associated with the fl uctuations of
exchange rates for investments in foreign entities.
The Group does not use derivative instruments for trading or speculative purposes. Derivative transactions
performed by the Group have risks due to fl uctuations of exchange rates, interest rates and other factors.
Because these transactions are executed with creditworthy fi nancial institutions, the Group does not antici-
pate the likelihood of any losses resulting from default by the counterparties to these agreements.
Internal regulation for managing derivative transactions has been established for the purpose of risk control
in the Company, and all derivative transactions are performed under this regulation.
The execution of derivative transactions is carried out by the Company’s fi nance department, and the man-
agement of risk is monitored by the Company’s accounting department. Transactions are periodically reported
to the board of directors by the offi cer in charge of the Finance and Accounting Division.
Consolidated subsidiaries execute transactions in accordance with their regulations for derivative manage-
ment and periodically report the results of those transactions to the Company.
Note 18:
Derivative Financial Instruments
Notes to the Consolidated Financial Statements
Millions of yen2016
Due in 1 year or less
Due after 1 year through 5 years
Due after 5 years through 10 years
Due after10 years
Short-term loans payable ¥52,744 ¥ — ¥ — ¥ —
Current portion of long-term loans payable 43,647 — — —
Lease obligations (current) 584 — — —
Bonds payable — — 25,000 5,000
Long-term loans payable — 99,878 10,040 —
Lease obligations (non-current) — 1,963 2,270 161
Total ¥96,975 ¥101,841 ¥37,310 ¥5,161
27 Notes to the Consolidated Financial Statements
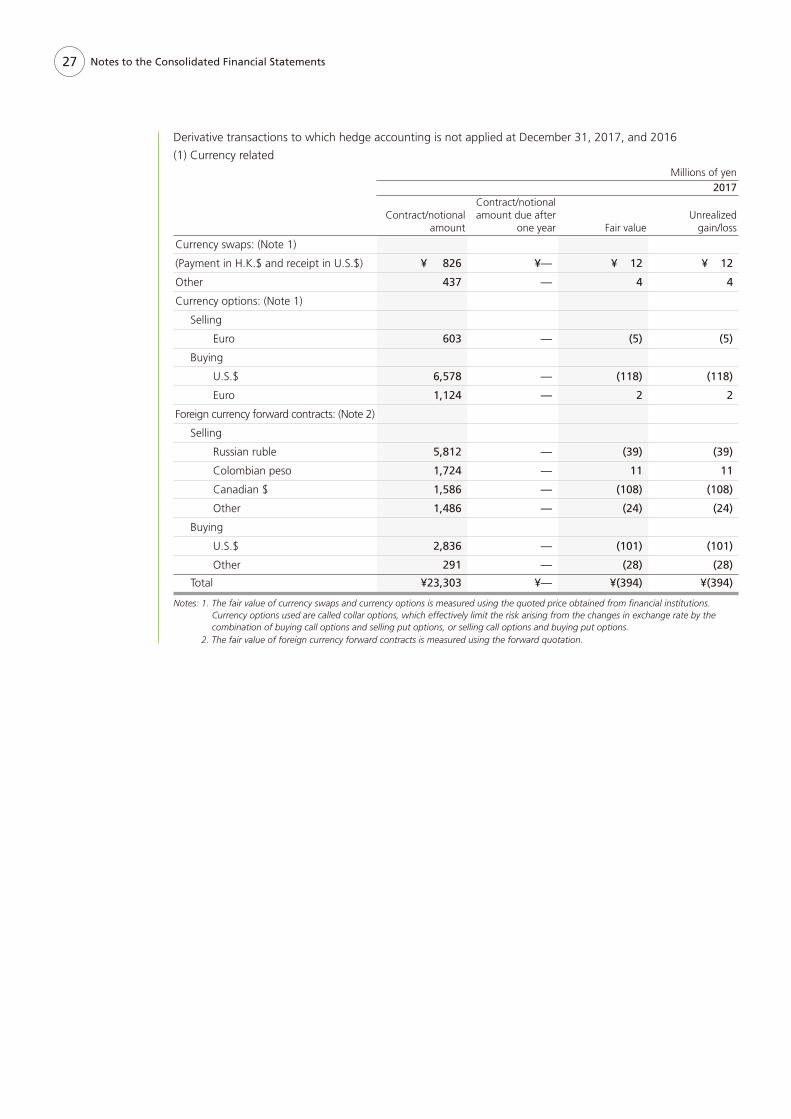
Derivative transactions to which hedge accounting is not applied at December 31, 2017, and 2016
(1) Currency relatedMillions of yen
2017
Contract/notional amount
Contract/notional amount due after
one year Fair valueUnrealized
gain/loss
Currency swaps: (Note 1)
(Payment in H.K.$ and receipt in U.S.$) ¥ 826 ¥— ¥ 12 ¥ 12
Other 437 — 4 4
Currency options: (Note 1)
Selling
Euro 603 — (5) (5)
Buying
U.S.$ 6,578 — (118) (118)
Euro 1,124 — 2 2
Foreign currency forward contracts: (Note 2)
Selling
Russian ruble 5,812 — (39) (39)
Colombian peso 1,724 — 11 11
Canadian $ 1,586 — (108) (108)
Other 1,486 — (24) (24)
Buying
U.S.$ 2,836 — (101) (101)
Other 291 — (28) (28)
Total ¥23,303 ¥— ¥(394) ¥(394)
Notes: 1. The fair value of currency swaps and currency options is measured using the quoted price obtained from fi nancial institutions. Currency options used are called collar options, which effectively limit the risk arising from the changes in exchange rate by the combination of buying call options and selling put options, or selling call options and buying put options.
2. The fair value of foreign currency forward contracts is measured using the forward quotation.
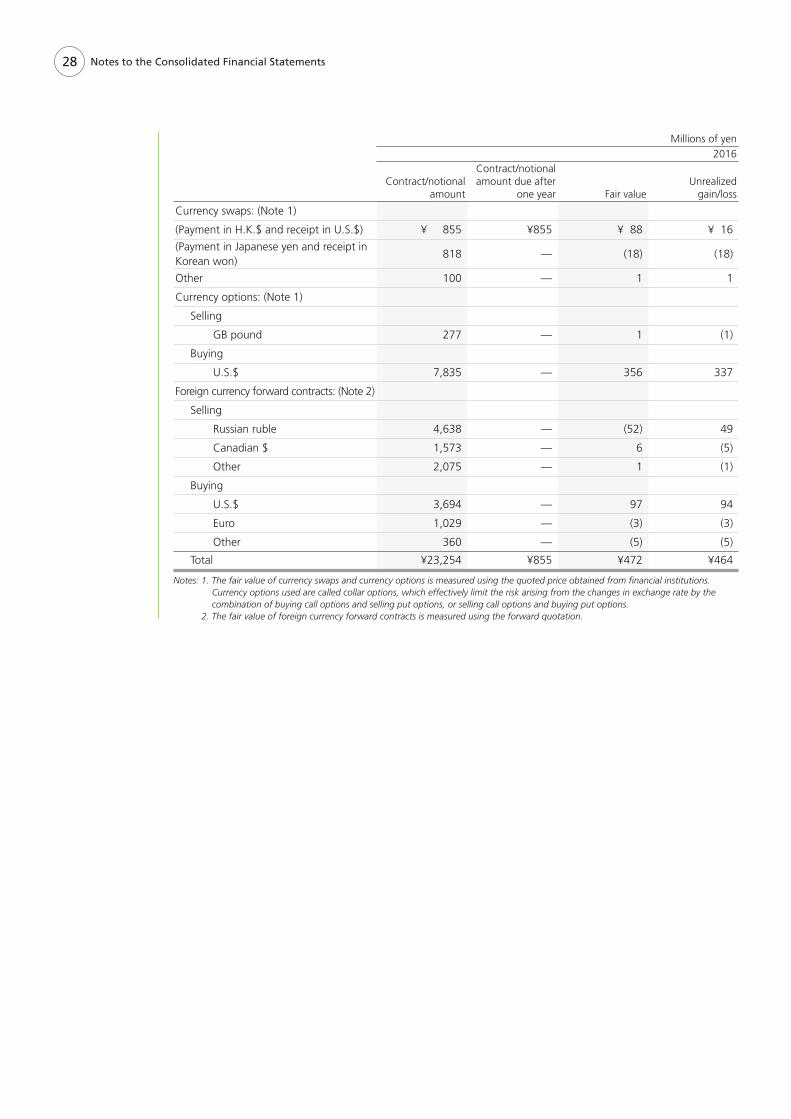
28
Millions of yen2016
Contract/notional amount
Contract/notional amount due after
one year Fair valueUnrealized
gain/loss
Currency swaps: (Note 1)
(Payment in H.K.$ and receipt in U.S.$) ¥ 855 ¥855 ¥ 88 ¥ 16
(Payment in Japanese yen and receipt in Korean won)
818 — (18) (18)
Other 100 — 1 1
Currency options: (Note 1)
Selling
GB pound 277 — 1 (1)
Buying
U.S.$ 7,835 — 356 337
Foreign currency forward contracts: (Note 2)
Selling
Russian ruble 4,638 — (52) 49
Canadian $ 1,573 — 6 (5)
Other 2,075 — 1 (1)
Buying
U.S.$ 3,694 — 97 94
Euro 1,029 — (3) (3)
Other 360 — (5) (5)
Total ¥23,254 ¥855 ¥472 ¥464
Notes: 1. The fair value of currency swaps and currency options is measured using the quoted price obtained from fi nancial institutions. Currency options used are called collar options, which effectively limit the risk arising from the changes in exchange rate by the combination of buying call options and selling put options, or selling call options and buying put options.
2. The fair value of foreign currency forward contracts is measured using the forward quotation.
Notes to the Consolidated Financial Statements
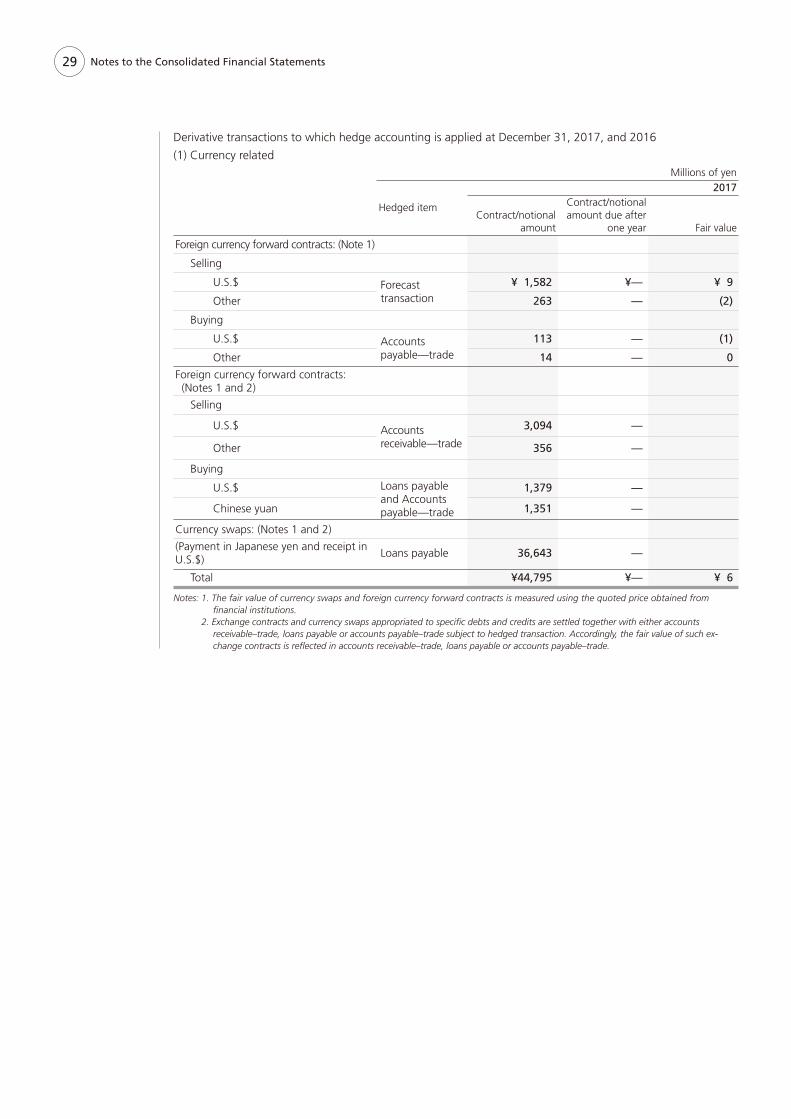
29 Notes to the Consolidated Financial Statements
Derivative transactions to which hedge accounting is applied at December 31, 2017, and 2016
(1) Currency relatedMillions of yen
Hedged item
2017
Contract/notionalamount
Contract/notional amount due after
one year Fair value
Foreign currency forward contracts: (Note 1)
Selling
U.S.$ Forecast transaction
¥ 1,582 ¥— ¥ 9
Other 263 — (2)
Buying
U.S.$ Accounts payable—trade
113 — (1)
Other 14 — 0
Foreign currency forward contracts: (Notes 1 and 2)
Selling
U.S.$ Accounts receivable—trade
3,094 —
Other 356 —
Buying
U.S.$ Loans payable and Accounts payable—trade
1,379 —
Chinese yuan 1,351 —
Currency swaps: (Notes 1 and 2)
(Payment in Japanese yen and receipt inU.S.$)
Loans payable 36,643 —
Total ¥44,795 ¥— ¥ 6
Notes: 1. The fair value of currency swaps and foreign currency forward contracts is measured using the quoted price obtained from fi nancial institutions.
2. Exchange contracts and currency swaps appropriated to specifi c debts and credits are settled together with either accounts receivable–trade, loans payable or accounts payable–trade subject to hedged transaction. Accordingly, the fair value of such ex-change contracts is refl ected in accounts receivable–trade, loans payable or accounts payable–trade.
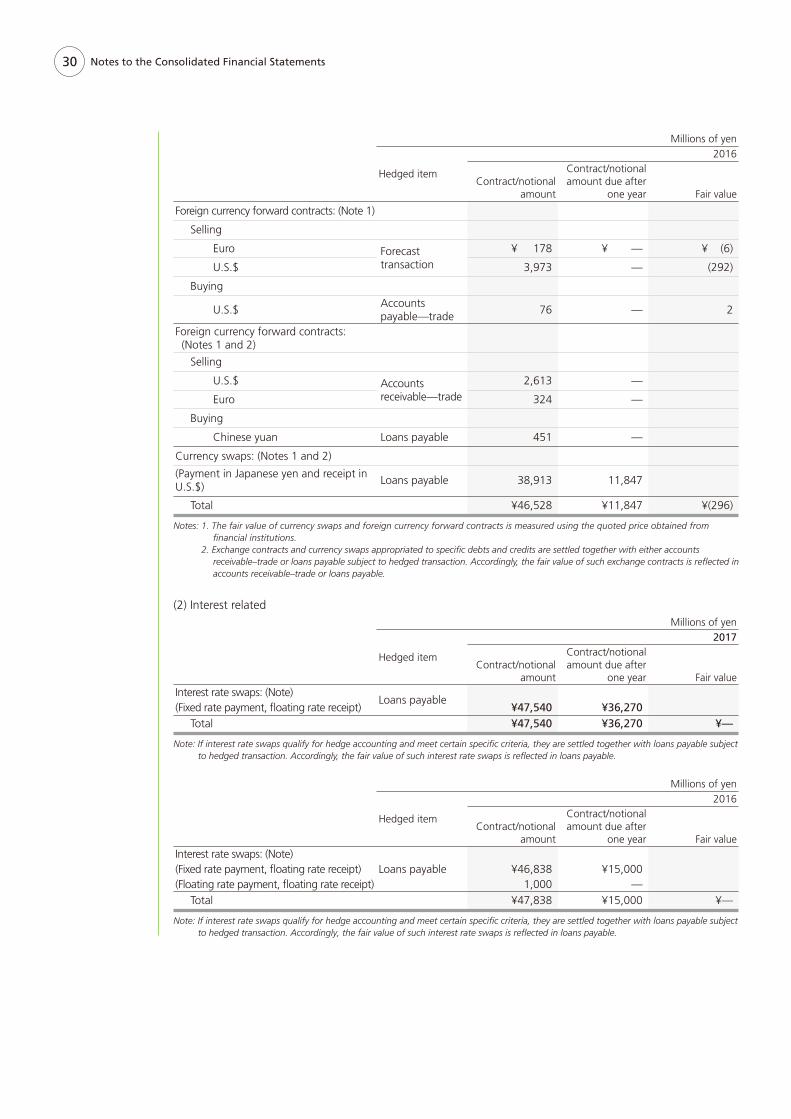
30
Millions of yen
Hedged item
2016
Contract/notionalamount
Contract/notional amount due after
one year Fair value
Foreign currency forward contracts: (Note 1)
Selling
Euro Forecast transaction
¥ 178 ¥ — ¥ (6)
U.S.$ 3,973 — (292)
Buying
U.S.$Accounts payable—trade
76 — 2
Foreign currency forward contracts: (Notes 1 and 2)
Selling
U.S.$ Accounts receivable—trade
2,613 —
Euro 324 —
Buying
Chinese yuan Loans payable 451 —
Currency swaps: (Notes 1 and 2)
(Payment in Japanese yen and receipt inU.S.$)
Loans payable 38,913 11,847
Total ¥46,528 ¥11,847 ¥(296)
Notes: 1. The fair value of currency swaps and foreign currency forward contracts is measured using the quoted price obtained from fi nancial institutions.
2. Exchange contracts and currency swaps appropriated to specifi c debts and credits are settled together with either accounts receivable–trade or loans payable subject to hedged transaction. Accordingly, the fair value of such exchange contracts is refl ected in accounts receivable–trade or loans payable.
(2) Interest relatedMillions of yen
Hedged item
2017
Contract/notionalamount
Contract/notional amount due after
one year Fair valueInterest rate swaps: (Note)(Fixed rate payment, fl oating rate receipt)
Loans payable¥47,540 ¥36,270
Total ¥47,540 ¥36,270 ¥—
Note: If interest rate swaps qualify for hedge accounting and meet certain specifi c criteria, they are settled together with loans payable subject to hedged transaction. Accordingly, the fair value of such interest rate swaps is refl ected in loans payable.
Millions of yen
Hedged item
2016
Contract/notionalamount
Contract/notional amount due after
one year Fair valueInterest rate swaps: (Note)(Fixed rate payment, fl oating rate receipt)(Floating rate payment, fl oating rate receipt)
Loans payable ¥46,8381,000
¥15,000—
Total ¥47,838 ¥15,000 ¥—
Note: If interest rate swaps qualify for hedge accounting and meet certain specifi c criteria, they are settled together with loans payable subject to hedged transaction. Accordingly, the fair value of such interest rate swaps is refl ected in loans payable.
Notes to the Consolidated Financial Statements
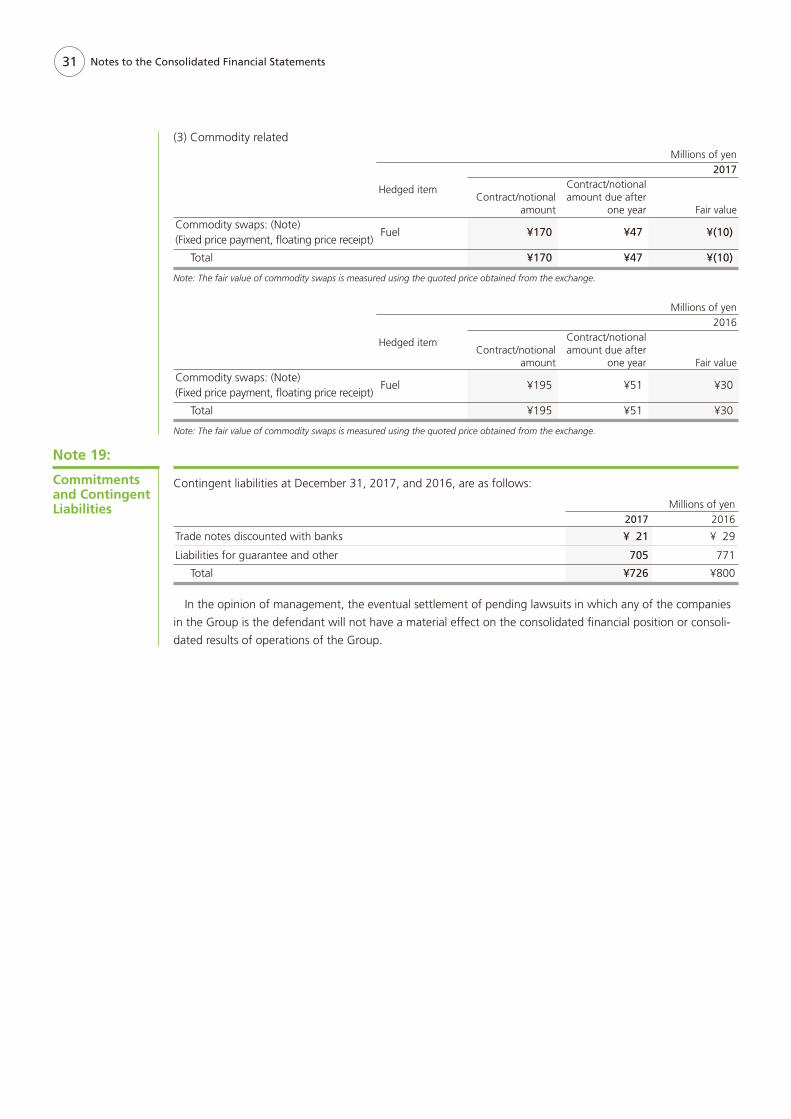
31 Notes to the Consolidated Financial Statements
Contingent liabilities at December 31, 2017, and 2016, are as follows:
Millions of yen2017 2016
Trade notes discounted with banks ¥ 21 ¥ 29
Liabilities for guarantee and other 705 771
Total ¥726 ¥800
In the opinion of management, the eventual settlement of pending lawsuits in which any of the companies
in the Group is the defendant will not have a material effect on the consolidated fi nancial position or consoli-
dated results of operations of the Group.
Note 19:
Commitments and Contingent Liabilities
(3) Commodity relatedMillions of yen
Hedged item
2017
Contract/notionalamount
Contract/notional amount due after
one year Fair valueCommodity swaps: (Note)(Fixed price payment, fl oating price receipt)
Fuel ¥170 ¥47 ¥(10)
Total ¥170 ¥47 ¥(10)
Note: The fair value of commodity swaps is measured using the quoted price obtained from the exchange.
Millions of yen
Hedged item
2016
Contract/notionalamount
Contract/notional amount due after
one year Fair valueCommodity swaps: (Note)(Fixed price payment, fl oating price receipt)
Fuel ¥195 ¥51 ¥30
Total ¥195 ¥51 ¥30
Note: The fair value of commodity swaps is measured using the quoted price obtained from the exchange.
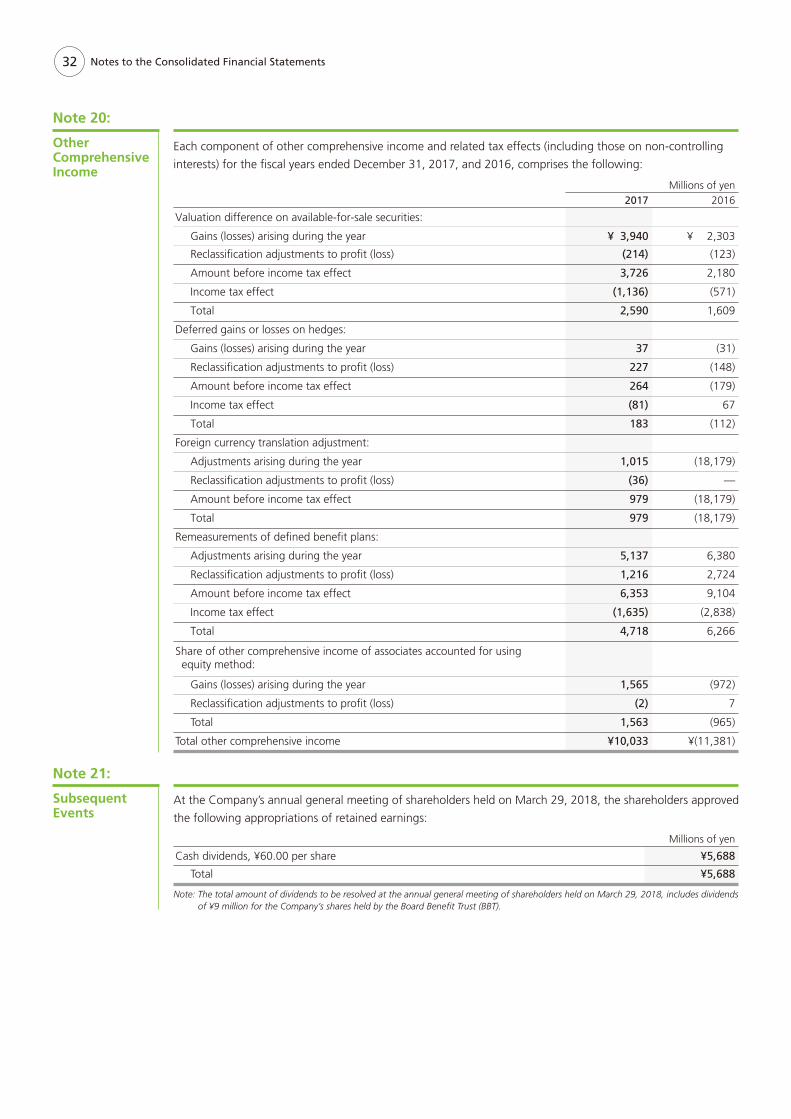
32 Notes to the Consolidated Financial Statements
Each component of other comprehensive income and related tax effects (including those on non-controlling
interests) for the fi scal years ended December 31, 2017, and 2016, comprises the following:
Millions of yen2017 2016
Valuation difference on available-for-sale securities:
Gains (losses) arising during the year ¥ 3,940 ¥ 2,303
Reclassifi cation adjustments to profi t (loss) (214) (123)
Amount before income tax effect 3,726 2,180
Income tax effect (1,136) (571)
Total 2,590 1,609
Deferred gains or losses on hedges:
Gains (losses) arising during the year 37 (31)
Reclassifi cation adjustments to profi t (loss) 227 (148)
Amount before income tax effect 264 (179)
Income tax effect (81) 67
Total 183 (112)
Foreign currency translation adjustment:
Adjustments arising during the year 1,015 (18,179)
Reclassifi cation adjustments to profi t (loss) (36) —
Amount before income tax effect 979 (18,179)
Total 979 (18,179)
Remeasurements of defi ned benefi t plans:
Adjustments arising during the year 5,137 6,380
Reclassifi cation adjustments to profi t (loss) 1,216 2,724
Amount before income tax effect 6,353 9,104
Income tax effect (1,635) (2,838)
Total 4,718 6,266
Share of other comprehensive income of associates accounted for using equity method:
Gains (losses) arising during the year 1,565 (972)
Reclassifi cation adjustments to profi t (loss) (2) 7
Total 1,563 (965)
Total other comprehensive income ¥10,033 ¥(11,381)
Note 20:
Other Comprehensive Income
At the Company’s annual general meeting of shareholders held on March 29, 2018, the shareholders approved
the following appropriations of retained earnings:
Millions of yen
Cash dividends, ¥60.00 per share ¥5,688
Total ¥5,688
Note: The total amount of dividends to be resolved at the annual general meeting of shareholders held on March 29, 2018, includes dividends of ¥9 million for the Company’s shares held by the Board Benefi t Trust (BBT).
Note 21:
Subsequent Events
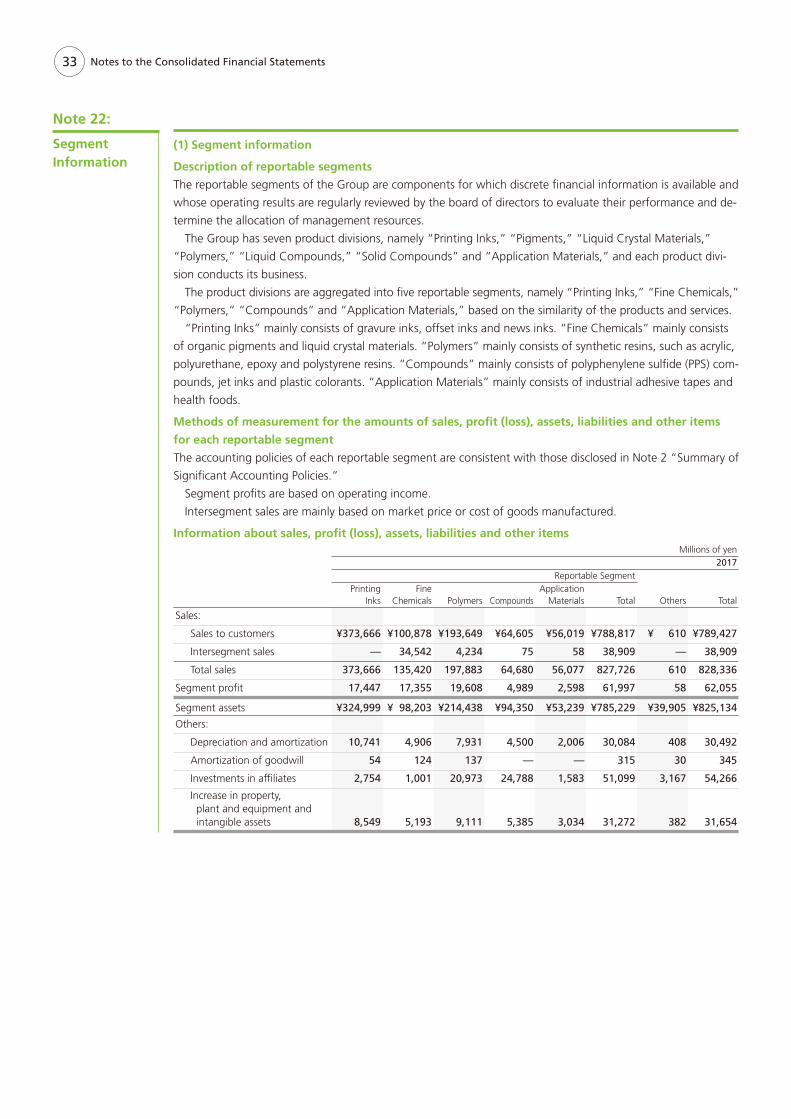
33 Notes to the Consolidated Financial Statements
(1) Segment information
Description of reportable segments
The reportable segments of the Group are components for which discrete fi nancial information is available and
whose operating results are regularly reviewed by the board of directors to evaluate their performance and de-
termine the allocation of management resources.
The Group has seven product divisions, namely “Printing Inks,” “Pigments,” “Liquid Crystal Materials,”
“Polymers,” “Liquid Compounds,” “Solid Compounds” and “Application Materials,” and each product divi-
sion conducts its business.
The product divisions are aggregated into fi ve reportable segments, namely “Printing Inks,” “Fine Chemicals,”
“Polymers,” “Compounds” and “Application Materials,” based on the similarity of the products and services.
“Printing Inks” mainly consists of gravure inks, offset inks and news inks. “Fine Chemicals” mainly consists
of organic pigments and liquid crystal materials. “Polymers” mainly consists of synthetic resins, such as acrylic,
polyurethane, epoxy and polystyrene resins. “Compounds” mainly consists of polyphenylene sulfi de (PPS) com-
pounds, jet inks and plastic colorants. “Application Materials” mainly consists of industrial adhesive tapes and
health foods.
Methods of measurement for the amounts of sales, profi t (loss), assets, liabilities and other items
for each reportable segment
The accounting policies of each reportable segment are consistent with those disclosed in Note 2 “Summary of
Signifi cant Accounting Policies.”
Segment profi ts are based on operating income.
Intersegment sales are mainly based on market price or cost of goods manufactured.
Information about sales, profi t (loss), assets, liabilities and other itemsMillions of yen
2017Reportable Segment
Others TotalPrinting
InksFine
Chemicals Polymers CompoundsApplication
Materials Total
Sales:
Sales to customers ¥373,666 ¥100,878 ¥193,649 ¥64,605 ¥56,019 ¥788,817 ¥ 610 ¥789,427
Intersegment sales — 34,542 4,234 75 58 38,909 — 38,909
Total sales 373,666 135,420 197,883 64,680 56,077 827,726 610 828,336
Segment profi t 17,447 17,355 19,608 4,989 2,598 61,997 58 62,055
Segment assets ¥324,999 ¥ 98,203 ¥214,438 ¥94,350 ¥53,239 ¥785,229 ¥39,905 ¥825,134
Others:
Depreciation and amortization 10,741 4,906 7,931 4,500 2,006 30,084 408 30,492
Amortization of goodwill 54 124 137 — — 315 30 345
Investments in affi liates 2,754 1,001 20,973 24,788 1,583 51,099 3,167 54,266
Increase in property, plant and equipment and intangible assets 8,549 5,193 9,111 5,385 3,034 31,272 382 31,654
Note 22:
Segment Information
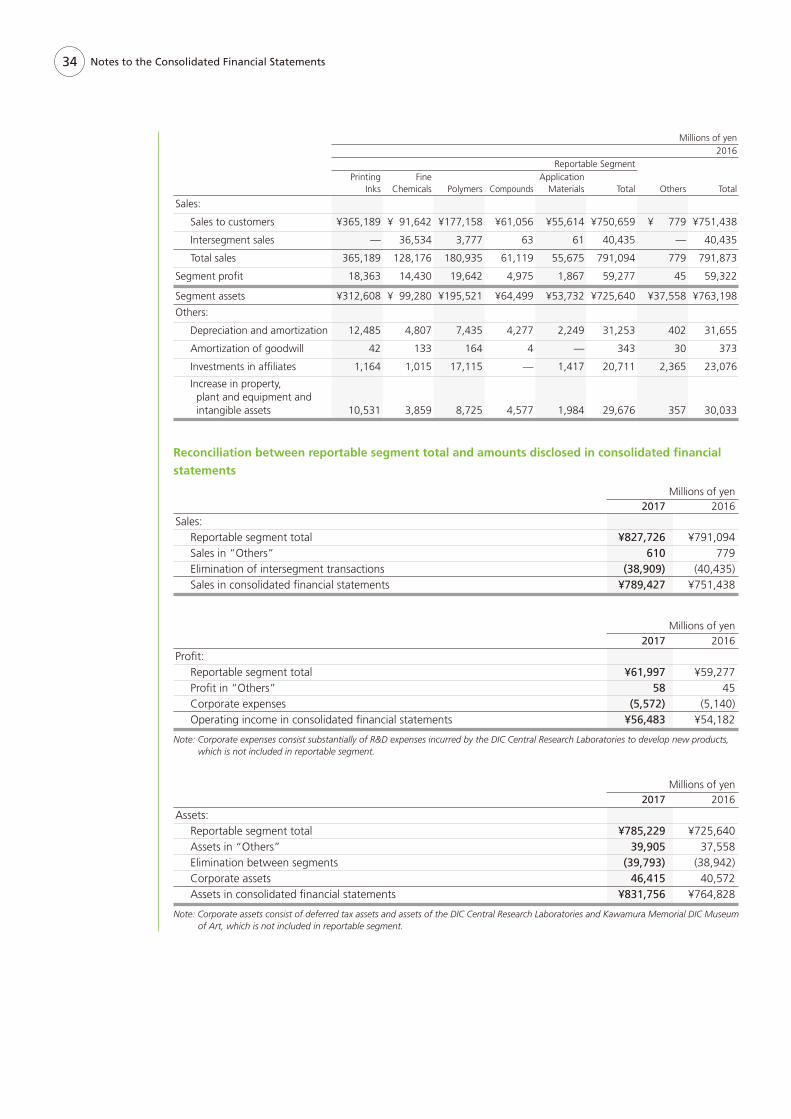
34 Notes to the Consolidated Financial Statements
Millions of yen2016
Reportable Segment
Others TotalPrinting
InksFine
Chemicals Polymers CompoundsApplication
Materials Total
Sales:
Sales to customers ¥365,189 ¥ 91,642 ¥177,158 ¥61,056 ¥55,614 ¥750,659 ¥ 779 ¥751,438
Intersegment sales — 36,534 3,777 63 61 40,435 — 40,435
Total sales 365,189 128,176 180,935 61,119 55,675 791,094 779 791,873
Segment profi t 18,363 14,430 19,642 4,975 1,867 59,277 45 59,322
Segment assets ¥312,608 ¥ 99,280 ¥195,521 ¥64,499 ¥53,732 ¥725,640 ¥37,558 ¥763,198
Others:
Depreciation and amortization 12,485 4,807 7,435 4,277 2,249 31,253 402 31,655
Amortization of goodwill 42 133 164 4 — 343 30 373
Investments in affi liates 1,164 1,015 17,115 — 1,417 20,711 2,365 23,076
Increase in property, plant and equipment and intangible assets 10,531 3,859 8,725 4,577 1,984 29,676 357 30,033
Reconciliation between reportable segment total and amounts disclosed in consolidated fi nancial
statements
Millions of yen2017 2016
Sales: Reportable segment total ¥827,726 ¥791,094 Sales in “Others” 610 779 Elimination of intersegment transactions (38,909) (40,435) Sales in consolidated fi nancial statements ¥789,427 ¥751,438
Millions of yen2017 2016
Profi t: Reportable segment total ¥61,997 ¥59,277 Profi t in “Others” 58 45 Corporate expenses (5,572) (5,140) Operating income in consolidated fi nancial statements ¥56,483 ¥54,182
Note: Corporate expenses consist substantially of R&D expenses incurred by the DIC Central Research Laboratories to develop new products, which is not included in reportable segment.
Millions of yen2017 2016
Assets: Reportable segment total ¥785,229 ¥725,640 Assets in “Others” 39,905 37,558 Elimination between segments (39,793) (38,942) Corporate assets 46,415 40,572 Assets in consolidated fi nancial statements ¥831,756 ¥764,828
Note: Corporate assets consist of deferred tax assets and assets of the DIC Central Research Laboratories and Kawamura Memorial DIC Museum of Art, which is not included in reportable segment.
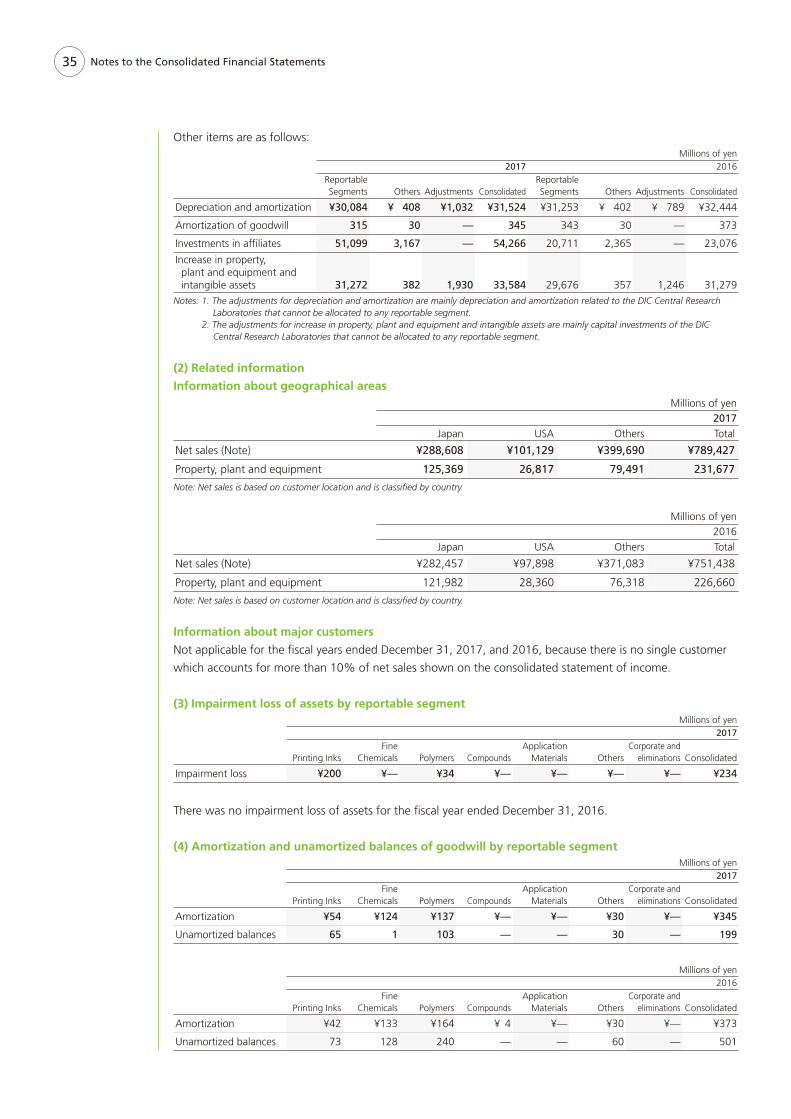
35 Notes to the Consolidated Financial Statements
Other items are as follows:Millions of yen
2017 2016Reportable Segments Others Adjustments Consolidated
Reportable Segments Others Adjustments Consolidated
Depreciation and amortization ¥30,084 ¥ 408 ¥1,032 ¥31,524 ¥31,253 ¥ 402 ¥ 789 ¥32,444
Amortization of goodwill 315 30 — 345 343 30 — 373
Investments in affi liates 51,099 3,167 — 54,266 20,711 2,365 — 23,076
Increase in property, plant and equipment and intangible assets 31,272 382 1,930 33,584 29,676 357 1,246 31,279Notes: 1. The adjustments for depreciation and amortization are mainly depreciation and amortization related to the DIC Central Research
Laboratories that cannot be allocated to any reportable segment. 2. The adjustments for increase in property, plant and equipment and intangible assets are mainly capital investments of the DIC
Central Research Laboratories that cannot be allocated to any reportable segment.
(2) Related information
Information about geographical areasMillions of yen
2017Japan USA Others Total
Net sales (Note) ¥288,608 ¥101,129 ¥399,690 ¥789,427
Property, plant and equipment 125,369 26,817 79,491 231,677
Note: Net sales is based on customer location and is classifi ed by country.
Millions of yen2016
Japan USA Others Total
Net sales (Note) ¥282,457 ¥97,898 ¥371,083 ¥751,438
Property, plant and equipment 121,982 28,360 76,318 226,660
Note: Net sales is based on customer location and is classifi ed by country.
Information about major customers
Not applicable for the fi scal years ended December 31, 2017, and 2016, because there is no single customer
which accounts for more than 10% of net sales shown on the consolidated statement of income.
(3) Impairment loss of assets by reportable segmentMillions of yen
2017
Printing InksFine
Chemicals Polymers CompoundsApplication
Materials OthersCorporate and
eliminations Consolidated
Impairment loss ¥200 ¥— ¥34 ¥— ¥— ¥— ¥— ¥234
There was no impairment loss of assets for the fi scal year ended December 31, 2016.
(4) Amortization and unamortized balances of goodwill by reportable segmentMillions of yen
2017
Printing InksFine
Chemicals Polymers CompoundsApplication
Materials OthersCorporate and
eliminations Consolidated
Amortization ¥54 ¥124 ¥137 ¥— ¥— ¥30 ¥— ¥345
Unamortized balances 65 1 103 — — 30 — 199
Millions of yen2016
Printing InksFine
Chemicals Polymers CompoundsApplication
Materials OthersCorporate and
eliminations Consolidated
Amortization ¥42 ¥133 ¥164 ¥ 4 ¥— ¥30 ¥— ¥373
Unamortized balances 73 128 240 — — 60 — 501
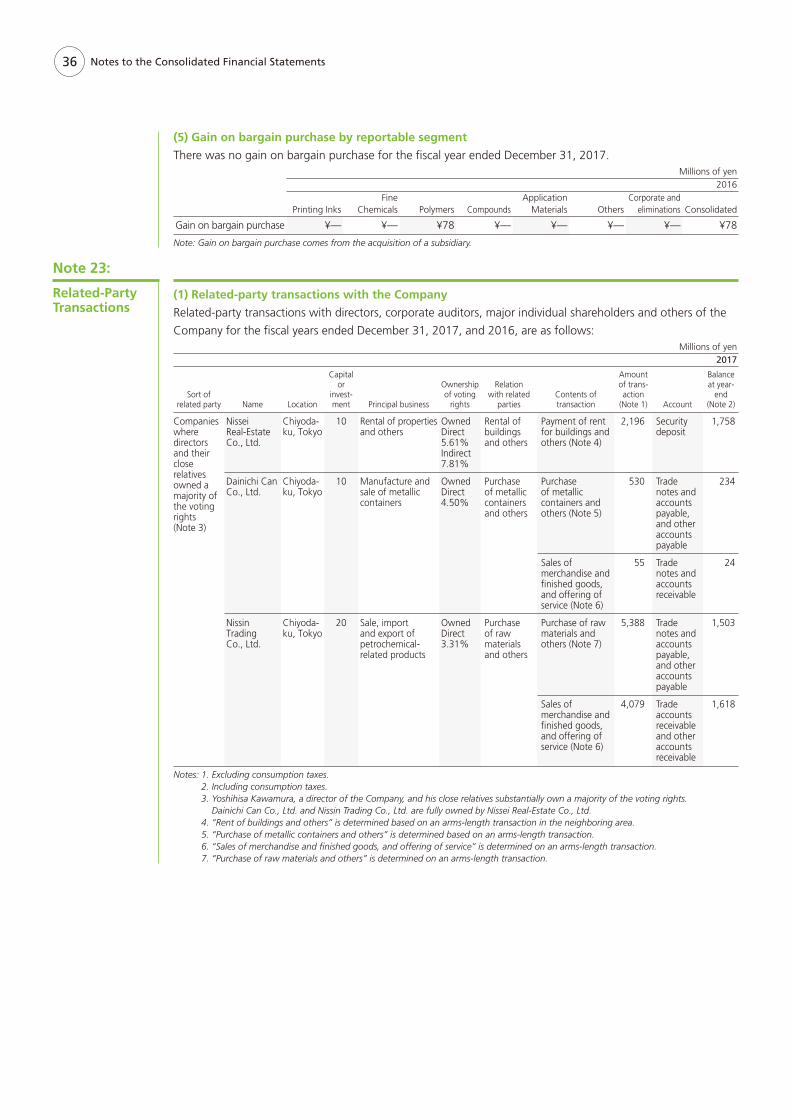
36 Notes to the Consolidated Financial Statements
(1) Related-party transactions with the Company
Related-party transactions with directors, corporate auditors, major individual shareholders and others of the
Company for the fi scal years ended December 31, 2017, and 2016, are as follows:Millions of yen
2017
Sort of related party Name Location
Capital or
invest-ment Principal business
Ownership of voting
rights
Relation with related
partiesContents of transaction
Amount of trans-action
(Note 1) Account
Balance at year-
end (Note 2)
Companies where directors and their close relatives owned a majority of the voting rights (Note 3)
Nissei Real-Estate Co., Ltd.
Chiyoda-ku, Tokyo
10 Rental of properties and others
Owned Direct 5.61% Indirect 7.81%
Rental of buildings and others
Payment of rent for buildings and others (Note 4)
2,196 Security deposit
1,758
Dainichi Can Co., Ltd.
Chiyoda-ku, Tokyo
10 Manufacture and sale of metallic containers
Owned Direct 4.50%
Purchase of metallic containers and others
Purchase of metallic containers and others (Note 5)
530 Trade notes and accounts payable, and other accounts payable
234
Sales of merchandise and fi nished goods, and offering of service (Note 6)
55 Trade notes and accounts receivable
24
Nissin Trading Co., Ltd.
Chiyoda-ku, Tokyo
20 Sale, import and export of petrochemical-related products
Owned Direct 3.31%
Purchase of raw materials and others
Purchase of raw materials and others (Note 7)
5,388 Trade notes and accounts payable, and other accounts payable
1,503
Sales of merchandise and fi nished goods, and offering of service (Note 6)
4,079 Trade accounts receivable and other accounts receivable
1,618
Notes: 1. Excluding consumption taxes. 2. Including consumption taxes. 3. Yoshihisa Kawamura, a director of the Company, and his close relatives substantially own a majority of the voting rights.
Dainichi Can Co., Ltd. and Nissin Trading Co., Ltd. are fully owned by Nissei Real-Estate Co., Ltd. 4. “Rent of buildings and others” is determined based on an arms-length transaction in the neighboring area. 5. “Purchase of metallic containers and others” is determined based on an arms-length transaction. 6. “Sales of merchandise and fi nished goods, and offering of service” is determined on an arms-length transaction. 7. “Purchase of raw materials and others” is determined on an arms-length transaction.
Note 23:
Related-Party Transactions
(5) Gain on bargain purchase by reportable segment
There was no gain on bargain purchase for the fi scal year ended December 31, 2017.Millions of yen
2016
Printing InksFine
Chemicals Polymers CompoundsApplication
Materials OthersCorporate and
eliminations Consolidated
Gain on bargain purchase ¥— ¥— ¥78 ¥— ¥— ¥— ¥— ¥78
Note: Gain on bargain purchase comes from the acquisition of a subsidiary.
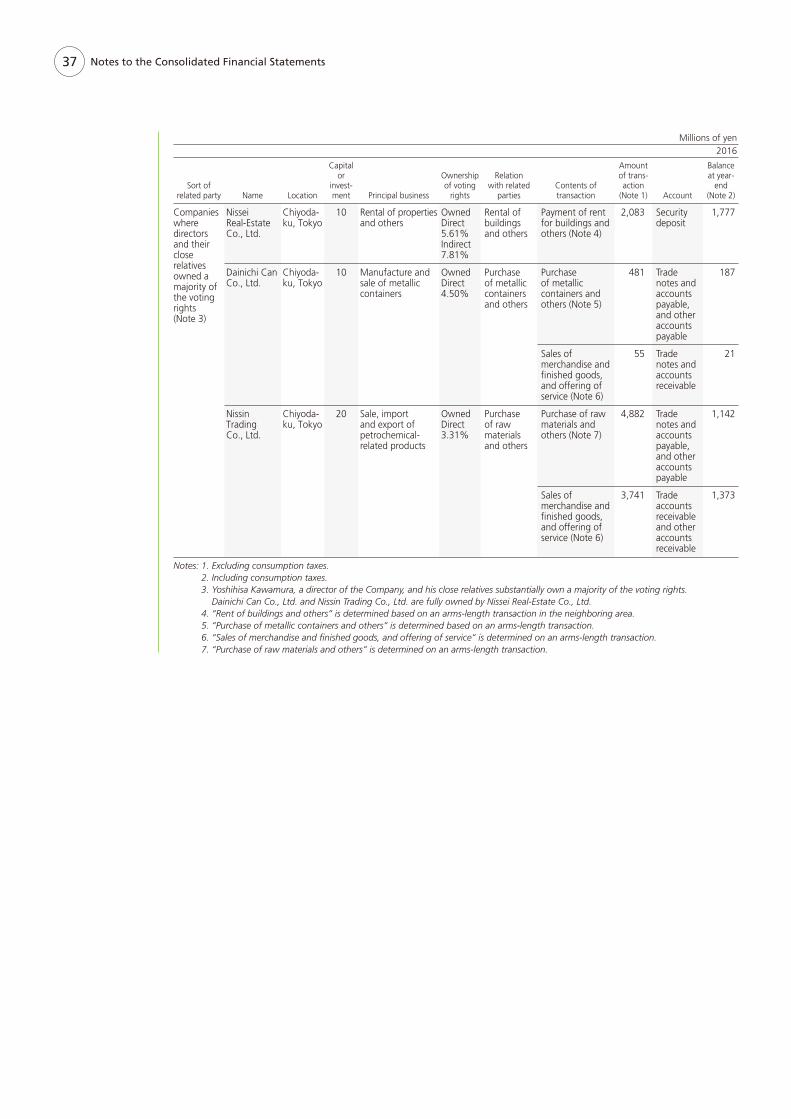
37 Notes to the Consolidated Financial Statements
Millions of yen2016
Sort of related party Name Location
Capital or
invest-ment Principal business
Ownership of voting
rights
Relation with related
partiesContents of transaction
Amount of trans-action
(Note 1) Account
Balance at year-
end (Note 2)
Companies where directors and their close relatives owned a majority of the voting rights (Note 3)
Nissei Real-Estate Co., Ltd.
Chiyoda-ku, Tokyo
10 Rental of properties and others
Owned Direct 5.61% Indirect 7.81%
Rental of buildings and others
Payment of rent for buildings and others (Note 4)
2,083 Security deposit
1,777
Dainichi Can Co., Ltd.
Chiyoda-ku, Tokyo
10 Manufacture and sale of metallic containers
Owned Direct 4.50%
Purchase of metallic containers and others
Purchase of metallic containers and others (Note 5)
481 Trade notes and accounts payable, and other accounts payable
187
Sales of merchandise and fi nished goods, and offering of service (Note 6)
55 Trade notes and accounts receivable
21
Nissin Trading Co., Ltd.
Chiyoda-ku, Tokyo
20 Sale, import and export of petrochemical-related products
Owned Direct 3.31%
Purchase of raw materials and others
Purchase of raw materials and others (Note 7)
4,882 Trade notes and accounts payable, and other accounts payable
1,142
Sales of merchandise and fi nished goods, and offering of service (Note 6)
3,741 Trade accounts receivable and other accounts receivable
1,373
Notes: 1. Excluding consumption taxes. 2. Including consumption taxes. 3. Yoshihisa Kawamura, a director of the Company, and his close relatives substantially own a majority of the voting rights.
Dainichi Can Co., Ltd. and Nissin Trading Co., Ltd. are fully owned by Nissei Real-Estate Co., Ltd. 4. “Rent of buildings and others” is determined based on an arms-length transaction in the neighboring area. 5. “Purchase of metallic containers and others” is determined based on an arms-length transaction. 6. “Sales of merchandise and fi nished goods, and offering of service” is determined on an arms-length transaction. 7. “Purchase of raw materials and others” is determined on an arms-length transaction.
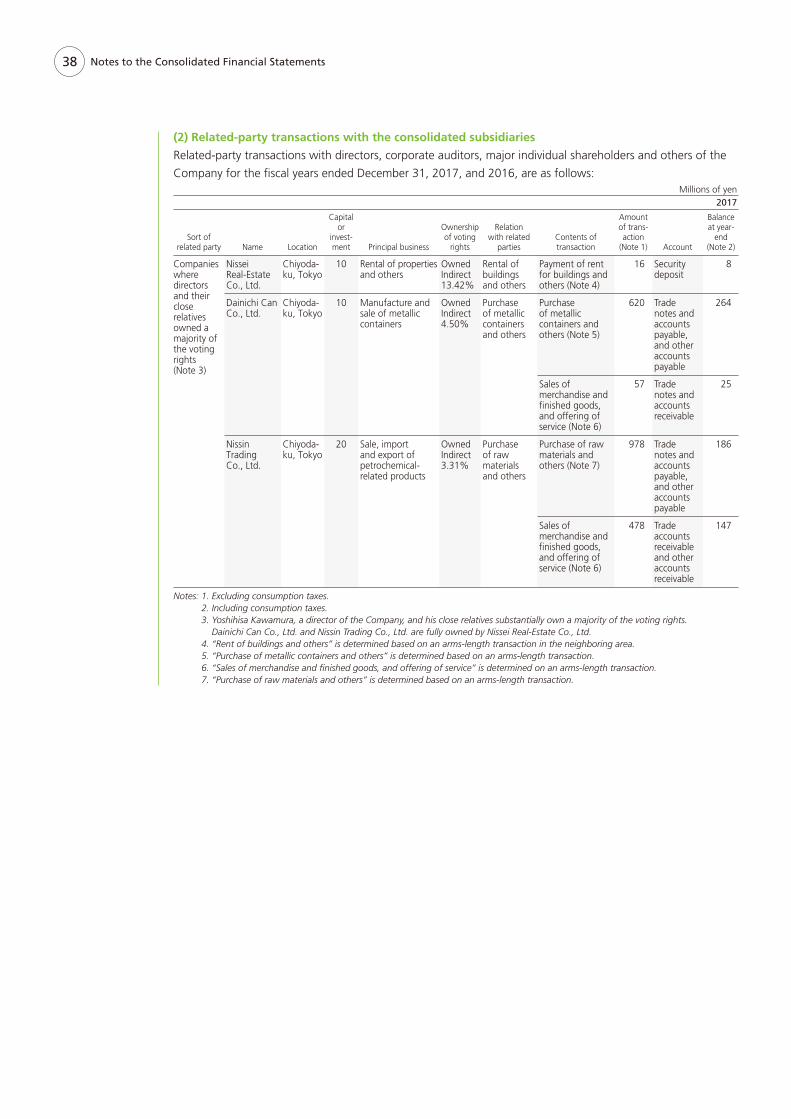
38 Notes to the Consolidated Financial Statements
(2) Related-party transactions with the consolidated subsidiaries
Related-party transactions with directors, corporate auditors, major individual shareholders and others of the
Company for the fi scal years ended December 31, 2017, and 2016, are as follows:Millions of yen
2017
Sort of related party Name Location
Capital or
invest-ment Principal business
Ownership of voting
rights
Relation with related
partiesContents of transaction
Amount of trans-action
(Note 1) Account
Balance at year-
end (Note 2)
Companies where directors and their close relatives owned a majority of the voting rights (Note 3)
Nissei Real-Estate Co., Ltd.
Chiyoda-ku, Tokyo
10 Rental of properties and others
Owned Indirect 13.42%
Rental of buildings and others
Payment of rent for buildings and others (Note 4)
16 Security deposit
8
Dainichi Can Co., Ltd.
Chiyoda-ku, Tokyo
10 Manufacture and sale of metallic containers
Owned Indirect 4.50%
Purchase of metallic containers and others
Purchase of metallic containers and others (Note 5)
620 Trade notes and accounts payable, and other accounts payable
264
Sales of merchandise and fi nished goods, and offering of service (Note 6)
57 Trade notes and accounts receivable
25
Nissin Trading Co., Ltd.
Chiyoda-ku, Tokyo
20 Sale, import and export of petrochemical-related products
Owned Indirect 3.31%
Purchase of raw materials and others
Purchase of raw materials and others (Note 7)
978 Trade notes and accounts payable, and other accounts payable
186
Sales of merchandise and fi nished goods, and offering of service (Note 6)
478 Trade accounts receivable and other accounts receivable
147
Notes: 1. Excluding consumption taxes. 2. Including consumption taxes. 3. Yoshihisa Kawamura, a director of the Company, and his close relatives substantially own a majority of the voting rights.
Dainichi Can Co., Ltd. and Nissin Trading Co., Ltd. are fully owned by Nissei Real-Estate Co., Ltd. 4. “Rent of buildings and others” is determined based on an arms-length transaction in the neighboring area. 5. “Purchase of metallic containers and others” is determined based on an arms-length transaction. 6. “Sales of merchandise and fi nished goods, and offering of service” is determined on an arms-length transaction. 7. “Purchase of raw materials and others” is determined based on an arms-length transaction.
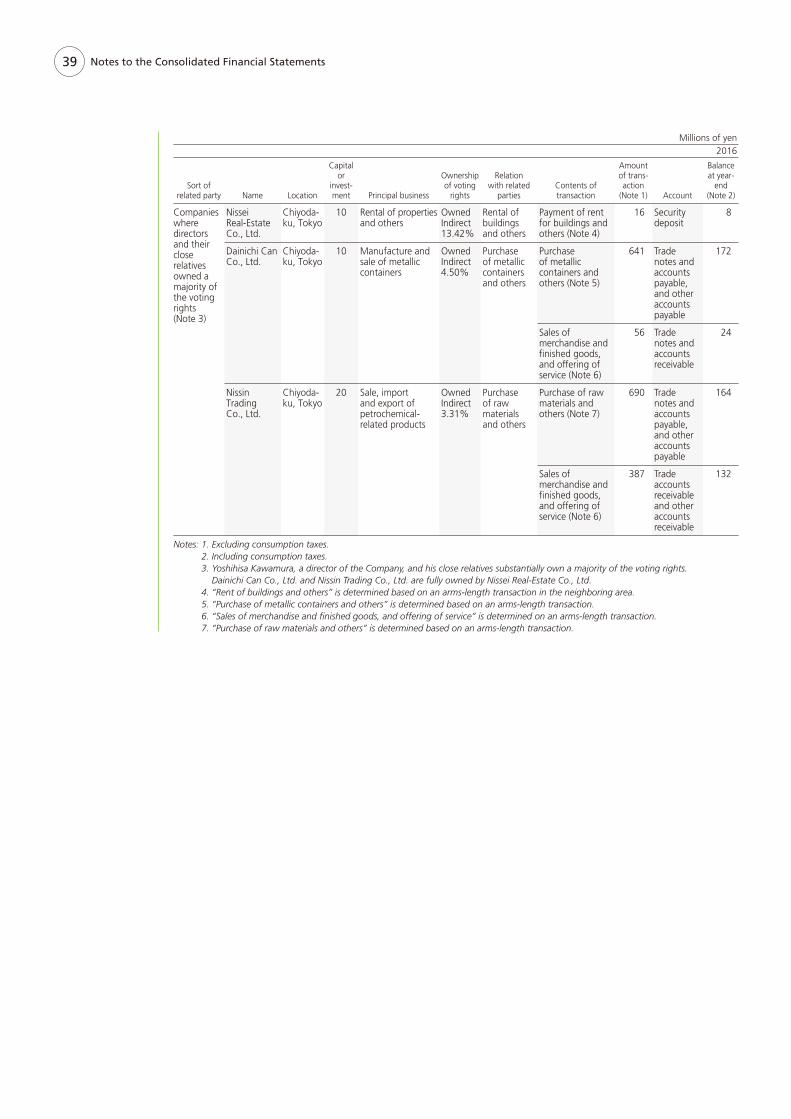
39
Millions of yen2016
Sort of related party Name Location
Capital or
invest-ment Principal business
Ownership of voting
rights
Relation with related
partiesContents of transaction
Amount of trans-action
(Note 1) Account
Balance at year-
end (Note 2)
Companies where directors and their close relatives owned a majority of the voting rights (Note 3)
Nissei Real-Estate Co., Ltd.
Chiyoda-ku, Tokyo
10 Rental of properties and others
Owned Indirect 13.42%
Rental of buildings and others
Payment of rent for buildings and others (Note 4)
16 Security deposit
8
Dainichi Can Co., Ltd.
Chiyoda-ku, Tokyo
10 Manufacture and sale of metallic containers
Owned Indirect 4.50%
Purchase of metallic containers and others
Purchase of metallic containers and others (Note 5)
641 Trade notes and accounts payable, and other accounts payable
172
Sales of merchandise and fi nished goods, and offering of service (Note 6)
56 Trade notes and accounts receivable
24
Nissin Trading Co., Ltd.
Chiyoda-ku, Tokyo
20 Sale, import and export of petrochemical-related products
Owned Indirect 3.31%
Purchase of raw materials and others
Purchase of raw materials and others (Note 7)
690 Trade notes and accounts payable, and other accounts payable
164
Sales of merchandise and fi nished goods, and offering of service (Note 6)
387 Trade accounts receivable and other accounts receivable
132
Notes: 1. Excluding consumption taxes. 2. Including consumption taxes. 3. Yoshihisa Kawamura, a director of the Company, and his close relatives substantially own a majority of the voting rights.
Dainichi Can Co., Ltd. and Nissin Trading Co., Ltd. are fully owned by Nissei Real-Estate Co., Ltd. 4. “Rent of buildings and others” is determined based on an arms-length transaction in the neighboring area. 5. “Purchase of metallic containers and others” is determined based on an arms-length transaction. 6. “Sales of merchandise and fi nished goods, and offering of service” is determined on an arms-length transaction. 7. “Purchase of raw materials and others” is determined based on an arms-length transaction.
Notes to the Consolidated Financial Statements
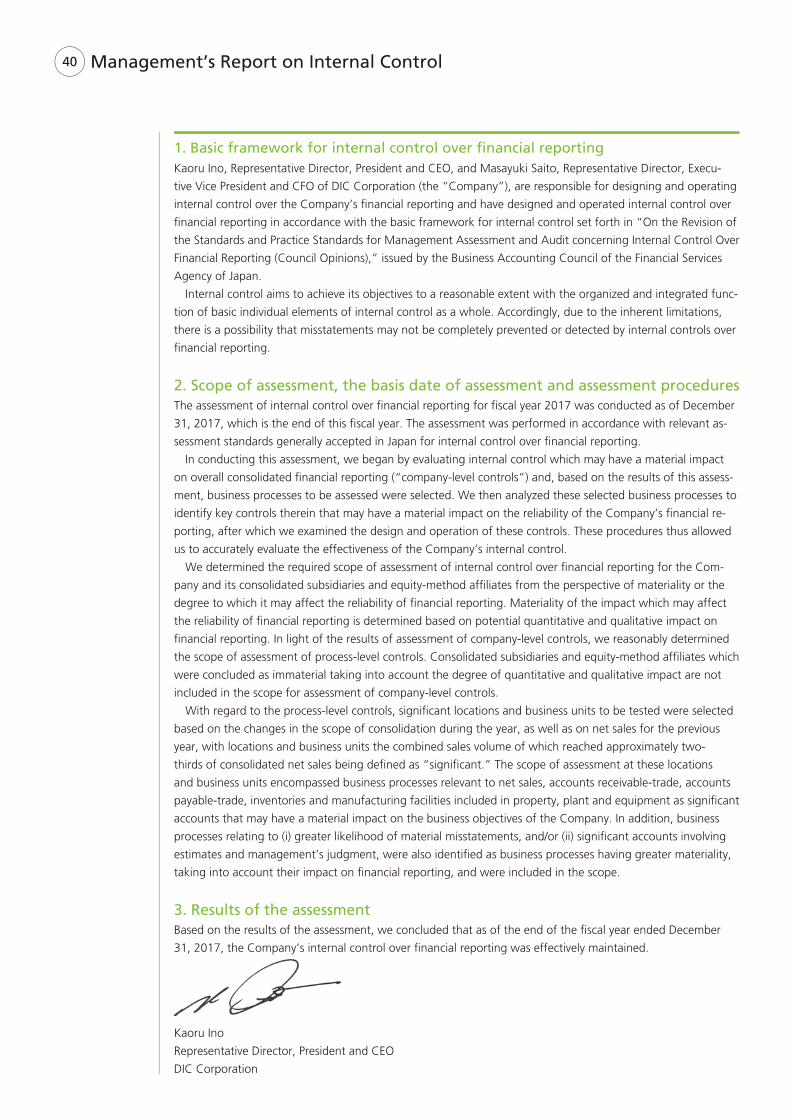
40
1. Basic framework for internal control over fi nancial reportingKaoru Ino, Representative Director, President and CEO, and Masayuki Saito, Representative Director, Execu-
tive Vice President and CFO of DIC Corporation (the “Company”), are responsible for designing and operating
internal control over the Company’s fi nancial reporting and have designed and operated internal control over
fi nancial reporting in accordance with the basic framework for internal control set forth in “On the Revision of
the Standards and Practice Standards for Management Assessment and Audit concerning Internal Control Over
Financial Reporting (Council Opinions),” issued by the Business Accounting Council of the Financial Services
Agency of Japan.
Internal control aims to achieve its objectives to a reasonable extent with the organized and integrated func-
tion of basic individual elements of internal control as a whole. Accordingly, due to the inherent limitations,
there is a possibility that misstatements may not be completely prevented or detected by internal controls over
fi nancial reporting.
2. Scope of assessment, the basis date of assessment and assessment proceduresThe assessment of internal control over fi nancial reporting for fi scal year 2017 was conducted as of December
31, 2017, which is the end of this fi scal year. The assessment was performed in accordance with relevant as-
sessment standards generally accepted in Japan for internal control over fi nancial reporting.
In conducting this assessment, we began by evaluating internal control which may have a material impact
on overall consolidated fi nancial reporting (“company-level controls”) and, based on the results of this assess-
ment, business processes to be assessed were selected. We then analyzed these selected business processes to
identify key controls therein that may have a material impact on the reliability of the Company’s fi nancial re-
porting, after which we examined the design and operation of these controls. These procedures thus allowed
us to accurately evaluate the effectiveness of the Company’s internal control.
We determined the required scope of assessment of internal control over fi nancial reporting for the Com-
pany and its consolidated subsidiaries and equity-method affi liates from the perspective of materiality or the
degree to which it may affect the reliability of fi nancial reporting. Materiality of the impact which may affect
the reliability of fi nancial reporting is determined based on potential quantitative and qualitative impact on
fi nancial reporting. In light of the results of assessment of company-level controls, we reasonably determined
the scope of assessment of process-level controls. Consolidated subsidiaries and equity-method affi liates which
were concluded as immaterial taking into account the degree of quantitative and qualitative impact are not
included in the scope for assessment of company-level controls.
With regard to the process-level controls, signifi cant locations and business units to be tested were selected
based on the changes in the scope of consolidation during the year, as well as on net sales for the previous
year, with locations and business units the combined sales volume of which reached approximately two-
thirds of consolidated net sales being defi ned as “signifi cant.” The scope of assessment at these locations
and business units encompassed business processes relevant to net sales, accounts receivable-trade, accounts
payable-trade, inventories and manufacturing facilities included in property, plant and equipment as signifi cant
accounts that may have a material impact on the business objectives of the Company. In addition, business
processes relating to (i) greater likelihood of material misstatements, and/or (ii) signifi cant accounts involving
estimates and management’s judgment, were also identifi ed as business processes having greater materiality,
taking into account their impact on fi nancial reporting, and were included in the scope.
3. Results of the assessmentBased on the results of the assessment, we concluded that as of the end of the fi scal year ended December
31, 2017, the Company’s internal control over fi nancial reporting was effectively maintained.
Kaoru Ino
Representative Director, President and CEO
DIC Corporation
Management’s Report on Internal Control
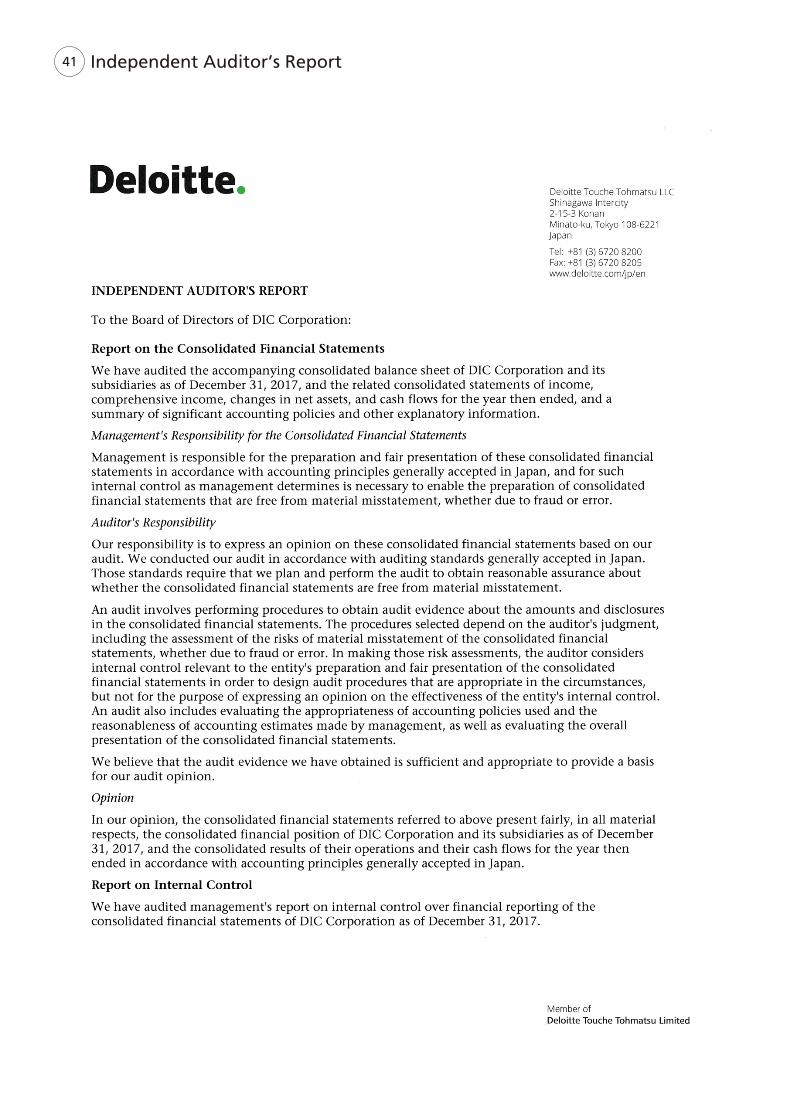
41 Independent Auditor’s Report
42 Independent Auditor’s Report
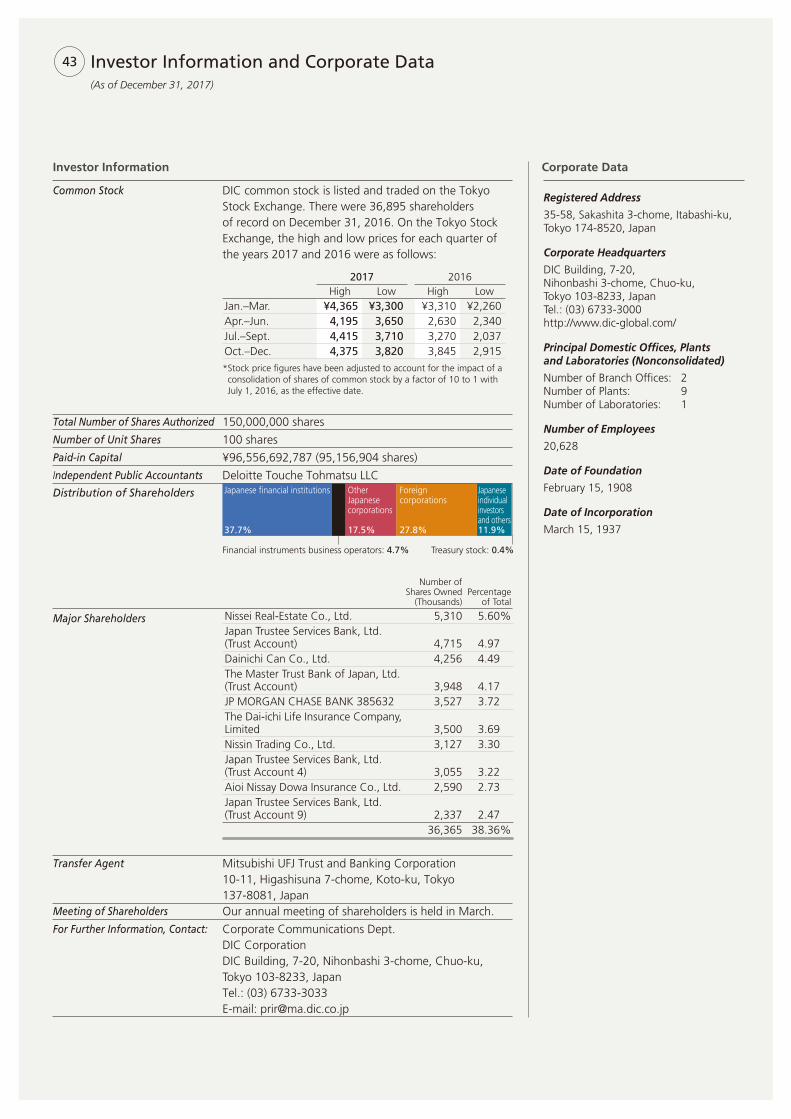
(As of December 31, 2017)
Investor Information and Corporate Data
Registered Address
35-58, Sakashita 3-chome, Itabashi-ku, Tokyo 174-8520, Japan
Corporate Headquarters
DIC Building, 7-20, Nihonbashi 3-chome, Chuo-ku, Tokyo 103-8233, Japan Tel.: (03) 6733-3000http://www.dic-global.com/
Principal Domestic Offi ces, Plants and Laboratories (Nonconsolidated)
Number of Branch Offi ces: 2Number of Plants: 9Number of Laboratories: 1
Number of Employees
20,628
Date of Foundation
February 15, 1908
Date of Incorporation
March 15, 1937
Investor Information Corporate Data
Number ofShares Owned
(Thousands)Percentage
of Total
Nissei Real-Estate Co., Ltd. 5,310 5.60%Japan Trustee Services Bank, Ltd. (Trust Account) 4,715 4.97Dainichi Can Co., Ltd. 4,256 4.49The Master Trust Bank of Japan, Ltd. (Trust Account) 3,948 4.17 JP MORGAN CHASE BANK 385632 3,527 3.72The Dai-ichi Life Insurance Company, Limited 3,500 3.69 Nissin Trading Co., Ltd. 3,127 3.30 Japan Trustee Services Bank, Ltd. (Trust Account 4) 3,055 3.22 Aioi Nissay Dowa Insurance Co., Ltd. 2,590 2.73Japan Trustee Services Bank, Ltd. (Trust Account 9) 2,337 2.47
36,365 38.36%
Financial instruments business operators: 4.7% Treasury stock: 0.4%
Japanese individual investors and others11.9%
Foreign corporations
27.8%
Other Japanese corporations
17.5%
Japanese fi nancial institutions
37.7%
Common Stock DIC common stock is listed and traded on the Tokyo Stock Exchange. There were 36,895 shareholders of record on December 31, 2016. On the Tokyo Stock Exchange, the high and low prices for each quarter of the years 2017 and 2016 were as follows:
2017 2016High Low High Low
Jan.–Mar. ¥4,365 ¥3,300 ¥3,310 ¥2,260Apr.–Jun. 4,195 3,650 2,630 2,340Jul.–Sept. 4,415 3,710 3,270 2,037Oct.–Dec. 4,375 3,820 3,845 2,915
* Stock price fi gures have been adjusted to account for the impact of a consolidation of shares of common stock by a factor of 10 to 1 with July 1, 2016, as the effective date.
Total Number of Shares Authorized 150,000,000 shares
Number of Unit Shares 100 shares
Paid-in Capital ¥96,556,692,787 (95,156,904 shares)
Independent Public Accountants Deloitte Touche Tohmatsu LLCDistribution of Shareholders
Major Shareholders
Transfer Agent Mitsubishi UFJ Trust and Banking Corporation10-11, Higashisuna 7-chome, Koto-ku, Tokyo 137-8081, Japan
Meeting of Shareholders Our annual meeting of shareholders is held in March.
For Further Information, Contact: Corporate Communications Dept.DIC CorporationDIC Building, 7-20, Nihonbashi 3-chome, Chuo-ku, Tokyo 103-8233, JapanTel.: (03) 6733-3033 E-mail: [email protected]
43
DIC Building, 7-20, Nihonbashi 3-chome,Chuo-ku, Tokyo 103-8233, Japanhttp://www.dic-global.com/