Embed Size (px)
Citation preview
Developing Data-Intensive Cloud
Applications with Iterative Quality
Enhancements
DICE Framework – Final version
Deliverable 1.6
Ref. Ares(2017)3837553 - 31/07/2017
Deliverable 1.6. DICE Framework – Final version
Copyright © 2017, DICE consortium – All rights reserved 2
Deliverable: D1.6
Title: DICE Framework – Initial version
Editor(s): Ismael Torres (PRO)
Contributor(s): Ismael Torres (PRO), Christophe Joubert (PRO), Marc Gil (PRO), Giuliano
Casale (IMP), Matej Artač (XLAB), Tadej Borovšak (XLAB), Diego Pérez
(ZAR), Gabriel Iuhasz (IEAT), Chen Li (IMP), Ioan Dragan (IEAT), Damian
Andrew Tamburri (PMI), Michele Guerriero (PMI), Jose Merseguer (ZAR),
Danilo Ardagna (PMI), Marcello Bersani (PMI), Francesco Marconi (PMI)
Reviewers: Matej Artač (XLAB), Matteo Rossi (PMI)
Type (R/P/DEC): DEC
Version: 1.0
Date: 31-July-2017
Status: Final Version
Dissemination level: Public
Download page: http://www.dice-h2020.eu/deliverables/
Copyright: Copyright © 2017, DICE consortium – All rights reserved
DICE partners
ATC: Athens Technology Centre
FLEXI: Flexiant Limited
IEAT: Institutul e-Austria Timisoara
IMP: Imperial College of Science, Technology & Medicine
NETF: Netfective Technology SA
PMI: Politecnico di Milano
PRO: Prodevelop SL
XLAB: XLAB razvoj programske opreme in svetovanje d.o.o.
ZAR: Universidad de Zaragoza
The DICE project (February 2015-January 2018) has received funding from the European
Union’s Horizon 2020 research and innovation programme under grant agreement No. 644869
Deliverable 1.6. DICE Framework – Final version
Copyright © 2017, DICE consortium – All rights reserved 3
Executive summary This document explains the final version of the DICE Framework, and it is the continuation of the Deliverable
1.5[1]. The DICE Framework is composed of a set of tools developed to support the DICE methodology.
Users use the DICE tools to execute steps defined by the DICE Methodology, and the DICE Framework
guides them in this process. One of these tools is the DICE IDE, which is the front-end of the DICE
methodology and plays a pivotal role in integrating the other tools of the DICE framework. The DICE IDE
is an integrated development environment tool for Model Driven Engineering(MDE), where a designer can
create models to describe data-intensive applications and their underpinning technology stack.
The purpose of this document is to explain the work done in the last months to release the final version of the
framework and to serve as basis of a DICE workflow, which will guide the user in executing the integrated
tools that define the DICE Methodology.
Deliverable 1.6. DICE Framework – Final version
Copyright © 2017, DICE consortium – All rights reserved 4
Glossary
ADT Anomaly Detection Tool
AP Antipattern
API Application Programming Interface
CPU Central Process Unit
DDSM DICE Deployment Specific Model
DIA Data-Intensive Application
DICE Data-Intensive Cloud Applications with iterative quality enhancements
DICER DICE Rollout Tool
DMon DICE Monitoring
DPIM DICE Platform Independent Model
DTSM DICE Technology Specific Model
EMF Eclipse Modelling Framework
FCO Flexiant Cloud Orchestrator
GIT GIT Versioning Control System
GUI Graphical User Interface
HDFS Hadoop Distributed File System
HTTP HyperText Transfer Protocol
HTTPS HyperText Transfer Protocol Secure
IDE Integrated Development Environment
IP Internet Protocol
MDE Model Driven Engineering
OCL Object Constraint Language
PNML Petri Net Markup Language
POM Project Object Model (MAVEN)
QA Quality-Assessment
RCP Rich Client Platform
TC Trace Checking
TOSCA Topology and Orchestration Specification for Cloud Applications
UI User Interface
UML Unified Modelling Language
URL Uniform Resource Locator
VCS Versioning Control System
VM Virtual Machine
XMI XML Metadata Interchange
XML eXtensible Markup Language
Deliverable 1.6. DICE Framework – Final version
Copyright © 2017, DICE consortium – All rights reserved 5
Table of contents
Executive summary 3
Glossary 4
Table of contents 5
List of Figures 8
List of Tables 9
1 Introduction 10
1.1. Objectives of this document 10
1.2. DICE Tools overview 10
1.3. Main achievements 11
1.4. Document contents 12
2. DICE IDE Components 13
2.1. DICE IDE Required components 13
2.2. Overview of tool components 15
2.2.1. Delivery Tool 15
2.2.2. Optimization Tool 15
2.2.3. Quality Testing Tool 15
2.2.4. Anomaly Detection Tool 16
2.2.5. Verification Tool 16
2.2.6. Trace Checking Tool 16
2.2.7. Enhancement Tool 17
2.2.8 Configuration Optimization Tool 17
3. Building the IDE 18
3.1. Project folder structure 18
3.2 Project logical structure 18
3.2.1. Simulation tool 18
3.2.2. Verification tool 19
3.2.3. Monitoring tool 19
3.2.4. Delivery tool 19
3.2.5. Optimization tool 20
3.2.6. Deployment modeling (DICER) tool 20
3.2.7. DICE Profiles 20
3.2.8. Quality Testing tool 20
3.2.9. Enhancement tool 21
3.2.10. Configuration Optimization tool 21
3.2.11. Anomaly Detection tool 21
Deliverable 1.6. DICE Framework – Final version
Copyright © 2017, DICE consortium – All rights reserved 6
3.2.12. Trace Checking tool 22
4. Tool Integration 23
4.1. Integration Matrix between DICE Tools 23
4.2. Inter tool integration 24
4.2.1. Deployment Modelling 24
4.2.2. Simulation Plugin 24
4.2.3. Optimization Plugin 26
4.2.4. Verification Plugin 27
4.2.5. Monitoring Platform 28
4.2.6. Anomaly Detection 30
4.2.7. Trace Checking 31
4.2.8. Enhancement Tool 33
4.2.9. Quality Testing 34
4.2.10. Configuration Optimization 35
4.2.11. Fault Injection 36
4.2.12. Delivery Tool 36
4.3. DICE IDE integration 39
5. DICE Tools Information 41
5.1. Verification tool 41
5.1.1. Introduction 41
5.1.2. Configuration 41
5.1.3. Cheat sheet 41
5.1.4. Getting started 44
5.2. Optimization tool 44
5.2.1. Introduction 44
5.2.2. Configuration 44
5.2.3. Cheat sheet 45
5.2.4. Getting started 46
5.3. Delivery tool 52
5.3.1. Introduction 52
5.3.2. Configuration 52
5.3.3. Cheat Sheets 53
5.3.4. Getting Started 55
5.4. Quality testing tool 59
5.4.1. Introduction 59
5.4.2. Configuration 59
5.4.3. Cheat sheet 60
Deliverable 1.6. DICE Framework – Final version
Copyright © 2017, DICE consortium – All rights reserved 7
5.4.4. Getting started 60
5.5. Configuration optimization tool 61
5.5.1. Introduction 61
5.5.2. Configuration 61
5.5.3. Getting started 62
5.6. Trace checking tool 62
5.6.1. Introduction 62
5.6.2. Configuration 63
5.6.3. Cheat sheet 63
5.6.4. Getting started 64
5.7. Enhancement tool 64
5.7.1. Introduction 64
5.7.2. Configuration 64
5.7.3. Cheat sheet 64
5.7.4. Getting started 65
5.8. Anomaly Detection tool 68
5.8.1. Introduction 68
5.8.2. Configuration 69
5.8.3. Cheat sheet 69
6. Conclusions 71
7. References 74
Deliverable 1.6. DICE Framework – Final version
Copyright © 2017, DICE consortium – All rights reserved 8
List of Figures
Figure 1: Structure of the DICE Framework components .............................................................................11 Figure 2: Component Diagram .......................................................................................................................14 Figure 3: Components diagram and dependencies for Simulation Tool ........................................................19 Figure 4: Components diagram and dependencies for Simulation Tool ........................................................20 Figure 5: Components and dependencies diagram for Simulation Tool ........................................................20 Figure 6: Components and dependencies diagram for Quality Testing tool. .................................................21 Figure 7: Components and dependencies diagram for Enhancement Tool ....................................................21 Figure 8: Components and dependencies diagram for Configuration Optimization tool. ..............................21 Figure 9: Components and dependencies diagram for Anomaly detection tool. ...........................................22 Figure 10: Components and dependencies diagram for Trace Checking Tool. .............................................22 Figure 11: Optimization tool preferences window .........................................................................................45 Figure 12: Optimization Tool Main Window.................................................................................................46 Figure 13: Optimization tool wizard step 1. Selecting DIA technology and target deployment. .................47 Figure 14: Public cloud deployment with existing long-term contract. .........................................................47 Figure 15: VM type selection and DICE model specification. ......................................................................48 Figure 16: DTSM selection ............................................................................................................................48 Figure 17: DDSM selection............................................................................................................................49 Figure 18: Spark and Hadoop MapReduce optimization constraints .............................................................50 Figure 19: Finish window ..............................................................................................................................51 Figure 20: Download window ........................................................................................................................51 Figure 21: Results window .............................................................................................................................51

Deliverable 1.6. DICE Framework – Final version
Copyright © 2017, DICE consortium – All rights reserved 9
List of Tables
Table 1: Inter-tool integration Matrix ............................................................................................................23 Table 2: legend of colors - Inter-tool matrix ..................................................................................................23 Table 3: Integration of the DICE Tools into the DICE IDE ..........................................................................40 Table 4: Level of compliance of the current version with the Framework requirements ..............................73
Deliverable 1.6. DICE Framework – Final version
Copyright © 2017, DICE consortium – All rights reserved 10
1 Introduction
The DICE project goes beyond the basic idea of using model-driven development for Big Data applications.
The vision is to provide all the tools that help the users to develop high-quality applications that can be
continuously deployed to satisfy requirements in terms of efficiency, reliability and safety.
The DICE Framework is a framework for developing quality data-intensive applications that leverage Big
Data Technologies hosted in the cloud. The framework will help satisfying quality requirements in data-
intensive applications by iterative enhancement of their architecture design.
The DICE Framework is composed of a set of tools developed to help the user to apply the DICE workflows
defined in DICE Methodology. The framework will guide the user in running the integrated tools that define
the DICE Methodology.
The requirements and use case scenarios of the DICE Framework were first presented in the Deliverable D1.2
[2] and updated with a consolidated list of requirements and the list of use cases in the Deliverable D1.5 [1].
A table with the Level of compliance of the current version with the requirements will be presented in the
Conclusions.
1.1. Objectives of this document
The main objective of this document is to explain how the DICE Framework works, and the principles used
to drive its definition. To explain the framework, all tools that compose it have been described, with special
attention to the Eclipse-based DICE IDE, which is the pivotal tool of the framework. The DICE IDE
integrates all the other tools of the DICE framework and it is the base of the methodology. The DICE IDE
offers two ways to integrate tools: “fully integrated” or “externally integrated”, as it is explained in detail in
Deliverable 1.5 [1].
This document defines how the tools are built (implementation and integration) and how users can use them
based on the DICE Methodology. The Deliverable 1.6 is the continuation of the Deliverable 1.5, for this
reason, some of the tools, already explained in it, have not been included again in this document.
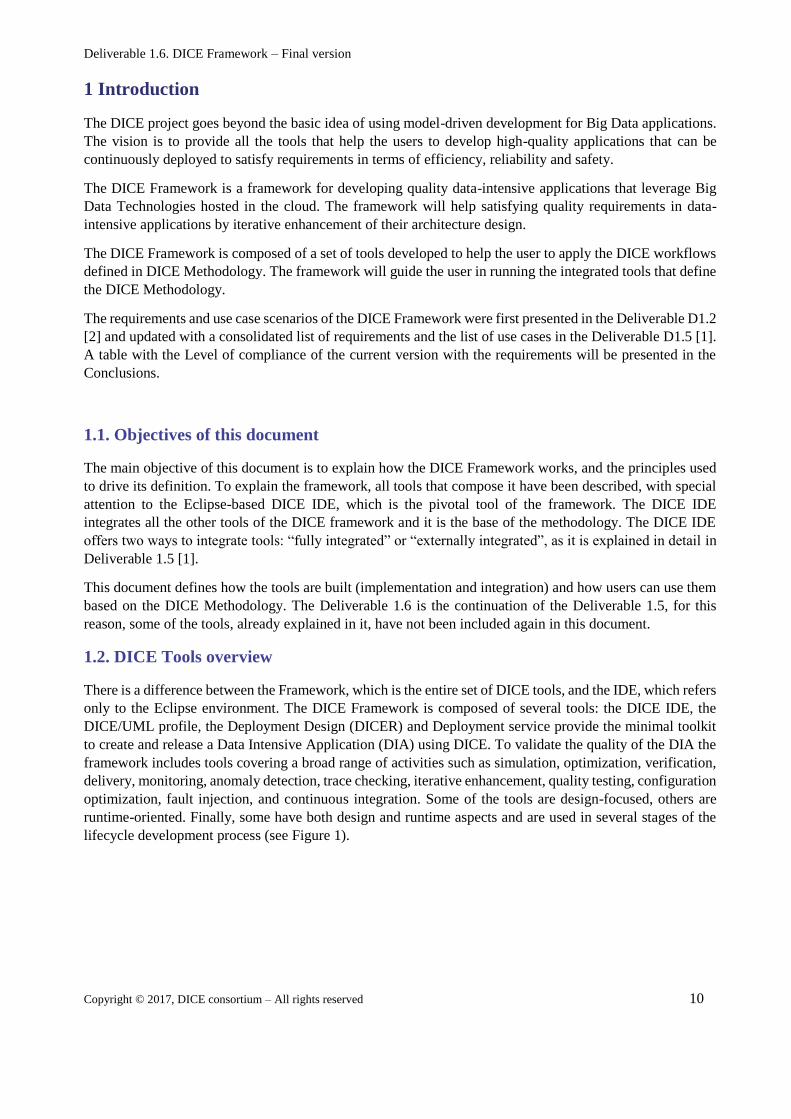
1.2. DICE Tools overview
There is a difference between the Framework, which is the entire set of DICE tools, and the IDE, which refers
only to the Eclipse environment. The DICE Framework is composed of several tools: the DICE IDE, the
DICE/UML profile, the Deployment Design (DICER) and Deployment service provide the minimal toolkit
to create and release a Data Intensive Application (DIA) using DICE. To validate the quality of the DIA the
framework includes tools covering a broad range of activities such as simulation, optimization, verification,
delivery, monitoring, anomaly detection, trace checking, iterative enhancement, quality testing, configuration
optimization, fault injection, and continuous integration. Some of the tools are design-focused, others are
runtime-oriented. Finally, some have both design and runtime aspects and are used in several stages of the
lifecycle development process (see Figure 1).
Deliverable 1.6. DICE Framework – Final version
Copyright © 2017, DICE consortium – All rights reserved 11
Figure 1: Structure of the DICE Framework components
1.3. Main achievements
This section presents an overview of the achievements of the DICE Framework. In this document, we show
the current status (M30). A more detailed description of the roadmap from the beginning of the project can
be found in Deliverable 1.4, section 3 [3].
The Framework tools integrated in the version of the IDE (v0.1.5) released in the M24 were: simulation,
verification, monitoring, delivery/deployment, DICE Profiles, Optimization, DICER and Methodology tool.
The final versions of the Framework tools have been released and almost all the requirements initially
proposed are fully completed (Table 4 in Section 6. Conclusions). In addition, a complete documentation of
the tools is included in this document and it is also available through GitHub (https://github.com/dice-
project).
In the final version of the Framework (M30) all DICE tools were integrated within the IDE, with some
exceptions such as the Fault Injection Tool. Moreover, all interdependencies and relationships among the
different tools were finalised and established.
The new tools integrated in the DICE IDE at M30 are:
● Anomaly Detection tool.
● Trace Checking tool.
● Enhancement tool
● Configuration Optimization tool
● Quality Testing tool.
Deliverable 1.6. DICE Framework – Final version
Copyright © 2017, DICE consortium – All rights reserved 12
1.4. Document contents
Section 2 “DICE IDE Components” and Section 3 “Building the IDEs”, explain the components and the
dependences between them.
Section 4 “Tool integration” describes the integration between the tools themselves, since some of them need
others in order to work, and how the tools are integrated into the DICE IDE.
Section 5 “DICE Tools Information” contains detailed information about the DICE tools, such as an
introduction to each tool, how to configure the tool, content of the tool’s cheat sheets to guide users in using
the tool from the DICE IDE and how to start using the tool.
Section 6 “Conclusions” gives a summary of the achievements in the final version of the DICE Framework.
Deliverable 1.6. DICE Framework – Final version
Copyright © 2017, DICE consortium – All rights reserved 13
2. DICE IDE Components The Eclipse IDE is an Eclipse Rich Client Platform (RCP) application to support development activities for
DIAs. The core functionalities of the Eclipse IDE are provided via a plug-ins(components). The DICE IDE
functionality is based on the concept of extensions and extension points. This is the approach used in the
DICE IDE to support the DICE tools.
This section presents the eclipse components required by the final version of the DICE IDE and the
dependencies for each DICE tool. Some of them have been included for the first time, while others have been
updated in the last version of the DICE IDE.
2.1. DICE IDE Required components
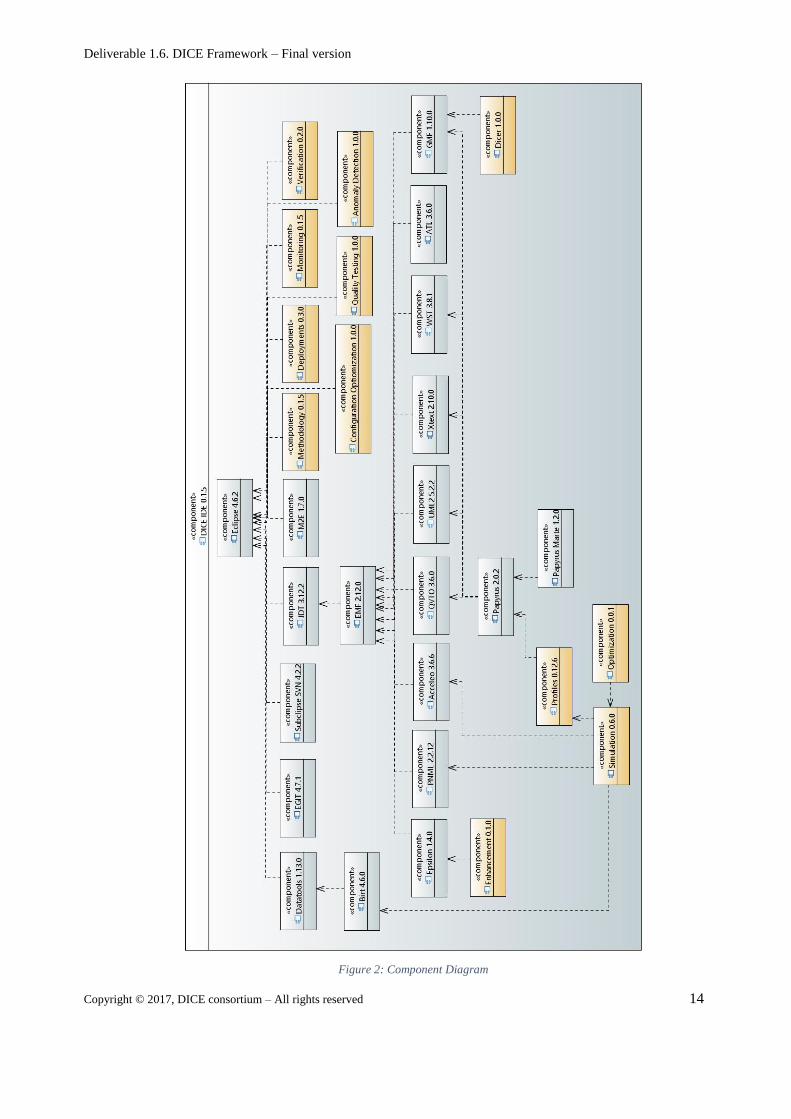
The RCP of the DICE IDE has been updated in the final version. The required components by the DICE IDE
are shown in the following Components Diagram (v0.1.5), the components that represent the DICE tools are
those with brown boxes.
The content is similar to the previous version, only the feature of OCL was removed, because it is now
included within the EMF and Papyrus features. A new feature was included: M2E, that contributes with
Maven support to the DICE IDE. This way, users will be able to create and work with Maven Projects.,
Which is a requirement for some of the DICE Tools.
Deliverable 1.6. DICE Framework – Final version
Copyright © 2017, DICE consortium – All rights reserved 14
Figure 2: Component Diagram
Deliverable 1.6. DICE Framework – Final version
Copyright © 2017, DICE consortium – All rights reserved 15
2.2. Overview of tool components
This section explains the dependencies for each DICE tool in the final version of the DICE IDE. If the
dependency of a tool has not been included in this point, it is because it maintains the same dependencies
existing in the previous version of the DICE IDE
2.2.1. Delivery Tool
The IDE plug-in for Delivery Tool is named Deployment Service’s IDE plug-in (https://github.com/dice-
project/DICE-Deployment-IDE-Plugin). The Deployment Service (https://github.com/dice-project/DICE-
Deployment-Service) is a service running in the test bed and is in charge of turning the DIA’s DDSM
representation (in the form of a TOSCA blueprint) into the DIA’s runtime within the test bed.
The tool’s IDE plug-in brings all the needed controls into Eclipse, letting the user carry out deployment tasks
in the same environment as they manage the DIA’s design and implementation. The deployments take the
form of a new type of run configurations. New custom views also provide on-line insight into the status of
the deployments.
2.2.2. Optimization Tool
This component contains the Optimization Tool integration plug-ins. Users can use this component through
the integrated launcher that is available on the launching configurations of the IDE. The final release of the
tool identifies the minimum cost configuration for DIAs based on Hadoop MapReduce, Spark and Storm
technologies. The optimization tool is a distributed software system able to exploit multi-core architecture to
execute the optimization in parallel, which encompasses different modules that communicate by means of
RESTful interfaces or SSH following the Service Oriented Architecture (SOA) paradigm. In particular, it
features a presentation layer (an Eclipse plug-in), an orchestration service (referred in the remainder of this
document as frontend) and a horizontally scalable optimization service (referred to as backend), which makes
use of third-party services as RDBMS, simulators and mathematical solvers. More information about this
component can be found in the GitHub project page (https://github.com/dice-project/DICE-Optimisation-
Plugin, https://github.com/dice-project/DICE-Optimisation-Front-End, https://github.com/dice-
project/DICE-Optimisation-Back-End). In the remainder of the document the description will focus mainly
on the Optimization Eclipse plug-in, which has been developed between M18 and M30 and which interacts
with the other DICE framework components. Frontend and backend have not significantly changed from
their initial release described in DICE deliverable D3.8 and D1.5. For additional detail we refer the reader to
the DICE knowledge repository (https://github.com/dice-project/DICE-Knowledge-Repository/wiki/DICE-
Knowledge-Repository#optimization).
2.2.3. Quality Testing Tool
QT is integrated within the IDE using Maven, since this provides a Java API, packaged as a JAR library, that
can be included or referenced in the project where the user wants to use it, using the Maven dependencies
listed at: https://mvnrepository.com/artifact/com.github.dice-project/qt-lib/1.0.0 . The DICE IDE also
provides the ability to define a Quality Testing project that automatically adds QT’s dependencies to the
project using the novel Maven support. More information about this component can be found in deliverable
D5.5 and at the GitHub project page: https://github.com/dice-project/DICE-Quality-Testing.
Deliverable 1.6. DICE Framework – Final version
Copyright © 2017, DICE consortium – All rights reserved 16
2.2.4. Anomaly Detection Tool
This component contains the Anomaly Detection Tool integration plug-ins. Users can use this component
through the integrated launcher that is available on the launching configurations from the IDE. More
information about this component features and architecture can be found in deliverable D4.4. All package
dependencies (both for Linux and Windows OS) and their associated versions are listed at:
https://github.com/dice-project/DICE-Anomaly-Detection-Tool/blob/master/requirement.txt. These
dependencies are installed using python pip package manager. Additional information can be found on the
GitHub project page: https://github.com/dice-project/DICE-Anomaly-Detection-Tool.
2.2.5. Verification Tool
The DICE Verification Tool (D-VerT) enables the analysis of safety aspects of data-intensive application.
The definition of the tool requirements and the functionality were presented in Deliverables D3.5, D3.6 and
D3.7. The tool allows designers to evaluate the design against safety properties expressed with a temporal
language (such as reachability of undesired configurations of the system, meeting of deadlines, and so on)
based on the very well-known Linear Temporal Logic (LTL).
The tool is composed of a client component (Eclipse Plugin) and server component, which is distributed as
multi-container Docker application.
The front-end (client), being an Eclipse plugin, is fully integrated in the DICE IDE. It is possible to design
the DIA from the Papyrus editor of the DICE IDE and immediately run a verification task by using a dedicated
“run configuration”.
The tool currently supports two of the DICE target technologies, namely Apache Storm and Apache Storm.
More information about this component can be found in the GitHub page of the project:
https://github.com/dice-project/DICE-Verification.
2.2.6. Trace Checking Tool
DiceTraCT is the DICE tool that performs logs analysis of Storm application by means of Trace-checking
techniques. The two documents elaborating on the principia, the implementation and the integration of the
tool are D4.3 and D4.6. The baseline approach for the trace analysis performed in DiceTraCT stems from the
evaluation of a temporal logical formula on the events recorded in the log of an application. The logical
language is enriched with special operators that have the capability of counting or averaging events that occur
in a given time window. Extended information about the plug-in can be found in the GitHub project page:
https://github.com/dice-project/DICE-Trace-Checking.
Deliverable 1.6. DICE Framework – Final version
Copyright © 2017, DICE consortium – All rights reserved 17
2.2.7. Enhancement Tool
Enhancement tool is integrated within the DICE IDE as a plug-in (popup menu). Since both DICE FG1 and
DICE APR 2need to invoke the Matlab functions in Java class, the MATLAB Compiler Runtime (MCR)
should be installed and runtime environment should be configured. Furthermore, DICE APR also requires
the Epsilon Framework to perform the M2M transformation. Enhancement tool also has a standalone version
and the details can be found in Deliverable D4.6. More information about the plug-in version of Enhancement
tool can be found in the GitHub project page: https://github.com/dice-project/DICE-Enhancement-
APR/tree/master/Plugin.
2.2.8 Configuration Optimization Tool
This tool allows the automated configuration of Big data application parameters through repeated cycles of
experiments. In year 3 an Eclipse IDE Plugin has been offered which allows to instantiate batch CO
executions via Jenkins. The IDE plugin allows users to specify the target configuration parameters to optimize
for the technologies used in the DIA and instantiate a CO execution, later retrieving the results. More
information about this IDE component can be found in the GitHub project page: https://github.com/dice-
project/DICE-Configuration-IDE-Plugin.
1 FG module is a component to performance estimation and fitting of parameters of UML models annotated with the DICE profile 2 APR (Anti-Patterns & Refactoring) module is a tool for anti-patterns detection and refactoring.
Deliverable 1.6. DICE Framework – Final version
Copyright © 2017, DICE consortium – All rights reserved 18
3. Building the IDE
DICE IDE is based on Eclipse. There exists a recommended RCP building process that was introduced in the
latest versions of the platform. This building process is named Tycho[5] and it is based on Maven. Tycho is
focused on a Maven-centric, manifest-first approach to building Eclipse plug-ins, features, update sites and
RCP applications.
3.1. Project folder structure
The project folder structure of the final version of the DICE IDE is similar to previous version of the IDE,
since the structure of the Tycho build process has not changed. Nevertheless, the contents of some “pom.xml”
files have changed because the versions of some DICE tools have changed, or were incorporated in the IDE
and its Update Sites repositories were added.
3.2 Project logical structure
The project logical structure of the final version of the DICE IDE is also the same as in the previous version
of the DICE IDE, as the IDE is feature oriented, and each feature is considered a component and a folder in
the logical structure.
Next, we explain the structure and dependence of the DICE Tools; some of them were integrated in previous
versions of the DICE IDE and their structure and dependences have not changed.
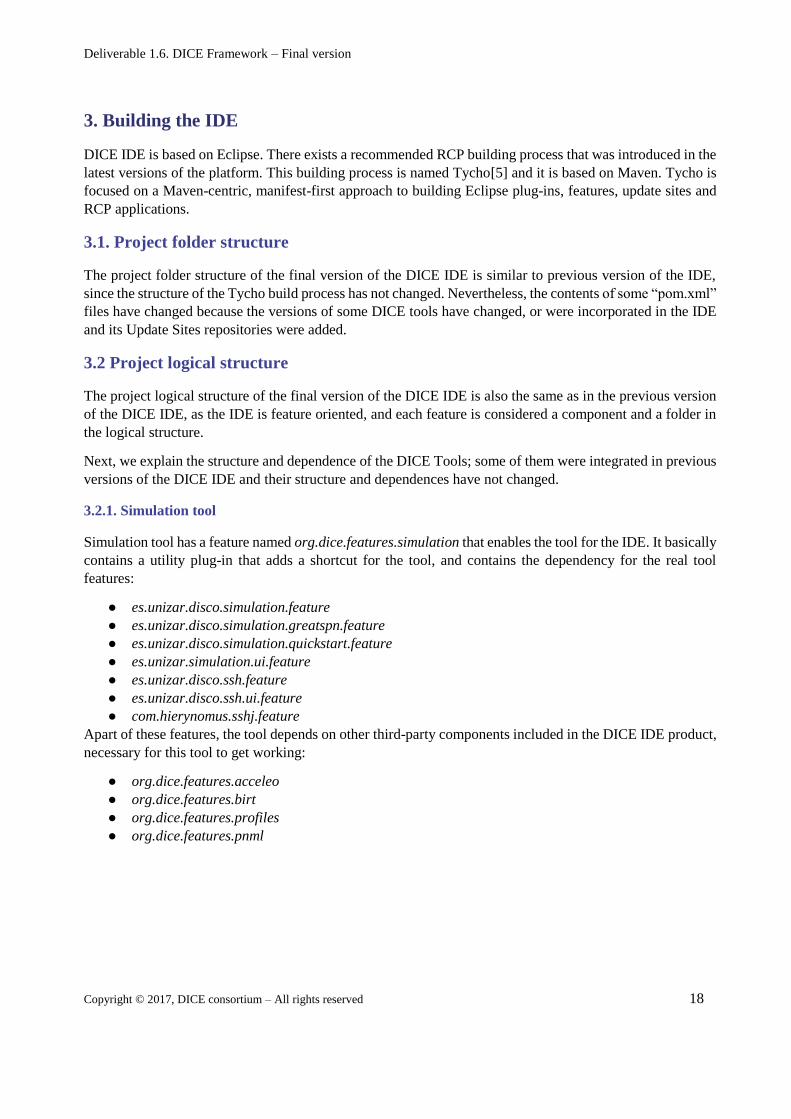
3.2.1. Simulation tool
Simulation tool has a feature named org.dice.features.simulation that enables the tool for the IDE. It basically
contains a utility plug-in that adds a shortcut for the tool, and contains the dependency for the real tool
features:
● es.unizar.disco.simulation.feature
● es.unizar.disco.simulation.greatspn.feature
● es.unizar.disco.simulation.quickstart.feature
● es.unizar.simulation.ui.feature
● es.unizar.disco.ssh.feature
● es.unizar.disco.ssh.ui.feature
● com.hierynomus.sshj.feature
Apart of these features, the tool depends on other third-party components included in the DICE IDE product,
necessary for this tool to get working:
● org.dice.features.acceleo
● org.dice.features.birt
● org.dice.features.profiles
● org.dice.features.pnml
Deliverable 1.6. DICE Framework – Final version
Copyright © 2017, DICE consortium – All rights reserved 19
Figure 3: Components diagram and dependencies for Simulation Tool
Each of these features may contain dependencies to other features, and also may contain the plug-ins with
the development.
3.2.2. Verification tool
Verification tool has no changes in the dependencies since Deliverable 1.5.
3.2.3. Monitoring tool
Monitoring tool has no changes in the dependencies since Deliverable 1.5.
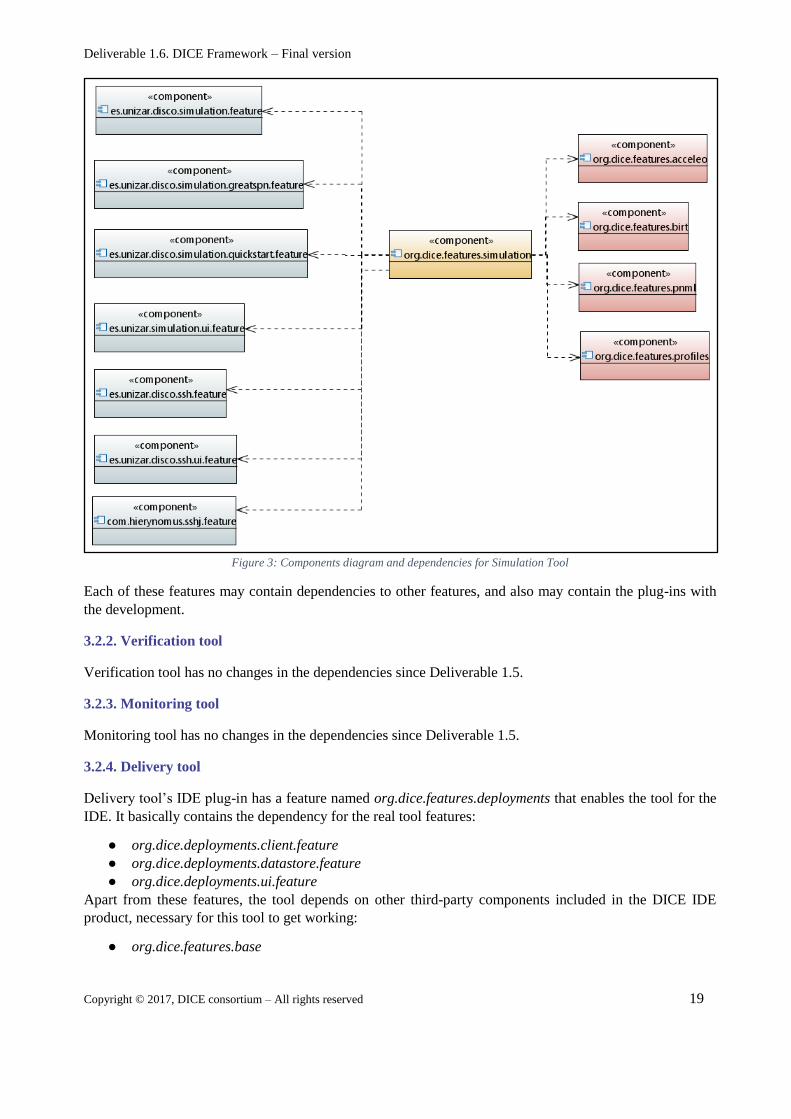
3.2.4. Delivery tool
Delivery tool’s IDE plug-in has a feature named org.dice.features.deployments that enables the tool for the
IDE. It basically contains the dependency for the real tool features:
● org.dice.deployments.client.feature
● org.dice.deployments.datastore.feature
● org.dice.deployments.ui.feature
Apart from these features, the tool depends on other third-party components included in the DICE IDE
product, necessary for this tool to get working:
● org.dice.features.base
Deliverable 1.6. DICE Framework – Final version
Copyright © 2017, DICE consortium – All rights reserved 20
Figure 4: Components diagram and dependencies for Simulation Tool
Each of these features may contain dependencies to other features, and also may contain the plug-ins with
the development.
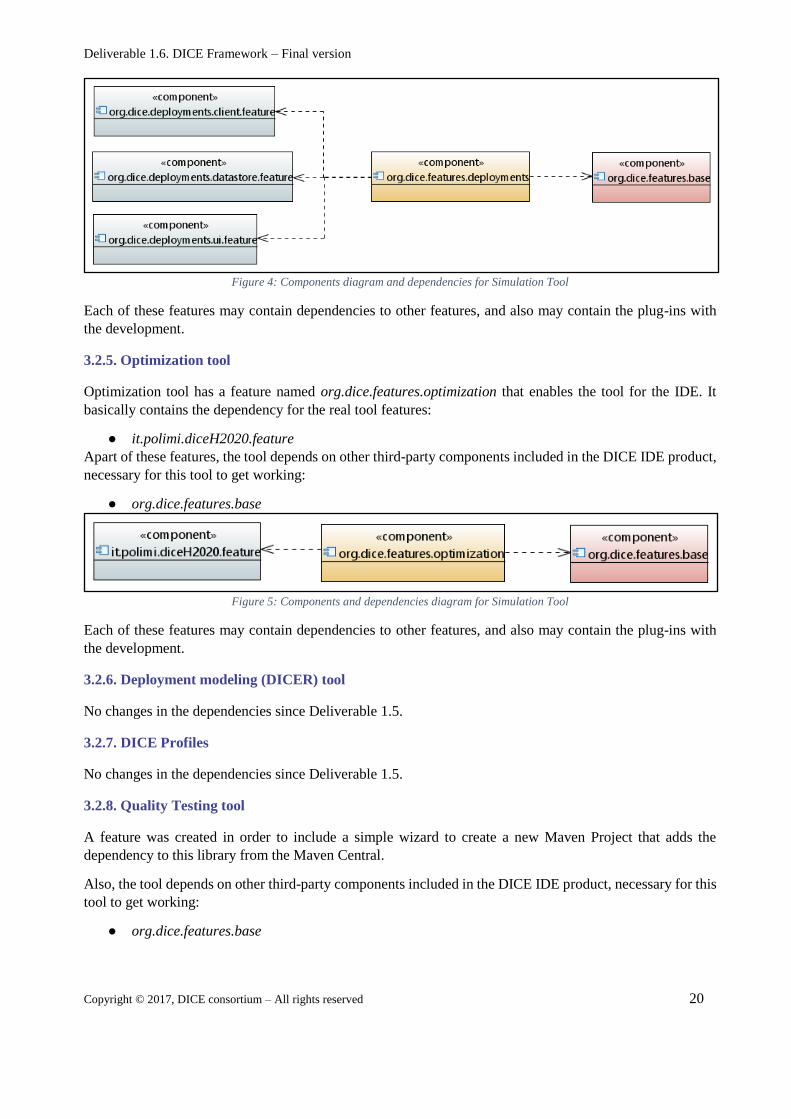
3.2.5. Optimization tool
Optimization tool has a feature named org.dice.features.optimization that enables the tool for the IDE. It
basically contains the dependency for the real tool features:
● it.polimi.diceH2020.feature
Apart of these features, the tool depends on other third-party components included in the DICE IDE product,
necessary for this tool to get working:
● org.dice.features.base
Figure 5: Components and dependencies diagram for Simulation Tool
Each of these features may contain dependencies to other features, and also may contain the plug-ins with
the development.
3.2.6. Deployment modeling (DICER) tool
No changes in the dependencies since Deliverable 1.5.
3.2.7. DICE Profiles
No changes in the dependencies since Deliverable 1.5.
3.2.8. Quality Testing tool
A feature was created in order to include a simple wizard to create a new Maven Project that adds the
dependency to this library from the Maven Central.
Also, the tool depends on other third-party components included in the DICE IDE product, necessary for this
tool to get working:
● org.dice.features.base
Deliverable 1.6. DICE Framework – Final version
Copyright © 2017, DICE consortium – All rights reserved 21
Figure 6: Components and dependencies diagram for Quality Testing tool.
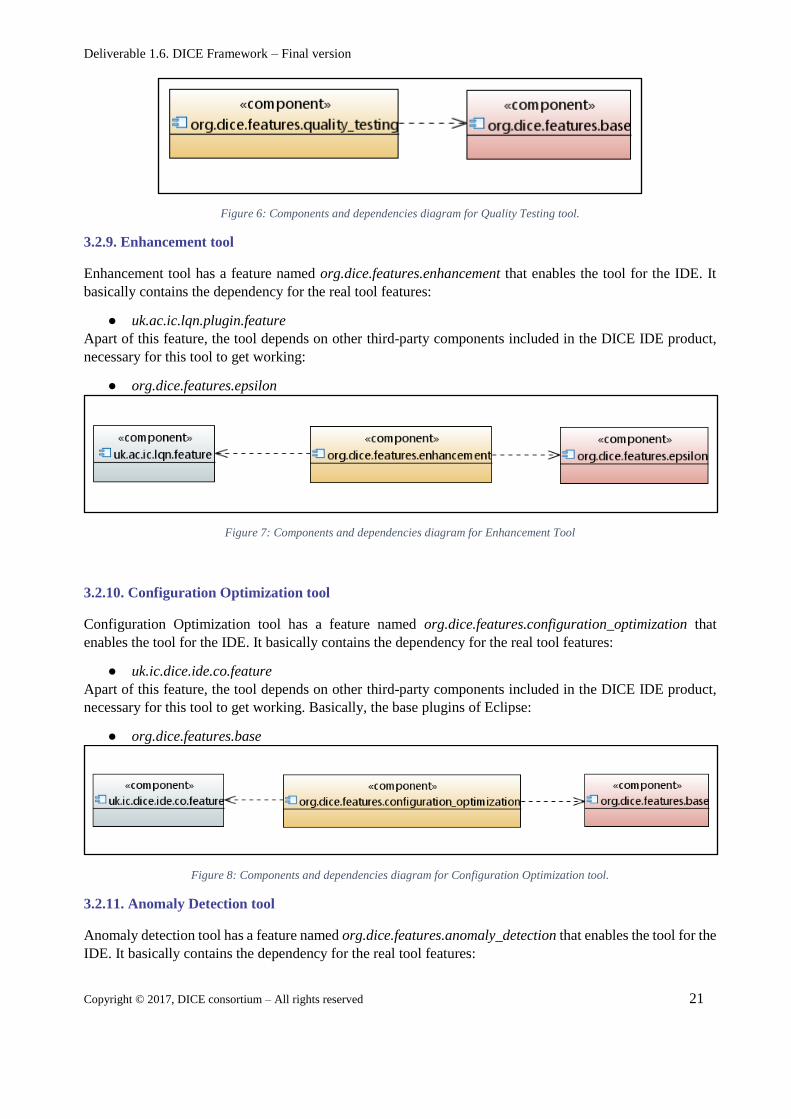
3.2.9. Enhancement tool
Enhancement tool has a feature named org.dice.features.enhancement that enables the tool for the IDE. It
basically contains the dependency for the real tool features:
● uk.ac.ic.lqn.plugin.feature
Apart of this feature, the tool depends on other third-party components included in the DICE IDE product,
necessary for this tool to get working:
● org.dice.features.epsilon
Figure 7: Components and dependencies diagram for Enhancement Tool
3.2.10. Configuration Optimization tool
Configuration Optimization tool has a feature named org.dice.features.configuration_optimization that
enables the tool for the IDE. It basically contains the dependency for the real tool features:
● uk.ic.dice.ide.co.feature
Apart of this feature, the tool depends on other third-party components included in the DICE IDE product,
necessary for this tool to get working. Basically, the base plugins of Eclipse:
● org.dice.features.base
Figure 8: Components and dependencies diagram for Configuration Optimization tool.
3.2.11. Anomaly Detection tool
Anomaly detection tool has a feature named org.dice.features.anomaly_detection that enables the tool for the
IDE. It basically contains the dependency for the real tool features:
Deliverable 1.6. DICE Framework – Final version
Copyright © 2017, DICE consortium – All rights reserved 22
● ro.ieat.dice.adt.feature
Apart of this feature, the tool depends on other third-party components included in the DICE IDE product,
necessary for this tool to get working. Basically, the base plugins of Eclipse:
● org.dice.features.base
Figure 9: Components and dependencies diagram for Anomaly detection tool.
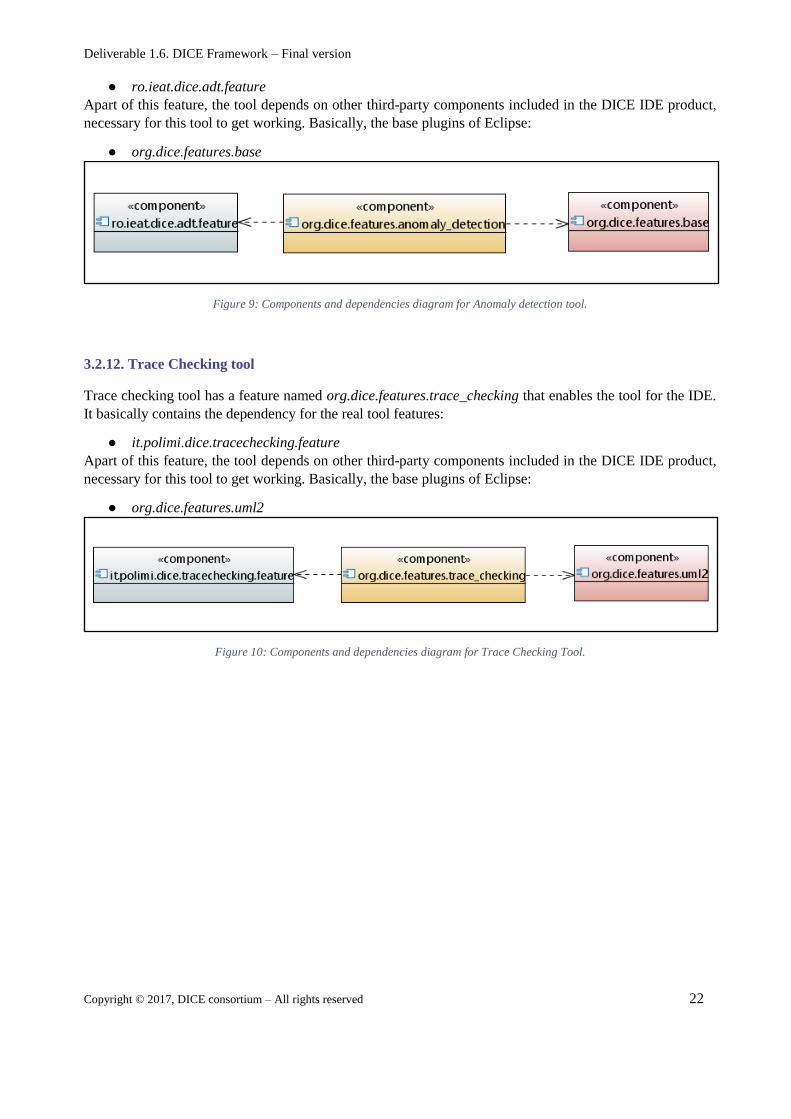
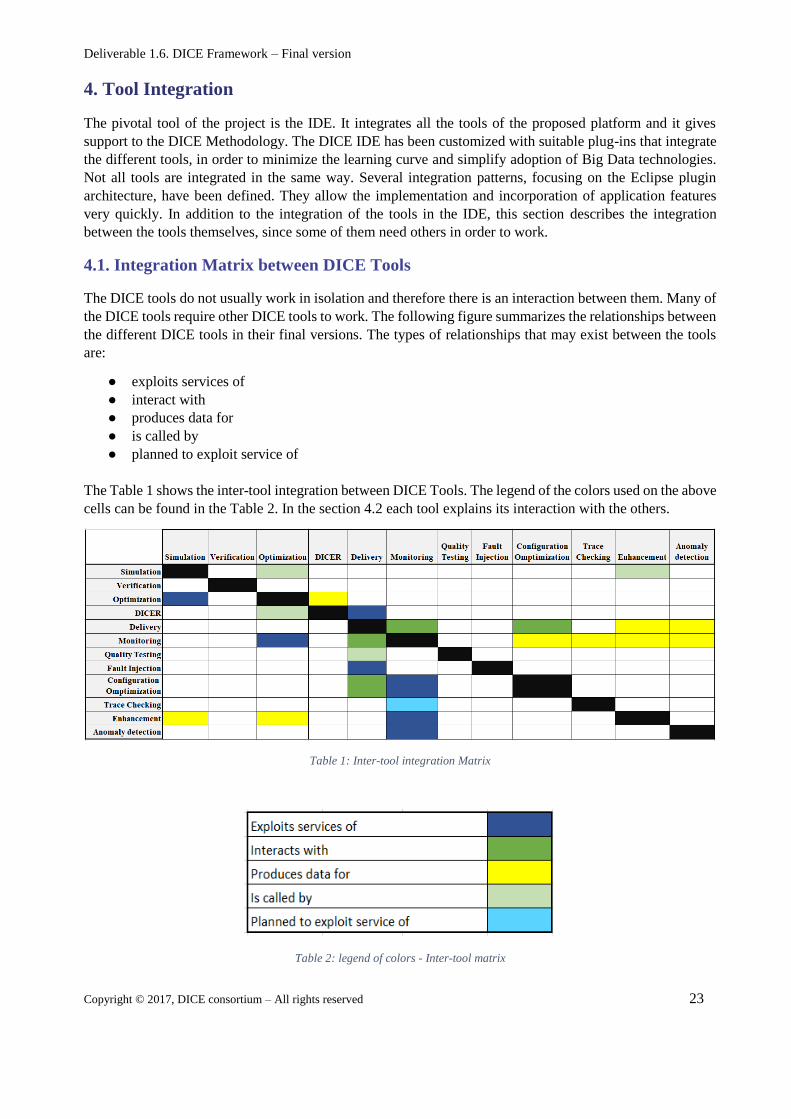
3.2.12. Trace Checking tool
Trace checking tool has a feature named org.dice.features.trace_checking that enables the tool for the IDE.
It basically contains the dependency for the real tool features:
● it.polimi.dice.tracechecking.feature
Apart of this feature, the tool depends on other third-party components included in the DICE IDE product,
necessary for this tool to get working. Basically, the base plugins of Eclipse:
● org.dice.features.uml2
Figure 10: Components and dependencies diagram for Trace Checking Tool.
Deliverable 1.6. DICE Framework – Final version
Copyright © 2017, DICE consortium – All rights reserved 23
4. Tool Integration
The pivotal tool of the project is the IDE. It integrates all the tools of the proposed platform and it gives
support to the DICE Methodology. The DICE IDE has been customized with suitable plug-ins that integrate
the different tools, in order to minimize the learning curve and simplify adoption of Big Data technologies.
Not all tools are integrated in the same way. Several integration patterns, focusing on the Eclipse plugin
architecture, have been defined. They allow the implementation and incorporation of application features
very quickly. In addition to the integration of the tools in the IDE, this section describes the integration
between the tools themselves, since some of them need others in order to work.
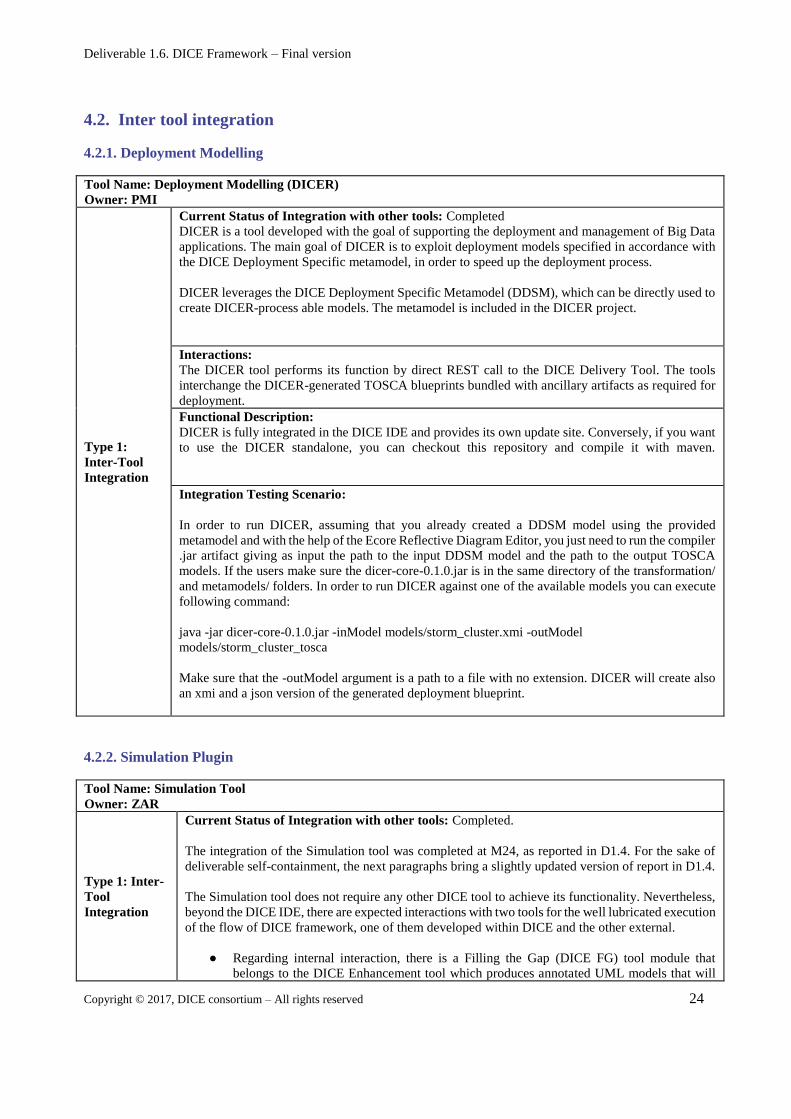
4.1. Integration Matrix between DICE Tools
The DICE tools do not usually work in isolation and therefore there is an interaction between them. Many of
the DICE tools require other DICE tools to work. The following figure summarizes the relationships between
the different DICE tools in their final versions. The types of relationships that may exist between the tools
are:
● exploits services of
● interact with
● produces data for
● is called by
● planned to exploit service of
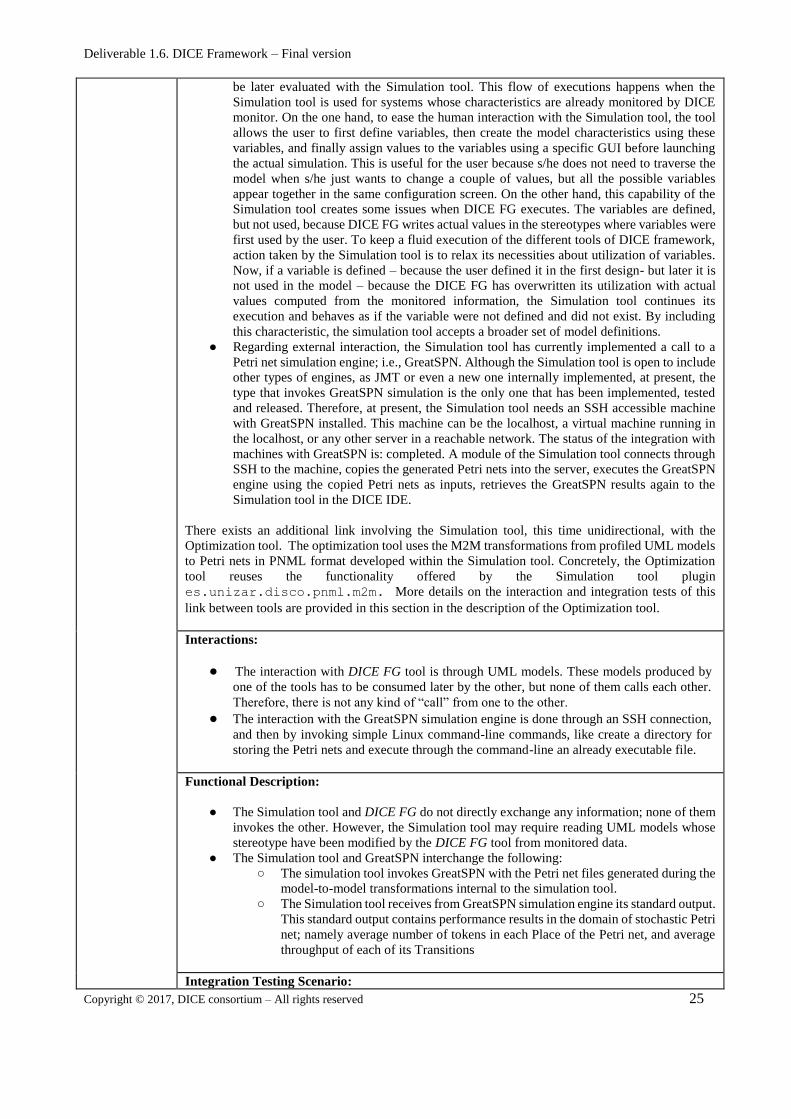
The Table 1 shows the inter-tool integration between DICE Tools. The legend of the colors used on the above
cells can be found in the Table 2. In the section 4.2 each tool explains its interaction with the others.
Table 1: Inter-tool integration Matrix
Table 2: legend of colors - Inter-tool matrix
Deliverable 1.6. DICE Framework – Final version
Copyright © 2017, DICE consortium – All rights reserved 24
4.2. Inter tool integration
4.2.1. Deployment Modelling
Tool Name: Deployment Modelling (DICER)
Owner: PMI
Type 1:
Inter-Tool
Integration
Current Status of Integration with other tools: Completed
DICER is a tool developed with the goal of supporting the deployment and management of Big Data
applications. The main goal of DICER is to exploit deployment models specified in accordance with
the DICE Deployment Specific metamodel, in order to speed up the deployment process.
DICER leverages the DICE Deployment Specific Metamodel (DDSM), which can be directly used to
create DICER-process able models. The metamodel is included in the DICER project.
Interactions:
The DICER tool performs its function by direct REST call to the DICE Delivery Tool. The tools
interchange the DICER-generated TOSCA blueprints bundled with ancillary artifacts as required for
deployment.
Functional Description:
DICER is fully integrated in the DICE IDE and provides its own update site. Conversely, if you want
to use the DICER standalone, you can checkout this repository and compile it with maven.
Integration Testing Scenario:
In order to run DICER, assuming that you already created a DDSM model using the provided
metamodel and with the help of the Ecore Reflective Diagram Editor, you just need to run the compiler
.jar artifact giving as input the path to the input DDSM model and the path to the output TOSCA
models. If the users make sure the dicer-core-0.1.0.jar is in the same directory of the transformation/
and metamodels/ folders. In order to run DICER against one of the available models you can execute
following command:
java -jar dicer-core-0.1.0.jar -inModel models/storm_cluster.xmi -outModel
models/storm_cluster_tosca
Make sure that the -outModel argument is a path to a file with no extension. DICER will create also
an xmi and a json version of the generated deployment blueprint.
4.2.2. Simulation Plugin
Tool Name: Simulation Tool Owner: ZAR
Type 1: Inter-
Tool
Integration
Current Status of Integration with other tools: Completed.
The integration of the Simulation tool was completed at M24, as reported in D1.4. For the sake of
deliverable self-containment, the next paragraphs bring a slightly updated version of report in D1.4.
The Simulation tool does not require any other DICE tool to achieve its functionality. Nevertheless,
beyond the DICE IDE, there are expected interactions with two tools for the well lubricated execution
of the flow of DICE framework, one of them developed within DICE and the other external.
● Regarding internal interaction, there is a Filling the Gap (DICE FG) tool module that
belongs to the DICE Enhancement tool which produces annotated UML models that will
Deliverable 1.6. DICE Framework – Final version
Copyright © 2017, DICE consortium – All rights reserved 25
be later evaluated with the Simulation tool. This flow of executions happens when the
Simulation tool is used for systems whose characteristics are already monitored by DICE
monitor. On the one hand, to ease the human interaction with the Simulation tool, the tool
allows the user to first define variables, then create the model characteristics using these
variables, and finally assign values to the variables using a specific GUI before launching
the actual simulation. This is useful for the user because s/he does not need to traverse the
model when s/he just wants to change a couple of values, but all the possible variables
appear together in the same configuration screen. On the other hand, this capability of the
Simulation tool creates some issues when DICE FG executes. The variables are defined,
but not used, because DICE FG writes actual values in the stereotypes where variables were
first used by the user. To keep a fluid execution of the different tools of DICE framework,
action taken by the Simulation tool is to relax its necessities about utilization of variables.
Now, if a variable is defined – because the user defined it in the first design- but later it is
not used in the model – because the DICE FG has overwritten its utilization with actual
values computed from the monitored information, the Simulation tool continues its
execution and behaves as if the variable were not defined and did not exist. By including
this characteristic, the simulation tool accepts a broader set of model definitions.
● Regarding external interaction, the Simulation tool has currently implemented a call to a
Petri net simulation engine; i.e., GreatSPN. Although the Simulation tool is open to include
other types of engines, as JMT or even a new one internally implemented, at present, the
type that invokes GreatSPN simulation is the only one that has been implemented, tested
and released. Therefore, at present, the Simulation tool needs an SSH accessible machine
with GreatSPN installed. This machine can be the localhost, a virtual machine running in
the localhost, or any other server in a reachable network. The status of the integration with
machines with GreatSPN is: completed. A module of the Simulation tool connects through
SSH to the machine, copies the generated Petri nets into the server, executes the GreatSPN
engine using the copied Petri nets as inputs, retrieves the GreatSPN results again to the
Simulation tool in the DICE IDE.
There exists an additional link involving the Simulation tool, this time unidirectional, with the
Optimization tool. The optimization tool uses the M2M transformations from profiled UML models
to Petri nets in PNML format developed within the Simulation tool. Concretely, the Optimization
tool reuses the functionality offered by the Simulation tool plugin
es.unizar.disco.pnml.m2m. More details on the interaction and integration tests of this
link between tools are provided in this section in the description of the Optimization tool.
Interactions:
● The interaction with DICE FG tool is through UML models. These models produced by
one of the tools has to be consumed later by the other, but none of them calls each other.
Therefore, there is not any kind of “call” from one to the other. ● The interaction with the GreatSPN simulation engine is done through an SSH connection,
and then by invoking simple Linux command-line commands, like create a directory for
storing the Petri nets and execute through the command-line an already executable file.
Functional Description:
● The Simulation tool and DICE FG do not directly exchange any information; none of them
invokes the other. However, the Simulation tool may require reading UML models whose
stereotype have been modified by the DICE FG tool from monitored data.
● The Simulation tool and GreatSPN interchange the following:
○ The simulation tool invokes GreatSPN with the Petri net files generated during the
model-to-model transformations internal to the simulation tool.
○ The Simulation tool receives from GreatSPN simulation engine its standard output.
This standard output contains performance results in the domain of stochastic Petri
net; namely average number of tokens in each Place of the Petri net, and average
throughput of each of its Transitions
Integration Testing Scenario:
Deliverable 1.6. DICE Framework – Final version
Copyright © 2017, DICE consortium – All rights reserved 26
For the interaction with DICE FG:
● The user creates a UML model that includes the definition and utilization of variables
● The user executes the simulation tool
● The user runs the DICE FG
● The user is able to execute again the Simulation tool giving as input the UML model that
whose values have been updated by DICE FG
An instance of this test can be seen in the description of the Enhancement Tool in Section 6.7
where the expression containing a variable “expr=$launchFD” is replaced by the DICE FG with
“expr=296.63”
For the interaction with GreatSPN engine:
● The user configures his/her DICE IDE ● The user creates a UML model
● The user executes the simulation tool
● The user can see quality results of the model simulation
4.2.3. Optimization Plugin
Tool Name: Optimization tool
Owner: PMI
Type 1: Inter-
Tool
Integration
Current Status of Integration with other tools: Completed.
The integration of the Optimization tool has been completed at M30, as reported in D3.9. It consists
of three main components an Eclipse Plug-in, a frontend and a backend service.
The Eclipse plug-in (fully integrated within the DICE IDE) allows to specify the input models and
performance constraints and transforms the input UML diagrams into the input performance models
for the performance solver (GreatSPN or JMT). The frontend exposes a graphical interface designed
to facilitate the download of the optimization results (which are computed through batch jobs) while
the backend implements a parallel local search aimed at identifying the minimum cost deployment.
Interactions:
● The optimization tool exploits the M2M transformation mechanisms implemented within
the DICE Simulation tool to generate a suitable performance model to be used to predict
the expected execution time for Hadoop MapReduce or Spark DIAs or cluster utilization
for Storm.
● The interaction with GreatSPN and JMT simulation engines is done through an SSH
connection, and then invoking simple Linux command-line commands, like create a
directory for storing the Petri nets and execute through the command-line an already
executable file.
● The initial solution for the local search algorithm implemented in the backend is based on
the solution of some MILP models that are solved by relying on third-party tools like
AMPL or CMPL, Knitro or GLPK. The interaction with optimization solvers is
implemented by invoking Linux solver executables installed within the backend.
Functional Description:
● The tool requires as input a description of the execution environment (list of providers, list
of VM types or a description of the computational power available in house) and the
performance constraints. Input files and parameters can be specified through a wizard
implemented by the Eclipse plug-in.
● Multiple DTSMs are provided as input, one for each VM considered as a candidate
deployment. VMs can be associated with different cloud providers. The optimization tool
will identify the VM type and the corresponding number, which fulfill performance
constraints and minimize costs.
Deliverable 1.6. DICE Framework – Final version
Copyright © 2017, DICE consortium – All rights reserved 27
● Finally, the tool takes as input also a DDSM model, which is updated with the final solution
found and can be automatically deployed through the DICER tool.
Integration Testing Scenario:
● The interaction between the Optimization Tool Eclipse plug-in and the Simulation tool
M2M transformations was tested by invoking the M2M transformation library with
multiple DTSM models for Hadoop, Spark and Storm technologies. ● The interaction between the Optimization tool and DICER was tested by transforming the
DDSM model including the minimum cost deployment obtained as output from the
Optimization tool through the DICER M2T transformations.
4.2.4. Verification Plugin
Tool Name: D-verT
Owner: PMI
Type 1: Inter-
Tool
Integration
Current Status of Integration with other tools
D-verT is a fully integrated plugin of the DICE framework. It is based on a client-server architecture
that allows for decoupling the verification engine, on the server side, from the front-end on the client
side, that resides in the DICE IDE.
The verification service does not interact with any DICE tool except for the IDE; it is a REST service
that can be accessed by means of suitable APIs supplying:
● the execution of a verification task;
● lookup functionalities to inspect the result of the verification.
Interactions (i.e. RestAPI etc.)
D-verT does not interact with other DICE tools. It can be used by the end-user independently of the
rest.
Functional Description
The D-verT RESTful service on the server is structured through the following methods:
● Launch verification task:
○ RESTful:
■ POST /longtasks
■ input: JSON descriptor of a verification instance
■ output: the URL through which it will be possible to track the status of
the task.
■ purpose: the method creates and launches a thread running the
verification engine.
○ No CLI counterpart
● Status of a verification task:
○ RESTful:
■ GET /status/TASK_ID ■ output: a JSON descriptor specifying the status of the task with identifier
TASK_ID. Possible values are PENDING, PROGRESS, SUCCESS,
REVOKE and TIMEOUT. ■ purpose: allows the user to obtain information on the verification tasks
that were launched.
○ No CLI counterpart
● List of tasks:
○ RESTful:
■ GET /task_list
■ output: JSON containing the list of all the task status object,
■ purpose: provides information about the status of all the tasks in the
system.
○ No CLI counterpart
● Task-related files:
○ RESTful:
Deliverable 1.6. DICE Framework – Final version
Copyright © 2017, DICE consortium – All rights reserved 28
■ GET /tasks/RELATIVE_FILE_PATH ■ output: the file located at the specified URL
■ purpose: allows the client to get all the relevant files related to a specific
task, such as configuration files, output traces, graphical representation.
○ No CLI counterpart
Integration Testing Scenario
The interaction between the client and the server was tested in the following scenario.
1. The client calls /Longtasks method by proving a JSON descriptor for the verification task.
2. The client checks the status of a specific verification process by invoking /status/TASK_ID 3. The client gets the list of all the tasks started in the server.
4.2.5. Monitoring Platform
Tool Name: DICE Monitoring platform (DMon)
Owner: IeAT
Type 1:
Inter-Tool
Integration
Current Status of Integration with other tools:
The DICE Monitoring platform is a passive service in the sense that it does not send information to
any of the services from DICE; rather it can be queried using its REST API by all the tools or services
from the DICE Toolchain that requires monitoring data. These tools include the Anomaly detection,
Trace checking, Enhancement, Configuration Optimization tool.
The current version of the Monitoring solution can be found in the official DICE wiki.
Interactions:
As mentioned before DMon provides monitoring data to all of the tools requiring DIA monitoring
data. To this end the following tools use the same type querying endpoint; Anomaly detection,
Enhancement and optimization. The querying resource from the REST API can be found at:
POST /v2/observer/query/<ftype>
Where ftype represents the type of output sent by DMon (JSON, Plain, CSV, PerfMon). The payload
of the query contains all of the necessary information DMon requires to successfully retrieve, format
and serve the data:
{ "DMON": { "fname": "output", "index": "logstash-*", "metrics": [ " " ], "ordering": "desc", "queryString":"<query>", "size": 500, "tstart": "now-1d", "tstop": "None" } } There are two versions of this resource available. The first version is a synchronous one (v1) while the
second is asynchronous (v2). It is recommended to use synchronous resource for small queries (up to
25MB of data) and the asynchronous one for larger ones. More details about this can be found in
deliverable D4.2.
In the case of the Trace Checking tool additional resources are required because of the need of raw log
data from monitored nodes. These resources are:
Deliverable 1.6. DICE Framework – Final version
Copyright © 2017, DICE consortium – All rights reserved 29
GET /dmon/v1/overlord/storm/logs Check what storm log files are currently available in DMon
POST /dmon/v1/overlord/storm/logs Fetch new storm logs from all monitored nodes and add them to the already existing ones.
GET /dmon/v1/overlord/storm/logs/active Check for active fetching tasks. Storm log size can be substantial so we implemented asynchronous
fetching method. GET /dmon/v1/overlord/storm/logs/{log_file} Serve a specific log denoted by the log_file parameter.
Functional Description:
DICE monitoring platform collects, stores, indexes and visualizes monitoring data in real-time from
applications running on Big Data frameworks. It supports DevOps professionals with iterative quality
enhancements of the source code. Leveraging ELK (Elasticsearch Logstash and Kibana) stack, DMon
is a fully distributed, highly available and horizontally scalable platform. All the core components of
the platform have been wrapped in microservices accessible through a REST API for ease of
integration and use. DMon is able to monitor both infrastructure level metrics (memory, CPU, disk,
network etc.) as well as multiple Big Data frameworks, currently supported being Apache HDFS,
YARN, Spark, Storm, MongoDB and Cassandra.
Visualization of collected data is fully customizable and can be structured in multiple dashboards
based on your needs, or tailored to specific roles in your organization, such as administrator, quality
assurance engineer or software architect. Furthermore, it provides a set of default visualizations
generated automatically for all of the supported technologies. These can be composed into dashboards
by the end users.
Integration Testing Scenario:
Once DMon is set up by the Deployment service each DICE Tool or user can issue queries to the
appropriate REST resource. If the tool requires monitoring data for Storm based DIA it will issue a
query of the form:
{ "DMON": {
"aggregation": "storm", "fname": "output", "index": "logstash-*", "interval": "10s", "size": 0,
"tstart": "now-1d",
"tstop": "now" }
}
If the DIA is based on different technologies the only part of the query that should change is the
aggregation parameter. A full list of available aggregations can be found at D4.2 or the official DMon
wiki. It should be noted that DMon has been also tested on a container (Mesos+Marathon) based
deployment of Spark and Storm and has been found to need no further modifications to run on a
container based DIA monitoring use case.
Deliverable 1.6. DICE Framework – Final version
Copyright © 2017, DICE consortium – All rights reserved 30
4.2.6. Anomaly Detection
Tool Name: Anomaly Detection Tool
Owner: IeAT
Type 1:
Inter-Tool
Integration
Current Status of Integration with other tools:
The Anomaly Detection Tool is tightly connected with DMon. It uses DMon not only for querying
monitoring data but also to store generated predictive models and a special index called anomalies for
reporting the type of anomalies detected by it.
This tool also has a plugin in the DICE IDE which enables the configuration of each of the available
anomaly detection methods as well as some tool specific parameters. The current version of the tool
and user manual can be found in the official DICE repository and deliverable D4.4.
Interactions:
As mentioned before this tool is tightly connected with Dmon; together they form a lambda type
architecture. The monitoring takes the role of the serving layer while the anomaly detection tool can
start several parallel processes, each one of these can take the role of batch or speed layers. Querying
the DMon is done via a special component in the tool which uses the query REST resource.
There are several anomaly detection methods which produce predictive models. These are saved both
locally and remotely inside DMon. This is accomplished with a modified version of the artifact
repository service from the MODAClouds FP7 project which is integrated in DMon. It provides the
following REST resources: GET /v1/overlord/repositories
Return the available repositories from DMon, repositories can denote different projects for which
predictive models are created.
GET /v1/overlord/repositories/{repository}/artifacts
Return the available artifact for each repository. Artifact can denote different applications from the
same project.
DELETE /v1/overlord/repositories/{repository}/artifacts/{artifact}
Delete artifacts for a certain project.
GET /v1/overlord/repositories/{repository}/artifacts/{artifact}
Returns the list of available predictive models.
DELETE /v1/overlord/repositories/{repository}/artifacts/{artifact}/{version}
Deletes a particular artifact (or predictive model in this case) version.
PUT /v1/overlord/repositories/{repository}/artifacts/{artifact}/{version}
Push a predictive model to DMon and version it.
GET /v1/overlord/repositories/{repository}/artifacts/{artifact}/{version}/files
Return the available files of a particular predictive model. These files can be anything for training
reports to visualizations and are not mandatory.
DELETE /v1/overlord/repositories/{repository}/artifacts/{artifact}/{version}/files/{file}
Delete the files associated with a particular artifact version.
GET /v1/overlord/repositories/{repository}/artifacts/{artifact}/{version}/files/{file}
Return a specific file associated with a predictive model version.
Deliverable 1.6. DICE Framework – Final version
Copyright © 2017, DICE consortium – All rights reserved 31
PUT /v1/overlord/repositories/{repository}/artifacts/{artifact}/{version}/files/{file}
Uploads a specific file associated with a predictive model version.
Functional Description:
The Anomaly detection tool is responsible for detecting anomalies in the performance of a DIA version.
It is able to detect both point, contextual and collective anomalies. These anomaly types are being
defined by the structure of the training data. We implemented both supervised and unsupervised
anomaly detection methods as well as semi-automatic training data generation capabilities. Once a
predictive model has been trained (be it a classifier or a clusterer) it can be loaded into a separate
process. This process will then use than mark in real time if at a particular timestamp the metrics are
anomalous.
There are two types of reporting. The first type of reporting is related to the training process and is
available as files (confusion matrix, learning rate, learning accuracy, model visualisations etc.). The
second type of reporting is for the detected anomalies. It contains information about the type,
timestamp, probable cause and detection method of the anomaly. This report is sent to DMon and added
to a specialized index called anomalies. The data from the detected anomalies can be queried as any
other information in DMon using the query REST resource.
Integration Testing Scenario:
The first step in using the anomaly detection tool is to set the endpoint for DMon. Once this is done the
user has to set the time frame from which the training dataset is to be generated. If one so desires the
aggregation interval of the metrics can also be set, the default value is 5 seconds.
Next the desired anomaly detection method parameters have to be set. These vary based on the method
that is selected. All parameters have default values. If a user is not familiar with the methods and cannot
make informed parameter setting the anomaly detection tool has hyper-parameter optimization methods
implemented which try to optimize these automatically.
Once a viable predictive model is created (classification or clustering) it is saved and can be instantiated
into a separate process which is able to process the incoming data from DMon in real time. If an
anomaly is detected a report of the anomaly is sent into DMon where it can be consumed by all DICE
tools and users.
We have tested and validated the tool on the WikiStats and POSIDONIA use cases. Other tests for
Yarn and Spark based DIAs have also been performed. Further details can be found in deliverable D4.4.
4.2.7. Trace Checking
Tool Name: Dice-TraCT
Owner: PMI
Type 1:
Inter-Tool
Integration
Current Status of Integration with other tools:
DiceTraCT is a fully integrated plugin of the DICE framework. It is based on a client-server
architecture that allows for decoupling the server side, hosting the trace-checking service and engine,
from the front-end in the DICE IDE that incorporates the client of the tool.
The trace-checking service interacts with the monitoring platform Dmon and the IDE. The connection
with Dmon is needed to retrieve log files of the running application to be analyzed. A simple API
supplies the methods to execute a trace-checking analysis on a running Storm topology which is
currently monitored by DMon.
The input to the service is a JSON object which defines a list of instances of trace-checking analysis,
each one consisting of a pair “(node, formula_to_check)”. The front-end of DiceTraCT builds
the JSON object from the information specified in the IDE which contains the DTMS diagram of the
topology undergoing the analysis. The client of DiceTraCT interacts with the DICE IDE and
Deliverable 1.6. DICE Framework – Final version
Copyright © 2017, DICE consortium – All rights reserved 32
implements a model-to-model transformation that translates the DTSM diagram of the application
into the JSON descriptor. Running trace-checking involves the translation of the DTMS application
model and, afterwards, a REST call to the DiceTraCT server, that is executed through a POST method
conveying the JSON descriptor. The DiceTraCT server communicates with the monitoring platform
to collect the proper set of log files that will be used to perform the analysis specified in the descriptor.
After the log retrieval phase, DiceTraCT elaborates the user request and run the most suitable engine
to carry out trace-checking.
The client obtains the analysis results by waiting for the response of DiceTraCT, which is sent back
to the caller in the form of a JSON object. The response specifies the outcome (either a boolean or a
numeric value) for each instance of analysis required by the user.
Interactions:
DiceTraCT interacts with Dmon with the following REST calls:
● Retrieval of the list of all the collected logs available in Dmon for the running topology
○ GET /v1/overlord/storm/logs/
○ input: none
○ output: JSON descriptor containing the list of tar file including the currently updated
worker log files that are available at the moment of the method call
○ purpose: it allows DiceTraCT to select the most appropriate set of logs for the
analysis.
● Retrieval of the compressed tar archive including the log files to analyse
○ GET /v1/overlord/storm/logs/{workerlog}
○ input: workerlog name chosen from the list obtained with the previous REST call
○ output: tar file
○ purpose: it allows DiceTraCT to get the logs for the trace-checking analysis.
● Checking the activity of Dmon ○ GET /v1/overlord/storm/logs/active
○ input: none
○ output: boolean
○ purpose: this call allows DiceTraCT to verify if the service for log download can be
actually called
● Start a new monitoring session on the current registered Storm topology ○ POST /v1/overlord/storm/logs
○ input: none
○ output: PID of the monitoring thread
○ purpose: this call allows DiceTraCT client to start monitoring the topology
Functional Description:
The DiceTraCT RESTful service methods are the following:
● Launch trace-checking task:
○ POST /run
○ input: JSON payload specifying all the trace-checking instances
○ output: JSON object specifying the outcome of all the trace-checking instances
(either a numeric value or a boolean)
○ purpose: the method activates the trace-checking analysis in DiceTraCT (on the
server side)
● Clean-up
○ GET /clean
○ input: none
○ output: none
○ purpose: it allows the user to remove temporary files in the server
Deliverable 1.6. DICE Framework – Final version
Copyright © 2017, DICE consortium – All rights reserved 33
Integration Testing Scenario:
The interaction between the the client and the server was tested in the following scenario.
1. The client calls /run method by proving a JSON object for the trace-checking task.
2. The client gets the list of the analysis outcome.
4.2.8. Enhancement Tool
Tool Name: Enhancement Tool
Owner: IMP
Type 1:
Inter-Tool
Integration
Current Status of Integration with other tools:
The goal of the Enhancement tool is feeding results back into the design models to provide guidance
to the developer on the quality offered by the application at runtime. DICE Enhancement tool includes
two modules, DICE FG and DICE APR. DICE FG accepts JSON files, which are obtained from DICE
Monitoring Platform (DMON) and contain quality metric of Big Data scenario (e.g., Storm), and
parameterized the UML model. The updated UML model will be used as input for DICE APR
generating the LQN model for later analysis. DICE APR will provide refactoring suggestion if anti-
patterns is detected.
Interactions:
DICE Enhancement tool needs runtime information to perform the UML model parameterization and
the anti-patterns detections and refactoring. Thus, Enhancement tool should interact with DMON, to
be specific, the DICE FG interacts with the DMON. The internal interactions happen between DICE
FG and DICE APR.
DICE FG - DICE Monitoring tool: DICE FG uses DICE Monitoring Tool’s RESTful interface to
report:
● CPU utilization, Response time and Throughput, etc. The following example shows the
structure of the JSON query string sending to DMON: DMON{
“fname”: “output”, “index”: “logstash-*”, “ordering”: “asc”, “queryString”: “type:\”collected\” AND plugin:\”CPU\” OR
“type:\”yarn-history\”” OR “type:\”yarn_jobstatsks\”” }
DICE APR - DICE FG: DICE APR accepts the XML format UML model updated by DICE FG as
input and reports the refactoring suggestion at IDE Console. DICE APR also includes two sub
modules, M2M transformation and APDR.
● M2M transformation supports transforming UML diagrams annotated with DICE profiles to
a XML format performance model (i.e., Layered Queueing Network) ● APDR identifies anti-pattern of the UML model with the help of solved LQN model and
provide refactoring decisions for a designer. Functional Description:
DICE Enhancement tool is responsible for closing the gap between runtime performance
measurements and design time model for the anti-patterns detection and refactoring. It is not only able
to estimate and fit application parameters related to runtime of requests and parameterize the DICE
UML models but it can also detect the if anti-patterns exist in the DIAs.
Once the DICE UML model is created, the DICE FG will load the FG configuration file and resource
data (JSON format) to invoke algorithms to parameterize the UML model. DICE APR performs the
M2M transformation to generate the performance mode. Then, it needs to load the APR configuration
file to obtain the anti-pattern boundaries (e.g., thresholds of CPU utilization) to check if the current
application has anti-patterns issues. Refactoring suggestions will be shown to developer through IDE
console.
Deliverable 1.6. DICE Framework – Final version
Copyright © 2017, DICE consortium – All rights reserved 34
Integration Testing Scenario:
In order to run Enhancement tool, assuming that end user already created a UML model by using
Papyrus Editor with the DICE profiles, installed MCR and set MCR path to system path for running
the Matlab functions in Java application, user needs to download two configuration files from FG and
APR repository first, i.e., DICE-FG-Configuration.xml and DICE-APR-Configuration.xml. Then,
user needs to import these configuration files to the project and set the parameters for them (more
details of how to set the parameters can be found in D4.5 and D4.6). After preparing the configurations
files, user can run DICE Enhancement through the popup menu.
To run the DICE FG:
● Right click the target UML model and choose Enhancement Tool -> FG, the DICE FG will
be invoked and the target UML model will be parameterized. The updated information can
be view in the Console. To run the DICE APR:
● Right click the target UML model and choose Enhancement Tool -> APR, the DICE APR
will be invoked. This action will generate five files under the current project.
TargetUMLModelName.lqnx and TargetUMLModelName.xml are corresponding LQN
models supported by lqns and LINE respectively. Two files with .model extension are the
intermediate LQN model and the trace model. The file with _line.xml extension is the solved
performance model. The generated LQN model and the refactoring suggestions can be view
in the Console. Two extra log files, logForAPR.txt and logForFG.txt also will be generated during the runtime.
4.2.9. Quality Testing
Tool Name: Quality Testing Tool
Owner: IMP
Type 1: Inter-
Tool
Integration
Current Status of Integration with other tools:
The QT tool is embedded inside the DIA therefore it has a limited need for integration with other tools.
We have though provided in the QT APIs a function that allows to control the experiment at runtime
using data acquired from the DICE monitoring platform. No other interactions are needed with tools
in the DICE framework.
Interactions:
We have described in deliverable D5.5 the details of the integration between QT and D-MON and we
here give a brief overview, pointing to the deliverable for details and a working example.
QT-LIB now offers a new class, called DMONCapacityMonitor, which eases the integration of QT
with DMON. DMONCapacityMonitor exposes a function getMaxCapacity that recursively parses the
JSON data retrieved from D-MON, which is located via the specified URL and port, until determining
the maximum capacity utilization across all bolts. A working example of invocation of this function
is given deliverable D5.5.
Functional Description:
QT retrieves from DMON a JSON file that is recursively parsed to obtain the delay or capacity metric
based on which the experiment will be controlled. Information about the identity of the bolt does not
need to be supplied, for example one can call:
curMaxBoltCapacity = DMONBoltCapacityMonitor.getMaxCapacity(DMONurl, tStart, tEnd, maxDMONRecords);
where the parameters are
● DMONurl is the URL (with port) at which D-MON listens
● [tStart,tEnd] is the time window of the data to acquire from D-MON
● maxDMONRecords is the maximum number of records to obtain
Deliverable 1.6. DICE Framework – Final version
Copyright © 2017, DICE consortium – All rights reserved 35
As a result, one obtains curMaxBoltCapacity which provides the maximum bolt capacity across all
the bolts of the DIA topology. This is an indicator of the current level of load of the topology and
helps identifying bottlenecks arising in the load testing sequence.
Integration Testing Scenario:
In the validation of QT integration with D-MON we have used the following integration testing
scenario, which has been run on a Storm-based DIA:
● Increase the load on a Storm testbed until hitting peak capacity at one of the bolts
● The code progressively increases the load until reaching the desired peak capacity
● The code calls DMONCapacityMonitor to check automatically from D-MON if the Storm
system has reached the desired utilization.
4.2.10. Configuration Optimization
Tool Name: Configuration Optimization Tool
Owner: IMP
Type 1: Inter-Tool Integration
Current Status of Integration with other tools:
The configuration optimization (CO) IDE plugin tool interacts with the Jenkins-based continuous
integration. In particular the Jenkins instance schedules batch execution of the CO tool. Moreover, it
is possible from the CO IDE plugin to specify the relevant URL for the services used in the runtime
environment by the underpinning CO algorithms (BO4CO, TL4CO) to optimize the Big data
application, in particular the monitoring platform URL.
Interactions:
The CO IDE plugin sends to Jenkins a rule to instantiate the CO runtime engine. The information
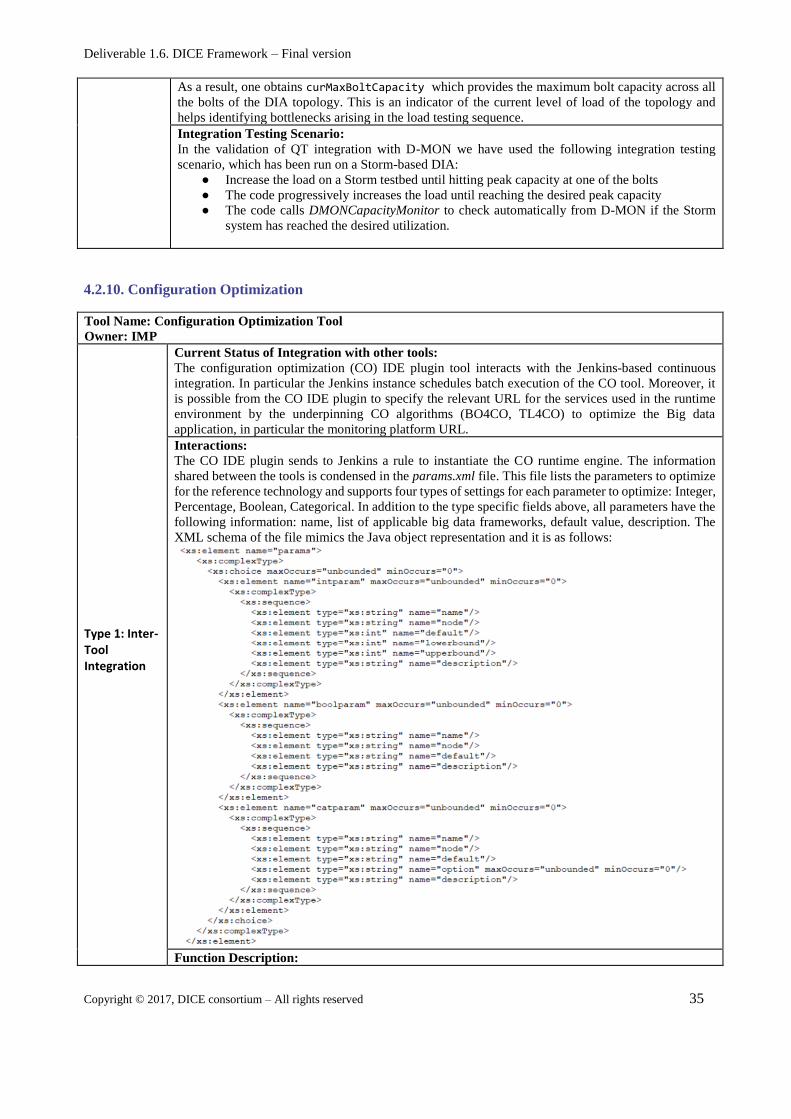
shared between the tools is condensed in the params.xml file. This file lists the parameters to optimize
for the reference technology and supports four types of settings for each parameter to optimize: Integer,
Percentage, Boolean, Categorical. In addition to the type specific fields above, all parameters have the
following information: name, list of applicable big data frameworks, default value, description. The
XML schema of the file mimics the Java object representation and it is as follows:
Function Description:
Deliverable 1.6. DICE Framework – Final version
Copyright © 2017, DICE consortium – All rights reserved 36
The features of the CO plugin have been extensively described in deliverable D5.3 and thus are here
only summarized.
● Selection of configuration parameters of corresponding Big Data technology for optimisation.
● Allow specification of parameter values, ranges and intervals to experiment upon
● Allow configuration of experiment set-up, e.g.: test application to run, numbers of iterations
and experiment time.
● Allow setting of connections to remote Jenkins server, remote testbed and monitoring
services.
● Ability to integrate Eclipse and Jenkins to retrieve and display BO4CO configuration results.
Integration Testing Scenario: An integration test scenario has been considered with the following
steps:
● Definition of a set of Storm parameters via Eclipse IDE dialog window
● Definition of CO settings via Eclipse IDE dialog window
● Start of CO, with automated installation of the Jenkins rule in the Delivery service backend
● Execution of the CO activity
● Return of optimal configuration results back to the user
4.2.11. Fault Injection
Tool Name: Fault Injection Tool
Owner: Flex
Type 1:
Inter-Tool
Integration
Current Status of Integration with other tools:
DICE Deployment Service - The main focus of this integration is with the DICE Deployment Service.
The objective of this is to automatically cause faults on the VMs that make up the containers deployed
by the Dice Deployment Service.
DICE Monitoring Tool - integration with the GUI version of the Fault Injection Tool to monitor VMs
as faults are simulated on them.
Interactions: Fault Injection Tool - DICE Deployment Service
The fault injection tool sends a token to the API of the deployment service in order to authenticate.
The user is then able to list the deployments available, and view the individual nodes inside these
deployments. From here, the Fault Injection Tool is used to automatically cause faults on these VMs
inside the chosen deployment.
Functional Description: Fault Injection Tool DICE Deployment Service
● View details of all deployments on DICE Deployment service
● View details of nodes inside these deployments using deployment ID
● Use Input JSON file to specify which faults are caused on which node
● Automatically cause specified faults on chosen VMs inside containers
Integration Testing Scenario: Fault Injection Tool Dice Deployment Service
● Token in input to the GUI
● Deployments running on DICE deployment service are listed
● JSON file specifying the faults to be caused on which type of node is uploaded
● SSH Key to allow access to nodes is uploaded
● Faults are started and the output is shown in the two output boxes on the GUI
4.2.12. Delivery Tool
Tool Name: Delivery Tool
Owner: XLAB
Type 1:
Inter-Tool
Integration
Current Status of Integration with other tools:
The DICE Delivery Tool has the role of creating DIAs' runtime based on the blueprint (a TOSCA
document extracted from the DDSM). Between M24 and M30, we have finished implementing any of
the missing integrations that are required to carry out the DICE methodology workflows. This
includes:
Deliverable 1.6. DICE Framework – Final version
Copyright © 2017, DICE consortium – All rights reserved 37
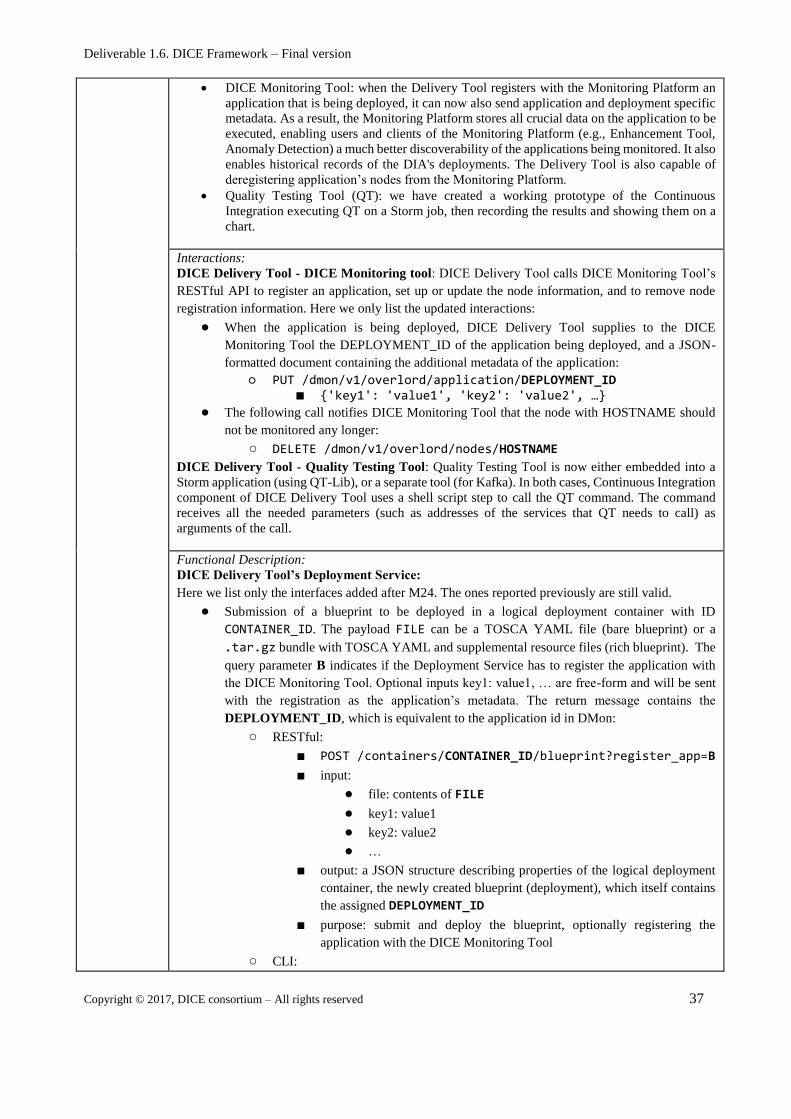
• DICE Monitoring Tool: when the Delivery Tool registers with the Monitoring Platform an
application that is being deployed, it can now also send application and deployment specific
metadata. As a result, the Monitoring Platform stores all crucial data on the application to be
executed, enabling users and clients of the Monitoring Platform (e.g., Enhancement Tool,
Anomaly Detection) a much better discoverability of the applications being monitored. It also
enables historical records of the DIA's deployments. The Delivery Tool is also capable of
deregistering application’s nodes from the Monitoring Platform.
• Quality Testing Tool (QT): we have created a working prototype of the Continuous
Integration executing QT on a Storm job, then recording the results and showing them on a
chart.
Interactions:
DICE Delivery Tool - DICE Monitoring tool: DICE Delivery Tool calls DICE Monitoring Tool’s
RESTful API to register an application, set up or update the node information, and to remove node
registration information. Here we only list the updated interactions:
● When the application is being deployed, DICE Delivery Tool supplies to the DICE
Monitoring Tool the DEPLOYMENT_ID of the application being deployed, and a JSON-
formatted document containing the additional metadata of the application:
○ PUT /dmon/v1/overlord/application/DEPLOYMENT_ID ■ {'key1': 'value1', 'key2': 'value2', …}
● The following call notifies DICE Monitoring Tool that the node with HOSTNAME should
not be monitored any longer:
○ DELETE /dmon/v1/overlord/nodes/HOSTNAME
DICE Delivery Tool - Quality Testing Tool: Quality Testing Tool is now either embedded into a
Storm application (using QT-Lib), or a separate tool (for Kafka). In both cases, Continuous Integration
component of DICE Delivery Tool uses a shell script step to call the QT command. The command
receives all the needed parameters (such as addresses of the services that QT needs to call) as
arguments of the call.
Functional Description:
DICE Delivery Tool’s Deployment Service:
Here we list only the interfaces added after M24. The ones reported previously are still valid.
● Submission of a blueprint to be deployed in a logical deployment container with ID
CONTAINER_ID. The payload FILE can be a TOSCA YAML file (bare blueprint) or a
.tar.gz bundle with TOSCA YAML and supplemental resource files (rich blueprint). The
query parameter B indicates if the Deployment Service has to register the application with
the DICE Monitoring Tool. Optional inputs key1: value1, … are free-form and will be sent
with the registration as the application’s metadata. The return message contains the
DEPLOYMENT_ID, which is equivalent to the application id in DMon:
○ RESTful:
■ POST /containers/CONTAINER_ID/blueprint?register_app=B
■ input:
● file: contents of FILE
● key1: value1
● key2: value2
● …
■ output: a JSON structure describing properties of the logical deployment
container, the newly created blueprint (deployment), which itself contains
the assigned DEPLOYMENT_ID
■ purpose: submit and deploy the blueprint, optionally registering the
application with the DICE Monitoring Tool
○ CLI:
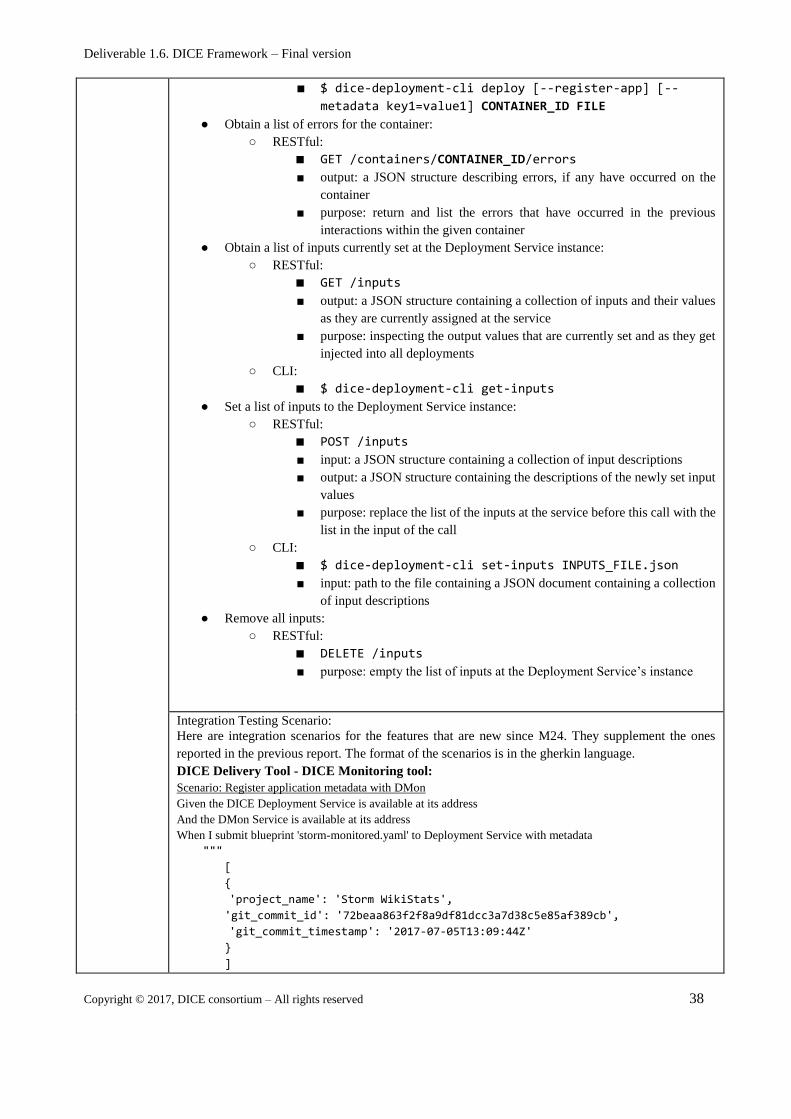
Deliverable 1.6. DICE Framework – Final version
Copyright © 2017, DICE consortium – All rights reserved 38
■ $ dice-deployment-cli deploy [--register-app] [--
metadata key1=value1] CONTAINER_ID FILE
● Obtain a list of errors for the container:
○ RESTful:
■ GET /containers/CONTAINER_ID/errors
■ output: a JSON structure describing errors, if any have occurred on the
container
■ purpose: return and list the errors that have occurred in the previous
interactions within the given container
● Obtain a list of inputs currently set at the Deployment Service instance:
○ RESTful:
■ GET /inputs
■ output: a JSON structure containing a collection of inputs and their values
as they are currently assigned at the service
■ purpose: inspecting the output values that are currently set and as they get
injected into all deployments
○ CLI:
■ $ dice-deployment-cli get-inputs
● Set a list of inputs to the Deployment Service instance:
○ RESTful:
■ POST /inputs
■ input: a JSON structure containing a collection of input descriptions
■ output: a JSON structure containing the descriptions of the newly set input
values
■ purpose: replace the list of the inputs at the service before this call with the
list in the input of the call
○ CLI:
■ $ dice-deployment-cli set-inputs INPUTS_FILE.json
■ input: path to the file containing a JSON document containing a collection
of input descriptions
● Remove all inputs:
○ RESTful:
■ DELETE /inputs
■ purpose: empty the list of inputs at the Deployment Service’s instance
Integration Testing Scenario:
Here are integration scenarios for the features that are new since M24. They supplement the ones
reported in the previous report. The format of the scenarios is in the gherkin language.
DICE Delivery Tool - DICE Monitoring tool:
Scenario: Register application metadata with DMon
Given the DICE Deployment Service is available at its address
And the DMon Service is available at its address
When I submit blueprint 'storm-monitored.yaml' to Deployment Service with metadata
"""
[
{
'project_name': 'Storm WikiStats',
'git_commit_id': '72beaa863f2f8a9df81dcc3a7d38c5e85af389cb',
'git_commit_timestamp': '2017-07-05T13:09:44Z'
}
]
Deliverable 1.6. DICE Framework – Final version
Copyright © 2017, DICE consortium – All rights reserved 39
"""
Then I should receive a deployment ID which I write down as 'MY_APPLICATION_ID'
When I query DMon Observer for application registration
Then I should receive a document containing the following elements
"""
{
'application_id': '$MY_APPLICATION_ID',
'project_name': 'Storm WikiStats',
'git_commit_id': '72beaa863f2f8a9df81dcc3a7d38c5e85af389cb',
'git_commit_timestamp': '2017-07-05T13:09:44Z'
}
"""
Scenario: Undeploying an application cleans up DMon node state
Given the DICE Deployment Service is available at its address
And the DMon Service is available at its address
Then the DMon overlord registered node list should be empty
And the DMon overlord registered role list should be empty
When I submit the blueprint 'storm-monitored.yaml' to DICE Deployment Service
Then I should receive a deployment ID which I write down as 'MY_APPLICATION_ID'
Then the DMon overlord registered node list should NOT be empty
And the DMon overlord registered role list should NOT be empty
When I undeploy the container with ID '$MY_APPLICATION_ID'
And I wait until the container with ID '$MY_APPLICATION_ID' is empty
Then the DMon overlord registered node list should be empty
And the DMon overlord registered role list should be empty
4.3. DICE IDE integration
The DICE Framework is composed of a set of tools; the DICE IDE integrates all the tools of the DICE
framework. Not all tools are integrated in the same way. Several integration patterns, focusing on the Eclipse
plugin architecture, have been defined. The Table 3 contains the description of how each DICE Tool has
finally been integrated into the DICE IDE,
Tool Responsible Description
Deployment
Design PMI
The DICER is fully integrated in the DICE IDE. DICER invocation is possible
through run-configuration menu entries and the front-end itself is able to send through
to the DICE deployment and delivery service the produced TOSCA blueprint.
Simulation
Plugin ZAR
The Simulation tool is composed of Eclipse plugins and therefore it is fully integrated
in the DICE IDE.
Optimization
Plugin PMI
The Optimization tool consists of three main components: an Eclipse plug-in, a
frontend and a backend service. The Eclipse plug-in, which implements the
Optimization tool GUI is fully integrated within the DICE IDE. The frontend and
backend are implemented as web services and are invoked by the optimization
Eclipse plug-in through a REST API.
Verification
Plugin PMI
The front-end of D-verT is composed of Eclipse plugins and is fully integrated in the
DICE IDE. The user activates a verification task on a given UML model by using a
dedicated run-configuration.
Monitoring
Platform IEAT
DICE Monitoring Platform is integrated in the DICE IDE as an external service, by
opening a web view from the Eclipse. The DICE Monitoring Platform plug-in in
Eclipse provider’s end-users with access to the platform's controller service REST
API, the administration interface, and to the visualization engine. The default end-
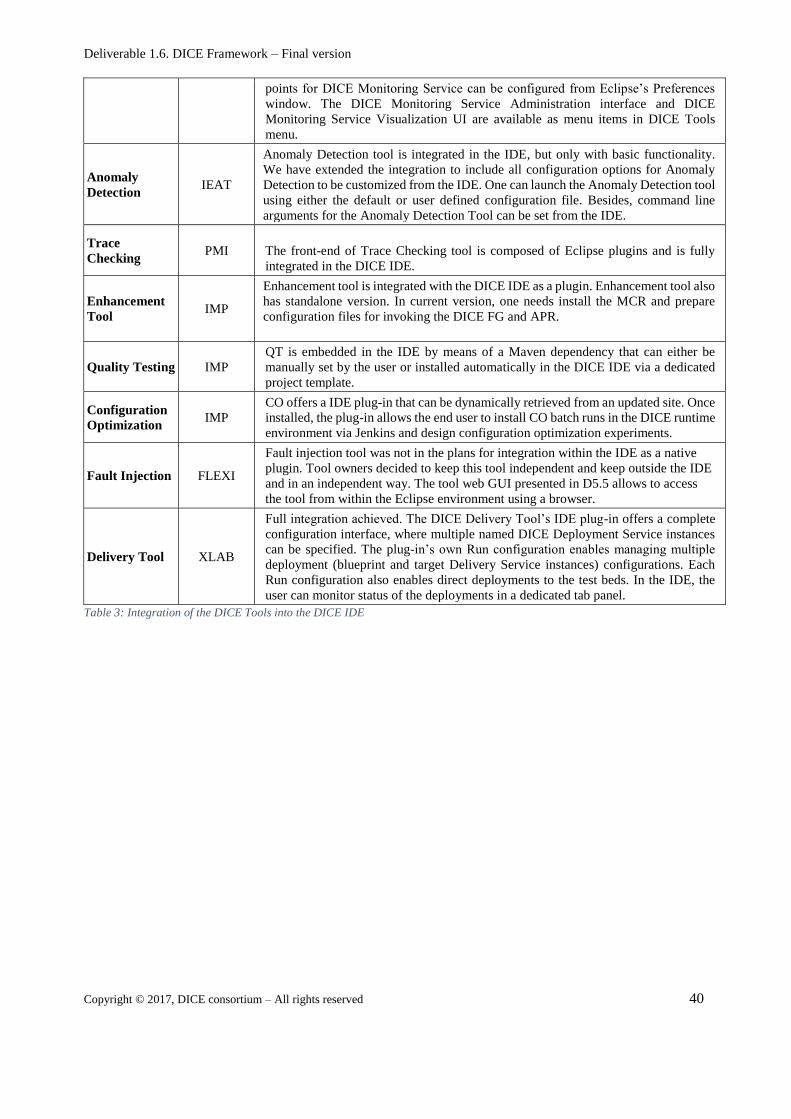
Deliverable 1.6. DICE Framework – Final version
Copyright © 2017, DICE consortium – All rights reserved 40
points for DICE Monitoring Service can be configured from Eclipse’s Preferences
window. The DICE Monitoring Service Administration interface and DICE
Monitoring Service Visualization UI are available as menu items in DICE Tools
menu.
Anomaly
Detection IEAT
Anomaly Detection tool is integrated in the IDE, but only with basic functionality.
We have extended the integration to include all configuration options for Anomaly
Detection to be customized from the IDE. One can launch the Anomaly Detection tool
using either the default or user defined configuration file. Besides, command line
arguments for the Anomaly Detection Tool can be set from the IDE.
Trace
Checking PMI
The front-end of Trace Checking tool is composed of Eclipse plugins and is fully
integrated in the DICE IDE.
Enhancement
Tool IMP
Enhancement tool is integrated with the DICE IDE as a plugin. Enhancement tool also
has standalone version. In current version, one needs install the MCR and prepare
configuration files for invoking the DICE FG and APR.
Quality Testing IMP
QT is embedded in the IDE by means of a Maven dependency that can either be
manually set by the user or installed automatically in the DICE IDE via a dedicated
project template.
Configuration
Optimization IMP
CO offers a IDE plug-in that can be dynamically retrieved from an updated site. Once
installed, the plug-in allows the end user to install CO batch runs in the DICE runtime
environment via Jenkins and design configuration optimization experiments.
Fault Injection FLEXI
Fault injection tool was not in the plans for integration within the IDE as a native
plugin. Tool owners decided to keep this tool independent and keep outside the IDE
and in an independent way. The tool web GUI presented in D5.5 allows to access
the tool from within the Eclipse environment using a browser.
Delivery Tool XLAB
Full integration achieved. The DICE Delivery Tool’s IDE plug-in offers a complete
configuration interface, where multiple named DICE Deployment Service instances
can be specified. The plug-in’s own Run configuration enables managing multiple
deployment (blueprint and target Delivery Service instances) configurations. Each
Run configuration also enables direct deployments to the test beds. In the IDE, the
user can monitor status of the deployments in a dedicated tab panel.
Table 3: Integration of the DICE Tools into the DICE IDE
Deliverable 1.6. DICE Framework – Final version
Copyright © 2017, DICE consortium – All rights reserved 41
5. DICE Tools Information
This section contains detailed information about the DICE tools, such as an introduction to the tool, how to
configure the tool, the tool’s cheat sheets to guide users in using the tool from the DICE IDE and how to start
using the tool. Not all the DICE tools are included in this section, only the new tools available and the tools
that have included significant changes in their use since the first version of this document.
The complete information about the tools can be found in the deliverable for each tool. Also, for a global
reference for the DICE Tools see the Github of the DICE Project (https://github.com/dice-project).
5.1. Verification tool
5.1.1. Introduction
D-VerT (DICE Verification Tool) is the verification tool integrated in the DICE framework. It allows
application designers to evaluate their design against safety properties specifically related to the reachability
of undesired configurations of the system that might alter the desired behavior of the application at runtime.
Verification is performed on annotated DTSM models which contain the required information to perform the
analysis. The analysis of DIAs is instrumented by means of an IDE that hides the complexity of the underlying
models and engines. These interfaces allow the user to automatically produce the formal model to be verified
and the properties to be checked.
The DTSM annotated model and the property to be verified are converted into a JSON object that is conveyed
to the verification service. Based on the type of the property to verify and on the type of model the user
specifies (either Spark or Storm applications) the tool selects the appropriate solver and performs the analysis.
The outcome is sent back to the IDE, which presents the result. The GUI component finally shows whether
the property is fulfilled or not; and, in case of violations, it presents the trace of the system that does not
satisfy the property.
5.1.2. Configuration
The Verification tool Eclipse plug-in can be installed by performing the following steps:
● Download and run Eclipse
● Select Help -> Install New Software
● Write http://dice-project.github.io/DICE-Verification/updates and install D-verT plugins
● Select Help -> Install New Software
● Select "Neon - http://download.eclipse.org/releases/neon" as software site
5.1.3. Cheat sheet
This section describes the methodological steps that the DICE user follows for verifying DICE UML models
with D-VerT, the verification tool of the DICE platform.
D-VerT is useful for assessing the temporal behavior of a DIA. The validation is carried out at the DTSM
level to either:
● verify the presence of bottleneck node in a Storm application, or
● verify the temporal feasibility of a Spark job.
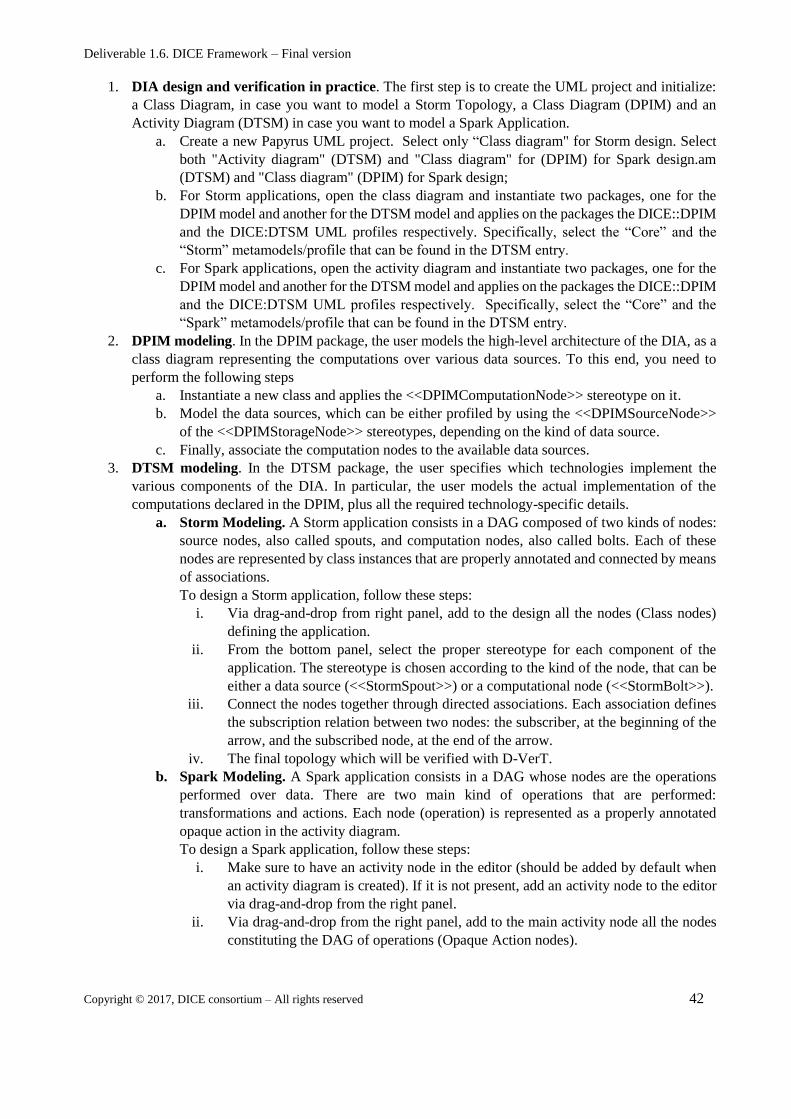
Deliverable 1.6. DICE Framework – Final version
Copyright © 2017, DICE consortium – All rights reserved 42
1. DIA design and verification in practice. The first step is to create the UML project and initialize:
a Class Diagram, in case you want to model a Storm Topology, a Class Diagram (DPIM) and an
Activity Diagram (DTSM) in case you want to model a Spark Application.
a. Create a new Papyrus UML project. Select only “Class diagram" for Storm design. Select
both "Activity diagram" (DTSM) and "Class diagram" for (DPIM) for Spark design.am
(DTSM) and "Class diagram" (DPIM) for Spark design;
b. For Storm applications, open the class diagram and instantiate two packages, one for the
DPIM model and another for the DTSM model and applies on the packages the DICE::DPIM
and the DICE:DTSM UML profiles respectively. Specifically, select the “Core” and the
“Storm” metamodels/profile that can be found in the DTSM entry.
c. For Spark applications, open the activity diagram and instantiate two packages, one for the
DPIM model and another for the DTSM model and applies on the packages the DICE::DPIM
and the DICE:DTSM UML profiles respectively. Specifically, select the “Core” and the
“Spark” metamodels/profile that can be found in the DTSM entry.
2. DPIM modeling. In the DPIM package, the user models the high-level architecture of the DIA, as a
class diagram representing the computations over various data sources. To this end, you need to
perform the following steps
a. Instantiate a new class and applies the <<DPIMComputationNode>> stereotype on it.
b. Model the data sources, which can be either profiled by using the <<DPIMSourceNode>>
of the <<DPIMStorageNode>> stereotypes, depending on the kind of data source.
c. Finally, associate the computation nodes to the available data sources.
3. DTSM modeling. In the DTSM package, the user specifies which technologies implement the
various components of the DIA. In particular, the user models the actual implementation of the
computations declared in the DPIM, plus all the required technology-specific details.
a. Storm Modeling. A Storm application consists in a DAG composed of two kinds of nodes:
source nodes, also called spouts, and computation nodes, also called bolts. Each of these
nodes are represented by class instances that are properly annotated and connected by means
of associations.
To design a Storm application, follow these steps:
i. Via drag-and-drop from right panel, add to the design all the nodes (Class nodes)
defining the application.
ii. From the bottom panel, select the proper stereotype for each component of the
application. The stereotype is chosen according to the kind of the node, that can be
either a data source (<<StormSpout>>) or a computational node (<<StormBolt>>).
iii. Connect the nodes together through directed associations. Each association defines
the subscription relation between two nodes: the subscriber, at the beginning of the
arrow, and the subscribed node, at the end of the arrow.
iv. The final topology which will be verified with D-VerT.
b. Spark Modeling. A Spark application consists in a DAG whose nodes are the operations
performed over data. There are two main kind of operations that are performed:
transformations and actions. Each node (operation) is represented as a properly annotated
opaque action in the activity diagram.
To design a Spark application, follow these steps:
i. Make sure to have an activity node in the editor (should be added by default when
an activity diagram is created). If it is not present, add an activity node to the editor
via drag-and-drop from the right panel.
ii. Via drag-and-drop from the right panel, add to the main activity node all the nodes
constituting the DAG of operations (Opaque Action nodes).
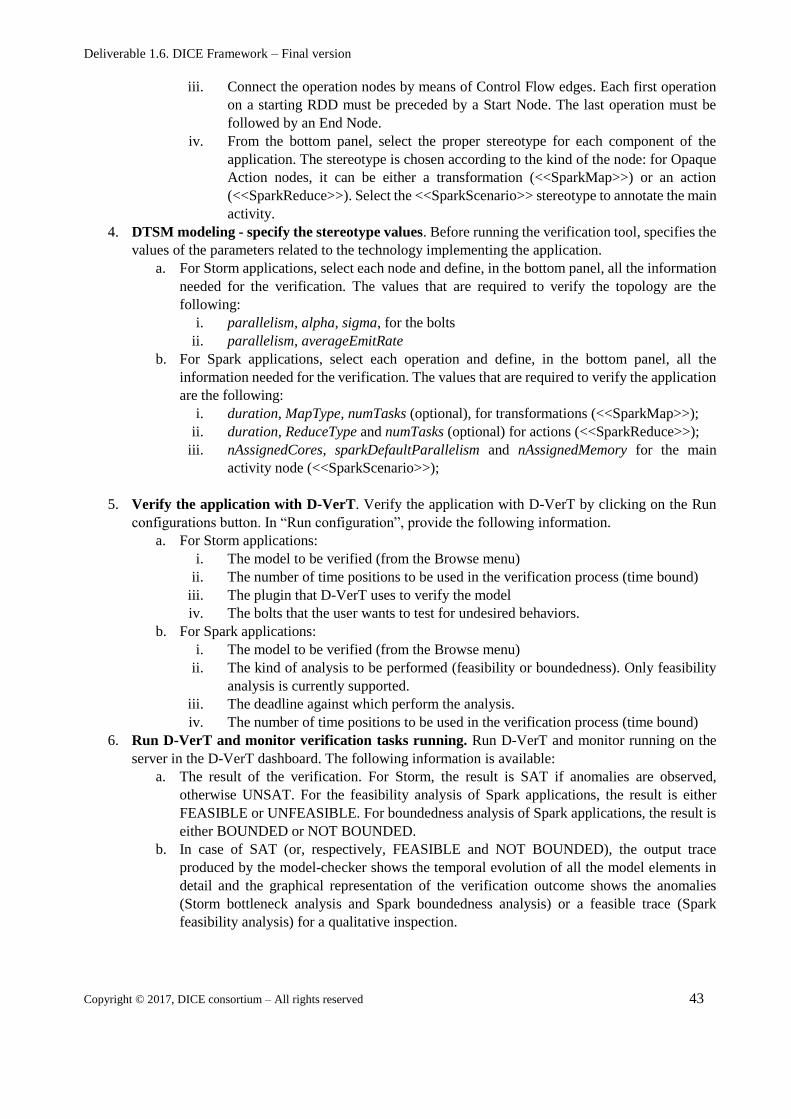
Deliverable 1.6. DICE Framework – Final version
Copyright © 2017, DICE consortium – All rights reserved 43
iii. Connect the operation nodes by means of Control Flow edges. Each first operation
on a starting RDD must be preceded by a Start Node. The last operation must be
followed by an End Node.
iv. From the bottom panel, select the proper stereotype for each component of the
application. The stereotype is chosen according to the kind of the node: for Opaque
Action nodes, it can be either a transformation (<<SparkMap>>) or an action
(<<SparkReduce>>). Select the <<SparkScenario>> stereotype to annotate the main
activity.
4. DTSM modeling - specify the stereotype values. Before running the verification tool, specifies the
values of the parameters related to the technology implementing the application.
a. For Storm applications, select each node and define, in the bottom panel, all the information
needed for the verification. The values that are required to verify the topology are the
following:
i. parallelism, alpha, sigma, for the bolts
ii. parallelism, averageEmitRate
b. For Spark applications, select each operation and define, in the bottom panel, all the
information needed for the verification. The values that are required to verify the application
are the following:
i. duration, MapType, numTasks (optional), for transformations (<<SparkMap>>);
ii. duration, ReduceType and numTasks (optional) for actions (<<SparkReduce>>);
iii. nAssignedCores, sparkDefaultParallelism and nAssignedMemory for the main
activity node (<<SparkScenario>>);
5. Verify the application with D-VerT. Verify the application with D-VerT by clicking on the Run
configurations button. In “Run configuration”, provide the following information.
a. For Storm applications:
i. The model to be verified (from the Browse menu)
ii. The number of time positions to be used in the verification process (time bound)
iii. The plugin that D-VerT uses to verify the model
iv. The bolts that the user wants to test for undesired behaviors.
b. For Spark applications:
i. The model to be verified (from the Browse menu)
ii. The kind of analysis to be performed (feasibility or boundedness). Only feasibility
analysis is currently supported.
iii. The deadline against which perform the analysis.
iv. The number of time positions to be used in the verification process (time bound)
6. Run D-VerT and monitor verification tasks running. Run D-VerT and monitor running on the
server in the D-VerT dashboard. The following information is available:
a. The result of the verification. For Storm, the result is SAT if anomalies are observed,
otherwise UNSAT. For the feasibility analysis of Spark applications, the result is either
FEASIBLE or UNFEASIBLE. For boundedness analysis of Spark applications, the result is
either BOUNDED or NOT BOUNDED.
b. In case of SAT (or, respectively, FEASIBLE and NOT BOUNDED), the output trace
produced by the model-checker shows the temporal evolution of all the model elements in
detail and the graphical representation of the verification outcome shows the anomalies
(Storm bottleneck analysis and Spark boundedness analysis) or a feasible trace (Spark
feasibility analysis) for a qualitative inspection.
Deliverable 1.6. DICE Framework – Final version
Copyright © 2017, DICE consortium – All rights reserved 44
5.1.4. Getting started
Available at https://github.com/dice-project/DICE-Verification/wiki/Getting-Started
5.2. Optimization tool
5.2.1. Introduction
The DICE Optimization Tool (code name D-SPACE4Cloud) is, within the frame of DICE project, the
component in charge of the design-time optimization process. In a nutshell, the rationale of this tool is to
support the application designer in identifying the most cost-effective cluster configuration that fulfills some
desired quality requirements (e.g., deadlines for MapReduce or Spark applications or servers utilization for
Storm clusters).
5.2.2. Configuration
The Optimization tool Eclipse plug-in can be installed by performing the following steps:
● Download and run Eclipse
● Select the Help -> Install New Software menu item
● Type http://dice-project.github.io/DICE-Simulation/updates as software site to work with and install
all the plugins under this namespace
● Select the Help -> Install New Software menu item
● Select "Neon - http://download.eclipse.org/releases/neon" as a software site to work with
● Expand the Modeling tree item
● Install the UML2 Extender SDK plug-in
● Select the Help -> Install New Software menu item
● Select https://github.com/dice-project/DICE-Optimisation-Plugin as a software site to work with and
install D-SPACE4Cloud
● All the Optimization tool Eclipse plug-in settings (e.g., simulator to be used, frontend and backend
end-points, path of the JMT pre-processor needed to transform PNML files for the JMT simulator)
can be set through the window shown in Figure 11 which can be accessed through the Window-
>Preferences menu selecting afterwards D-SPACE4Cloud plug-in.
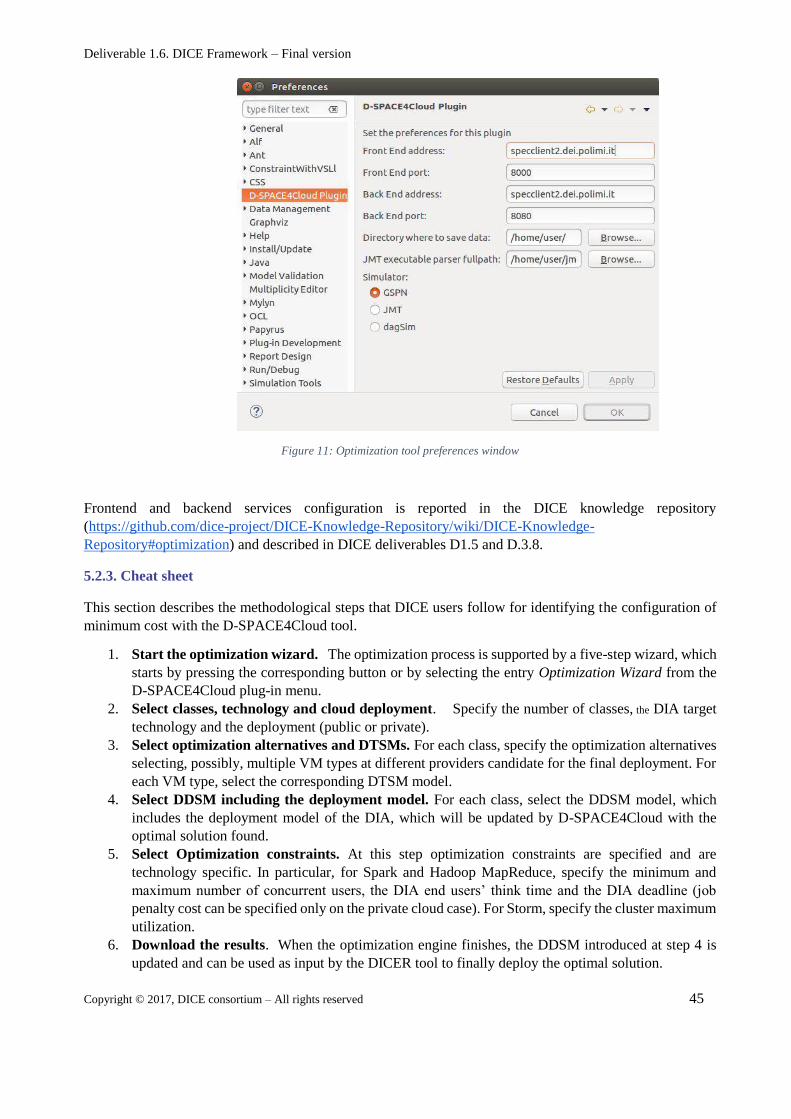
Deliverable 1.6. DICE Framework – Final version
Copyright © 2017, DICE consortium – All rights reserved 45
Figure 11: Optimization tool preferences window
Frontend and backend services configuration is reported in the DICE knowledge repository
(https://github.com/dice-project/DICE-Knowledge-Repository/wiki/DICE-Knowledge-
Repository#optimization) and described in DICE deliverables D1.5 and D.3.8.
5.2.3. Cheat sheet
This section describes the methodological steps that DICE users follow for identifying the configuration of
minimum cost with the D-SPACE4Cloud tool.
1. Start the optimization wizard. The optimization process is supported by a five-step wizard, which
starts by pressing the corresponding button or by selecting the entry Optimization Wizard from the
D-SPACE4Cloud plug-in menu.
2. Select classes, technology and cloud deployment. Specify the number of classes, the DIA target
technology and the deployment (public or private).
3. Select optimization alternatives and DTSMs. For each class, specify the optimization alternatives
selecting, possibly, multiple VM types at different providers candidate for the final deployment. For
each VM type, select the corresponding DTSM model.
4. Select DDSM including the deployment model. For each class, select the DDSM model, which
includes the deployment model of the DIA, which will be updated by D-SPACE4Cloud with the
optimal solution found.
5. Select Optimization constraints. At this step optimization constraints are specified and are
technology specific. In particular, for Spark and Hadoop MapReduce, specify the minimum and
maximum number of concurrent users, the DIA end users’ think time and the DIA deadline (job
penalty cost can be specified only on the private cloud case). For Storm, specify the cluster maximum
utilization.
6. Download the results. When the optimization engine finishes, the DDSM introduced at step 4 is
updated and can be used as input by the DICER tool to finally deploy the optimal solution.
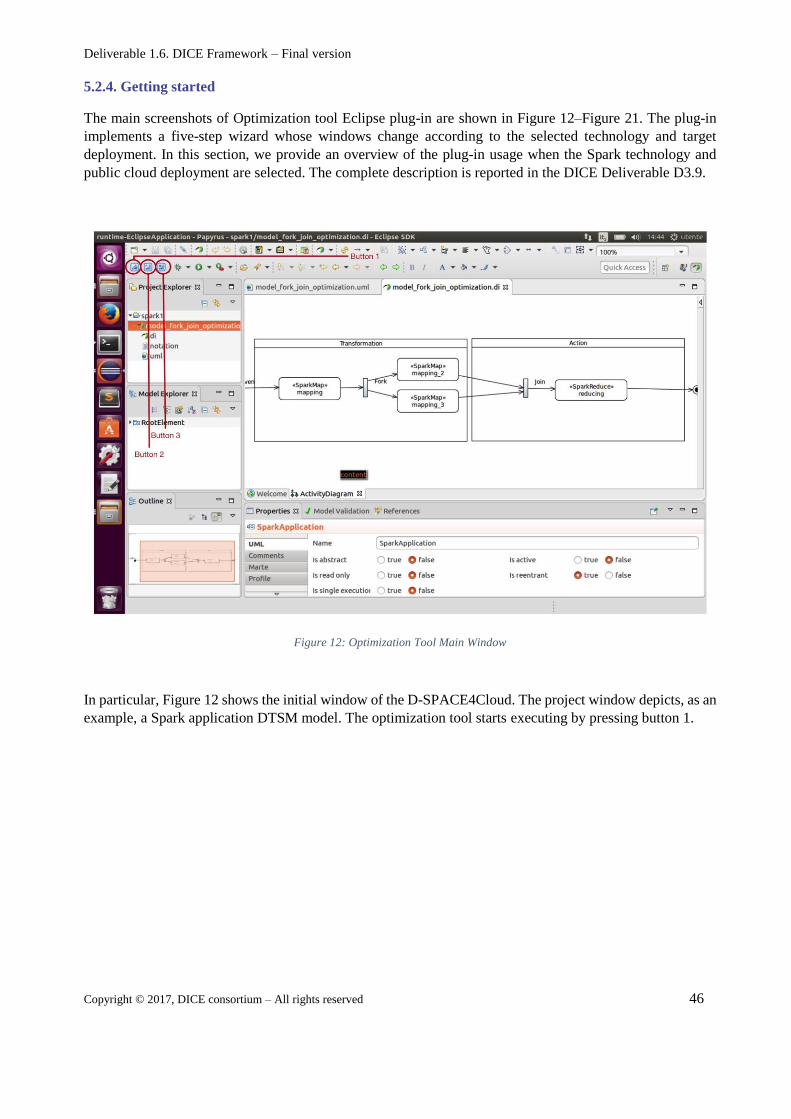
Deliverable 1.6. DICE Framework – Final version
Copyright © 2017, DICE consortium – All rights reserved 46
5.2.4. Getting started
The main screenshots of Optimization tool Eclipse plug-in are shown in Figure 12–Figure 21. The plug-in
implements a five-step wizard whose windows change according to the selected technology and target
deployment. In this section, we provide an overview of the plug-in usage when the Spark technology and
public cloud deployment are selected. The complete description is reported in the DICE Deliverable D3.9.
Figure 12: Optimization Tool Main Window
In particular, Figure 12 shows the initial window of the D-SPACE4Cloud. The project window depicts, as an
example, a Spark application DTSM model. The optimization tool starts executing by pressing button 1.
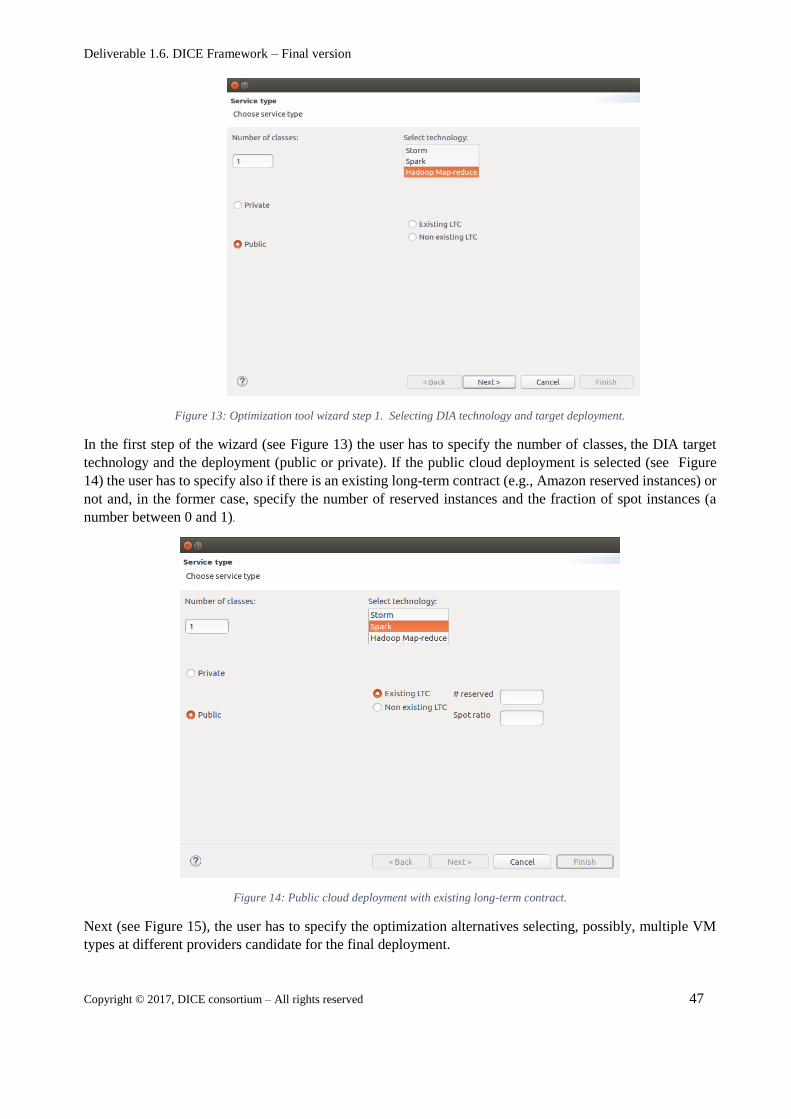
Deliverable 1.6. DICE Framework – Final version
Copyright © 2017, DICE consortium – All rights reserved 47
Figure 13: Optimization tool wizard step 1. Selecting DIA technology and target deployment.
In the first step of the wizard (see Figure 13) the user has to specify the number of classes, the DIA target
technology and the deployment (public or private). If the public cloud deployment is selected (see Figure
14) the user has to specify also if there is an existing long-term contract (e.g., Amazon reserved instances) or
not and, in the former case, specify the number of reserved instances and the fraction of spot instances (a
number between 0 and 1).
Figure 14: Public cloud deployment with existing long-term contract.
Next (see Figure 15), the user has to specify the optimization alternatives selecting, possibly, multiple VM
types at different providers candidate for the final deployment.
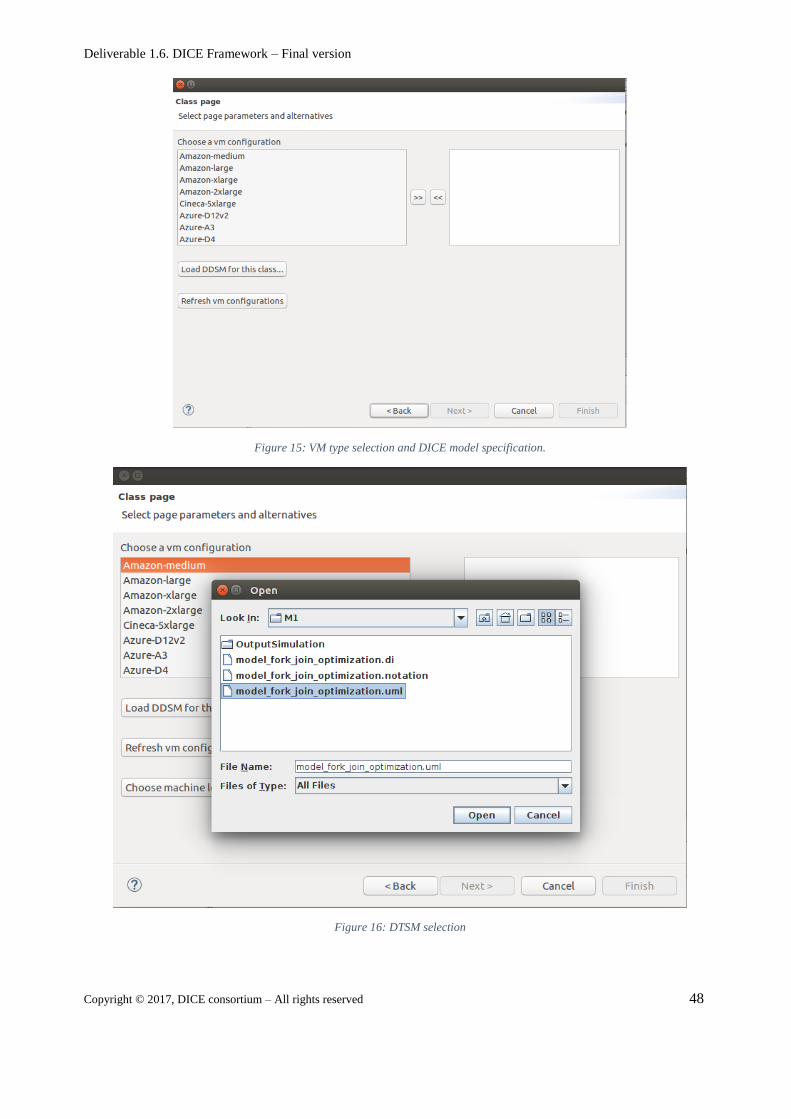
Deliverable 1.6. DICE Framework – Final version
Copyright © 2017, DICE consortium – All rights reserved 48
Figure 15: VM type selection and DICE model specification.
Figure 16: DTSM selection
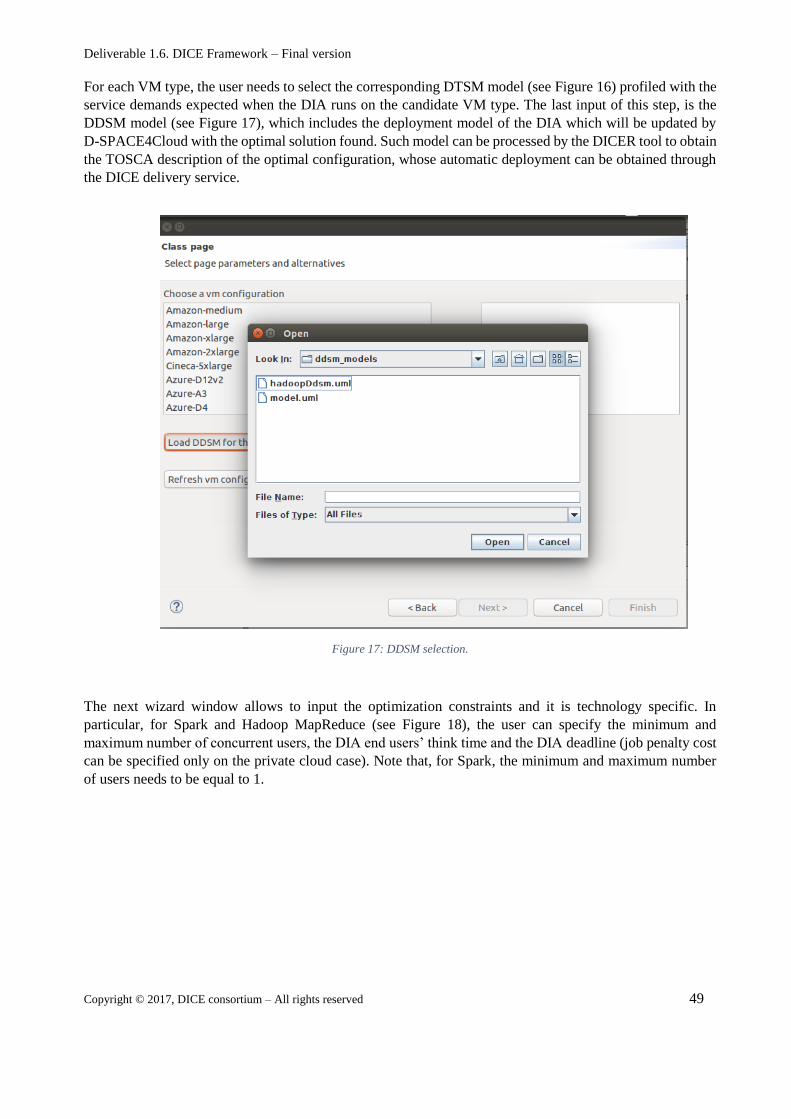
Deliverable 1.6. DICE Framework – Final version
Copyright © 2017, DICE consortium – All rights reserved 49
For each VM type, the user needs to select the corresponding DTSM model (see Figure 16) profiled with the
service demands expected when the DIA runs on the candidate VM type. The last input of this step, is the
DDSM model (see Figure 17), which includes the deployment model of the DIA which will be updated by
D-SPACE4Cloud with the optimal solution found. Such model can be processed by the DICER tool to obtain
the TOSCA description of the optimal configuration, whose automatic deployment can be obtained through
the DICE delivery service.
Figure 17: DDSM selection.
The next wizard window allows to input the optimization constraints and it is technology specific. In
particular, for Spark and Hadoop MapReduce (see Figure 18), the user can specify the minimum and
maximum number of concurrent users, the DIA end users’ think time and the DIA deadline (job penalty cost
can be specified only on the private cloud case). Note that, for Spark, the minimum and maximum number
of users needs to be equal to 1.
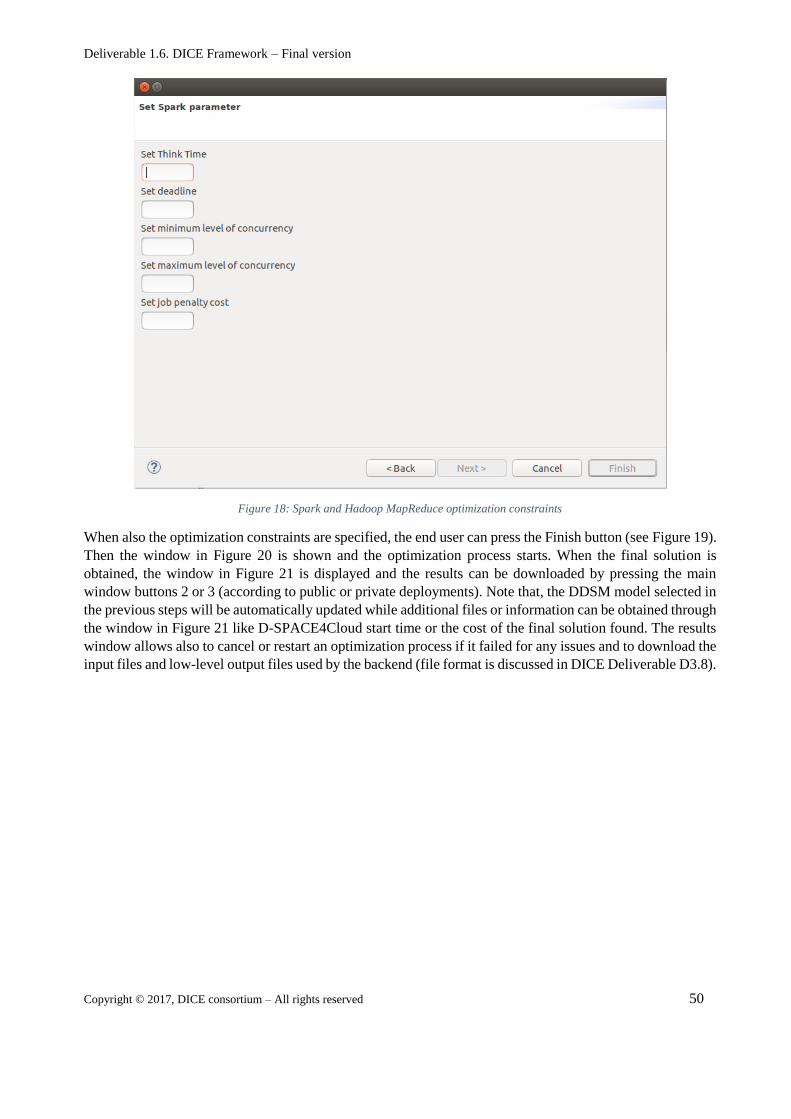
Deliverable 1.6. DICE Framework – Final version
Copyright © 2017, DICE consortium – All rights reserved 50
Figure 18: Spark and Hadoop MapReduce optimization constraints
When also the optimization constraints are specified, the end user can press the Finish button (see Figure 19).
Then the window in Figure 20 is shown and the optimization process starts. When the final solution is
obtained, the window in Figure 21 is displayed and the results can be downloaded by pressing the main
window buttons 2 or 3 (according to public or private deployments). Note that, the DDSM model selected in
the previous steps will be automatically updated while additional files or information can be obtained through
the window in Figure 21 like D-SPACE4Cloud start time or the cost of the final solution found. The results
window allows also to cancel or restart an optimization process if it failed for any issues and to download the
input files and low-level output files used by the backend (file format is discussed in DICE Deliverable D3.8).
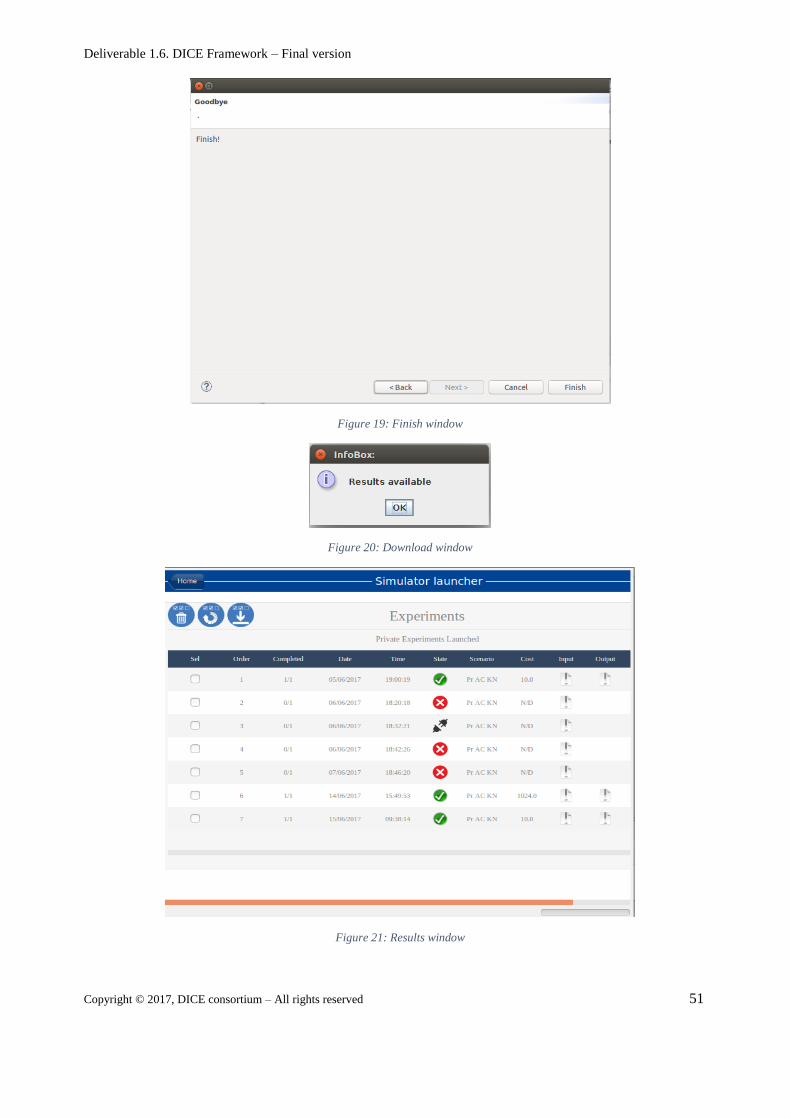
Deliverable 1.6. DICE Framework – Final version
Copyright © 2017, DICE consortium – All rights reserved 51
Figure 19: Finish window
Figure 20: Download window
Figure 21: Results window
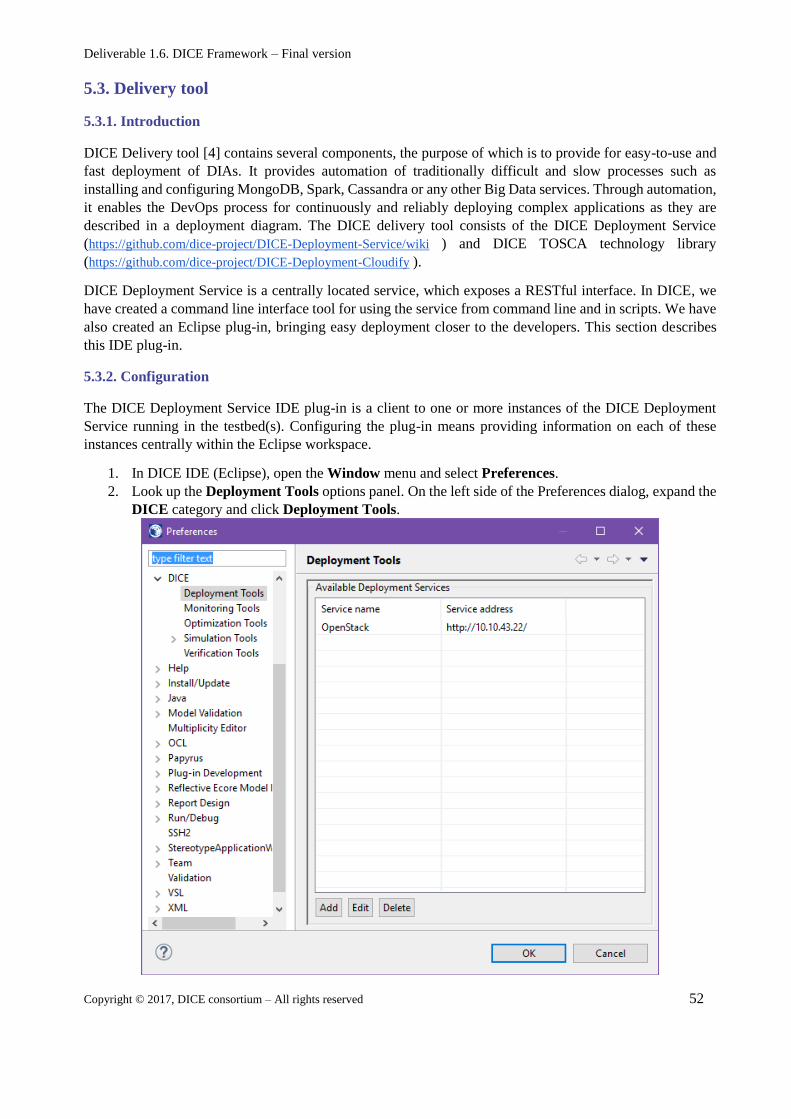
Deliverable 1.6. DICE Framework – Final version
Copyright © 2017, DICE consortium – All rights reserved 52
5.3. Delivery tool
5.3.1. Introduction
DICE Delivery tool [4] contains several components, the purpose of which is to provide for easy-to-use and
fast deployment of DIAs. It provides automation of traditionally difficult and slow processes such as
installing and configuring MongoDB, Spark, Cassandra or any other Big Data services. Through automation,
it enables the DevOps process for continuously and reliably deploying complex applications as they are
described in a deployment diagram. The DICE delivery tool consists of the DICE Deployment Service
(https://github.com/dice-project/DICE-Deployment-Service/wiki ) and DICE TOSCA technology library
(https://github.com/dice-project/DICE-Deployment-Cloudify ).
DICE Deployment Service is a centrally located service, which exposes a RESTful interface. In DICE, we
have created a command line interface tool for using the service from command line and in scripts. We have
also created an Eclipse plug-in, bringing easy deployment closer to the developers. This section describes
this IDE plug-in.
5.3.2. Configuration
The DICE Deployment Service IDE plug-in is a client to one or more instances of the DICE Deployment
Service running in the testbed(s). Configuring the plug-in means providing information on each of these
instances centrally within the Eclipse workspace.
1. In DICE IDE (Eclipse), open the Window menu and select Preferences.
2. Look up the Deployment Tools options panel. On the left side of the Preferences dialog, expand the
DICE category and click Deployment Tools.
Deliverable 1.6. DICE Framework – Final version
Copyright © 2017, DICE consortium – All rights reserved 53
3. To add a new DICE Deployment Service instance, click Add. Or, to edit an existing entry, select it
on the list and click Edit.
4. In the dialog that opens, enter the appropriate values:
○ Name: provide a friendly name for the service to easily identify it from a list.
○ Keystore file: if the DICE Deployment Service uses HTTPS, then provide the file containing
the public and private key for the service. Otherwise leave the field blank.
○ Keystore password: if the DICE Deployment Service uses HTTPS and the keystore is
protected with a password, provide the password here. Otherwise leave the field blank.
○ Username: provide your username for the DICE Deployment Service.
○ Password: provide your password for the DICE Deployment Service.
○ Default container: if all of the above fields have correct values, this drop-down menu will
be automatically populated with the list of the available virtual deployment containers at the
service. Select the one
5. Click OK to confirm and save the preferences.
6. Click OK again to close the preferences.
The plug-in uses a secure store to save the sensitive parts of the configurations. Implementation of this store
depends on the underlying OS, but at the first use you will likely be prompted to provide a master password
for the workspace and an optional password hint. We advise that you use a password strength proportional
to the level of sensitivity of the access to your services. Use a good password manager such as LastPass3 or
KeePass4.
Please note that to create the virtual deployment containers for deploying your application, you need to
navigate to your DICE Deployment Service web page, or use the command line tool. Please refer to the
Container management (https://github.com/dice-project/DICE-Deployment-Service/wiki/Installation#container-
management ) section of the DICE Deployment Service administration guide for instructions.
5.3.3. Cheat Sheets
Registering deployment service
In this section, we will register DICE Deployment Service that is accessible over HTTP or uses a trusted
certificate over HTTPS.
1. Obtain service registration data. If we would like to register new deployment service into delivery
tool, we need to obtain the following pieces of information from administrator, responsible for
maintaining the service: service address, username and password.
2. Open deployment tool preferences. If we would like to register new service, we must first open the
preferences page.
3. Open dialog for adding new service. To start service registration, we must press Add button that
will open dialog with service entry fields.
4. Enter service data. When we have dialog open, we can enter the service information. Address,
username and password should contain the data administrator supplied. Name field should contain
short, descriptive name that we will use to identify this service in other dialogs. Keystore related
fields can be left empty in this scenario. If the data we entered is valid, last field in the dialog will be
auto-populated for us with some default value that we can change if we wish. If we make any error
while entering the data, the error will be displayed at the top of the dialog. When we are done, we
press Ok. If the data we entered is valid, last field in the dialog will be auto-populated for us with
some default value that we can change if we wish. If we make any error while entering the data, the
error will be displayed at the top of the dialog.
3 https://www.lastpass.com/ 4 http://keepass.info/
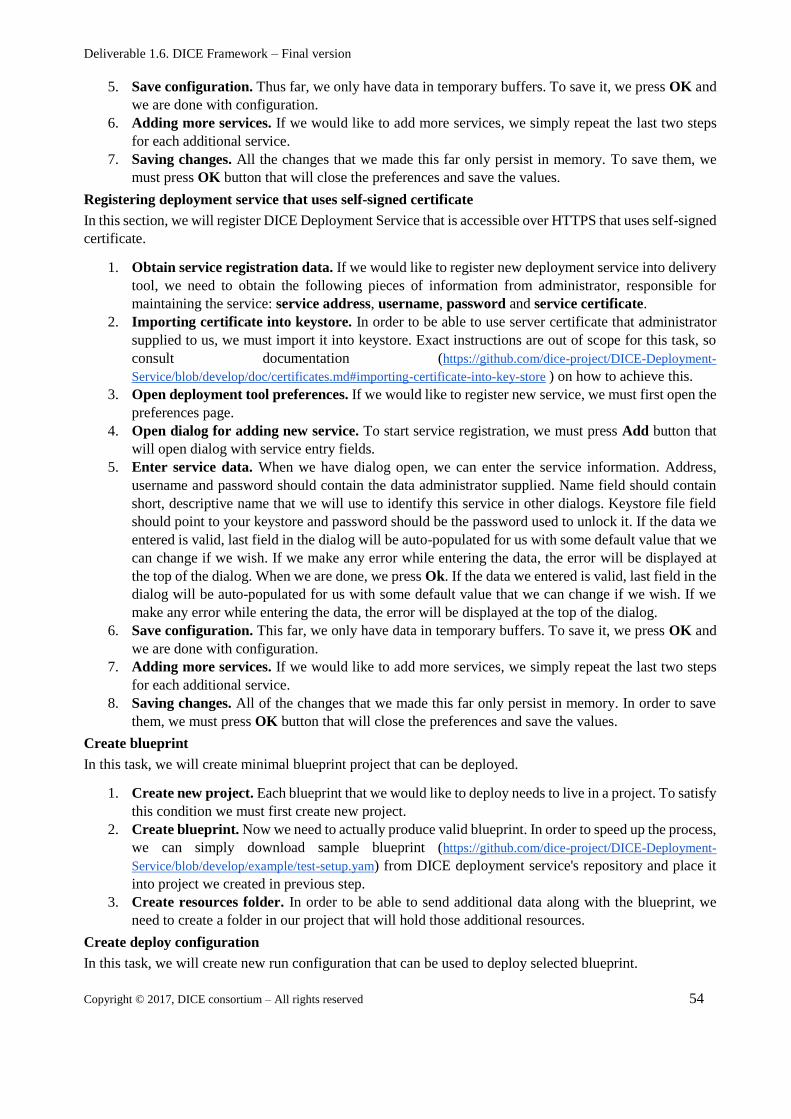
Deliverable 1.6. DICE Framework – Final version
Copyright © 2017, DICE consortium – All rights reserved 54
5. Save configuration. Thus far, we only have data in temporary buffers. To save it, we press OK and
we are done with configuration.
6. Adding more services. If we would like to add more services, we simply repeat the last two steps
for each additional service.
7. Saving changes. All the changes that we made this far only persist in memory. To save them, we
must press OK button that will close the preferences and save the values.
Registering deployment service that uses self-signed certificate
In this section, we will register DICE Deployment Service that is accessible over HTTPS that uses self-signed
certificate.
1. Obtain service registration data. If we would like to register new deployment service into delivery
tool, we need to obtain the following pieces of information from administrator, responsible for
maintaining the service: service address, username, password and service certificate.
2. Importing certificate into keystore. In order to be able to use server certificate that administrator
supplied to us, we must import it into keystore. Exact instructions are out of scope for this task, so
consult documentation (https://github.com/dice-project/DICE-Deployment-
Service/blob/develop/doc/certificates.md#importing-certificate-into-key-store ) on how to achieve this.
3. Open deployment tool preferences. If we would like to register new service, we must first open the
preferences page.
4. Open dialog for adding new service. To start service registration, we must press Add button that
will open dialog with service entry fields.
5. Enter service data. When we have dialog open, we can enter the service information. Address,
username and password should contain the data administrator supplied. Name field should contain
short, descriptive name that we will use to identify this service in other dialogs. Keystore file field
should point to your keystore and password should be the password used to unlock it. If the data we
entered is valid, last field in the dialog will be auto-populated for us with some default value that we
can change if we wish. If we make any error while entering the data, the error will be displayed at
the top of the dialog. When we are done, we press Ok. If the data we entered is valid, last field in the
dialog will be auto-populated for us with some default value that we can change if we wish. If we
make any error while entering the data, the error will be displayed at the top of the dialog.
6. Save configuration. This far, we only have data in temporary buffers. To save it, we press OK and
we are done with configuration.
7. Adding more services. If we would like to add more services, we simply repeat the last two steps
for each additional service.
8. Saving changes. All of the changes that we made this far only persist in memory. In order to save
them, we must press OK button that will close the preferences and save the values.
Create blueprint
In this task, we will create minimal blueprint project that can be deployed.
1. Create new project. Each blueprint that we would like to deploy needs to live in a project. To satisfy
this condition we must first create new project.
2. Create blueprint. Now we need to actually produce valid blueprint. In order to speed up the process,
we can simply download sample blueprint (https://github.com/dice-project/DICE-Deployment-
Service/blob/develop/example/test-setup.yam) from DICE deployment service's repository and place it
into project we created in previous step.
3. Create resources folder. In order to be able to send additional data along with the blueprint, we
need to create a folder in our project that will hold those additional resources.
Create deploy configuration
In this task, we will create new run configuration that can be used to deploy selected blueprint.
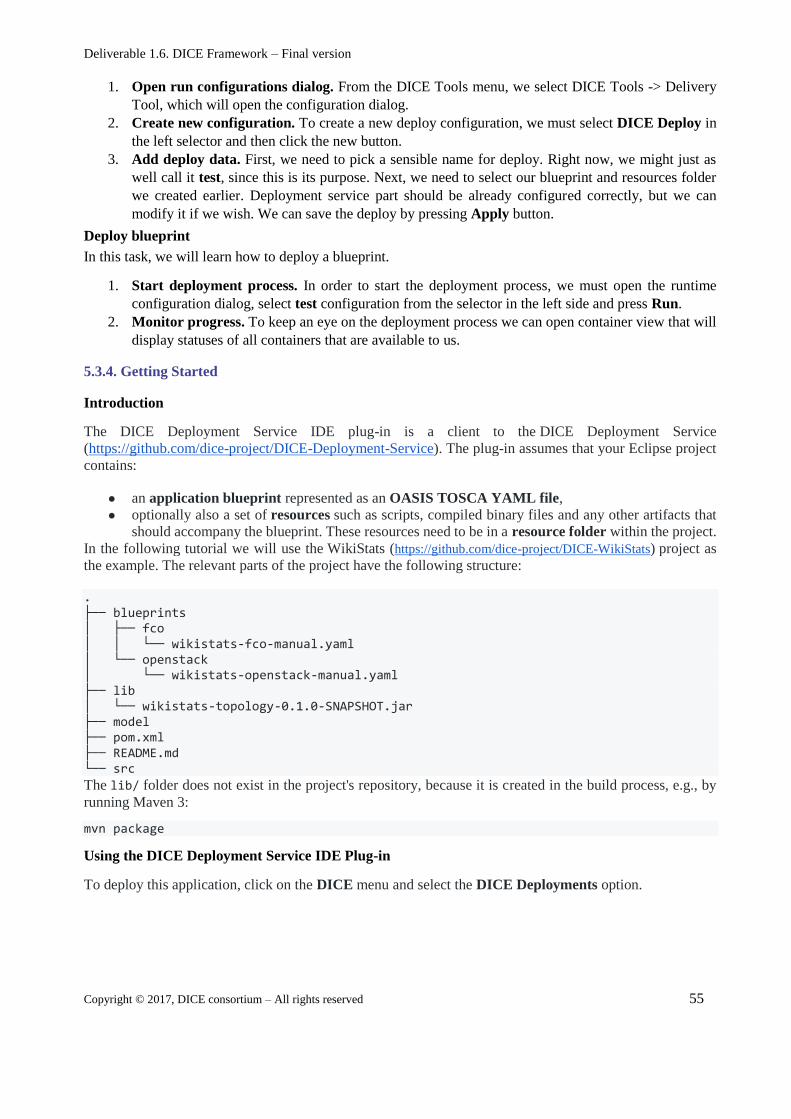
Deliverable 1.6. DICE Framework – Final version
Copyright © 2017, DICE consortium – All rights reserved 55
1. Open run configurations dialog. From the DICE Tools menu, we select DICE Tools -> Delivery
Tool, which will open the configuration dialog.
2. Create new configuration. To create a new deploy configuration, we must select DICE Deploy in
the left selector and then click the new button.
3. Add deploy data. First, we need to pick a sensible name for deploy. Right now, we might just as
well call it test, since this is its purpose. Next, we need to select our blueprint and resources folder
we created earlier. Deployment service part should be already configured correctly, but we can
modify it if we wish. We can save the deploy by pressing Apply button.
Deploy blueprint
In this task, we will learn how to deploy a blueprint.
1. Start deployment process. In order to start the deployment process, we must open the runtime
configuration dialog, select test configuration from the selector in the left side and press Run.
2. Monitor progress. To keep an eye on the deployment process we can open container view that will
display statuses of all containers that are available to us.
5.3.4. Getting Started
Introduction
The DICE Deployment Service IDE plug-in is a client to the DICE Deployment Service
(https://github.com/dice-project/DICE-Deployment-Service). The plug-in assumes that your Eclipse project
contains:
● an application blueprint represented as an OASIS TOSCA YAML file,
● optionally also a set of resources such as scripts, compiled binary files and any other artifacts that
should accompany the blueprint. These resources need to be in a resource folder within the project.
In the following tutorial we will use the WikiStats (https://github.com/dice-project/DICE-WikiStats) project as
the example. The relevant parts of the project have the following structure:
. ├── blueprints │ ├── fco │ │ └── wikistats-fco-manual.yaml │ └── openstack │ └── wikistats-openstack-manual.yaml ├── lib │ └── wikistats-topology-0.1.0-SNAPSHOT.jar ├── model ├── pom.xml ├── README.md └── src
The lib/ folder does not exist in the project's repository, because it is created in the build process, e.g., by
running Maven 3:
mvn package
Using the DICE Deployment Service IDE Plug-in
To deploy this application, click on the DICE menu and select the DICE Deployments option.
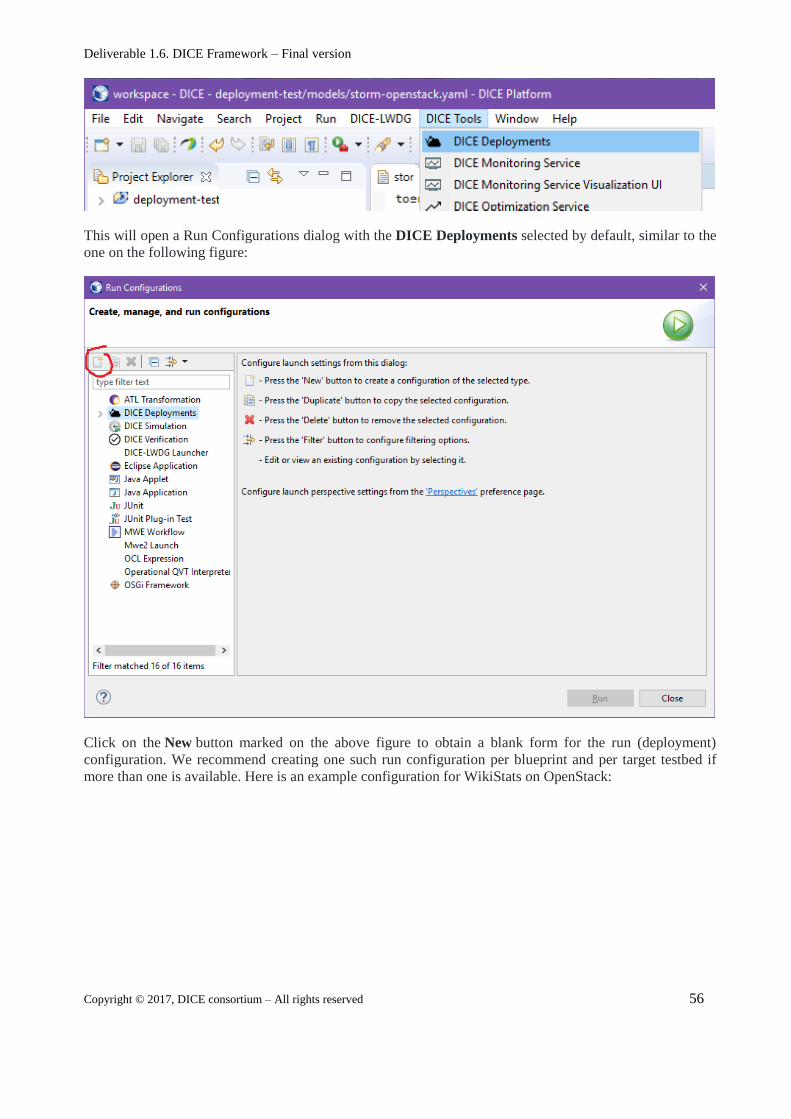
Deliverable 1.6. DICE Framework – Final version
Copyright © 2017, DICE consortium – All rights reserved 56
This will open a Run Configurations dialog with the DICE Deployments selected by default, similar to the
one on the following figure:
Click on the New button marked on the above figure to obtain a blank form for the run (deployment)
configuration. We recommend creating one such run configuration per blueprint and per target testbed if
more than one is available. Here is an example configuration for WikiStats on OpenStack:
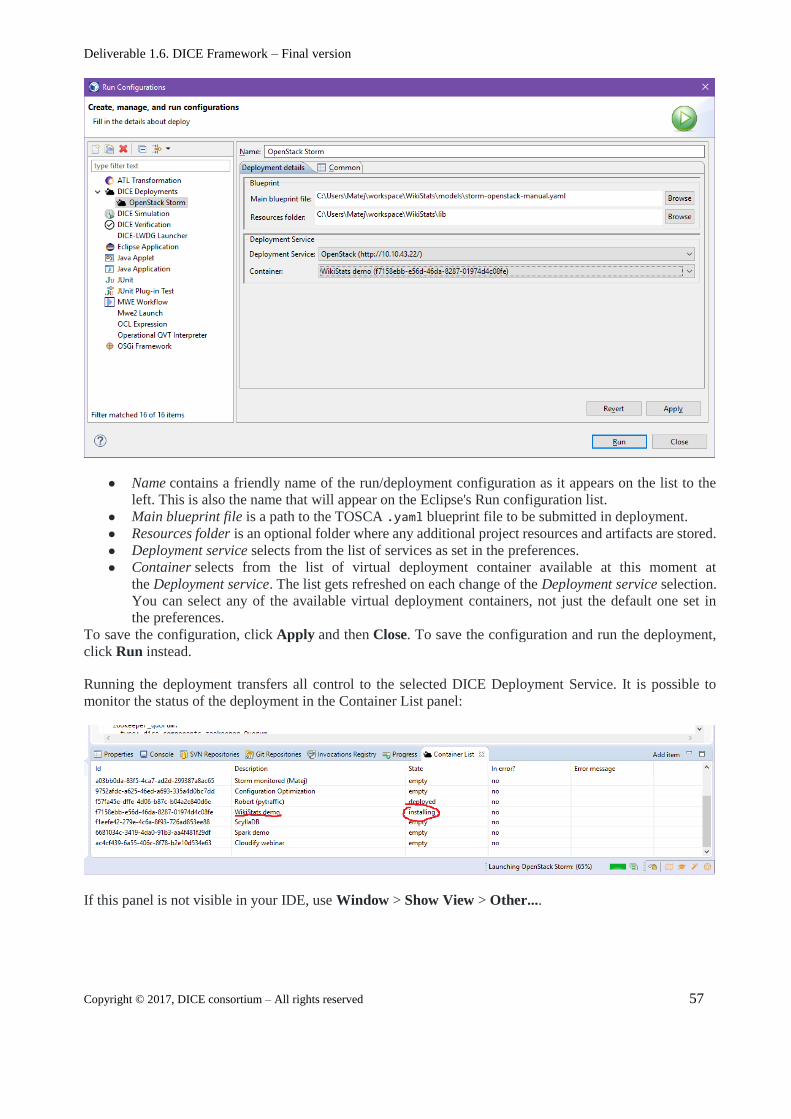
Deliverable 1.6. DICE Framework – Final version
Copyright © 2017, DICE consortium – All rights reserved 57
● Name contains a friendly name of the run/deployment configuration as it appears on the list to the
left. This is also the name that will appear on the Eclipse's Run configuration list.
● Main blueprint file is a path to the TOSCA .yaml blueprint file to be submitted in deployment.
● Resources folder is an optional folder where any additional project resources and artifacts are stored.
● Deployment service selects from the list of services as set in the preferences.
● Container selects from the list of virtual deployment container available at this moment at
the Deployment service. The list gets refreshed on each change of the Deployment service selection.
You can select any of the available virtual deployment containers, not just the default one set in
the preferences.
To save the configuration, click Apply and then Close. To save the configuration and run the deployment,
click Run instead.
Running the deployment transfers all control to the selected DICE Deployment Service. It is possible to
monitor the status of the deployment in the Container List panel:
If this panel is not visible in your IDE, use Window > Show View > Other....
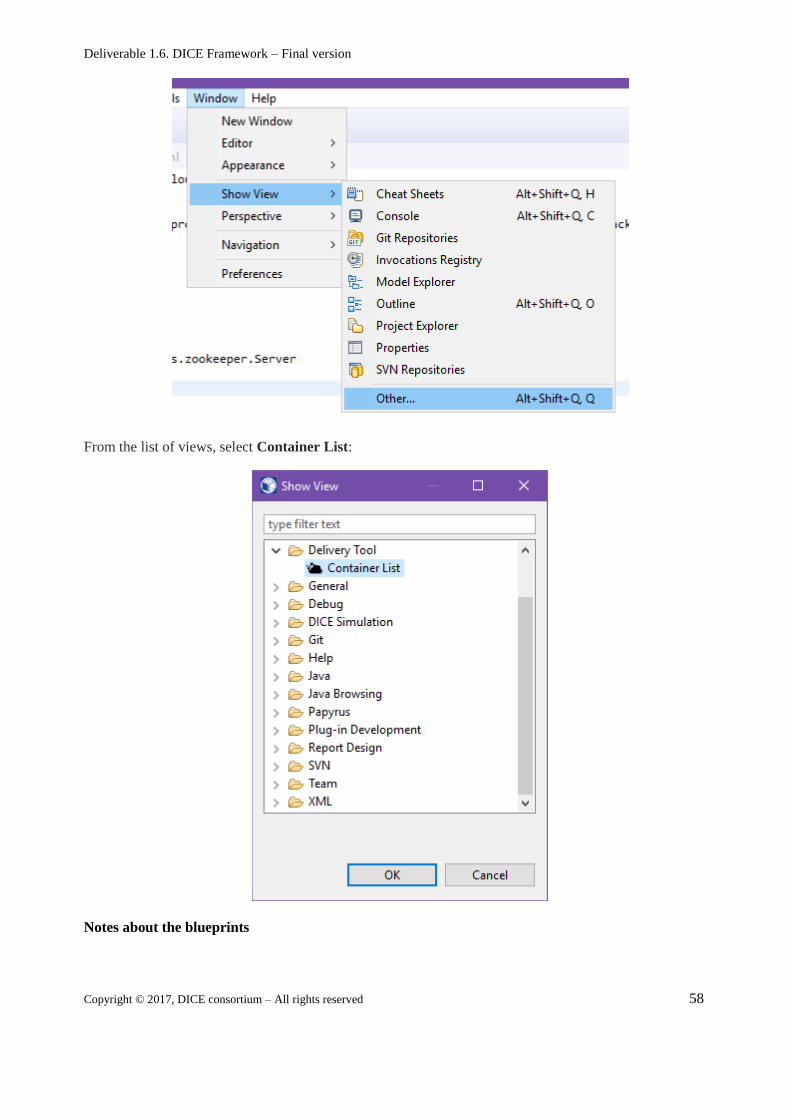
Deliverable 1.6. DICE Framework – Final version
Copyright © 2017, DICE consortium – All rights reserved 58
From the list of views, select Container List:
Notes about the blueprints
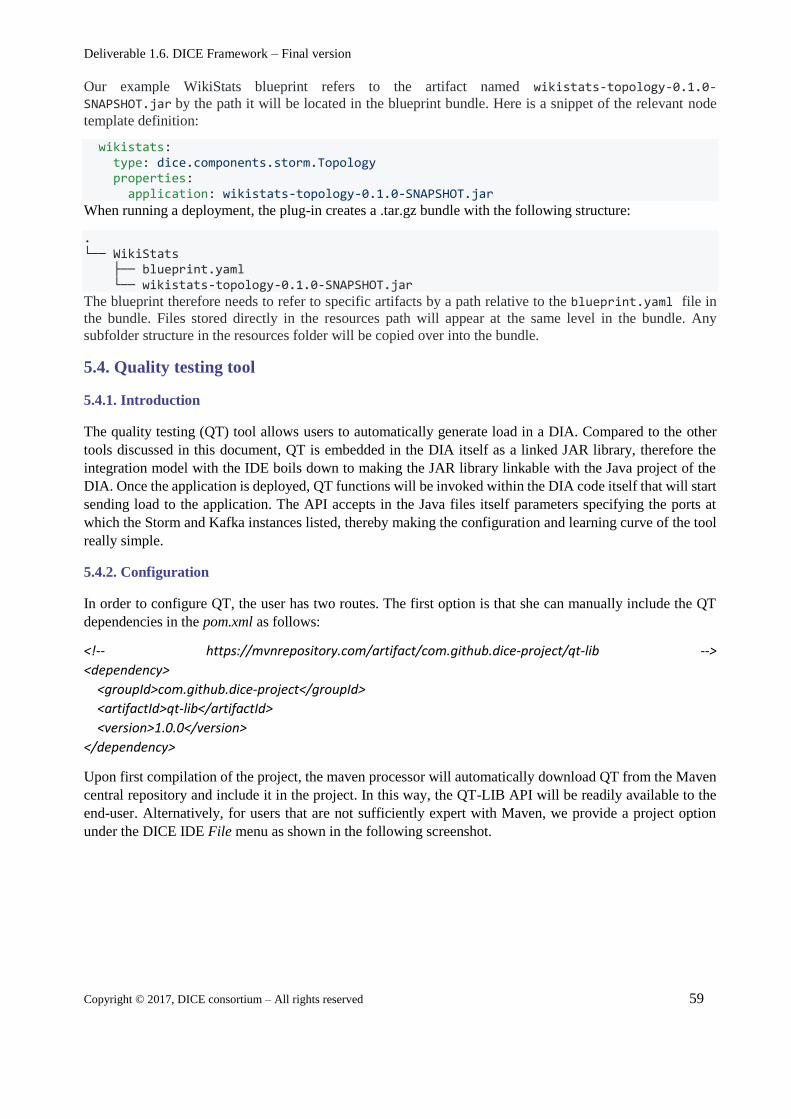
Deliverable 1.6. DICE Framework – Final version
Copyright © 2017, DICE consortium – All rights reserved 59
Our example WikiStats blueprint refers to the artifact named wikistats-topology-0.1.0-
SNAPSHOT.jar by the path it will be located in the blueprint bundle. Here is a snippet of the relevant node
template definition:
wikistats: type: dice.components.storm.Topology properties: application: wikistats-topology-0.1.0-SNAPSHOT.jar
When running a deployment, the plug-in creates a .tar.gz bundle with the following structure:
. └── WikiStats ├── blueprint.yaml └── wikistats-topology-0.1.0-SNAPSHOT.jar
The blueprint therefore needs to refer to specific artifacts by a path relative to the blueprint.yaml file in
the bundle. Files stored directly in the resources path will appear at the same level in the bundle. Any
subfolder structure in the resources folder will be copied over into the bundle.
5.4. Quality testing tool
5.4.1. Introduction
The quality testing (QT) tool allows users to automatically generate load in a DIA. Compared to the other
tools discussed in this document, QT is embedded in the DIA itself as a linked JAR library, therefore the
integration model with the IDE boils down to making the JAR library linkable with the Java project of the
DIA. Once the application is deployed, QT functions will be invoked within the DIA code itself that will start
sending load to the application. The API accepts in the Java files itself parameters specifying the ports at
which the Storm and Kafka instances listed, thereby making the configuration and learning curve of the tool
really simple.
5.4.2. Configuration
In order to configure QT, the user has two routes. The first option is that she can manually include the QT
dependencies in the pom.xml as follows:
<!-- https://mvnrepository.com/artifact/com.github.dice-project/qt-lib -->
<dependency>
<groupId>com.github.dice-project</groupId>
<artifactId>qt-lib</artifactId>
<version>1.0.0</version>
</dependency>
Upon first compilation of the project, the maven processor will automatically download QT from the Maven
central repository and include it in the project. In this way, the QT-LIB API will be readily available to the
end-user. Alternatively, for users that are not sufficiently expert with Maven, we provide a project option
under the DICE IDE File menu as shown in the following screenshot.
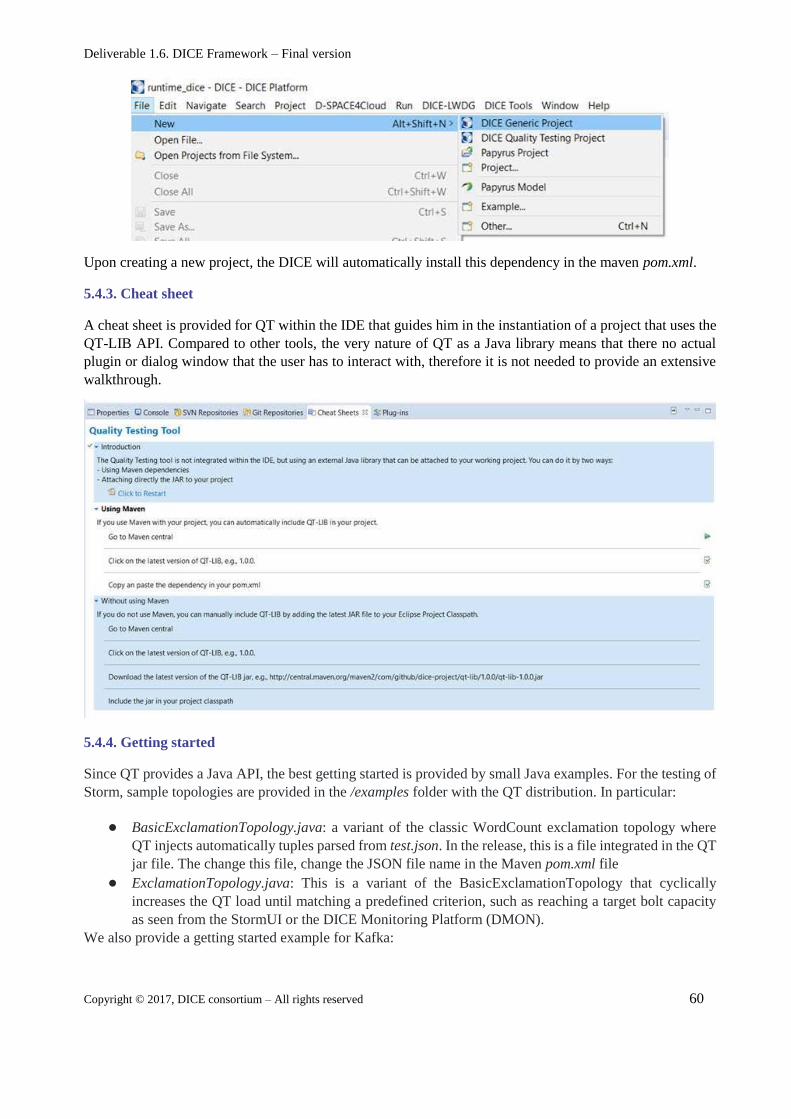
Deliverable 1.6. DICE Framework – Final version
Copyright © 2017, DICE consortium – All rights reserved 60
Upon creating a new project, the DICE will automatically install this dependency in the maven pom.xml.
5.4.3. Cheat sheet
A cheat sheet is provided for QT within the IDE that guides him in the instantiation of a project that uses the
QT-LIB API. Compared to other tools, the very nature of QT as a Java library means that there no actual
plugin or dialog window that the user has to interact with, therefore it is not needed to provide an extensive
walkthrough.
5.4.4. Getting started
Since QT provides a Java API, the best getting started is provided by small Java examples. For the testing of
Storm, sample topologies are provided in the /examples folder with the QT distribution. In particular:
● BasicExclamationTopology.java: a variant of the classic WordCount exclamation topology where
QT injects automatically tuples parsed from test.json. In the release, this is a file integrated in the QT
jar file. The change this file, change the JSON file name in the Maven pom.xml file
● ExclamationTopology.java: This is a variant of the BasicExclamationTopology that cyclically
increases the QT load until matching a predefined criterion, such as reaching a target bolt capacity
as seen from the StormUI or the DICE Monitoring Platform (DMON).
We also provide a getting started example for Kafka:
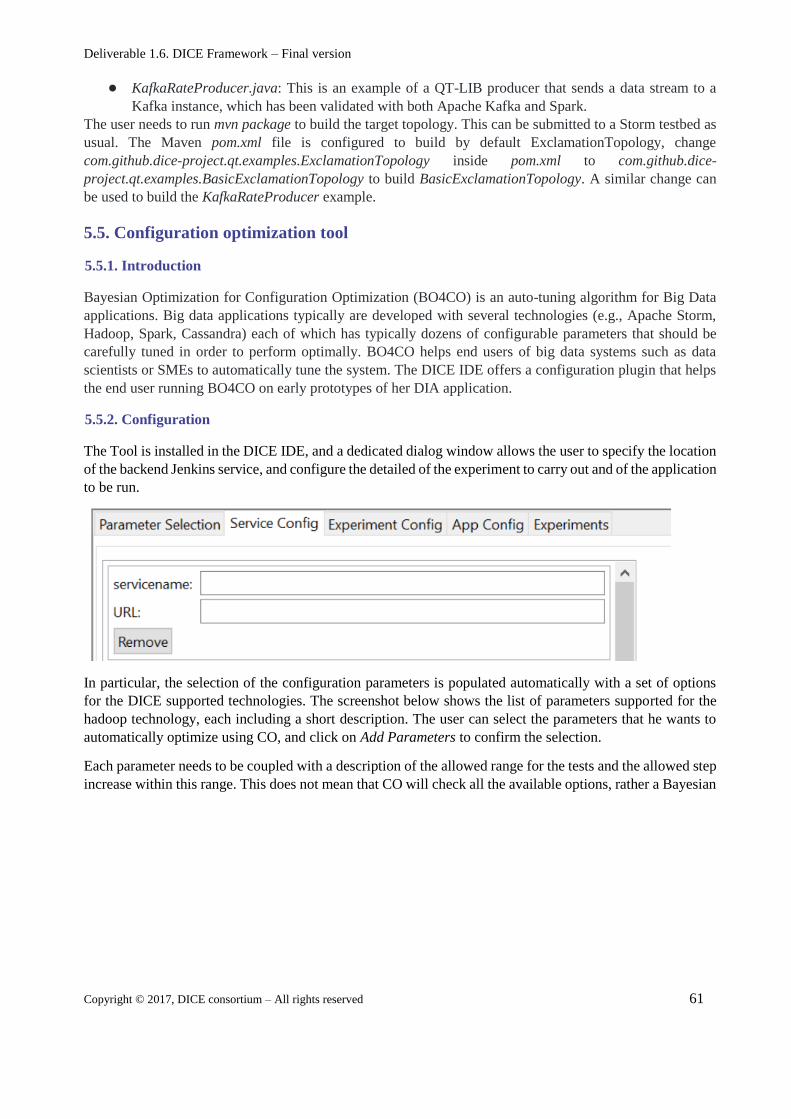
Deliverable 1.6. DICE Framework – Final version
Copyright © 2017, DICE consortium – All rights reserved 61
● KafkaRateProducer.java: This is an example of a QT-LIB producer that sends a data stream to a
Kafka instance, which has been validated with both Apache Kafka and Spark.
The user needs to run mvn package to build the target topology. This can be submitted to a Storm testbed as
usual. The Maven pom.xml file is configured to build by default ExclamationTopology, change
com.github.dice-project.qt.examples.ExclamationTopology inside pom.xml to com.github.dice-
project.qt.examples.BasicExclamationTopology to build BasicExclamationTopology. A similar change can
be used to build the KafkaRateProducer example.
5.5. Configuration optimization tool
5.5.1. Introduction
Bayesian Optimization for Configuration Optimization (BO4CO) is an auto-tuning algorithm for Big Data
applications. Big data applications typically are developed with several technologies (e.g., Apache Storm,
Hadoop, Spark, Cassandra) each of which has typically dozens of configurable parameters that should be
carefully tuned in order to perform optimally. BO4CO helps end users of big data systems such as data
scientists or SMEs to automatically tune the system. The DICE IDE offers a configuration plugin that helps
the end user running BO4CO on early prototypes of her DIA application.
5.5.2. Configuration
The Tool is installed in the DICE IDE, and a dedicated dialog window allows the user to specify the location
of the backend Jenkins service, and configure the detailed of the experiment to carry out and of the application
to be run.
In particular, the selection of the configuration parameters is populated automatically with a set of options
for the DICE supported technologies. The screenshot below shows the list of parameters supported for the
hadoop technology, each including a short description. The user can select the parameters that he wants to
automatically optimize using CO, and click on Add Parameters to confirm the selection.
Each parameter needs to be coupled with a description of the allowed range for the tests and the allowed step
increase within this range. This does not mean that CO will check all the available options, rather a Bayesian
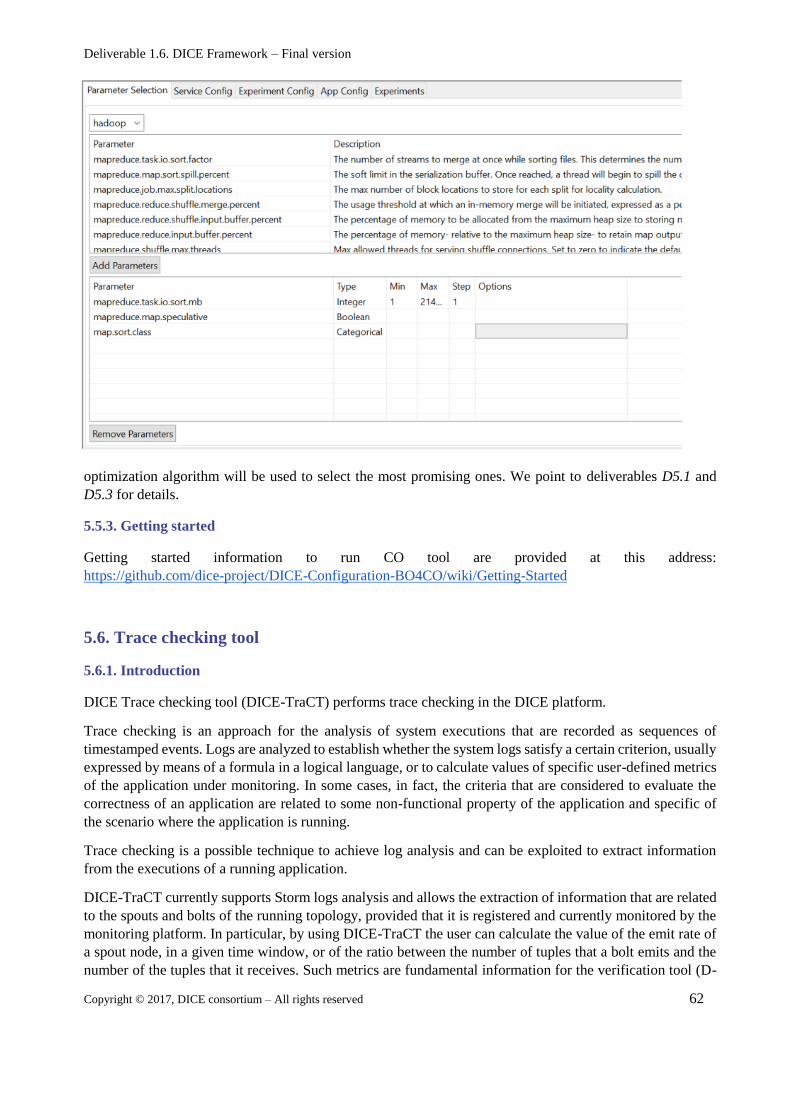
Deliverable 1.6. DICE Framework – Final version
Copyright © 2017, DICE consortium – All rights reserved 62
optimization algorithm will be used to select the most promising ones. We point to deliverables D5.1 and
D5.3 for details.
5.5.3. Getting started
Getting started information to run CO tool are provided at this address:
https://github.com/dice-project/DICE-Configuration-BO4CO/wiki/Getting-Started
5.6. Trace checking tool
5.6.1. Introduction
DICE Trace checking tool (DICE-TraCT) performs trace checking in the DICE platform.
Trace checking is an approach for the analysis of system executions that are recorded as sequences of
timestamped events. Logs are analyzed to establish whether the system logs satisfy a certain criterion, usually
expressed by means of a formula in a logical language, or to calculate values of specific user-defined metrics
of the application under monitoring. In some cases, in fact, the criteria that are considered to evaluate the
correctness of an application are related to some non-functional property of the application and specific of
the scenario where the application is running.
Trace checking is a possible technique to achieve log analysis and can be exploited to extract information
from the executions of a running application.
DICE-TraCT currently supports Storm logs analysis and allows the extraction of information that are related
to the spouts and bolts of the running topology, provided that it is registered and currently monitored by the
monitoring platform. In particular, by using DICE-TraCT the user can calculate the value of the emit rate of
a spout node, in a given time window, or of the ratio between the number of tuples that a bolt emits and the
number of the tuples that it receives. Such metrics are fundamental information for the verification tool (D-
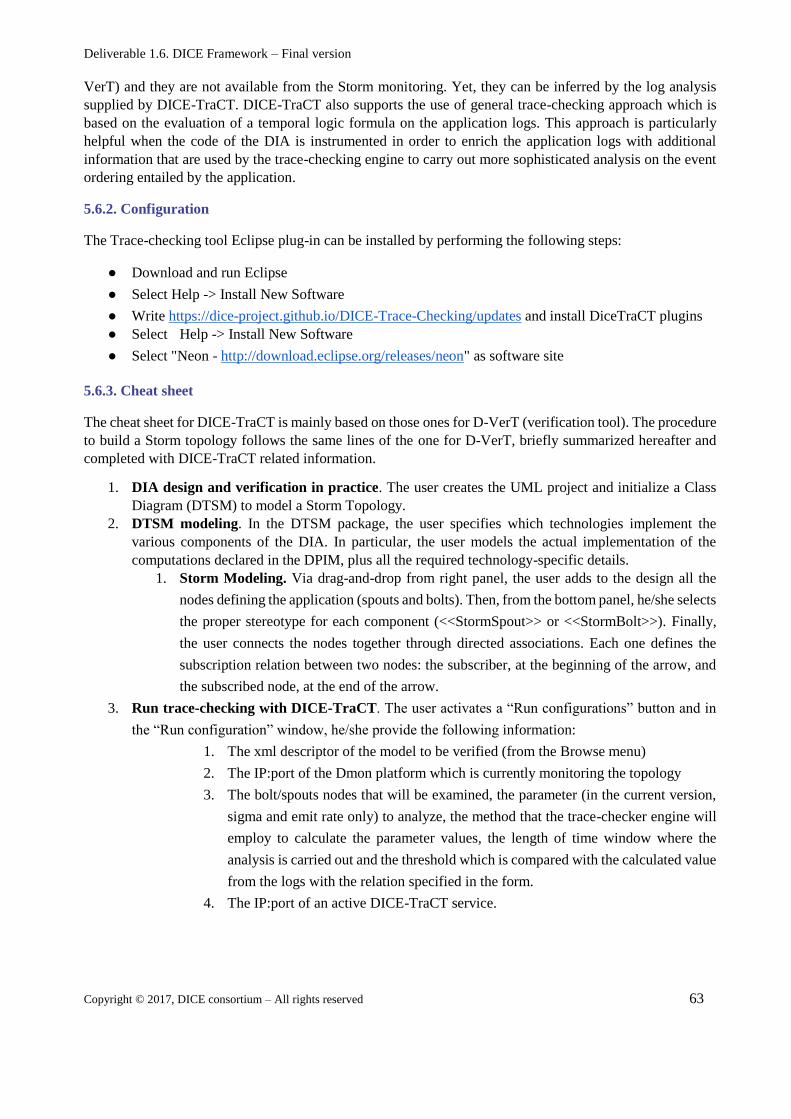
Deliverable 1.6. DICE Framework – Final version
Copyright © 2017, DICE consortium – All rights reserved 63
VerT) and they are not available from the Storm monitoring. Yet, they can be inferred by the log analysis
supplied by DICE-TraCT. DICE-TraCT also supports the use of general trace-checking approach which is
based on the evaluation of a temporal logic formula on the application logs. This approach is particularly
helpful when the code of the DIA is instrumented in order to enrich the application logs with additional
information that are used by the trace-checking engine to carry out more sophisticated analysis on the event
ordering entailed by the application.
5.6.2. Configuration
The Trace-checking tool Eclipse plug-in can be installed by performing the following steps:
● Download and run Eclipse
● Select Help -> Install New Software
● Write https://dice-project.github.io/DICE-Trace-Checking/updates and install DiceTraCT plugins
● Select Help -> Install New Software
● Select "Neon - http://download.eclipse.org/releases/neon" as software site
5.6.3. Cheat sheet
The cheat sheet for DICE-TraCT is mainly based on those ones for D-VerT (verification tool). The procedure
to build a Storm topology follows the same lines of the one for D-VerT, briefly summarized hereafter and
completed with DICE-TraCT related information.
1. DIA design and verification in practice. The user creates the UML project and initialize a Class
Diagram (DTSM) to model a Storm Topology.
2. DTSM modeling. In the DTSM package, the user specifies which technologies implement the
various components of the DIA. In particular, the user models the actual implementation of the
computations declared in the DPIM, plus all the required technology-specific details.
1. Storm Modeling. Via drag-and-drop from right panel, the user adds to the design all the
nodes defining the application (spouts and bolts). Then, from the bottom panel, he/she selects
the proper stereotype for each component (<<StormSpout>> or <<StormBolt>>). Finally,
the user connects the nodes together through directed associations. Each one defines the
subscription relation between two nodes: the subscriber, at the beginning of the arrow, and
the subscribed node, at the end of the arrow.
3. Run trace-checking with DICE-TraCT. The user activates a “Run configurations” button and in
the “Run configuration” window, he/she provide the following information:
1. The xml descriptor of the model to be verified (from the Browse menu)
2. The IP:port of the Dmon platform which is currently monitoring the topology
3. The bolt/spouts nodes that will be examined, the parameter (in the current version,
sigma and emit rate only) to analyze, the method that the trace-checker engine will
employ to calculate the parameter values, the length of time window where the
analysis is carried out and the threshold which is compared with the calculated value
from the logs with the relation specified in the form.
4. The IP:port of an active DICE-TraCT service.
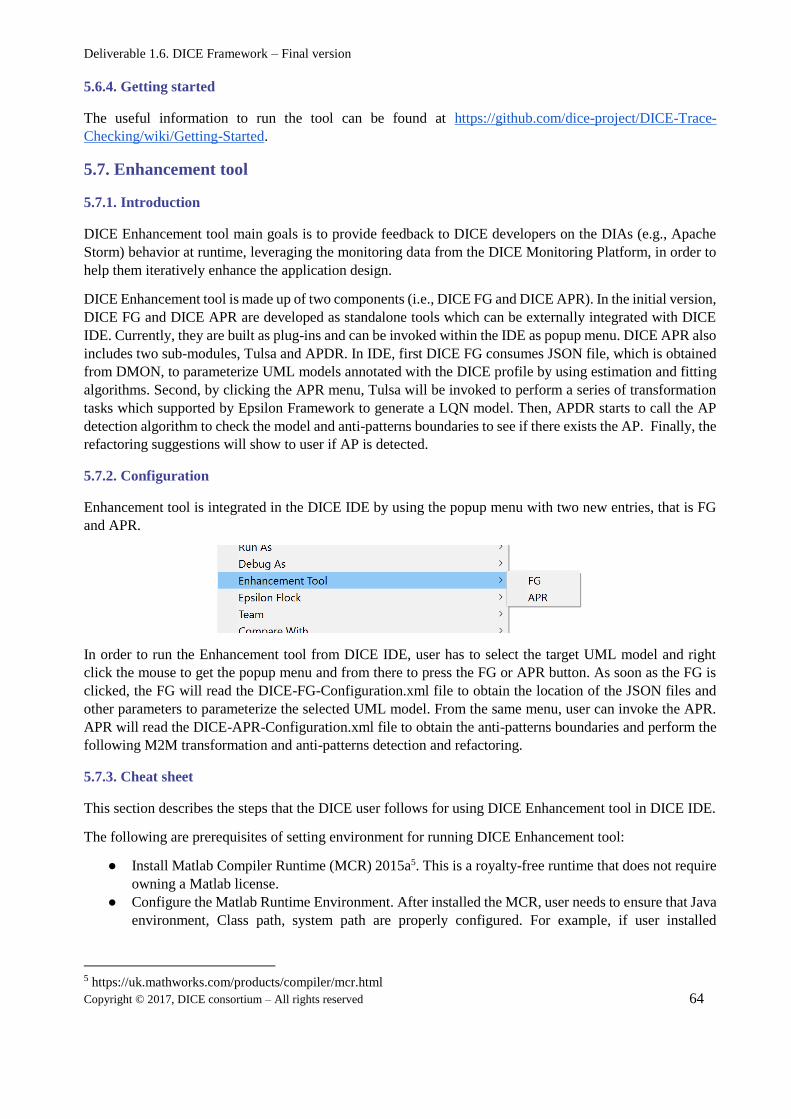
Deliverable 1.6. DICE Framework – Final version
Copyright © 2017, DICE consortium – All rights reserved 64
5.6.4. Getting started
The useful information to run the tool can be found at https://github.com/dice-project/DICE-Trace-
Checking/wiki/Getting-Started.
5.7. Enhancement tool
5.7.1. Introduction
DICE Enhancement tool main goals is to provide feedback to DICE developers on the DIAs (e.g., Apache
Storm) behavior at runtime, leveraging the monitoring data from the DICE Monitoring Platform, in order to
help them iteratively enhance the application design.
DICE Enhancement tool is made up of two components (i.e., DICE FG and DICE APR). In the initial version,
DICE FG and DICE APR are developed as standalone tools which can be externally integrated with DICE
IDE. Currently, they are built as plug-ins and can be invoked within the IDE as popup menu. DICE APR also
includes two sub-modules, Tulsa and APDR. In IDE, first DICE FG consumes JSON file, which is obtained
from DMON, to parameterize UML models annotated with the DICE profile by using estimation and fitting
algorithms. Second, by clicking the APR menu, Tulsa will be invoked to perform a series of transformation
tasks which supported by Epsilon Framework to generate a LQN model. Then, APDR starts to call the AP
detection algorithm to check the model and anti-patterns boundaries to see if there exists the AP. Finally, the
refactoring suggestions will show to user if AP is detected.
5.7.2. Configuration
Enhancement tool is integrated in the DICE IDE by using the popup menu with two new entries, that is FG
and APR.
In order to run the Enhancement tool from DICE IDE, user has to select the target UML model and right
click the mouse to get the popup menu and from there to press the FG or APR button. As soon as the FG is
clicked, the FG will read the DICE-FG-Configuration.xml file to obtain the location of the JSON files and
other parameters to parameterize the selected UML model. From the same menu, user can invoke the APR.
APR will read the DICE-APR-Configuration.xml file to obtain the anti-patterns boundaries and perform the
following M2M transformation and anti-patterns detection and refactoring.
5.7.3. Cheat sheet
This section describes the steps that the DICE user follows for using DICE Enhancement tool in DICE IDE.
The following are prerequisites of setting environment for running DICE Enhancement tool:
● Install Matlab Compiler Runtime (MCR) 2015a5. This is a royalty-free runtime that does not require
owning a Matlab license.
● Configure the Matlab Runtime Environment. After installed the MCR, user needs to ensure that Java
environment, Class path, system path are properly configured. For example, if user installed
5 https://uk.mathworks.com/products/compiler/mcr.html
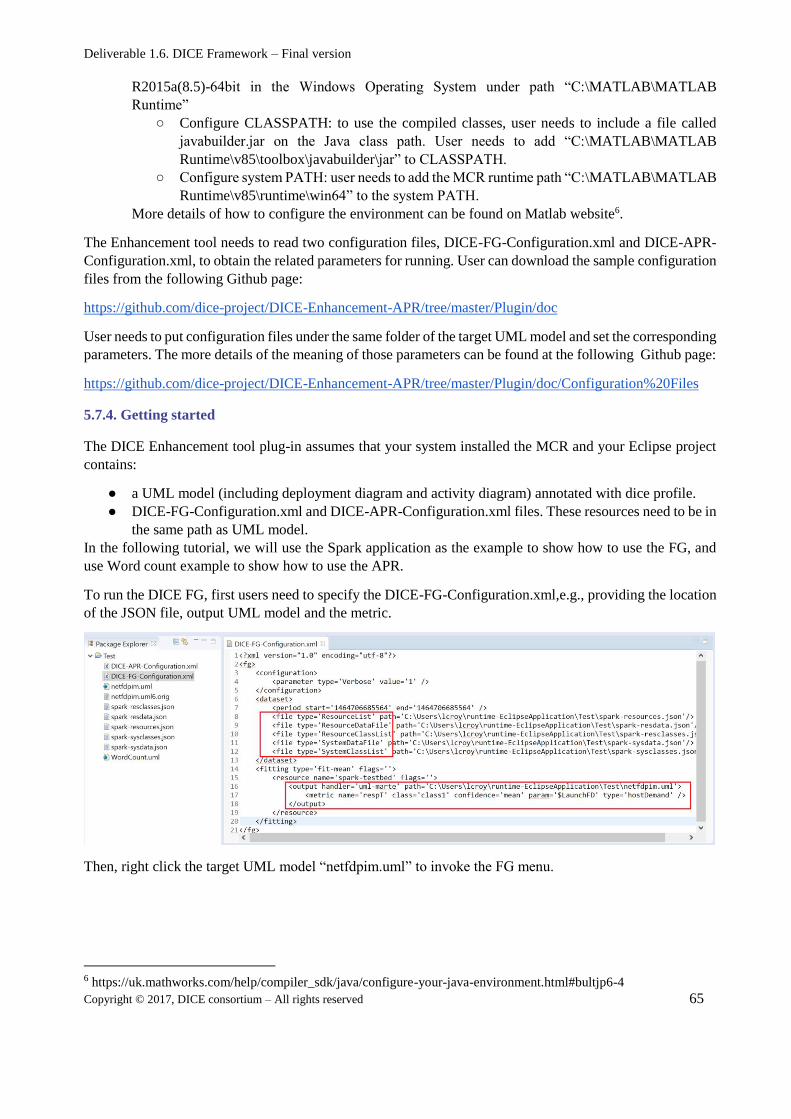
Deliverable 1.6. DICE Framework – Final version
Copyright © 2017, DICE consortium – All rights reserved 65
R2015a(8.5)-64bit in the Windows Operating System under path “C:\MATLAB\MATLAB
Runtime”
○ Configure CLASSPATH: to use the compiled classes, user needs to include a file called
javabuilder.jar on the Java class path. User needs to add “C:\MATLAB\MATLAB
Runtime\v85\toolbox\javabuilder\jar” to CLASSPATH.
○ Configure system PATH: user needs to add the MCR runtime path “C:\MATLAB\MATLAB
Runtime\v85\runtime\win64” to the system PATH.
More details of how to configure the environment can be found on Matlab website6.
The Enhancement tool needs to read two configuration files, DICE-FG-Configuration.xml and DICE-APR-
Configuration.xml, to obtain the related parameters for running. User can download the sample configuration
files from the following Github page:
https://github.com/dice-project/DICE-Enhancement-APR/tree/master/Plugin/doc
User needs to put configuration files under the same folder of the target UML model and set the corresponding
parameters. The more details of the meaning of those parameters can be found at the following Github page:
https://github.com/dice-project/DICE-Enhancement-APR/tree/master/Plugin/doc/Configuration%20Files
5.7.4. Getting started
The DICE Enhancement tool plug-in assumes that your system installed the MCR and your Eclipse project
contains:
● a UML model (including deployment diagram and activity diagram) annotated with dice profile.
● DICE-FG-Configuration.xml and DICE-APR-Configuration.xml files. These resources need to be in
the same path as UML model.
In the following tutorial, we will use the Spark application as the example to show how to use the FG, and
use Word count example to show how to use the APR.
To run the DICE FG, first users need to specify the DICE-FG-Configuration.xml,e.g., providing the location
of the JSON file, output UML model and the metric.
Then, right click the target UML model “netfdpim.uml” to invoke the FG menu.
6 https://uk.mathworks.com/help/compiler_sdk/java/configure-your-java-environment.html#bultjp6-4
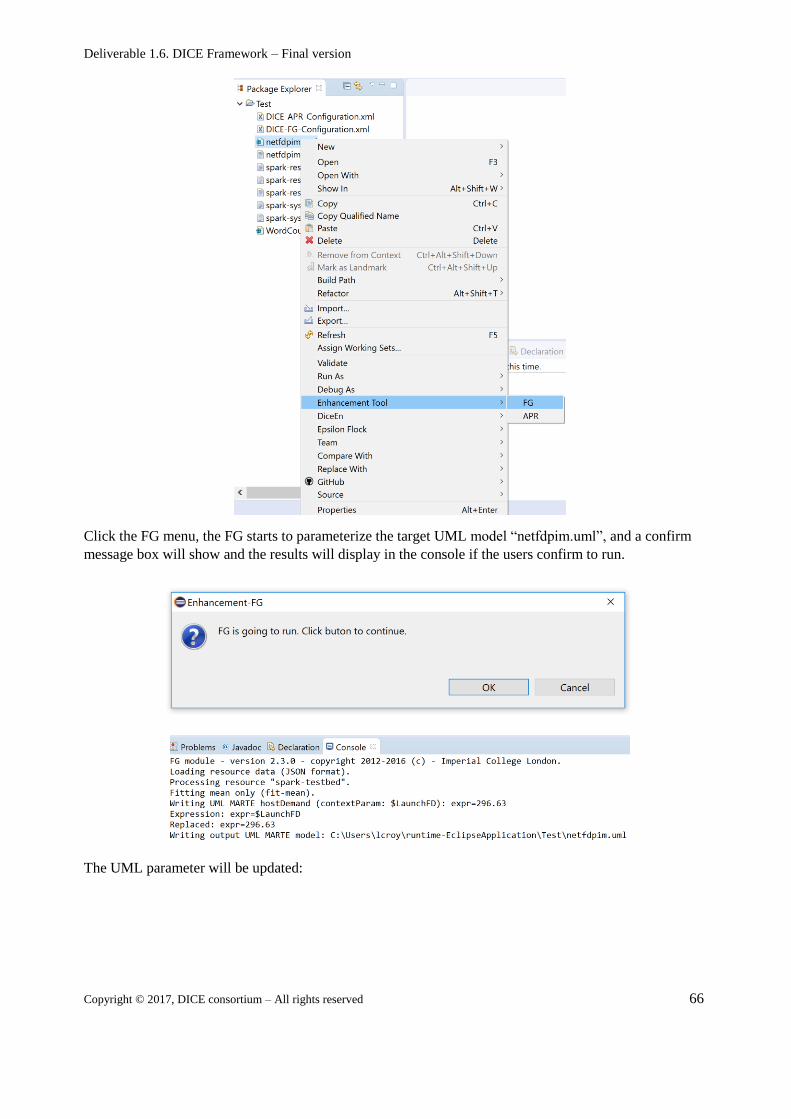
Deliverable 1.6. DICE Framework – Final version
Copyright © 2017, DICE consortium – All rights reserved 66
Click the FG menu, the FG starts to parameterize the target UML model “netfdpim.uml”, and a confirm
message box will show and the results will display in the console if the users confirm to run.
The UML parameter will be updated:
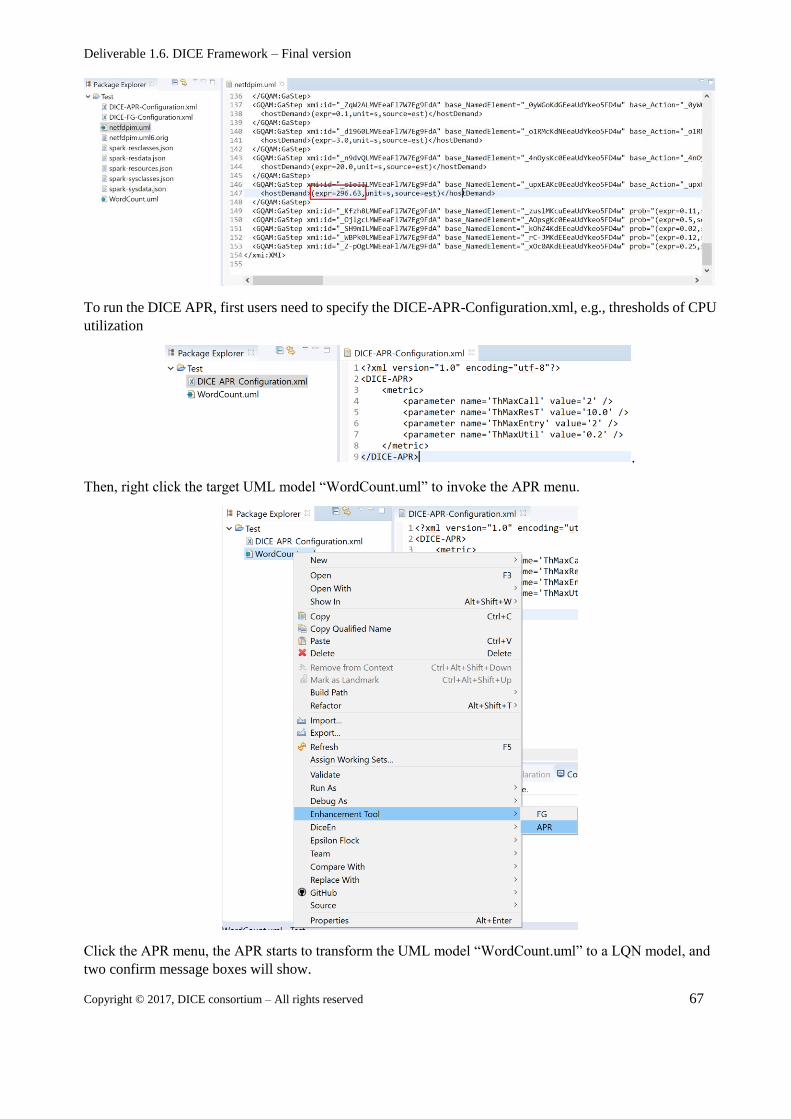
Deliverable 1.6. DICE Framework – Final version
Copyright © 2017, DICE consortium – All rights reserved 67
To run the DICE APR, first users need to specify the DICE-APR-Configuration.xml, e.g., thresholds of CPU
utilization
.
Then, right click the target UML model “WordCount.uml” to invoke the APR menu.
Click the APR menu, the APR starts to transform the UML model “WordCount.uml” to a LQN model, and
two confirm message boxes will show.
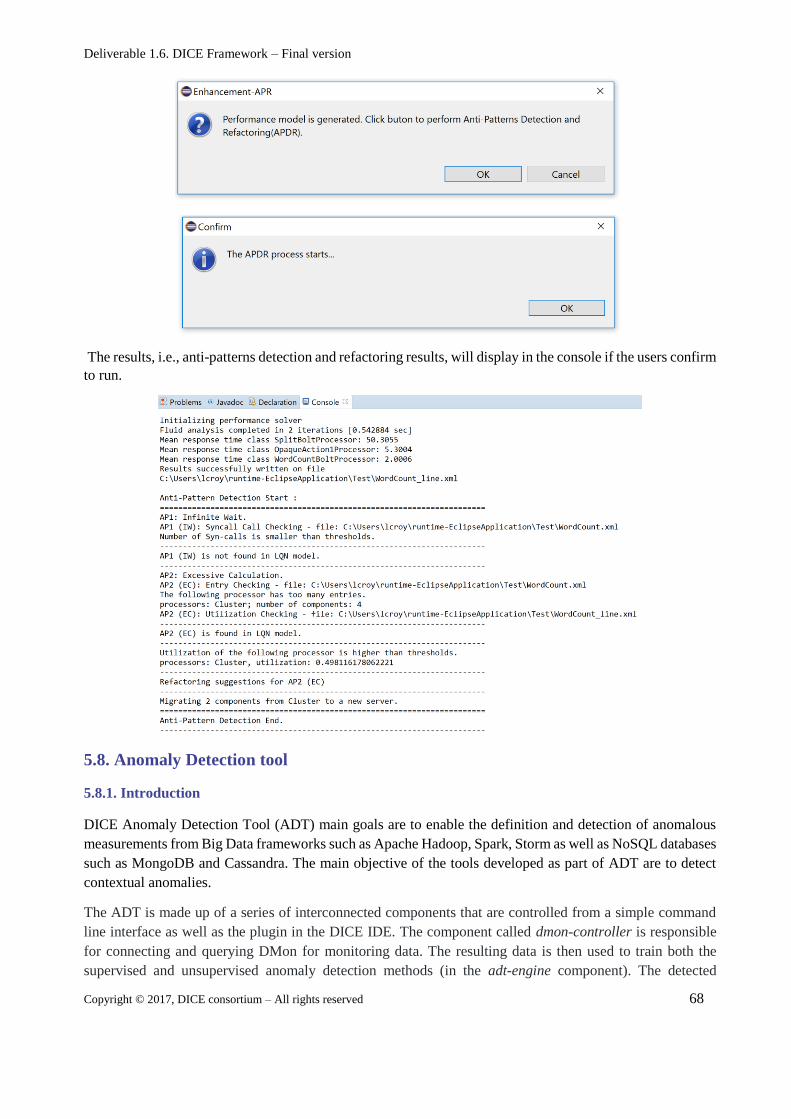
Deliverable 1.6. DICE Framework – Final version
Copyright © 2017, DICE consortium – All rights reserved 68
The results, i.e., anti-patterns detection and refactoring results, will display in the console if the users confirm
to run.
5.8. Anomaly Detection tool
5.8.1. Introduction
DICE Anomaly Detection Tool (ADT) main goals are to enable the definition and detection of anomalous
measurements from Big Data frameworks such as Apache Hadoop, Spark, Storm as well as NoSQL databases
such as MongoDB and Cassandra. The main objective of the tools developed as part of ADT are to detect
contextual anomalies.
The ADT is made up of a series of interconnected components that are controlled from a simple command
line interface as well as the plugin in the DICE IDE. The component called dmon-controller is responsible
for connecting and querying DMon for monitoring data. The resulting data is then used to train both the
supervised and unsupervised anomaly detection methods (in the adt-engine component). The detected
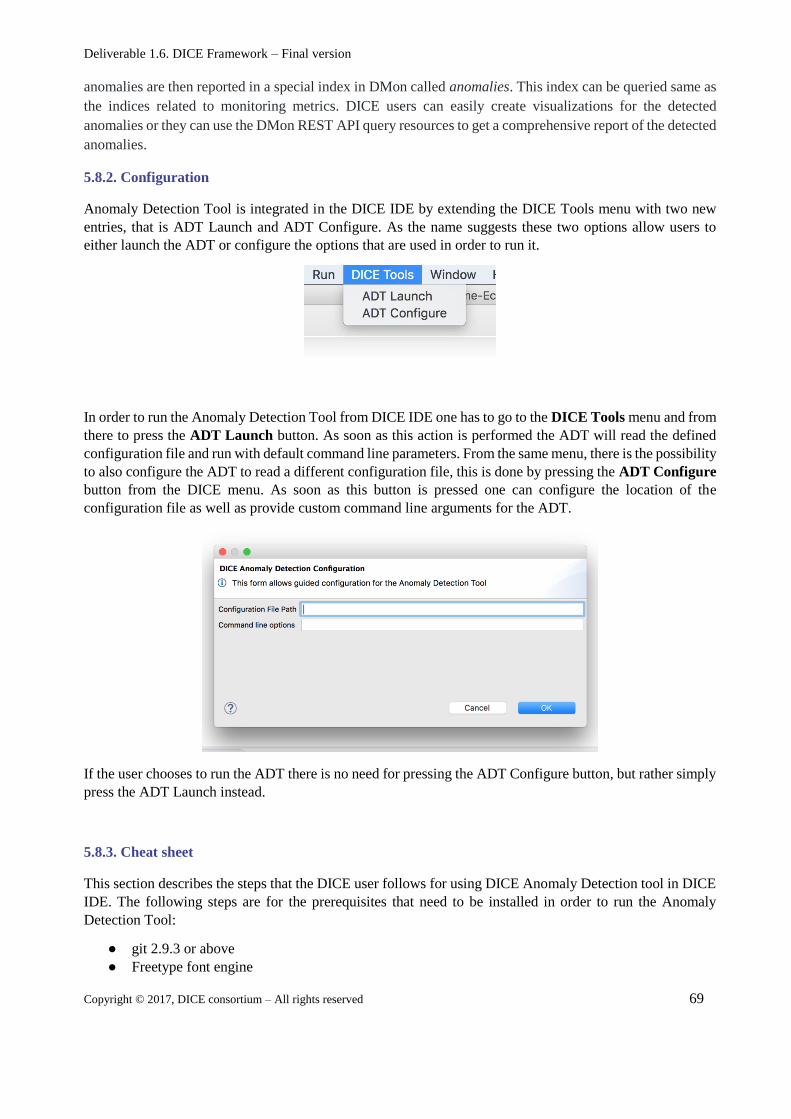
Deliverable 1.6. DICE Framework – Final version
Copyright © 2017, DICE consortium – All rights reserved 69
anomalies are then reported in a special index in DMon called anomalies. This index can be queried same as
the indices related to monitoring metrics. DICE users can easily create visualizations for the detected
anomalies or they can use the DMon REST API query resources to get a comprehensive report of the detected
anomalies.
5.8.2. Configuration
Anomaly Detection Tool is integrated in the DICE IDE by extending the DICE Tools menu with two new
entries, that is ADT Launch and ADT Configure. As the name suggests these two options allow users to
either launch the ADT or configure the options that are used in order to run it.
In order to run the Anomaly Detection Tool from DICE IDE one has to go to the DICE Tools menu and from
there to press the ADT Launch button. As soon as this action is performed the ADT will read the defined
configuration file and run with default command line parameters. From the same menu, there is the possibility
to also configure the ADT to read a different configuration file, this is done by pressing the ADT Configure
button from the DICE menu. As soon as this button is pressed one can configure the location of the
configuration file as well as provide custom command line arguments for the ADT.
If the user chooses to run the ADT there is no need for pressing the ADT Configure button, but rather simply
press the ADT Launch instead.
5.8.3. Cheat sheet
This section describes the steps that the DICE user follows for using DICE Anomaly Detection tool in DICE
IDE. The following steps are for the prerequisites that need to be installed in order to run the Anomaly
Detection Tool:
● git 2.9.3 or above
● Freetype font engine
Deliverable 1.6. DICE Framework – Final version
Copyright © 2017, DICE consortium – All rights reserved 70
○ For linux install libfreetype6-dev libxft-dev
○ For Windows installation, instructions available on the official site7
● Python 2.7.x
○ Including pip
■ Windows 10 comes packaged with Python and pip, detailed instructions for older
versions available at the official pip site8
○ Including virtualenv
■ pip install virtualenv
● Security (optional)
○ pip install pyopenssl ndg-httpsclient pyasn1
Once all of the prerequisites are correctly installed and configured it is now possible to start the installation
procedure. In most of the prerequisites are already satisfied on most development desktops and are only
required for a fresh install. After the prerequisites are satisfied we must clone the Github repository into a
directory:
In case of Linux distributions, we recommend cloning it in /opt:
$ cd /opt
$ git clone https://github.com/dice-project/DICE-Anomaly-Detection-Tool.git
In the case of a Windows installation clone the repository can be user specified as long as it is set in system
PATH (i.e. …\dmon-adp\dmonadp.py).
The next step is to install all required python modules using pip:
pip install -r requirements.txt
Once this is complete ADT should be operational. Keep in mind to set the environment path to dmonadp. For
running the ADT from DICE IDE, one can either use the predefined arguments for the tool or change the
arguments before running it. In the first case, launching ADT is a matter of clicking the Launch ADT button
from the DICE menu whereas for the second option, one can specify either a user created configuration file
or pass the options as command line arguments for ADT. More details about how the configuration file and
what are the available options for ADT can be found on the official Github ADT Wiki page
(https://github.com/dice-project/DICE-Anomaly-Detection-Tool/wiki/Getting-Started).
7 http://gnuwin32.sourceforge.net/packages/freetype.htm 8 https://pip.pypa.io/en/stable/installing/
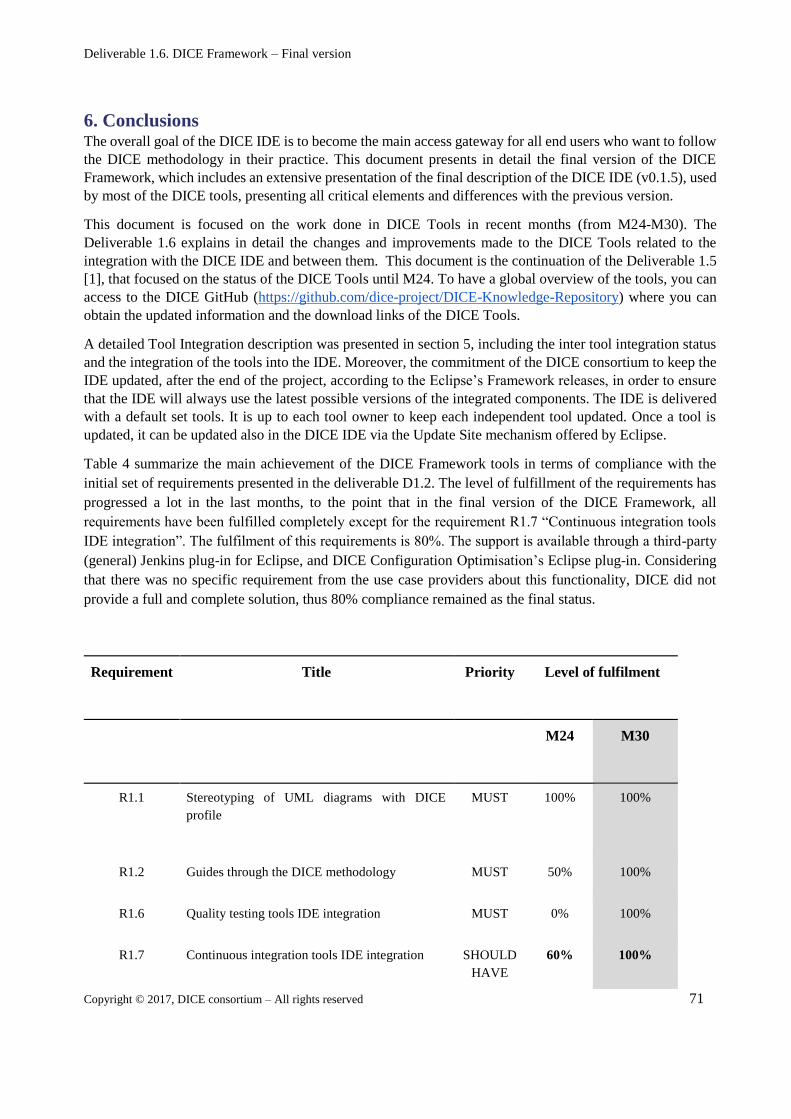
Deliverable 1.6. DICE Framework – Final version
Copyright © 2017, DICE consortium – All rights reserved 71
6. Conclusions The overall goal of the DICE IDE is to become the main access gateway for all end users who want to follow
the DICE methodology in their practice. This document presents in detail the final version of the DICE
Framework, which includes an extensive presentation of the final description of the DICE IDE (v0.1.5), used
by most of the DICE tools, presenting all critical elements and differences with the previous version.
This document is focused on the work done in DICE Tools in recent months (from M24-M30). The
Deliverable 1.6 explains in detail the changes and improvements made to the DICE Tools related to the
integration with the DICE IDE and between them. This document is the continuation of the Deliverable 1.5
[1], that focused on the status of the DICE Tools until M24. To have a global overview of the tools, you can
access to the DICE GitHub (https://github.com/dice-project/DICE-Knowledge-Repository) where you can
obtain the updated information and the download links of the DICE Tools.
A detailed Tool Integration description was presented in section 5, including the inter tool integration status
and the integration of the tools into the IDE. Moreover, the commitment of the DICE consortium to keep the
IDE updated, after the end of the project, according to the Eclipse’s Framework releases, in order to ensure
that the IDE will always use the latest possible versions of the integrated components. The IDE is delivered
with a default set tools. It is up to each tool owner to keep each independent tool updated. Once a tool is
updated, it can be updated also in the DICE IDE via the Update Site mechanism offered by Eclipse.
Table 4 summarize the main achievement of the DICE Framework tools in terms of compliance with the
initial set of requirements presented in the deliverable D1.2. The level of fulfillment of the requirements has
progressed a lot in the last months, to the point that in the final version of the DICE Framework, all
requirements have been fulfilled completely except for the requirement R1.7 “Continuous integration tools
IDE integration”. The fulfilment of this requirements is 80%. The support is available through a third-party
(general) Jenkins plug-in for Eclipse, and DICE Configuration Optimisation’s Eclipse plug-in. Considering
that there was no specific requirement from the use case providers about this functionality, DICE did not
provide a full and complete solution, thus 80% compliance remained as the final status.
Requirement Title Priority Level of fulfilment
M24 M30
R1.1 Stereotyping of UML diagrams with DICE
profile
MUST 100% 100%
R1.2 Guides through the DICE methodology MUST 50% 100%
R1.6 Quality testing tools IDE integration MUST 0% 100%
R1.7 Continuous integration tools IDE integration SHOULD
HAVE
60% 100%
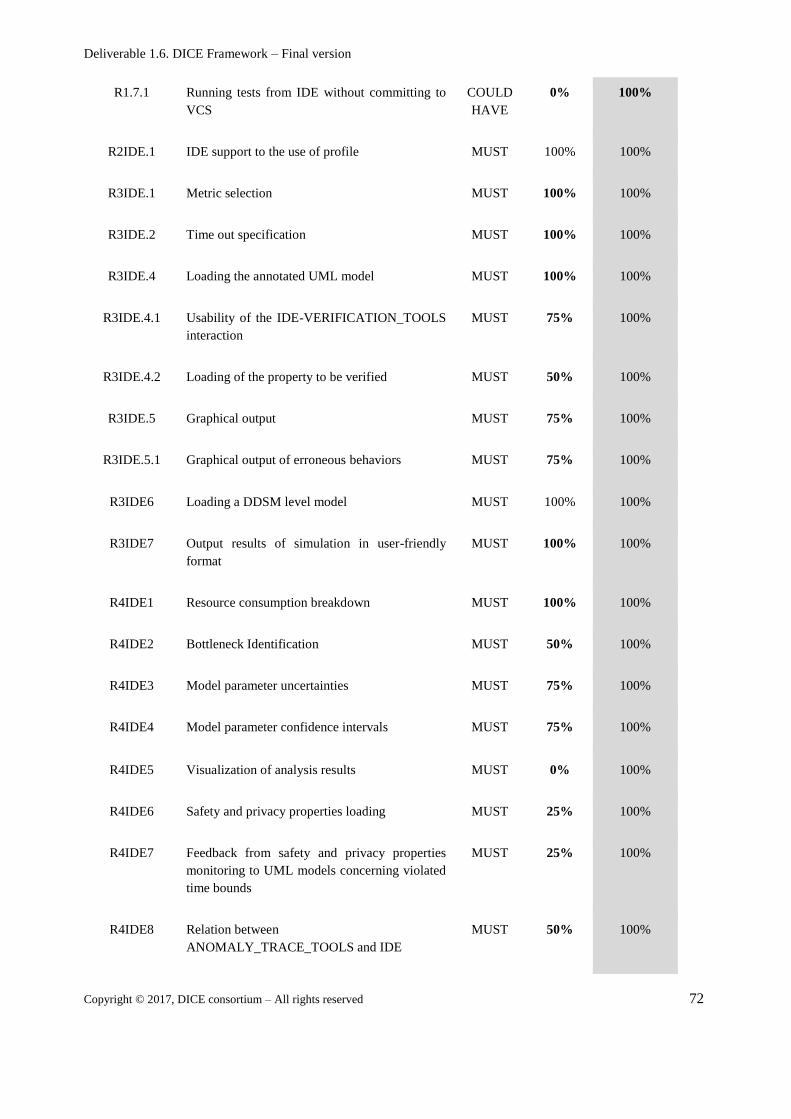
Deliverable 1.6. DICE Framework – Final version
Copyright © 2017, DICE consortium – All rights reserved 72
R1.7.1 Running tests from IDE without committing to
VCS
COULD
HAVE
0% 100%
R2IDE.1 IDE support to the use of profile MUST 100% 100%
R3IDE.1 Metric selection MUST 100% 100%
R3IDE.2 Time out specification MUST 100% 100%
R3IDE.4 Loading the annotated UML model MUST 100% 100%
R3IDE.4.1 Usability of the IDE-VERIFICATION_TOOLS
interaction
MUST 75% 100%
R3IDE.4.2 Loading of the property to be verified MUST 50% 100%
R3IDE.5 Graphical output MUST 75% 100%
R3IDE.5.1 Graphical output of erroneous behaviors MUST 75% 100%
R3IDE6 Loading a DDSM level model MUST 100% 100%
R3IDE7 Output results of simulation in user-friendly
format
MUST 100% 100%
R4IDE1 Resource consumption breakdown MUST 100% 100%
R4IDE2 Bottleneck Identification MUST 50% 100%
R4IDE3 Model parameter uncertainties MUST 75% 100%
R4IDE4 Model parameter confidence intervals MUST 75% 100%
R4IDE5 Visualization of analysis results MUST 0% 100%
R4IDE6 Safety and privacy properties loading MUST 25% 100%
R4IDE7 Feedback from safety and privacy properties
monitoring to UML models concerning violated
time bounds
MUST 25% 100%
R4IDE8 Relation between
ANOMALY_TRACE_TOOLS and IDE
MUST 50% 100%
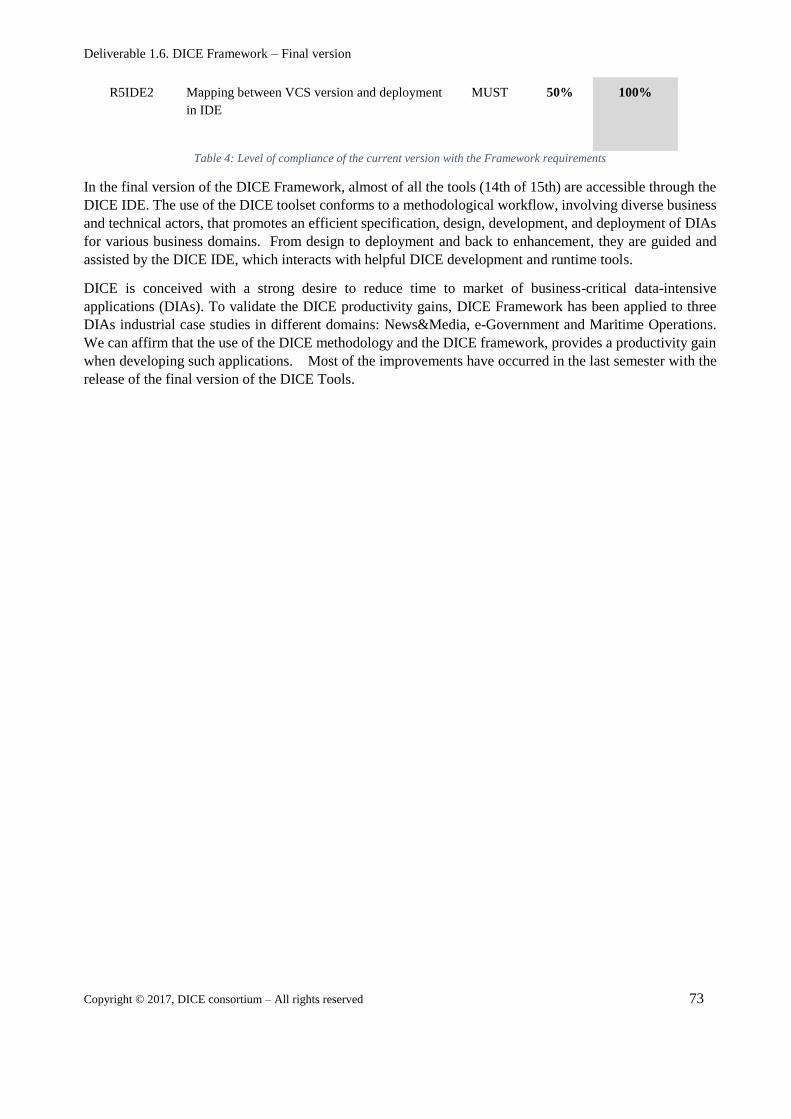
Deliverable 1.6. DICE Framework – Final version
Copyright © 2017, DICE consortium – All rights reserved 73
R5IDE2 Mapping between VCS version and deployment
in IDE
MUST 50% 100%
Table 4: Level of compliance of the current version with the Framework requirements
In the final version of the DICE Framework, almost of all the tools (14th of 15th) are accessible through the
DICE IDE. The use of the DICE toolset conforms to a methodological workflow, involving diverse business
and technical actors, that promotes an efficient specification, design, development, and deployment of DIAs
for various business domains. From design to deployment and back to enhancement, they are guided and
assisted by the DICE IDE, which interacts with helpful DICE development and runtime tools.
DICE is conceived with a strong desire to reduce time to market of business-critical data-intensive
applications (DIAs). To validate the DICE productivity gains, DICE Framework has been applied to three
DIAs industrial case studies in different domains: News&Media, e-Government and Maritime Operations.
We can affirm that the use of the DICE methodology and the DICE framework, provides a productivity gain
when developing such applications. Most of the improvements have occurred in the last semester with the
release of the final version of the DICE Tools.

Deliverable 1.6. DICE Framework – Final version
Copyright © 2017, DICE consortium – All rights reserved 74
7. References
[1] DICE consortium, DICE deliverable 1.5: DICE framework - Initial version, January 2017
[2] DICE consortium, DICE deliverable 1.2: Requirement specification, July 2015
[3] DICE consortium, DICE deliverable 1.4: Architecture definition and integration plan - Final version,
January 2017
[4] DICE consortium, DICE deliverable 5.3 - DICE delivery tools - Final version, July 2017
[5] https://eclipse.org/tycho