Embed Size (px)
Citation preview
DISCUSSION PAPER SERIES
IZA DP No. 11239
Sonia BhalotraRachel BruléSanchari Roy
Women’s Inheritance Rights Reform and the Preference for Sons in India
DECEMBER 2017
Any opinions expressed in this paper are those of the author(s) and not those of IZA. Research published in this series may include views on policy, but IZA takes no institutional policy positions. The IZA research network is committed to the IZA Guiding Principles of Research Integrity.The IZA Institute of Labor Economics is an independent economic research institute that conducts research in labor economics and offers evidence-based policy advice on labor market issues. Supported by the Deutsche Post Foundation, IZA runs the world’s largest network of economists, whose research aims to provide answers to the global labor market challenges of our time. Our key objective is to build bridges between academic research, policymakers and society.IZA Discussion Papers often represent preliminary work and are circulated to encourage discussion. Citation of such a paper should account for its provisional character. A revised version may be available directly from the author.
Schaumburg-Lippe-Straße 5–953113 Bonn, Germany
Phone: +49-228-3894-0Email: [email protected] www.iza.org
IZA – Institute of Labor Economics
DISCUSSION PAPER SERIES
IZA DP No. 11239
Women’s Inheritance Rights Reform and the Preference for Sons in India
DECEMBER 2017
Sonia BhalotraUniversity of Essex and IZA
Rachel BruléNYU Abu Dhabi
Sanchari RoyKing’s College London
ABSTRACT
IZA DP No. 11239 DECEMBER 2017
Women’s Inheritance Rights Reform and the Preference for Sons in India*
We investigate whether legislation of equal inheritance rights for women modifies the
historic preference for sons in India, and find that it exacerbates it. Children born after the
reform in families with a first-born daughter are 3.8–4.3 percentage points less likely to be
girls, indicating that the reform encouraged female foeticide. We also find that the reform
increased excess female infant mortality and son-biased fertility stopping. This suggests
that the inheritance reform raised the costs of having daughters, consistent with which
we document an increase in stated son preference in fertility post-reform. We conclude
that this is a case where legal reform was frustrated by persistence of cultural norms. We
provide some suggestive evidence of slowly changing patrilocality norms.
JEL Classification: O12, K11, I21
Keywords: inheritance rights, ultrasound, female foeticide, sex selection, son preference, gender, India
Corresponding author:Sanchari RoyDepartment of International DevelopmentKing’s College London, StrandLondon WC2R 2LSUnited Kingdom
E- mail: [email protected]
* We are grateful to Farzana Afridi, Jere Behrman and Prakarsh Singh for their valuable feedback and suggestions,
and to the participants of the UPenn-CASI Workshop on Early Childhood Development in India for many helpful
comments. We would also like to thank seminar participants at Rimini, CAGE-Warwick, CMPO-Bristol, Sussex for
their comments. Brule would like to thank Andrew Foster for kindly providing access to the REDS 2006 dataset.
2
1. Introduction
Two centuries ago, women in Europe and America were considered the property of men
(fathers or husbands), having no intrinsic rights of their own. Women’s rights have been
established by a long, slow process (described for instance in Doepke et al. 2012), in which
legislation of their property rights was an important milestone. However, daughters still
continue to have weaker property inheritance rights than sons in many developing
countries today. In all of the Middle East and North Africa, in 50 percent of South Asian
countries, 34 percent of sub-Saharan African countries, and 25 percent of East Asian and
Pacific countries, inheritance laws either disfavour or altogether exclude women (World
Bank 2011). Twenty-one of the 63 countries studied by Htun and Weldon (2011) have
unequal property inheritance rights for men and women (WDR 2012).
This is possibly the single most important factor in compromising the position of women.
Property, and in particular land, is a critical determinant of economic and social status
(Agarwal, 1994). Property rights are associated with increased investment, productivity,
access to credit and labour market opportunities (Besley 1995; Banerjee et al. 2002; Field
2007; Besley and Ghatak 2009). Land markets in developing countries are scarce and land
is typically acquired through inheritance. As a result, even amongst the landowning classes,
women in developing countries continue to be asset-poor, and unequal inheritance rights
tend to perpetuate the condition in which women find themselves reliant upon men,
having limited earning capacity and limited options outside marriage (Field 2007; Goldstein
and Udry 2008; Chung and Dasgupta 2007). The equalization of inheritance rights may
therefore be expected to be a powerful instrument for the empowerment of women. This
has potential impacts on women’s labour supply (Joulfaian 2006), fertility (Ashraf et al.
2014), health (Jayaraman et al. 2013; Calvi et al. 2017) and mortality (Milazzo 2014). In
addition, several studies show that the financial empowerment of women directly benefits
children because women tend to invest more in children (e.g. Lundberg et al., 1997; Duflo
and Udry 2004; Bobonis 2009; Baranov et al. 2017). There is also some evidence that
women invest relatively more in girls, redressing gender inequality in the next generation
(Thomas 1990, 1994; Dahl and Moretti 2008; Baranov et al. 2017).
However, causal evidence that property rights empower women is limited, and the
available evidence is somewhat mixed. In the context of India, inheritance rights for
women were equalized with the rights of men by five states that enacted legislative reforms
between 1976 and 1994, with federal legislation imposing equal rights for all states in 2005.

3
A handful of studies has exploited the staggered implementation of these reforms to
examine impacts on different aspects of women’s status in India. One study documents
increased suicide rates among both men and women aged 15–44, with a significantly larger
increase among men (Anderson and Genicot 2015). The authors rationalize this in terms of
increased intra-household conflict, showing also an increase in domestic violence.
Focusing on girls of school-going age, rather than on women of marriageable and married
ages at the time of the reform, Roy (2015) and Deininger et al. (2013) show that the reform
was associated with increased educational investment in girls relative to boys. These results
suggest that negotiating sharp changes in women’s economic rights may increase marital
conflict for some, while expanding marital prospects for others.1
In this paper, we ask a very different question. We investigate not whether equal property
rights legislation empowers women within marriage or on the marriage market, but
whether it modifies the historic tendency for Indian parents to prefer to have sons. There
is hardly a more compelling statement of gender inequality in India than its unnaturally
male-biased population sex ratio, an important driver of which is the desire to have sons.
To what extent is this historic desire for sons driven by their stronger economic position
and, in particular, their greater command over ancestral property? Might granting equal
inheritance rights to daughters mellow the preference for having sons? Plausible
mechanisms are that it would allow daughters to offer the old-age security that sons have
traditionally provided to parents (Chung and Dasgupta 2007), or that it would diminish
dowry, the burden of which raises the cost of having daughters (Anderson 2003, Bhalotra
et al 2016). These potential mechanisms are linked. Although dowry is now often
appropriated by the groom or his parents, historically it was a pre-mortem bequest to
daughters given at the time of marriage, while post-mortem bequests (typically of family
property) went to sons (Goody 1973). This custom, evident in large parts of Europe and
Asia, was premised upon married daughters leaving the parental home, in contrast to
married sons who tended to co-reside with parents. Botticini and Siow (2003) model the
institution of dowry jointly with patrilineal inheritance as emerging from parents’ attempt
to solve a free riding problem between siblings to create incentives for sons to provide
1 The increase in male relative to female suicides reported in Anderson and Genicot (2015) illustrates the difficulty with defining women’s empowerment. It suggests that a challenge to the economic power of men generates greater distress or damage among men, but to the extent that the suicides are of married men, they create the perilous state of widowhood for women (Chen and Dreze 1992). However, their data are for all suicides among 15-44 year olds at the state-year level and not available by marital status. This may therefore represent suicides of unmarried men at the bottom of the socioeconomic distribution who find it harder to match on the marriage market after the inheritance reform.

4
effort. Therefore, legislation that compels parents to share post-mortem bequests equally
with daughters may lead to erosion of dowry, and it may modify the convention of women
marrying into households some distance away from their natal homes, while sons co-reside
with or live close to parents (and family property).2 Thus, to the extent that dowry and co-
residence with sons determine the preference for having sons, we may expect gender
equality in property rights to lower son preference.
In this paper, we investigate this issue by modelling the sex ratio at birth as a function of
whether the inheritance reform in the state of birth had been passed before the year of
birth. To identify causal effects of equal inheritance rights for women, we leverage the
staggered implementation of the inheritance reform across the Indian states, which created
state and cohort-level variation in reform exposure. We buttress this double difference
using two further sources of variation that determine the degree of exposure to the reform.
First, we interact the inheritance reform indicator with a cohort-varying indicator for
availability of ultrasound technology, that previous work shows generated a trend break in
the sex ratio at birth (Bhalotra and Cochrane 2010), and exploits the fact that prior to the
introduction of ultrasound technology that made prenatal detection of the sex of the foetus
feasible, no significant manipulation of the sex ratio at birth is discernible in aggregate
statistics (evidence of this is provided in Bhalotra and Cochrane 2010). So, for the sex ratio
at birth to have responded to the reform, the indicator for ultrasound access will need to
have switched on. This aids identification because any omitted variables that drive a
spurious relationship between the outcome variables and inheritance reform would have to
have exhibited a discontinuous change that not only lines up with the particular state and
year variation in reform (i.e. in the state of Kerala in 1976, in Andhra Pradesh in 1986 and
so on) but, in addition, the omitted variables would have to have jumped in line with the
date of introduction of ultrasound scans as well. Moreover, crossing the reform and
ultrasound indicators helps us attribute any observed effects to parental manipulation of the
sex ratio.
2 Patrilineality includes passing on the main productive assets through the male line, while women may be given some movable goods in the form of dowry or inheritance. This constrains women's ability to sustain their economic level of welfare without being attached to a man. Patrilocality involves a couple residing at the man's home, which goes hand in hand with inheritance, especially in peasant societies where land is the main productive asset that is inherited. Indeed, Agarwal (1994) posits that persistence in kinship systems and marriage practices (among which the distance of post-marital residence from the natal home is particularly significant) “may help to explain the failure to realise in practice the significantly greater inheritance rights in landed property which South Asian women now enjoy as a result of recent legislative changes”.

5
The final source of variation deployed towards identification is the sex of the first-born
child. Previous work shows that this is a) quasi-random and b) that it predicts sex-selective
abortion in favour of male children: parents who, by the random hand of nature, are
assigned a son at first birth are significantly less likely to engage in female foeticide for
subsequent conceptions (see Almond and Edlund 2008, Abrevaya 2009, Bhalotra and
Cochrane 2010).3 We also show that families with first-born sons and families with first-
born daughters are balanced on all relevant observable characteristics.
To summarize, the treated group is defined as a cohort born post-reform and post-
ultrasound in a family with a first-born daughter. The control group includes families with
first-born sons and children born pre-reform or pre-ultrasound. Since the coefficient of
interest is now on an interaction between a family level variable and a state-year level
variable, we can include state-year fixed effects as controls. These sweep up all potentially
relevant state-varying non-linear omitted trends that may be correlated with the reform as
well as with the outcome. We also test the robustness of our results to restricting the
identifying variation to within-mother variation, as our sample includes pre- and post-
reform birth cohorts. We corroborate our findings of changes in sex-selective abortion
behaviour using data on reported son preference (i.e. desired share of sons among births).
We conclude with an attempt to investigate whether passage of the reform was associated
with changes in patriarchal norms, in particular, whether daughters married closer to the
natal home, and whether adult sons changed their propensity to co-reside with parents.
We use the three available rounds of nationally representative individual level data from the
National Family and Health Survey (NFHS) pertaining to births between 1972 and 2004.
We find a significant decrease of 3.8-4.3 percentage points in the probability that a girl is
born post-reform and post-ultrasound in households where the first-born child is a girl
rather than a boy. This magnitude of decline is outside the biologically normal range.4 This
is 61-69% of the potential female births that Bhalotra and Cochrane (2010) estimate did
not occur due to ultrasound use between 1995-2005. The most plausible interpretation of
this finding is that awarding inheritance rights to women makes parents more averse to
having a daughter rather than a son. In line with this, we also find an intensification of
stated preferences for sons relative to daughters after the reform of approximately 1
3 The premise that the sex of the first birth is random is discussed and investigated using the same data as used in this paper in Bhalotra and Cochrane (2010). 4 For a discussion of the biologically normal range of the probability that a birth is a girl rather than a boy, and evidence of the size of deviations from this norm that were apparent immediately upon the introduction of ultrasound technology in India, see Bhalotra and Cochrane (2010).
6
percentage point, compared to a sample mean of 0.57. These findings are consistent with
the theoretical framework of Botticini and Siow (2003).5
Our finding that female foeticide increased in response to inheritance reform is robust to
the inclusion of state-year of birth fixed effects. These mop up variation in state-level pro-
female legislation that may have coincided with inheritance reform, for instance the
establishment of Women’s Commissions (discussed in Andersen and Genicot 2015). This
is a relevant concern given that India has a federal system and a number of states have, at
different times, implemented laws designed to limit the extent of sex-selective abortion
(Sekhar 2012). State-year fixed effects also absorb the effects of economic influences on
the desire for sons such as the increase in returns to education for girls relative to boys, as
well as account for any differential state-level pre-trends in the outcome. Our results are
also robust to controlling for mother’s age and mother fixed effects, which absorb all
mother-specific time-invariant variables including unobservables such as her preference for
sons or her fertility preferences (as well as, of course, observables such as her education,
caste and religion). The mother’s preferences may determine compliance and they will
adjust for any changes in the composition of women giving birth post-reform. In addition,
our results are also robust to using an alternative dataset (REDS 2006). Additional
robustness checks are discussed in Section 5.2.
In research conducted in parallel with ours, Rosenblum (2015) shows an increase in excess
girl mortality (after birth) following the inheritance reform.6 We focus on female foeticide
as it is a particularly clean indicator of parental preferences for boys over girls – it involves
an explicit decision to conduct prenatal detection of the sex of the child, and this needs to
be followed up by the deliberate act of aborting the foetus if it is a girl. However, we also
extend our analysis to study impacts of the reform on excess infant mortality among girls,
and on son-biased fertility stopping. We find that the reform exacerbates son preference
5 In their model, Botticini and Siow argue that male-biased inheritance emerges from parents’ optimizing choices. Forcing parents to share post-mortem bequests between sons and daughters in patrilocal societies, where married daughters leave their parental home and sons do not, will tend to result in lower parental welfare. Hence it follows that equalizing inheritance rights creates incentives for parents to prefer not to have daughters. 6 Estimates of the impact of the reform on child mortality is likely to be biased by sex-selective abortion, but the bias is downward implying that Rosenblum’s conclusions are robust to this selection. The bias arises because child mortality is defined on a selected sample of conceptions that survive the foetal period to the point of birth. There is no similar bias in looking at changes in (sex-selective) survival of the foetus as done in our paper.

7
on both these margins.7 In particular, girls born post-reform and post-ultrasound in
families with a first-born girl are 2.3-3.2 pp more likely to die before their reaching first
birthday (equivalent to 32-42% of the sample mean), relative to boys. Moreover, children
in families with first-born girl are approx. 9 pp more likely to have a younger sibling
(equivalent to 12% of the sample mean), relative to families with first-born boy. Together
with our sex ratio results, these findings provide compelling evidence in favour of our
contention that the inheritance reform intensified son preference in fertility.
A natural question at this point is: if what we capture is a sticky social norm, do we find
any corroborating evidence in support of this claim? In order to examine changes in
patrilocal norms in response to the reform, we investigate the distance of married
daughter’s homes from their natal home and co-residence of parents with adult sons using
a different dataset Rural Economic and Demographic Survey (REDS) 2006. We find an
increase of 3-5 percentage points in the probability that a married daughter lives nearer the
natal home (up to 10 km away). But we find no significant impact on the extent of co-
residence with sons. Together, these results suggest that patriarchal norms change only
very slowly if at all, so that a sharp legislative change intended to favour daughters appears
to have raised the perceived cost of daughters enough that parents became more averse to
having them.8
To the best of our knowledge, this paper provides the first evidence regarding the impact
of the gender-equalizing inheritance reforms in Indian on female foeticide and son-biased
fertility stopping behaviour. We also contribute to the literature by using a more stringent
estimation strategy (permitting the use of state-year fixed effects as well as mother fixed
effects) compared to existing studies analysing the impact of these reforms on various
other outcomes.9 Our findings also contribute to existing evidence indicating that slow-
moving social norms may frustrate the intentions of legal reform in the first decades after
the passage of legislation (Aldashev et al. 2011).
7 All estimates are intent-to-treat estimates. Different types of families may be at the different margins. 8 Legislative change pertaining to the division of bequests is (in principle if not in compliance terms) immediate. In contrast, the linked institutions of dowry, patrilocality and co-residence with sons are expected to wither gradually, as a function of changes in the agrarian economy (Rosenzweig and Wolpin 1985, Guner 1998, Botticini and Siow 2003). In particular, we may expect that, as the returns to human capital rise, sons (and daughters) will acquire an education, and sons will no longer be tied to the occupations or assets of their fathers. This will spontaneously but gradually reduce co-residence and the attachment of sons’ labour to ancestral property. 9 Results of some of the previous studies are potentially vulnerable to bias from omitted state- and year-varying variables.

8
The remainder of the paper is organized as follows. Section 2 describes the institutional
background of the Hindu inheritance law in India, as well as details on the advent of
ultrasound technology in the country. Section 3 describes the identification strategy and
while Section 4 outlines the data and descriptive statistics. Section 5 presents the key results
while Section 6 concludes.
2. Background
2a. Inheritance Rights in India
Gender inequality in inheritance rights in India was entrenched in The Hindu Succession
Act (HSA) of 1956. Promulgated not long after India gained Independence from British
rule, the HSA conferred the legal right to inherit ancestral property upon sons to the
exclusion of daughters. Ancestral or “joint family property” consists of property principally
inherited by an individual from their father, paternal grandfather or paternal great-
grandfather, plus any property that was jointly acquired by them or acquired separately but
merged into the joint property. Separate property, on the other hand, includes that which
was self-acquired (if acquired without detriment to the ancestral estate) and any property
inherited from persons other than the individual’s father, paternal grandfather or paternal
great-grandfather (Agarwal 1994). Under the HSA, daughters of a Hindu male dying
intestate (i.e. without a will)10 had equal inheritance rights as sons to their father’s separate
property only their father’s separate property and his “notional” portion of joint family
property, but had no direct inheritance rights to joint family property itself. Sons, on the
other hand, not only inherited their share of the father’s own property and his “notional”
portion of joint family property, but also had a direct right by birth to a share of the joint
family property. In fact, all persons who acquired interest in the joint family property by
birth were said to belong to the “Hindu coparcenary”, which is conceptually similar to an
exclusive male membership club in relation to the issue of inheritance to which women
had no access.
10 According to Deininger et al. (2013), the proportion of people who die without making a will in India is very high (around 65%, and probably even higher in rural areas). Recent newspaper articles have put the number at a much higher 80% (see https://timesofindia.indiatimes.com/Avoid-disputes-write-a-Will/articleshow/802650.cms and http://www. fpgindia.org/2011/07/writing-a-will-know-some-facts.html). The main reason cited for such low prevalence of wills in India is that people often find it uncomfortable discussing a will in their lifetime because of the air of fatality and gloom that surrounds it. Thus, all this would suggest that the HSA 1956 is what ultimately determines inheritance patterns within the family.

9
For millions living in rural India, the most common form of property is land that is
typically family-owned, which makes the gender bias in inheritance rights quite a significant
phenomenon. Thus the HSA, by excluding the daughter from participating in the
coparcenary ownership of ancestral property, discriminated against the daughter. This
inequality is, arguably, fundamental to the vulnerability of Indian women (Agarwal 1994),
who are passed from father to husband, their economic insecurity contributing to early
marriage, high fertility and domestic violence.
Inheritance is one of the topics in the Indian constitution over which both the federal and
the state governments have legislative authority. In 1976, the state of Kerala amended the
HSA, subsequently followed by the states of Andhra Pradesh in 1986, Tamil Nadu in 1989,
and Maharashtra and Karnataka in 1994 (see Figure 1). These amendments granted equal
inheritance rights to women to ancestral property provided they were unmarried at the
time of the reform.11 In 2005, the federal Government of India swept all remaining states
into the fold in a momentous constitutional reform.12 Further discussion of the
institutional details of the reform is in Roy (2015), Brulé (2017), Andersen and Genicot
(2015), Rosenblum (2015).
As pointed out by Andersen and Genicot (2015), a key point to note here is that there does
not appear to be any systematic reason for the specific years in which the different states
amended the HSA. Nonetheless, our empirical estimations include state fixed effects, year
fixed effects and state-year fixed effects. The last soak up variation in any other state-level
pro-female legislation that may have coincided with inheritance reform, for instance the
establishment of Women’s Commissions (as discussed in Andersen and Genicot 2015), or
other state-specific time-varying confounding factors.
Previous work has shown that the HSA amendments have been largely unsuccessful in
improving inheritance of women (Roy 2015; Brulé 2017; Landesa 2013): the proportion of
11 Kerala passed a slightly different amendment in the form of the Kerala Joint Hindu Family System (Abolition) Act that recognized all family members with an interest in the undivided family estate as being independent full owners of their shares from then onwards, i.e. abolished joint family property altogether. But since the spirit of this amendment was similar to those passed by the other reforming states, and could be expected to favorably affect the inheritance of the daughter, we club them together. 12 We focus only on the state-level amendments to the HSA in this paper, and hence restrict our data to 2004.
10
women inheriting property from their parents remains woefully small and, importantly, did
not increase significantly following the reform. Parents may have been reluctant to give
daughters any property due to patrilocality13 and the risk that the property ends up being
controlled by the in-laws of the daughters. It would thus be fair to ask why we may expect
any impact of the reform on parental manipulation of the sex composition of their
children. We note that the documented impacts in the cited studies refer to girls who were
born before the reform. It is conceivable that, for the next generation of girls, the margin
of adjustment is different. A large literature provides evidence that Indian parents have, for
centuries, manipulated the sex composition of their children through son-biased fertility
stopping and through lower investments in daughters (see a brief survey in Bhalotra et al.
2016 for instance). Since the mid-1980s, the availability of affordable prenatal sex detection
techniques (alongside pre-existing availability of abortion) has provided a new tool to meet
this end (see discussion in the following Section 2.b). The perceived cost of having a
daughter is higher post-reform, because she is a potential competitor for the son in
inheritance, and may contest her disinheritance in court in future. Even if parents expect
that the probability that daughters contest is small, the risk may loom large – under risk-
aversion, uncertainty is more heavily weighted for negative outcome. In addition, parents
may incur psychic costs associated with non-compliance with the law, and with alienating
their daughters. Finally, the risk that daughters contest their rights is rising and parents can
probably see this insofar as a number of NGOs (e.g. Marg and SEWA) now pro-actively
encourage women to claim their rights and provide legal support.14 In addition, the returns
to contesting rights to property (mostly land) are increasing in line with the trend of rising
land prices across India.15 This trend raises the stakes for contesting land. Unsurprisingly, a
recent study of 9,300 litigants across 170 district courts, balanced across civil and criminal
cases, found up to two thirds of cases relate to land and property.16 Indeed, more than half
of these disputes occurred within families (Ibid). As of September 2017, the Business
13 Patrilocality (also known as virilocality) is the social custom that requires married women to leave their parents’ home and reside with their husband’s family post marriage. 14 See the summary of these NGO initiatives on the UN Women’s website here http://www.endvawnow.org/en/articles/943-provide-rights-based-education-and-awareness.html 15 Rising agricultural land prices have been a noticeable trend across India since the early 2000s. As of 2013, M. Rajshekar reports a “3 to 100-fold rise in farm land prices” drawn from microstudies and anecdotal information on 68 villages in seven states gathered by the Economic Times https://economictimes.indiatimes.com/news/economy/agriculture/great-rural-land-rush-3-to-100-fold-rise-in-farm-land-prices-may-not-bode-well/articleshow/25607513.cms 16 Source: http://www.livemint.com/Politics/DIsifcuswHskm1jkXNdI2M/A-case-to-revisit-Indias-land-laws.html
11
Standard notes “land conflicts [are] brewing across the country,”17 as well as creating family
feuds across national boundaries,18 echoing writing over the past decades on “growing
conflict about land.”19
2b. Sex Ratios and Ultrasound Technology in India
The phenomenon of “missing women” was initially highlighted in Miller (1981) and Sen
(1990). Recent estimates suggest that among the stock of women who could potentially be
alive in India today, over 25 million are “missing” (Anderson and Ray 2012). The
population sex ratio in India has been unnaturally skewed in favour of males since the first
recorded census. Historically, parents have manipulated the ratio of surviving girls to boys
by the practice of son-biased fertility stopping (Arnold et al 1998; Bhalotra and van Soest
2008) and multiple forms of neglect including breastfeeding duration, immunization and
nutrition (Jayachandran and Kuziemko 2011; Oster 2009).
Since the availability of prenatal sex detection technology, it has become possible to
manipulate the sex ratio by committing sex-selective abortion or female foeticide, the
material and psychic costs of which tend to be lower than the costs of eliminating girls
after birth. Abortion has been legal in India since 1972 and the costs of scans and abortion
are affordable, albeit with prices increasing in the reliability and safety of these procedures.
It is estimated that as many as 0.48 million girls or 6% of potential female births during
1995-2005 were selectively aborted annually during 1995-2005, which is more than the
number of girls born in the UK each year (Bhalotra and Cochrane 2010). In contrast to the
more subtle and uncertain procedure of neglect, foeticide is a conscious and staged act and,
for this reason, it provides a clean measure of parents’ preferences for having sons rather
than daughters.
The first imports of ultrasound scanners are recorded in the mid-1980s, associated with
India’s first attempt at import liberalization (see Figure 2b). There was a sharp increase in
availability in the mid-1990s, created by the relaxation of industrial licensing requirements,
17 Source: http://www.business-standard.com/article/economy-policy/conflicts-across-india-as-states-create-land-banks-for-industry-investment-117091900140_1.html 18 Source: http://www.bbc.com/news/world-asia-21171262 19 Source: https://www.voanews.com/a/india-witnesses-growing-conflict-over-land-101293609/124357.html
12
which led to domestic production of ultrasound machines.20 Bhalotra and Cochrane (2010)
show that the sex ratio at birth for birth orders two and higher tracks the availability of
ultrasound, and that a disproportionate share of foeticide is conducted in families with a
first-born girl. They also show that the sex of the first-born child is quasi-random and
Abrevaya (2009) shows this is also the case for Indian and Chinese families in US.
Although stated son preference in India is declining over the sample period (Figure 3),
Figure 4 shows a sharp drop in the probability of a female birth that appears after
ultrasound is introduced and that this is evident only in families with a first-born girl.
A common pattern in India and other patrilineal societies is that daughters take their
bequest at marriage as dowry and marry some distance from their natal home (Guner 1998;
Rosenzweig & Wolpin 1985), while sons tend to co-reside with parents, work on the land,
and subsequently inherit it. Indeed, Botticini and Siow (2003) postulate that a rationale for
the origin and persistence of these arrangements is that they incentivize sons to work on
the father’s land, contributing to wealth creation as well as old-age security.
3. Identification Strategy
Our objective is to obtain causal impacts of the inheritance reform on the preference for
sons in India. For reasons discussed earlier, we focus upon son preference expressed in the
stark act of sex-selective abortion (or female foeticide). With appropriate caveats, we seek
to corroborate this with data on reported son preference. We then extend the analysis to
study the impacts of the reform on excess girl mortality after birth, and son-biased fertility
stopping, both of which are alternative ways of adjusting the sex composition of surviving
births. This allows us to check whether prenatal mortality (foeticide) is simply substituting
for postnatal mortality or fertility stopping behaviour, or if, potentially, different women
respond to the reform on these different margins.21
20 For further details on the timing of availability of ultrasound technology etc. please refer to pages 12-13 in Section 5 of Bhalotra and Cochrane (2010). 21 We do not directly analyse investments after birth because data on investments (including breastfeeding, vaccinations, visits to the doctor etc.) are only gathered for children born 3-5 years before the survey date. The survey dates of the NFHS rounds are such that we do not have sufficient pre- versus post-reform variation in these data. However, other studies show that under-investment in girls (relative to boys) maps into excess girl mortality in India (see Anukriti et al. 2016, and references therein).
13
The reform was implemented by individual state governments, so its incidence was
staggered across the states, generating potential discontinuities in the outcome specific to
state and birth year. However, as sex-selective abortion was infeasible prior to availability
of prenatal sex detection technologies (which we henceforth abbreviate as “ultrasound”),
we expect that any impacts of the reform on desired sex ratios will only be evident in the
actual sex ratio at birth among post-ultrasound cohorts. We therefore interact an indicator
for cohorts born post-reform (Rst) with an indicator for cohorts born post-ultrasound
(Postt), allowing for the main effects of each.
The initial estimated equation for sex ratios is:
!"#$% = '$ + )%++,$% + -(,$% ∗ 0123%) + 5"#$% (1)
where !"#$% is a binary variable that equals 1 if child i born to mother m in state s in year t
is a girl and zero otherwise, multiplied by 100 so that the regression coefficients can be
interpreted as percentage point changes in the sex ratio at birth. '$ and )% represent state
and year of birth fixed effects. ,$% is a dummy variable that equals 1 for cohorts born after
the reform in a reforming state and zero for cohorts born before the reform or in a non-
reforming state. For instance, ,$% defines potential births in Kerala in 1970-1975 and in
Karnataka in 1970-1993 as unexposed to the reform, and potential births in Kerala in
1976-2005 and in Karnataka in 1994-2005 as exposed.
In the absence of sex-selection, the outcome probability (i.e. the probability that a birth is a
girl) is close to a half (see Appendix Table A5). After and only after the introduction of
ultrasound scanners, the share of girls at second and higher-order births has declined
steadily, and the magnitude of the decline lies outside the range regarded as consistent with
biological variation or slow-changing environmental factors (Bhalotra and Cochrane 2010).
Following Bhalotra and Cochrane (2010) who test and defend this formulation with
reference to the timing of the first ultrasound scanner imports in India, we construct a
dummy variable 0123% which equals 1 if the year of the child’s birth is after 1985 and zero
otherwise. Since diffusion of ultrasound scanners at the state level is likely to be correlated
with demand, we use the national timing of ultrasound availability determined by
exogenous changes in India’s import tariffs. The coefficient of interest in this specification
is -, which captures the differential impact of the inheritance reform on sex ratios at birth
after the availability of ultrasound technology.

14
A familiar concern with difference-in-difference specifications such as (1) is that there may
be state-specific time-varying omitted variables that are correlated with the introduction of
the inheritance reform. Put differently, the identifying assumption is that the dates of
introduction of the reform are not correlated with pre-trends in the sex ratio at birth. If the
sex ratio at birth was already growing more male-biased in the reforming (southern) states
than in the non-reforming states, we may spuriously attribute to inheritance reform a post-
ultrasound North-South differential in sex-selection. The empirical significance of this
concern is limited a priori by the fact that sex-selective abortion initially grew more rapidly
in the Northwest. We nevertheless address this concern as follows.
We create within-state variation in the incentive to sex-select at the family level by the sex of
the first-born child on the premise that this is quasi-random: parents who, by the random
hand of nature, are assigned a son at first birth are significantly less likely to engage in
female foeticide for subsequent conceptions (see Almond and Edlund 2008, Abrevaya
2009, Bhalotra and Cochrane 2010).22 This begets us two advantages. First, any omitted
variables at the state-year level would now have to vary systematically between families in a
state and birth-year with the sex of the first-born child. Second, we can now include state-
year fixed effects that flexibly control for any omitted state-year variation that may be
correlated with the passage of inheritance reform. This richer, more rigorous specification
is:
!"#$% = '$ + )%+6$% + +,$% + -789:23;9:<# + -=89:23;9:<# ∗ ,$% + ->,$% ∗
0123%+-?89:23;9:<# ∗ 0123% + -@(89:23;9:<# ∗ ,$% ∗ 0123%) + 5"#$% (2)
where 89:23;9:<# is an indicator for the first-born child of the mother m being female,
6$% denotes state-year fixed effects, and the rest of the notation is as defined for equation
(1). We consistently control for all of the underlying main effects and secondary interaction
terms.23 Since we include state-year fixed effects, the level effect of the reform (+) and the
coefficient (->) on the interaction term ,$%*0123% are longer identified. However, our
confidence that we identify causal effects is substantially increased. The coefficient of
22 Bhalotra and Cochrane (2010) discuss and investigate the premise that the sex of the first birth is random using the same data as ours. In our sample too, we find no significant change in sex ratio of first births post reform post ultrasound (see Appendix Table A2c). 23 In other words, we control for the main effect “firstgirl”, an indicator for families with a first-born girl vs a first-born boy. As having a son confers “status” on Indian women, it may be that mothers with first-born boys have more say and are allowed to keep a later-born girl. This is accounted for by the main effect.

15
interest is now -@, which captures the impact of inheritance reform on the relative chances
that a birth is female in households with a first-born daughter relative to households with a
first-born son in the post-ultrasound period. We model the sex ratio only for second-order
births to mitigate concerns about potentially endogenous continuation of fertility.
However, our results are qualitatively similar when we include third and fourth-order births
(see discussion in Section 5.2).
As discussed in Section 2.2, although ultrasound scanners were imported into India from
the mid-1980s onwards, there was a sharp increase in their supply once local production
was initiated in the wake of industrial de-licensing and related economic reforms in the
mid-1990s (Figure 2a).24 To capture this non-linearity in evolution of supply, we divide the
post ultrasound period into an early and a late diffusion period and replace 0123% with A=
and A>in equations (1) and (2), where A= equals 1 for 1985-94 (early ultrasound period)
and A> equals 1 for 1995-2004 (late ultrasound period). A7is the omitted category that
captures the pre-ultrasound period 1972-1984. The rationale for these choices is detailed in
Bhalotra and Cochrane (2010). Our findings are not sensitive to varying the cut-off years
by one or two years on each side of the chosen thresholds or to using 0123% instead of A=
and A> separately (results are available on request).
Since the reform is at the state level and the sex of the first-born child is quasi-random, any
differential uptake of ultrasound scans and sex-selective abortion facilities across mothers
within a state will affect interpretation of the distribution of impacts on the treated but will
not bias interpretation of the average intent-to-treat effects. However, there may be
mother-level selection into conception that is correlated with the inheritance reform and
the availability of prenatal sex detection facilities. To allow for this, we show estimates
conditional upon mother fixed effects. These comprehensively control for time-invariant
24 The first private clinic offering sex determination is thought to have appeared in 1982-83 (Sudha and Rajan 1999). After that supply increased at an increasing rate, fuelled by imports and the growth of local production. In the mid-1990s large-scale local production of ultrasound scanners was initiated by General Electric and other multinational firms in joint ventures with Indian firms (Grover and Vijayvergiya 2006, Mahal et al. 2006, Murthy et al. 2006). Government data show that the number of ultrasound machines manufactured in India increased 15-fold between 1988 and 2003 with especially marked increases after 1994 (Grover and Vijayvergiya 2006, Murthy et al. 2006, George 2006). Ultrasound scans dominate prenatal sex-determination, as they are relatively cheap and non-invasive. The technology is continuously improving, providing finer resolution of the fetal image earlier in pregnancy, and the scanners are growing smaller and more mobile.
16
differences between mothers in preferences, information and local facilities. The estimated
equation looks similar to (2) except that '$is replaced with '#.
Indian states are large regions that, in many cases, have their own languages and inter-state
migration is small in general (Topalova 2010). However, we cannot rule out that the reform
may have stimulated inter-state migration. Since we measure the incidence of reform in
terms of the potential birth year of the child, a specification including mother fixed effects
ensures that selective migration will not bias our estimates unless it occurs between births.
To investigate this potential bias, we re-estimate the equation restricting the sample to
women who had not migrated between births. This can be done because the NFHS
surveys ask women how long they have lived in their current place of residence, and we
know the birth year of their first and last child. Since the current place of residence is much
more local than their state, this is a stringent test. Our results are found to be robust
(available on request.)
As discussed earlier, previous studies on India’s inheritance reform exploit state and birth
cohort variation in exposure to reform, which leaves the estimates potentially vulnerable to
bias from omitted state- and year-varying variables. In addition, previous studies either
impose an age of exposure of the mother (e.g. Roy 2015) or use aggregate data and thus
cannot account for individual variation in exposure (e.g. Anderson and Genicot 2015). In
contrast, our paper has a clean measure of exposure defined on the potential birth year of
the child, obtains within-mother estimates, as well as shows robustness to using mother-
level exposure to the reform (see Section 5.1). Our identification strategy is therefore
considerably more stringent.
The specification estimated to investigate changes in reported son preference is:
2"#$% = '$ + )%+6$% + +,$% + -789:23;9:<# + -=89:23;9:<# ∗ ,$% + ->,$% ∗
0123%+-?89:23;9:<# ∗ 0123% + -@(89:23;9:<# ∗ ,$% ∗ 0123%) + 5"#$% (3)
The dependent variable 2"#$% is the desired or ideal number of sons divided by the desired
or ideal number of total children reported by the mother. The resulting variable is bounded
between 0 and 1. However, this is measured only at the time of survey. We construct a
time-varying measure of reported son preference based upon the age of the mother at the
time of the survey by exploiting cohort variation in stated preferences. We assume that son

17
preference at age 20 determines fertility choices, but we confirmed that small variations on
this choice of age made no significant difference to the results.25 Thus, women aged 20 in
the survey year 1998 will define son preference for their cohort for the year 1998, while the
preferences of women aged 40 who were surveyed in 1998 will define son preference in
1978, the year in which they were age 20. This assumes that reported preferences do not
vary within woman as a function of her ages or her fertility experience. This is a strong
assumption and so we only regard these findings as auxiliary – as an attempt to look at
whether stated preferences are consistent with our evidence on behavioural change. In this
specification, the “Reform” variable ,$% is a dummy variable that equals 1 if the mother is
20 years old at the time of the reform in the reforming state and zero otherwise.
As discussed earlier, we also estimated the impacts of the inheritance reform on excess girl
mortality and fertility. The mortality specification is:
B"#$% = '$ + )%+6$% + +,$% + -789:23;9:<# + -=89:23;9:<# ∗ ,$% + ->,$% ∗
0123%+-?89:23;9:<# ∗ 0123% + -@(89:23;9:<# ∗ ,$% ∗ 0123%) + 5"#$% (4)
where the dependent variable B"#$% captures whether or not the child died on or before
reaching their first birthday, multiplied by 100. The rest of the variables are as in equation
(2). We present results differentially by gender of child. The fertility specification is:
8"#$% = '$ + )%+6$% + +,$% + -789:23;9:<# + -=89:23;9:<# ∗ ,$% + ->,$% ∗
0123%+-?89:23;9:<# ∗ 0123% + -@(89:23;9:<# ∗ ,$% ∗ 0123%) + 5"#$% (5)
where the dependent variable 8"#$% is an indicator for whether or not the child has
younger siblings, multiplied by 100. The rest of the variables are as in equation (2).
4. Data and Descriptive Statistics
We primarily use the National Family Health Survey (NFHS) which records the complete
fertility histories of women aged 15-49 and thus allows us to identify the sex and birth year
of every child for a representative and large sample of women. The birth histories of
women span the pre- and post-reform periods in every reforming state. In addition, the
25 70% of women in our NFHS sample have had their first child by the age 20. The median age at first birth is 18. Our results for son preference are robust to using 18 instead of 20 years as the cut-off age for mother’s son preference to determine her fertility choices.
18
birth histories identify biological children of a mother rather than all children in a
household. The surveys also ask women their desired number of children, and the desired
numbers of sons and daughters. The NFHS is a household survey representative at the
state level, covering 26 states of India,26 and it was conducted in three waves in 1991/2,
1998/9 and 2005/6. We pool the three rounds and use data on birth cohorts 1972 to 2004.
As mentioned in Section 3, we restrict the sample for our main analyses to up to second-
order births (but also present additional results later including up to third and fourth-order
births for robustness). The total number of births is 490,833, born to 169,728 mothers. Of
this, 169,728 are first order births and 136,013 are second order births.
Descriptive statistics are presented in Appendix Table A9. The mean sex ratio
(females/males) is 0.48 while mean son preference (defined as the ratio of ideal number of
sons over ideal number of total children reported by mother) is 0.57. Appendix Table A10
shows a pre-reform balance test between reforming and non-reforming states. The only
systematic difference is in reported son preference.
In order to explore the impact of the inheritance reform on co-residence of parents and
sons and the distance of daughters’ marital home from their natal home, we use the Rural
Economic and Demographic Survey (REDS) 2006. The REDS is a nationally
representative survey for rural India that covers 17 major states.27 To maintain
comparability with the NFHS sample, we use data on birth cohorts 1972 to 2004. The
analysis sample comprises 41,105 individual births born to 8,154 mothers.
Results
5.1 Sex Ratios at Birth
Table 1 presents estimates of equation (2). The reported coefficients are the triple-
difference coefficients that capture the differential impact of the reform on the probability
that a birth is female among post-ultrasound cohorts in families with a first-born girl
26 The HSA (1956) did not apply to Jammu and Kashmir (Agarwal, 1995), hence this state is excluded from the analysis. In addition, Sikkim, one of the smaller states, is not part of the 1992 wave. 27 The 17 major states are: Punjab, Haryana, Uttar Pradesh, Rajasthan, Bihar, West Bengal, Madhya Pradesh, Gujarat, Maharashtra, Karnataka, Kerala, Tamil Nadu, Andhra Pradesh, Orissa, Chattisgarh, Uttarkhand and Jharkhand, which account for more than 92% of the total population of India (Census of India, 2011).

19
relative to families with a first-born boy.28 Our estimates in Column 1 indicate a significant
decline in the probability that a birth is a girl by 3.8-4.3 percentage points (pp). These
results are robust to inclusion of household level control variables (Column 2), state-
specific linear trends (Column 3) and state-year fixed effects (Column 4). After
conditioning on state-year fixed effects, we cannot separately identify the double-difference
coefficients for ,$% ∗ A=% and ,$% ∗ A>% . Our estimates are larger though not statistically
significantly different conditional on mother fixed effects (Column 5). All throughout, we
cannot reject equality of the coefficients for the two periods marking early and late
diffusion of ultrasound. This is plausible given that “treatability” was higher in the first
period (low hanging fruit) while availability of ultrasound was higher in the second period,
and these differences may offset one another.
We also investigate the robustness of our findings to using mother’s exposure rather than
child’s exposure to the reform. The estimating equation for this specification is:
8#$% = '′$ + )′% + 6′$3 + +′D$% + 5#$% (6)
where 8#$% denotes the proportion of female births to mother m who was born in year t
living in state s. This is specifically measured as G/(G+B) where G is the number of girl
children and B is the number of boy children born to the mother. The mother’s exposure
to the inheritance reform is denoted by a binary variable D$% that equals 1 if the mother
was 14 years old or younger at the time of reform and zero otherwise.29 The coefficient of
interest is +′ which captures the differential impact of the reform on the proportion of
female births to treated mothers, relative to control mothers (i.e. those who were 15 or
older at the time of reform in the reforming states or those who lived in non-reforming
states). The results are presented in Appendix Table A4. We estimate that the proportion
of female births declined by 0.01 in response to the reform (Column 1), consistent with
increased female foeticide as discussed based on results for child-level exposure presented
in Table 1. The mother-level result is robust to controlling for household level variables
(Column 2) and the coefficient is also robust to state-specific linear trends even if it loses
statistical significance at conventional levels (Column 3).
28 The full specification (including the double and triple-differences and level coefficients) is reported in Appendix Table A1. 29 The state-level reforms that we investigate here only affected the inheritance potential of women if they were unmarried at the time of the passage of the reform in their state. Data from NFHS indicates that less than 10% women are married before turning 14.

20
5.2 Sex Ratios at Birth: Robustness Checks
We have already discussed robustness of our sex ratio results to some fairly demanding
controls, including state-year fixed effects and mother fixed effects. We now present some
further checks. First, we control for state-year variation in the establishment of State
Commissions for Women which, in principle, may confound the estimated impacts of the
inheritance reform on sex ratios at birth. In fact, our inclusion of state-year fixed effects
addresses this (and all other state-year varying omitted variables) but we nevertheless do
this to identify how the coefficient of interest changes in response to controlling for this
identified reform.30 First we include an additive control but in a second specification we
interact the Women’s Commission indicator with firstgirlm*post (see Table 2, Columns 1-2).
In both cases, we control for state-specific linear trends instead of state-year fixed effects.
Our results stand up to this specification change.
Maharashtra and Karnataka passed the reform after the constitutional amendment
mandating a third of seats in village councils for women in local government in India. We
test robustness of our results to the exclusion of Maharashtra and Karnataka from the
sample (see Table 2, Column 3). The coefficients are not significantly different.
Since the reforming states are all in southern India we need to address the potential
concern that we are merely picking up a “southern state effect”. Although inclusion of
state fixed effects and state-year fixed effects ought to account for any such time-invariant
or time-varying effects, we nevertheless repeat our analysis by restricting our sample to
only the reforming states i.e. Kerala, Andhra Pradesh, Tamil Nadu, Maharashtra and
Karnataka, allowing us to exploit variation in dates of reform within southern Indian,
rather than variation between the southern and the northern parts of the country. With this
restricted sample, we are no longer able to identify different coefficients for the early and
late diffusion of ultrasound because all the reforming states had passed the reform by 1994.
Hence, we use a common A123 period that covers the entire period of ultrasound
availability from 1985 onwards. We continue to find evidence for increase in female
foeticide following the passage of inheritance reform (see Table 2, Column 4). Note that
30 Anderson and Genicot (2015) control for legal changes such as this but their outcome (suicide) is measured at the state-year level, and so their specification cannot accommodate state-year fixed effects.
21
the southern states have historically exhibited lower son preference31 and are known to be
more gender progressive than states in north India. Thus, it seems reasonable to think that
these states would equalize inheritance rights for women earlier. This is likely to be correct,
but we address it in our analysis.32
Alternative explanations for sex ratios at birth becoming more male-biased in general
include differential access to technology across families, differences in returns to education
for boys versus girls, etc. However, our strategy effectively looks for systematic differences
between first-son and first-daughter families that, we show, are balanced on observable
characteristics (see Table 8). This implies that our findings are robust to these macro-level
changes. Moreover, our strategy does not pick up general trends in the sex ratio but, rather,
sharp changes in the sex ratio coincident with the introduction of inheritance reform.
Another concern may be that sex ratio at birth of second born children is unlikely to reflect
the (complete) average effect of reform on a family’s total gender composition of children
as mother’s fertility is unlikely to be complete. To address this concern, we test the
robustness of our sex ratio results by restricting our sample to mothers who have
completed fertility defined in one of two ways: a) mothers aged 35 or more at the time of
survey and b) mothers whose actual fertility is greater than desired fertility. As Table 2,
Columns 5-6 indicates, our results remain qualitatively unchanged.
As mentioned in Section 3, we focus upon second births to mitigate the concern that a
select group of women progresses to third and higher birth orders, while 93.7% of Indian
women have a 2nd birth (NFHS data). However, we also test the robustness of our sex ratio
results to including up to third births (see Appendix Table A2a) and up to fourth births
(see Appendix Table A2b). The pattern of results is similar, indicating increased female
foeticide after the reform, but the coefficients are smaller and not consistently statistically
significant.
31Appendix Table A10 indicates that reported son preference in our NFHS dataset is 0.56 in the southern states compared to 0.6 in the rest of India. 32 We do this essentially by controlling for state-year fixed effects and looking to identify sharp changes in the trend in the sex ratio at birth in first-born girl families relative to first-born boy families that are coincident with the state-specific year of the reform. We find increased female foeticide following the reform even though these are states with lower son preference.
22
Finally, we test robustness of our sex ratio results to using our alternative dataset REDS
2006 (see Appendix Table A3a). We observe a similar pattern of results as with NFHS.33
We also repeat our array of further robustness checks outlined above using REDS 2006
(see Appendix Table A3b) and observe a similar pattern of results.
5.3 Reported Son Preference
Table 3 reports results for stated son preference. The reported coefficients are the triple-
difference coefficients.34 We find that families with first-born girls are 1 pp more likely to
report preferring sons over daughters relative to families with first-born sons, post-reform
and post-ultrasound (Column 1). This is robust to inclusion of household level controls
(Column 2), state linear trends (Column 3) and state-year fixed effects (Column 4).35 These
results are therefore consistent with evidence of sex selection discussed earlier. Women
who are in the early reproductive years (around age 20) after the reform report higher son
preference than women of the same age before the reform. This result is particularly
striking since overall son preference has been declining in India (see Figure 3). Thus
reported preferences for sons move in line with revealed preferences for sons (revealed in
manipulation of the sex ratio at birth and, as we shall see below, also in post-birth girl
mortality and son-biased fertility stopping).
5.4 Excess Girl Mortality After Birth
Excess girl mortality after birth is an alternative to female foeticide when parents want to
adjust the sex composition of surviving births. Our results for the impact of the reform on
excess girl mortality is presented Table 4. The reported coefficients are the triple-difference
coefficients.36 The estimates indicate that post-reform and post-ultrasound, girls in families
with a first-born girl are 2.3-3.2 pp more likely to die before reaching their first birthday,
relative to boys (Column 1). This effect is equivalent to 32-42% of the sample mean for
child mortality among girls (which is 7.3%). This result is robust to inclusion of all controls
(Columns 2-5). In contrast, boys in families with a first-born girl are 1.2-1.6 pp less likely to
die before reaching their first birthday relative to the control group. Averaging across the
33 The coefficients are larger but the sample is now rural and not matched to the NFHS sample. 34 The full specification (including the double and triple-differences and level coefficients) is reported in Appendix Table A5. 35 Since by construction, the dependent variable does not vary within mother, we do not present results from a specification with mother fixed effects for reported son preference. 36 The full specification (including the double and triple-differences and level coefficients) is reported in Appendix Table A6.

23
country, there is evidence of some substitution of postnatal mortality with prenatal
mortality (foeticide) in the post-ultrasound period (Anukriti et al. 2016). Here we see that
in the reforming states, the equalization of inheritance rights led to the elimination of girls
in both ways, before and after birth. This is consistent with different women responding to
the inheritance reform on these different margins.
5.5 Son-Biased Fertility Stopping
A further margin of adjustment in the sex of surviving births is son-biased fertility
stopping. Our estimates for the impact of the reform on such behaviour is presented in
Table 5. The reported coefficients are the triple-difference coefficients.37 We find that,
following inheritance reform, in the late ultrasound period (p3), children in families with
first-born girl are approximately 9 pp more likely to have a younger sibling (equivalent to
12% of the sample mean) relative to the control group (Column 1). The coefficient for the
early ultrasound period (p2) is also positive, though not statistically significant.38 These
results are robust to controls (Columns 2-4), and increase in magnitude following the
addition of mother fixed effects (Column 5).
Taken together, our finding that inheritance reform exacerbates son preference in each of
the three domains in which it may be potentially exercised, is compelling. As discussed in
Section 5.3 above, this is also corroborated with available data on reported son preference.
Given the caveats discussed earlier with the stated preference results, we underline the
behavioural evidence of son-preferring behaviours in three different domains, all of which
are consistent with stated son preferences.
5.4 Investigating (Shifting) Social Norms
Historically, sons have enjoyed inheritance rights to family property in the form of post-
mortem bequests in societies where daughters receive pre-mortem bequests in the form of
dowry (Goody 1973). Botticini and Siow (2003) formalize this in terms of parents
incentivizing sons to provide effort on family property. A critical premise is that sons stay
and co-reside with parents while married daughters leave the parental home (patrilocality). 37 The full specification (including the double and triple-differences and level coefficients) is reported in Appendix Table A7. 38 We cannot reject the equality of the coefficients for the two ultrasound periods at conventional levels.

24
Forcing parents to share post-mortem bequests equally between daughters and sons may
therefore have implications for familial ties. In this section, we explore the impact of the
inheritance reform on two specific dimensions of such ties: co-residence of parents and
adult sons, and distance of daughters’ marital homes from their parental homes.
By requiring parents to give daughters and sons equal portions of ancestral property, the
inheritance reform limits parents’ ability to reward sons’ effort invested in family property
that may in turn lower their inclination to co-reside. Hence, we first test whether exposure
to the reform impacts the incidence of co-residence between parents and adult sons. Co-
residence is the most widespread form of physical, emotional, economic, and social
security for parents in contemporary India. 49% of the sample co-reside with adult sons.
We define a parent-offspring pair in a given household as “exposed to reform” if there is at
least one daughter in the household who is 14 years or younger at the time of reform (i.e.
likely to be unmarried).39 This is similar to our measure of mother’s exposure to reform
(Equation 6). We study two sets of parent-offspring pairs: the household head’s parents (ie
grandparents) residence with the head and his or her siblings, and the household head’s
residence with his or her children (grandchildren). Adult sons are defined as married men
aged eighteen years or older at the time of the survey.40 We restrict the sample to the subset
of families with at least one living parent and one adult son, with any number of adult
daughters (including none).
The estimating equation for co-residence of parents and adult sons is:
E"FG$% = '′′$ + )′′% + 6′′3$% + H′′DFG$% + 5"FG$% (7)
where the dependent variable of interest, E"FG$% is a dummy variable capturing whether or
not any surviving parent i (parent with adult children) in a given natal household h from
parent-child pair g in state s born in year t co-reside with an adult son. DFG$% is a dummy
variable that captures the pair’s exposure to reform as defined above.
The results are presented in Table 6. Conditioning on state and year of birth fixed effects
and household level control variables, the coefficient on exposure to reform is negative but
not statistically significant (column 1). Restricting to married adult sons only, and adding
39 As mentioned earlier, NFHS data indicates that very few (less than 10%) women are married before turning 14. 40 Restricting the sample to married adult sons also helps us account for children’s widespread residence with parents until marriage in India.

25
either state linear trends or state-year fixed effects, or mother fixed effects does not change
the result (columns 2-5). Thus, we find no evidence that reform exposure reduces co-
residence of parents with sons.41 This appears to be a sticky social norm, corroborating
previous work on norms supporting gender inequality (Alesina, Giuliano and Nunn, 2013).
So as to examine the impact of exposure to the reform on distance of married women
from their natal home, we use a similar specification as equation (7) where the dependent
variable is a binary measure that takes the value 1 if the distance between a married
woman’s marital and natal homes is 10 kilometers or less and zero otherwise.42 We choose
this threshold as it captures the lowest quartile of women’s marriage distances in our
sample. “Exposure to reform” is a dummy variable that equals 1 if the woman was 14 or
younger at the time of reform and zero otherwise. The results are presented in Table 7.
Women exposed to the reform are between 3-5 percentage points more likely to marry into
homes within 10 kilometers of their natal households (columns 2 and 4). We also find a
significant effect in the same direction if we use 20 kilometers rather than 10 (Appendix
Table A8). Thus, it appears that there was in fact some norm-shifting in terms of daughters
marrying closer to home, although co-residence often coincides with the son working on
the land and then inheriting it, so the latter is the more important, and the more rigid
measure, of patrilocality.
To elaborate further, our results for co-residence show no erosion in the tradition of
parents living with adult sons and these results alone are consistent with sex ratios being
biased against girls. We find some adjustment post reform in the distance between
daughters’ natal and marital homes. While this may indicate that daughters want to move
closer to natal property once they acquire rights over it, it may have little impact on
parents’ incentives if what parents need is effort (labour) on the property (often land),
which is historically provided by co-resident sons. In other words, co-residence with sons
may dominate parental incentives. Another explanation that would reconcile the result
pertaining to married daughters living closer with the result that parents continue to be
averse to giving birth to (more than one) daughter(s) is that the compliers driving these
two results may be different. In other words, families who commit female foeticide are
41 We do not find any impact on co-residence of parents with adult daughters (results available on request). 42 We use the kilometer distance between the household sampled and each married woman’s marital home. This measure includes female household heads, whose distance from their natal home is defined as zero.
26
different families than those whose daughters marry closer to the natal home.
5. Conclusion
This paper shows that legislation that gives women equal rights to inheritance of ancestral
property intensifies son preference in fertility. The evidence is stark, showing large
increases in parents’ proclivity to commit sex-selective abortion in order to manipulate the
sex composition of their births in favour of sons. In fact, we find that parents also adjusted
the sex composition of their births in other ways: the reform was associated with an
increase in girl relative to boy infant mortality and an increase in the tendency for families
without a son (or their desired number of sons) to continue fertility. This is corroborated
by evidence on increased reported son preference (i.e. stated desired share of sons among
births) post reform.
Our findings demonstrate the challenges faced by legal reform. They suggest that support
for institutionalizing women’s economic rights was not widespread. Pervasive support
(among men) has been argued to emerge as the returns to human capital investment rise
(Doepke and Tertilt 2009). While a full analysis is beyond the scope of this paper, we
observe that average returns to human capital have been rising in India since the 1990s,
and that women’s education has converged towards that of men. However, there remain
barriers to women realizing returns to education on the labour market (Field et al. 2016).
Moreover, we provide evidence that the convention that sons provide old-age security has
not changed and there is no systematically provided state pension.
In Europe and America, the legislation of economic rights for women followed the
implementation of women’s suffrage. In India, women and men have had equal voting
rights since India gained independence from British rule in 1947, but legislation of rights
for women has proceeded only slowly since then.43 The early amendments to the Hindu
Succession Act that we analyse in this paper were favoured by women legislators in seats
reserved for lower castes, with women legislators from higher castes having no discernible
impact on women-friendly laws (Clots-Figueras, 2011). It may be that consistent
monitoring of implementation of legal change requires a larger share of women in
43 The Dowry Prohibition Act of 1961 was among the first pro-female legislative reforms, followed by The Prevention of Sati (widow burning) Act of 1987 and the National Commission for Women Act 1990. The federal Inheritance Rights Reform and the Protection of Women Domestic Violence Act were passed as recently as 2005, and the Child Marriage Act was passed in 2006.

27
government than India has (Brulé 2017). During 1980-2007, for instance, 59% of women
in contrast with 66% of men turned out to vote, but only 4.4% of electoral candidates for
state legislative assemblies were women, and women comprised only 5.5% of state
legislatures (Bhalotra, Clots-Figueras and Iyer forthcoming).
28
References
Abrevaya, J. (2009) “Are There Missing Girls in the United States? Evidence from Birth Data.” American Economic Journal: Applied Economics 1 (2): 1–34. Agarwal, B. (1994) A Field of One’s Own: Gender and Land Rights in South Asia, Cambridge University Press Aldashev, G., J. Platteau and Z. Wahhaj (2011) “Legal Reform in the Presence of a Living Custom: An Economic Approach”, Proceedings of the National Academy of Sciences, 22 December, 108 (Supplement 4) 21320-21325 Alesina, A., P. Giuliao and N. Nunn (2013) “On the Origins of Gender Roles: Women and the Plough.” The Quarterly Journal of Economics 128(2): 469-530 Almond, D. and L. Edlund (2008) “Son-Biased Sex Ratios in the 2000 United States Census.” Proceedings of the National Academy of Sciences 105 (15): 5681–82 Almond, D., H. Li and S. Zhang (2013) “Land Reform and Sex Selection in China”, NBER Working Paper No. 19153, June Anderson, S. (2003) “Why dowry payments declined with modernization in Europe but are rising in India”, Journal of Political Economy, April 2003, Vol. 111, p. 269-310 Anderson, S. and G. Genicot (2015) “Suicides and Property Rights in India”, Journal of Development Economics, Vol 114, pp. 64-78, May Anderson, S. and D. Ray (2012) “The Age Distribution of Missing Women in India”, Economic and Political Weekly, Vol. XLVII, No. 47-48, pp. 87-95 Anukriti, S., S. Bhalotra and H. Tam (2016) “On the Quantity and Quality of Girls: New Evidence on Abortion, Fertility, and Parental Investments”, IZA Discussion Paper No. 10271 Arnold, F., M. K. Choe and T.K. Roy (1998) “Son Preference, the Family-building Process and Child Mortality in India”, Population Studies, 52:3, 301-315 Ashraf, N., E. Field and J. Lee (2014) “Household Bargaining and Excess Fertility: An Experimental Study in Zambia.” American Economic Review Vol. 104, No. 7
Ban, R., et al. (2012) “Who Has Voice in a Deliberative Democracy? Evidence from Transcripts of Village Parliaments in South India’, Journal of Development Economics 99(2), pp. 428-438 Banerjee, A., P. Gertler and M. Ghatak (2002) “Empowerment and Efficiency: Tenancy Reform in West Bengal” Journal of Political Economy, 110(2) Baranov, V., S. Bhalotra, P. Biroli and J. Maselko (2017) “Maternal Depression, Women’s Empowerment, and Parental Investment: Evidence from a Large Randomized Control Trial”, IZA Discussion Paper No. 11187, November
Besley, T. (1995) “Property Rights and Investment Incentives: Theory and Evidence from Ghana”, Journal of Political Economy, 103(5), pp. 903–937
29
Besley, T. and M. Ghatak (2009) “Property Rights and Economic Development” in Handbook of Development Economics eds. D. Rodrik and M. Rosenzweig, North Holland
Bhalotra, S. and T. Cochrane (2010) “Where Have All the Young Girls Gone? Identifying Sex-Selective Abortion in India”, IZA Discussion Paper No. 5381, December
Bhalotra, S., I. Clots-Figueras and L. Iyer (forthcoming) “Pathbreakers: Women’s Electoral Success and Future Political Participation”, The Economic Journal Bhalotra, S., A. Chakravarty and S. Gulesci (2016) “The Price of Gold: Dowry and Death in India”, IZA Discussion Paper No. 9679, January Bhalotra S. and A. van Soest (2008), “Birth-Spacing, Fertility and Neonatal Mortality in India: Dynamics, Frailty, and Fecundity”, Journal of Econometrics, Vol. 143, No. 2: 274-290
Bobonis, Gustavo J. (2009) “Is the Allocation of Resources within the Household Efficient? New Evidence from a Randomized Experiment,” Journal of Political Economy, 117(3), 453-503 �
Botticini, M. and A. Siow (2003) “Why dowries?” The American Economic Review, 93(4):1385–1398
Brulé, R. (2017) “Reform, Representation and Resistance: The Politics of Property Rights’ Enforcement,” Working Paper. NYU Abu Dhabi. Available at: https://rachelbrule.files.wordpress.com/2017/10/20170613_rrr_short_notitle.pdf Calvi, R., A. Lewbel and D. Tommasi (2017) “Women's Empowerment and Family Health: Estimating LATE with Mismeasured Treatment”, available at SSRN: https://ssrn.com/abstract=2980250 or http://dx.doi.org/10.2139/ssrn.2980250 Chen, M. and J. Dreze (1992) “Widows and Health in Rural North India”, Economic and Political Weekly Vol. 27, No. 43/44 (Oct. 24-31), pp. WS81-WS92 Chung, W. and M. Das Gupta (2007) “Why is Son Preference Declining in South Korea ? The Role of Development and Public policy, and the Implications for China and India,” Policy Research Working Paper Series No. 4373, World Bank
Clots-Figueras, Irma (2011) “Women in Politics: Evidence from the Indian States”, Journal of Public Economics, 95(2011), pp 664-690`
Dahl, G. B. and E. Moretti (2008) “The Demand for Sons,” Review of Economic Studies, 75 (4), pp. 1085–1120
Deininger, K. A. Goyal and H. Nagarajan (2013) “Women’s Inheritance Rights and Intergenerational Transmission of Resources in India”, Journal of Human Resources, 48(1) Doepke, M. and M. Tertilt (2009) “Women's Liberation: What’s in It for Men?”, Quarterly Journal of Economics, Volume 124, Issue 4, pp. 1541–1591
30
Doepke, M., M. Tertilt and A. Voena (2012) “The Economics and Politics of Women’s Rights”, Annual Review of Economics, 4: 339-72 Duflo, E. (2012) “Women’s empowerment and economic development”, Journal of Economic Literature, 50(4), 1051–1079 Duflo Esther and Christopher Udry, (2004) “Intrahousehold Resource Allocation in Cote d’Ivoire: Social Norms, Separate Accounts and Consumption Choices,” NBER Working Papers 10498 �
Field, E. (2007) “Entitled to Work: Urban Property Rights and Labor Supply in Peru,” Quarterly Journal of Economics, 122(4), pp. 1561–1602
Field, E., R. Pande, N. Rigol, S. Schaner and C. T. Moore (2016) “On Her Account: Can Strengthening Women’s Financial Control Boost Female Labor Supply?”, mimeo
George, S. M. (2006) “Sex Ratio in India. Response to Jha et al.” The Lancet, 27 May, Vol. 367, No. 9524: 1725.
Ghatak, M. and S. Roy (2007) “Land Reform and Agricultural Productivity in India: A Review of the Evidence,” Oxford Review of Economic Policy, Vol. 23(2), pp. 251-269
Goldstein, M. and C. Udry (2008) “The Profits of Power: Land Rights and Agricultural Investment in Ghana”, Journal of Political Economy, Vol. 116, No. 6, pp. 981-1022
Goody, J. (1973) “Bridewealth and Dowry in Africa and Eurasia” in Bridewealth and Dowry (eds. J. Goody and S. J. Tambiah), pp. 1-58. Cambridge: Cambridge University Press
Government of India (2011) Census of India, 2011, Ministry of Home Affairs, New Delhi
Grover, A. and R. Vijayvergiya (2006) “Sex Ratio in India: Response to Prabhat Jha, Rajesh Kumar and Neeraj Dhingira”, The Lancet, 27 May-2 Vol. 367, No. 9524: 1726.
Guner, N (1998) “An Economic Analysis of Family Structure: Inheritance Rules and Marriage Systems”, Working paper, University of Rochester
Harriss, J. (1996) “Review of Bina Agarwal” The Economic Journal, Vol. 106, No. 436, pp. 708-709, May. Hindustan Times (2016) “Eldest Woman Member Can Be Karta of Hindu Joint Family, Rules Delhi HC,” 1 February, 2016, Hindustan Times, accessed online as of 8 February, 2017 at: http://www.hindustantimes.com/india/eldest-woman-member-can-be-karta-of-hindu-joint-family-rules-delhi-hc/story-n2g4AFxoSGhMOJB4S2axoO.html Htun, M. and L. Weldon (2011) “Sex Equality in Family Law: Historical Legacies, Feminist Activism and Religious Power in 70 Countries”, Background Paper for the World Development Report 2012 Jayachandran, S. (2015) “The Roots of Gender Inequality in Developing Countries”, Annual Review of Economics, Vol 7, pp. 63-88.
31
Jayachandran, S. and I. Kuziemko (2011) “Why Do Mothers Breastfeed Girls Less Than Boys: Evidence and Implications for Child Health in India”, Quarterly Journal of Economics, Vol. 126 (3), pp. 1485-1538 Jayaraman, R., D. Ray and S. Wang (2013) “Gender Differentials in the Seeking of Eye Care”, International Growth Centre Working Paper , April 2013 Joulfaian, D. (2006) “Inheritance and Saving”, NBER Working Paper No.12569, October
Landesa (2013) “Report on the Formal and Informal Barriers in the Implementation of the Hindu Succession (Amendment) Act 2005,” UN Women, accessed online as of 13 December, 2017 at: http://www.landesa.org/wp-content/uploads/hsaa-study-report.pdf
Lundberg, S. J., R. A. Pollak and T. J. Wales (1997) “Do Husbands and Wives Pool Their Resources? Evidence from the United Kingdom Child Benefit,” Journal of Human Resources, 32(3), pp. 463-480. �
Mahal, A., A. Varshney and S. Taman (2006) “Diffusion of Diagnostic Medical Devices and Policy Implications for India”, International Journal of Technology Assessment in Health Care, Vol. 22, No. 02: 184-190.
Mercier, Carrie (1989) Hinduism for Today. Oxford: Oxford University Press.
Miller, B. (1981) The Endangered Sex: Neglect of Female Children in Rural North India, Cornell University Press, Ithaca
Milazzo, A. (2014) “Why are Adult Women Missing? Son Preference and Maternal Survival in India,” World Bank Working Paper, March, pp. 1–53.
Murthy, L., V. Bal and D. Sharma (2006) “The Business of Sex Selection: The Ultrasonography Boom”, Presented at the Nehru Memorial Museum & Library Workshop on Declining Child Sex Ratio, January 23-24, New Delhi.
Oster, E. (2009), “Proximate Sources of Population Sex Imbalance in India”, Demography May 2009, Vol. 46, No. 325-339
Poleman, Horace I. (1934) “The Ritualistic Continuity of Rgveda X. 14-18,” Journal of the American Oriental Society, Vol. 54(3): 276-81. Rosenblum, D. (2015) "Unintended Consequences of Women's Inheritance Rights on Female Mortality in India" (2015) Economic Development and Cultural Change, 63(2), pp. 223-248 Rosenzweig, M. R. and K. I. Wolpin (1985) “Specific Experience, Household Structure, and Intergenerational Transfers: Farm Family Land and Labor Arrangements in Developing Countries”, The Quarterly Journal of Economics, Vol. 100, Supplement (1985), pp. 961-987
Roy, S. (2015) “Empowering Women? Inheritance Rights, Female Education and Dowry Payments in India”, Journal of Development Economics, Vol. 114, pp. 233-251, May
32
Sen, A. (1990) “More than 100 Million Women are Missing”, The New York Review of Books, December 20 Sekher, T. (2012) “Ladlis and Lakshmis: Financial Incentive Schemes for the Girl Child,” Economic and Political Weekly, XLVII Sudha, S. and S. I. Rajan (1999) “Female Demographic Disadvantage in India 1981-1991: Sex Selective Abortions and Female Infanticide,” Development and Change, 30 (3), pp. 585–618
Thomas, D. (1990) “Intra-Household Resource Allocation: An Inferential Approach,” The Journal of Human Resources, 25(4), pp. 635-664 Thomas, D. (1994) “Like Father, like Son; Like Mother, like Daughter: Parental Resources and Child Height,” The Journal of Human Resources, 29 (4), 950 Topalova, P. (2010) “Factor Immobility and Regional Impacts of Trade Liberalization: Evidence on Poverty from India”, American Economic Journal: Applied Economics, Vol. 2 (4), pp. 1–41 World Bank (2012) World Development Report 2012: Gender Equality and Development

Figure1:TheFiveReformingStates(ingreen)andrestofIndia(inblue)
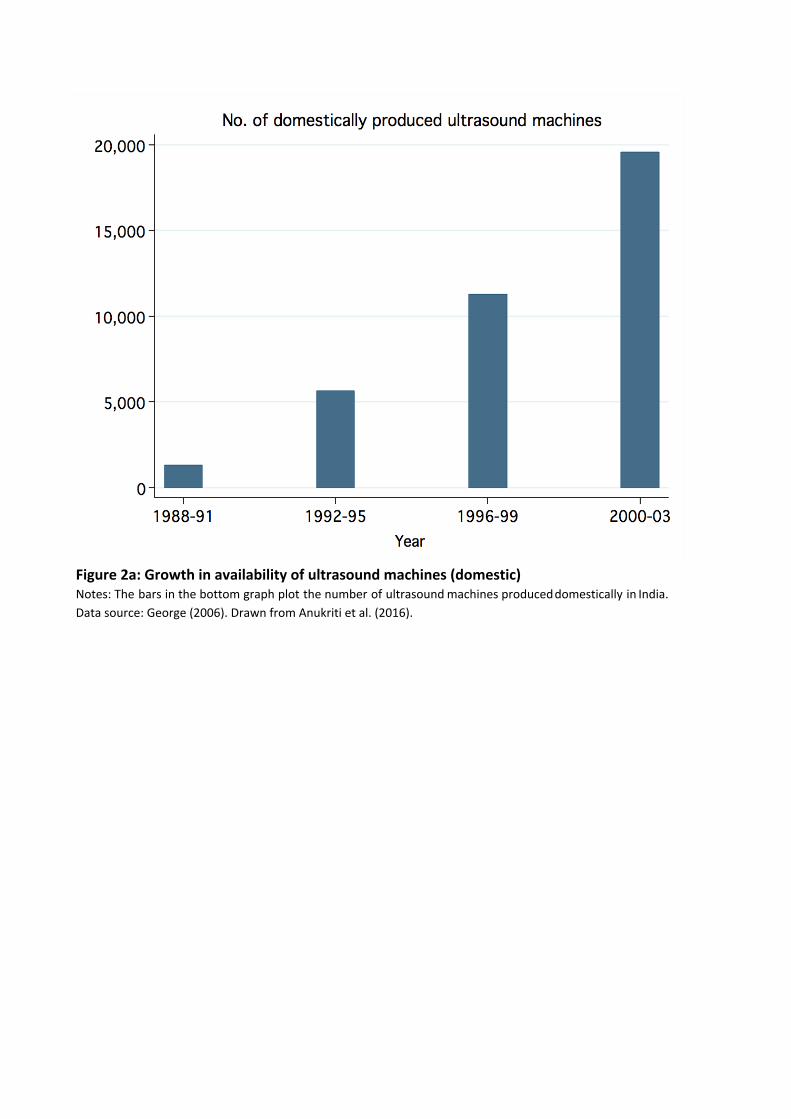
Figure2a:Growthinavailabilityofultrasoundmachines(domestic)Notes: The bars in the bottom graph plot the number of ultrasoundmachines produceddomestically in India.Datasource:George(2006).DrawnfromAnukritietal.(2016).
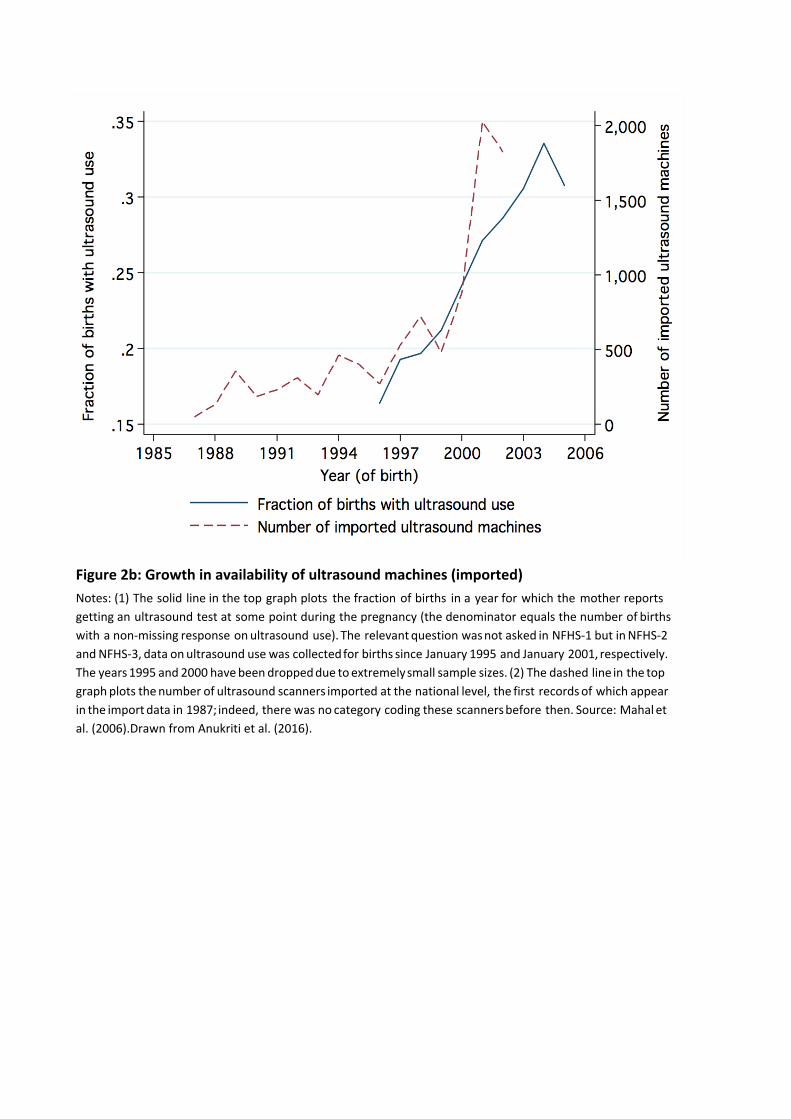
Figure2b:Growthinavailabilityofultrasoundmachines(imported)Notes: (1) The solid line in the top graph plots the fraction of births in a year for which the mother reportsgetting an ultrasound test at some point during the pregnancy (the denominator equals the number of birthswith a non-missing response onultrasound use). The relevantquestion wasnot asked in NFHS-1 but inNFHS-2andNFHS-3, data onultrasound use was collectedfor births since January 1995 and January 2001, respectively.The years1995 and 2000 havebeendroppeddue toextremelysmall sample sizes. (2) The dashed line in the topgraphplots thenumber of ultrasound scanners imported at the national level, the first recordsof which appearin the importdata in 1987; indeed, there was no category coding these scannersbefore then. Source: Mahal etal.(2006).DrawnfromAnukritietal.(2016).
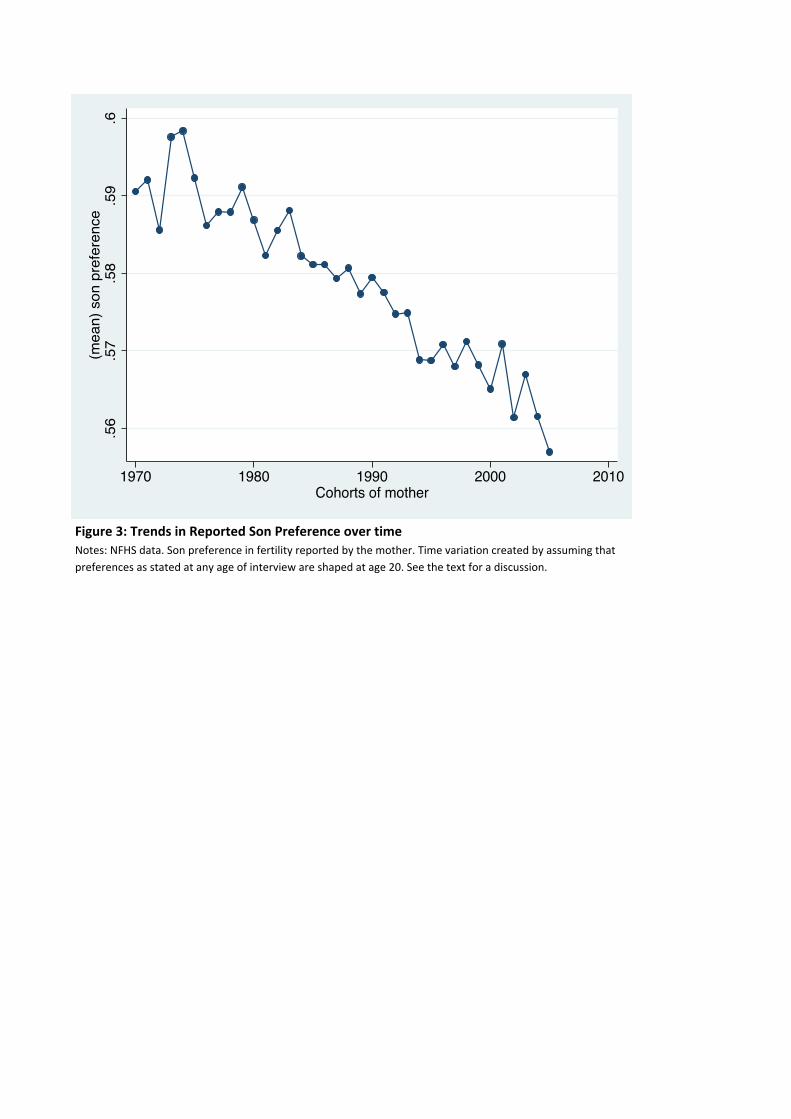
Figure3:TrendsinReportedSonPreferenceovertimeNotes:NFHSdata.Sonpreferenceinfertilityreportedbythemother.Timevariationcreatedbyassumingthatpreferencesasstatedatanyageofinterviewareshapedatage20.Seethetextforadiscussion.
.56
.57
.58
.59
.6(m
ean)
son
pre
fere
nce
1970 1980 1990 2000 2010Cohorts of mother
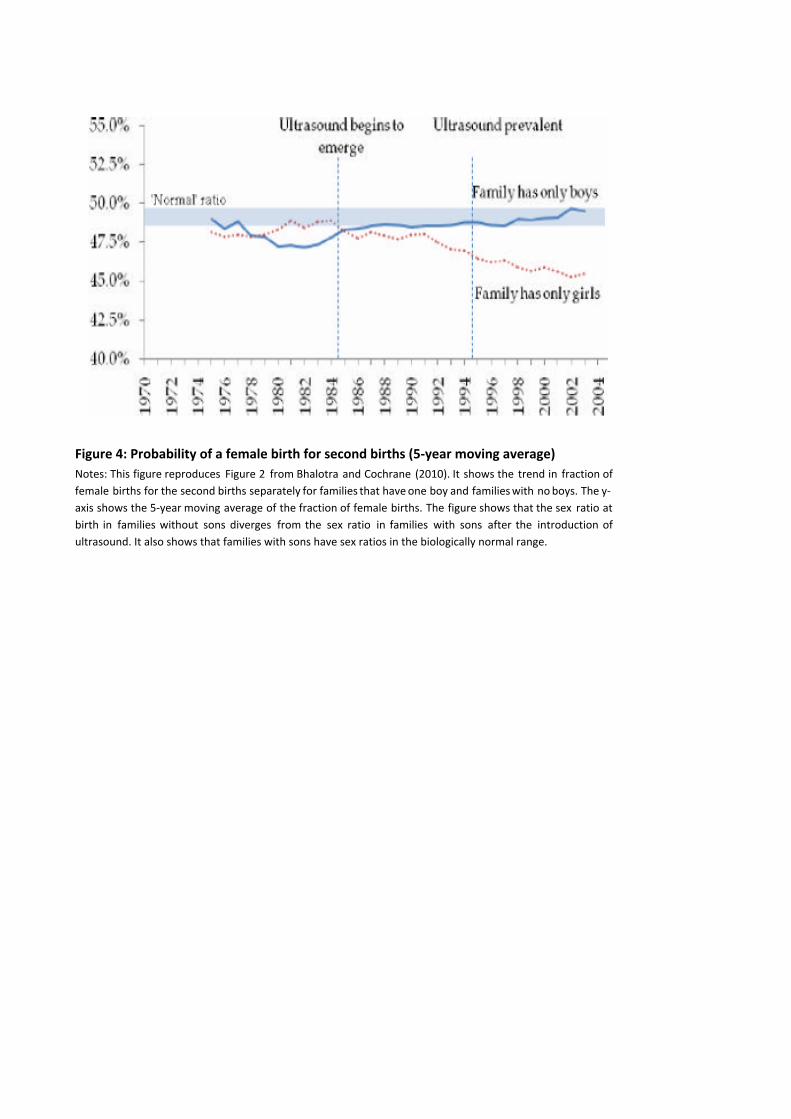
Figure4:Probabilityofafemalebirthforsecondbirths(5-yearmovingaverage)Notes: This figure reproduces Figure 2 from Bhalotra and Cochrane (2010). It shows the trend in fraction offemale births for the second births separately for families that haveone boy and familieswith noboys. The y-axis shows the 5-year moving average of the fraction of female births. The figure shows that the sex ratio atbirth in families without sons diverges from the sex ratio in families with sons after the introduction ofultrasound.Italsoshowsthatfamilieswithsonshavesexratiosinthebiologicallynormalrange.
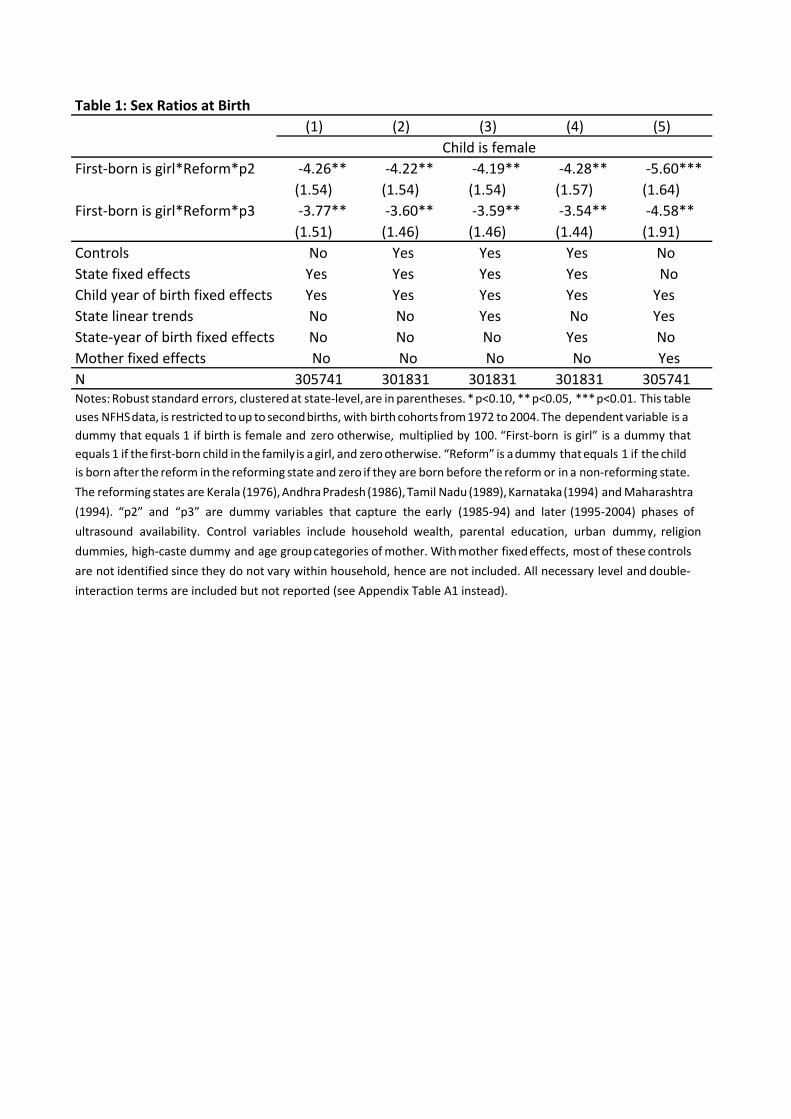
Table1:SexRatiosatBirth (1) (2) (3) (4) (5)First-bornisgirl*Reform*p2 -4.26** -4.22** -4.19** -4.28** -5.60*** (1.54) (1.54) (1.54) (1.57) (1.64)First-bornisgirl*Reform*p3 -3.77** -3.60** -3.59** -3.54** -4.58** (1.51) (1.46) (1.46) (1.44) (1.91)Controls No Yes Yes Yes NoStatefixedeffects Yes Yes Yes Yes NoChildyearofbirthfixedeffects Yes Yes Yes Yes YesStatelineartrends No No Yes No YesState-yearofbirthfixedeffects No No No Yes NoMotherfixedeffects No No No No YesN 305741 301831 301831 301831 305741
Childisfemale
Notes: Robust standard errors, clusteredat state-level,are in parentheses. *p<0.10, **p<0.05, ***p<0.01. This tableuses NFHSdata, is restricted toup to secondbirths, with birth cohorts from1972 to2004.The dependent variable is adummy that equals 1 if birth is female and zero otherwise, multiplied by 100. “First-born is girl” is a dummy thatequals 1 if the first-born child in the family is agirl, and zerootherwise. “Reform” is adummy thatequals 1 if the childis born after the reform in the reforming state and zero if they are born before the reform or in a non-reforming state.The reforming states are Kerala (1976),AndhraPradesh(1986),Tamil Nadu (1989),Karnataka(1994) andMaharashtra(1994). “p2” and “p3” are dummy variables that capture the early (1985-94) and later (1995-2004) phases ofultrasound availability. Control variables include household wealth, parental education, urban dummy, religiondummies, high-caste dummy and age groupcategories ofmother. Withmother fixedeffects, most of these controlsare not identified since they do not vary within household, hence are not included. All necessary level and double-interactiontermsareincludedbutnotreported(seeAppendixTableA1instead).
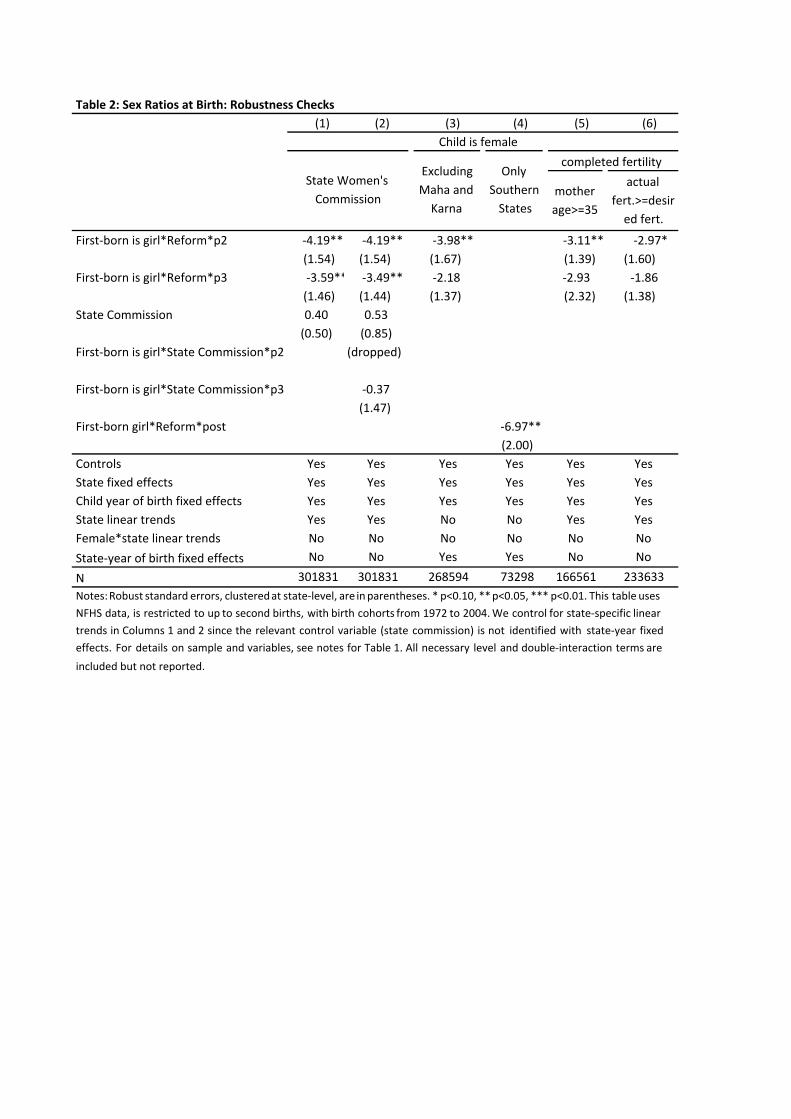
Table2:SexRatiosatBirth:RobustnessChecks (1) (2) (3) (4) (5) (6)
motherage>=35
actualfert.>=desiredfert.
First-bornisgirl*Reform*p2 -4.19**-4.19** -3.98** -3.11** -2.97* (1.54) (1.54) (1.67) (1.39) (1.60)First-bornisgirl*Reform*p3 -3.59**-3.49** -2.18 -2.93 -1.86 (1.46) (1.44) (1.37) (2.32) (1.38)StateCommission 0.40 0.53
(0.50) (0.85)First-bornisgirl*StateCommission*p2 (dropped) First-bornisgirl*StateCommission*p3 -0.37 (1.47) First-borngirl*Reform*post -6.97** (2.00)Controls Yes Yes Yes Yes Yes YesStatefixedeffects Yes Yes Yes Yes Yes YesChildyearofbirthfixedeffects Yes Yes Yes Yes Yes YesStatelineartrends Yes Yes No No Yes YesFemale*statelineartrends No No No No No NoState-yearofbirthfixedeffects No No Yes Yes No No
N 301831301831 268594 73298 166561 233633
completedfertilityChildisfemale
StateWomen'sCommission
ExcludingMahaandKarna
OnlySouthernStates
Notes:Robust standard errors, clusteredat state-level, are inparentheses. * p<0.10, **p<0.05, *** p<0.01. This table usesNFHS data, is restricted to up to second births, with birth cohorts from 1972 to 2004.We control for state-specific lineartrends in Columns 1 and 2 since the relevant control variable (state commission) is not identified with state-year fixedeffects. For details on sample and variables, see notes for Table 1. All necessary level and double-interaction terms areincludedbutnotreported.
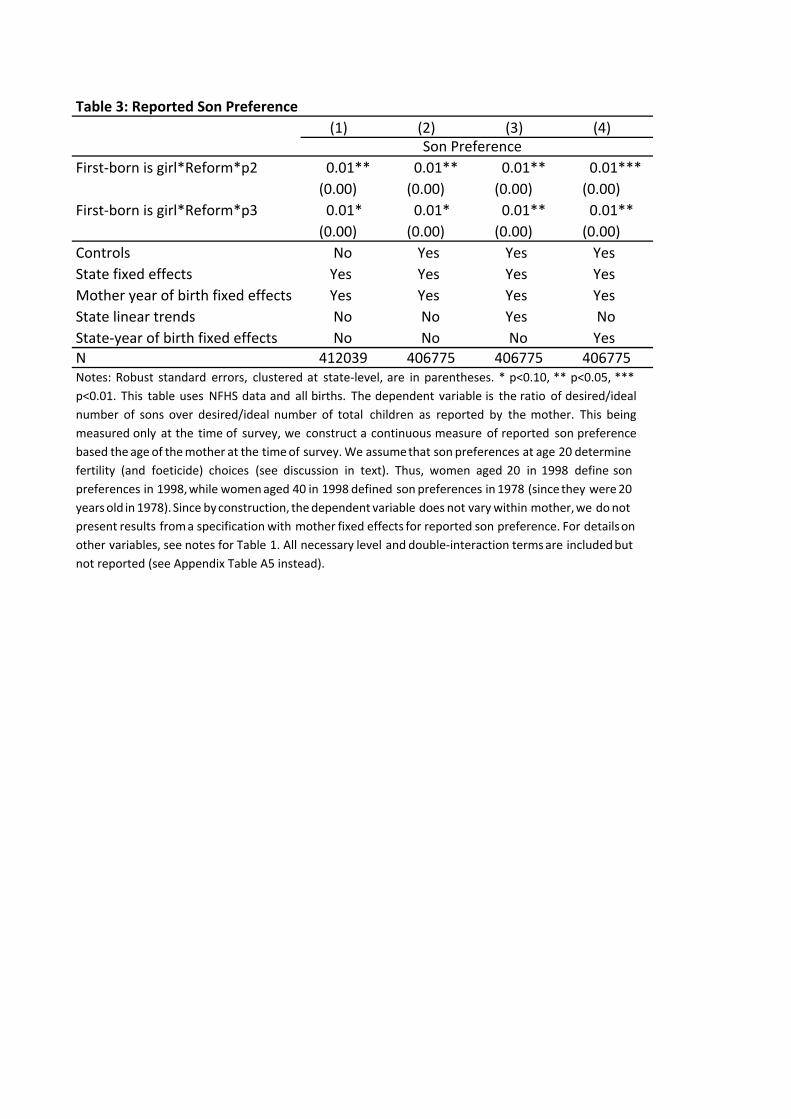
Table3:ReportedSonPreference (1) (2) (3) (4)First-bornisgirl*Reform*p2 0.01** 0.01** 0.01** 0.01*** (0.00) (0.00) (0.00) (0.00)First-bornisgirl*Reform*p3 0.01* 0.01* 0.01** 0.01** (0.00) (0.00) (0.00) (0.00)Controls No Yes Yes YesStatefixedeffects Yes Yes Yes YesMotheryearofbirthfixedeffects Yes Yes Yes YesStatelineartrends No No Yes NoState-yearofbirthfixedeffects No No No YesN 412039 406775 406775 406775
SonPreference
Notes: Robust standard errors, clustered at state-level, are in parentheses. * p<0.10, ** p<0.05, ***p<0.01. This table uses NFHS data and all births. The dependent variable is the ratio of desired/idealnumber of sons over desired/ideal number of total children as reported by the mother. This beingmeasured only at the time of survey, we construct a continuous measure of reported son preferencebased theage of themother at the timeof survey.We assumethat son preferences at age 20 determinefertility (and foeticide) choices (see discussion in text). Thus, women aged 20 in 1998 define sonpreferences in 1998,while womenaged 40 in 1998 defined son preferences in 1978 (since they were20yearsold in 1978). Since byconstruction, thedependent variable does not varywithin mother,we donotpresent results froma specification with mother fixed effects for reported son preference. For detailsonother variables, see notes for Table 1. All necessary level and double-interaction termsare includedbutnotreported(seeAppendixTableA5instead).
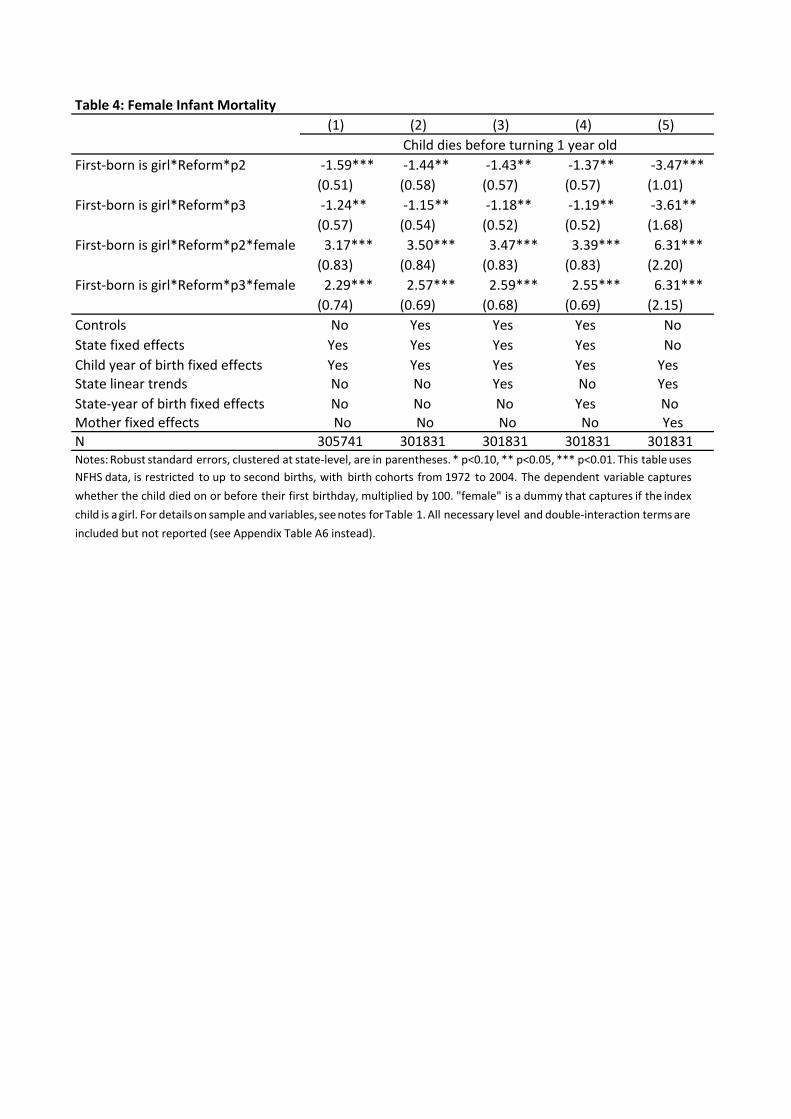
Table4:FemaleInfantMortality (1) (2) (3) (4) (5)First-bornisgirl*Reform*p2 -1.59*** -1.44** -1.43** -1.37** -3.47*** (0.51) (0.58) (0.57) (0.57) (1.01)First-bornisgirl*Reform*p3 -1.24** -1.15** -1.18** -1.19** -3.61** (0.57) (0.54) (0.52) (0.52) (1.68)First-bornisgirl*Reform*p2*female 3.17*** 3.50*** 3.47*** 3.39*** 6.31*** (0.83) (0.84) (0.83) (0.83) (2.20)First-bornisgirl*Reform*p3*female 2.29*** 2.57*** 2.59*** 2.55*** 6.31*** (0.74) (0.69) (0.68) (0.69) (2.15)Controls No Yes Yes Yes NoStatefixedeffects Yes Yes Yes Yes NoChildyearofbirthfixedeffects Yes Yes Yes Yes YesStatelineartrends No No Yes No YesState-yearofbirthfixedeffects No No No Yes NoMotherfixedeffects No No No No YesN 305741 301831 301831 301831 301831
Childdiesbeforeturning1yearold
Notes: Robust standard errors, clustered at state-level, are in parentheses. * p<0.10, ** p<0.05, *** p<0.01. This tableusesNFHS data, is restricted to up to second births, with birth cohorts from 1972 to 2004. The dependent variable captureswhether the child died on or before their first birthday, multiplied by 100. "female" is a dummy that captures if the indexchild is agirl. For detailson sample and variables, seenotes forTable 1. All necessary level and double-interaction termsareincludedbutnotreported(seeAppendixTableA6instead).

Table5:Fertility (1) (2) (3) (4) (5)First-bornisgirl*Reform*p2 3.30 2.52 2.59 2.45 3.28 (3.90) (3.79) (3.78) (3.84) (4.68)First-bornisgirl*Reform*p3 8.56*** 8.10*** 8.19*** 7.90*** 12.33*** (1.96) (2.00) (1.98) (2.07) (2.94)Controls No Yes Yes Yes NoStatefixedeffects Yes Yes Yes Yes NoChildyearofbirthfixedeffects Yes Yes Yes Yes YesStatelineartrends No No Yes No YesState-yearofbirthfixedeffects No No No Yes NoMotherfixedeffects No No No No YesN 305741 301831 301831 301831 305741
Hasyoungersibling
Notes: Robust standard errors, clusteredat state-level,are in parentheses. *p<0.10, **p<0.05, ***p<0.01. This tableuses NFHS data, is restricted to up to second births, with birth cohorts from 1972 to 2004. The dependent variablecaptures whether the child has younger brothers or sisters, mulitplied by 100. For detailson sample and variables, seenotes for Table 1. All necessary level and double-interactionterms are included butnot reported (see Appendix TableA7instead).
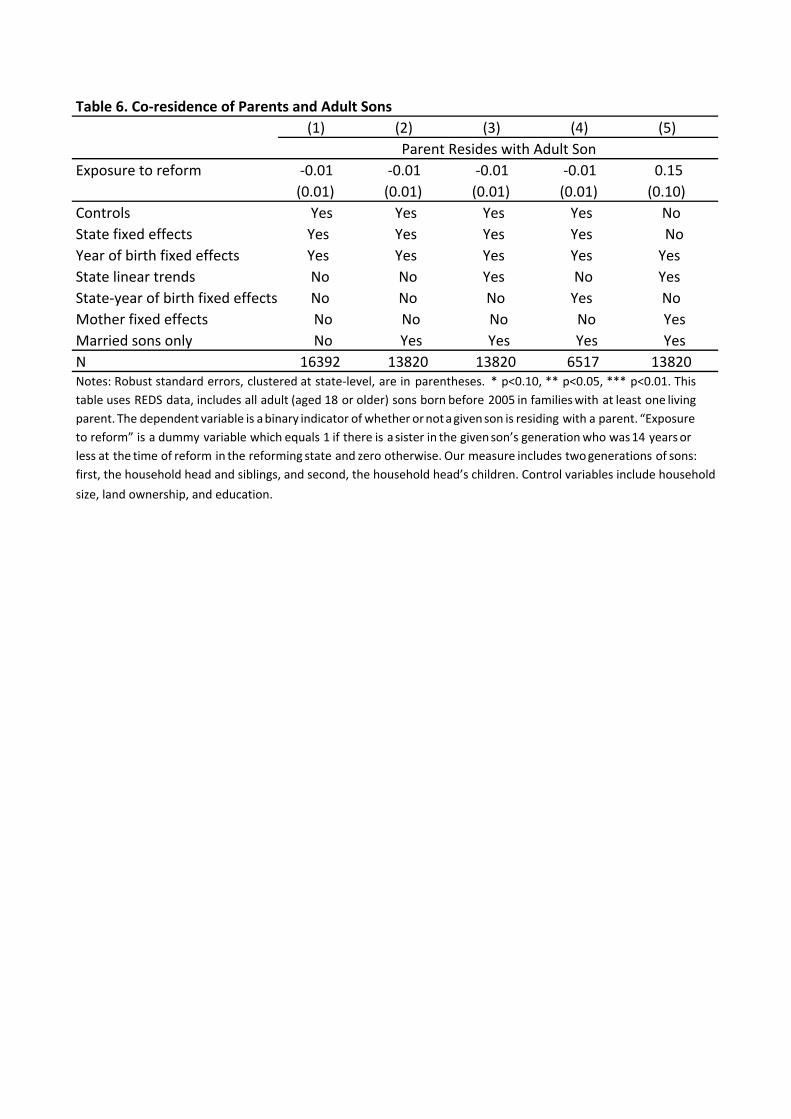
(1) (2) (3) (4) (5)Exposuretoreform -0.01 -0.01 -0.01 -0.01 0.15
(0.01) (0.01) (0.01) (0.01) (0.10)Controls Yes Yes Yes Yes NoStatefixedeffects Yes Yes Yes Yes NoYearofbirthfixedeffects Yes Yes Yes Yes YesStatelineartrends No No Yes No YesState-yearofbirthfixedeffectsNo No No Yes NoMotherfixedeffects No No No No YesMarriedsonsonly No Yes Yes Yes YesN 16392 13820 13820 6517 13820
Table6.Co-residenceofParentsandAdultSons
ParentResideswithAdultSon
Notes: Robust standard errors, clustered at state-level, are in parentheses. * p<0.10, ** p<0.05, *** p<0.01. Thistable uses REDS data, includes all adult (aged 18 or older) sons born before 2005 in familieswith at least one livingparent. The dependent variable is abinary indicator of whether ornotagivenson is residing with a parent. “Exposureto reform” is a dummy variable which equals 1 if there is asister in the givenson’s generationwho was14 yearsorless at the time of reform in the reforming state and zero otherwise. Our measure includes twogenerations of sons:first,thehouseholdheadandsiblings,andsecond,thehouseholdhead’schildren.Controlvariablesincludehouseholdsize,landownership,andeducation.
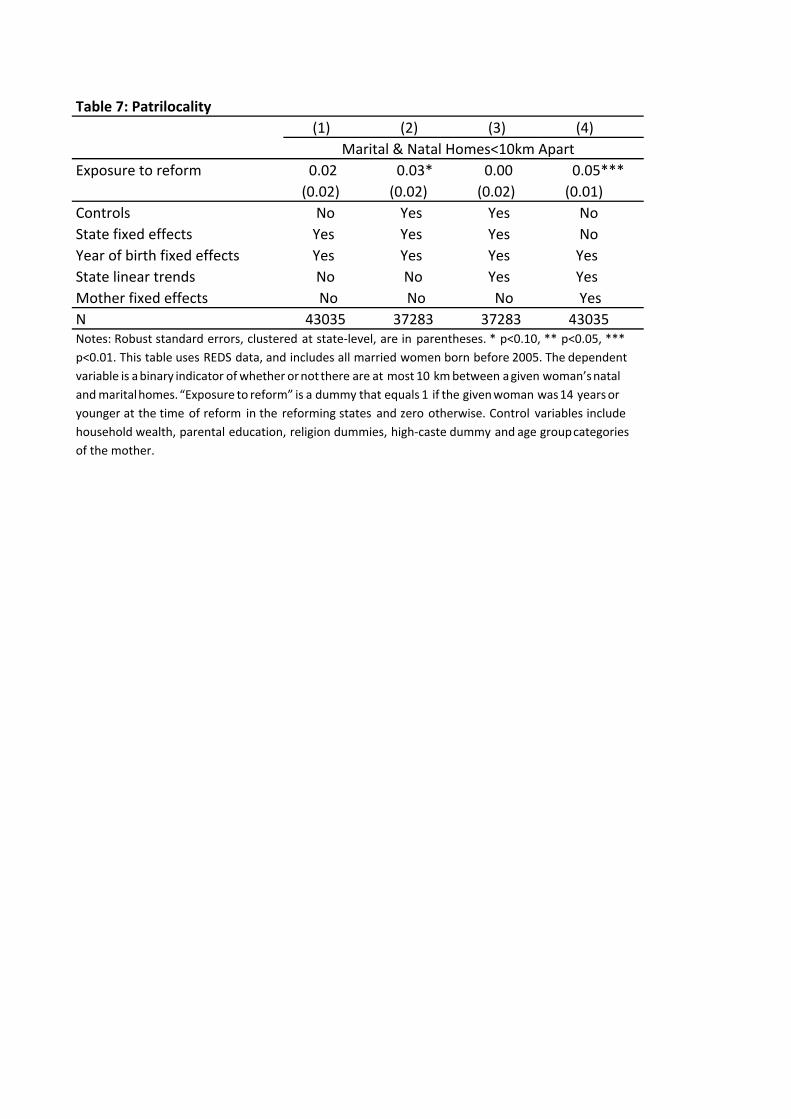
(1) (2) (3) (4)Exposuretoreform 0.02 0.03* 0.00 0.05*** (0.02) (0.02) (0.02) (0.01)Controls No Yes Yes NoStatefixedeffects Yes Yes Yes NoYearofbirthfixedeffects Yes Yes Yes YesStatelineartrends No No Yes YesMotherfixedeffects No No No YesN 43035 37283 37283 43035
Marital&NatalHomes<10kmApart
Table7:Patrilocality
Notes: Robust standard errors, clustered at state-level, are in parentheses. * p<0.10, ** p<0.05, ***p<0.01. This table uses REDS data, and includes all married women born before 2005. The dependentvariable is abinary indicator of whether ornotthere are at most 10 kmbetween agiven woman’snatalandmaritalhomes.“Exposure to reform” is a dummy that equals 1 if the givenwoman was14 yearsoryounger at the time of reform in the reforming states and zero otherwise. Control variables includehousehold wealth, parental education, religion dummies, high-caste dummy and age groupcategoriesofthemother.
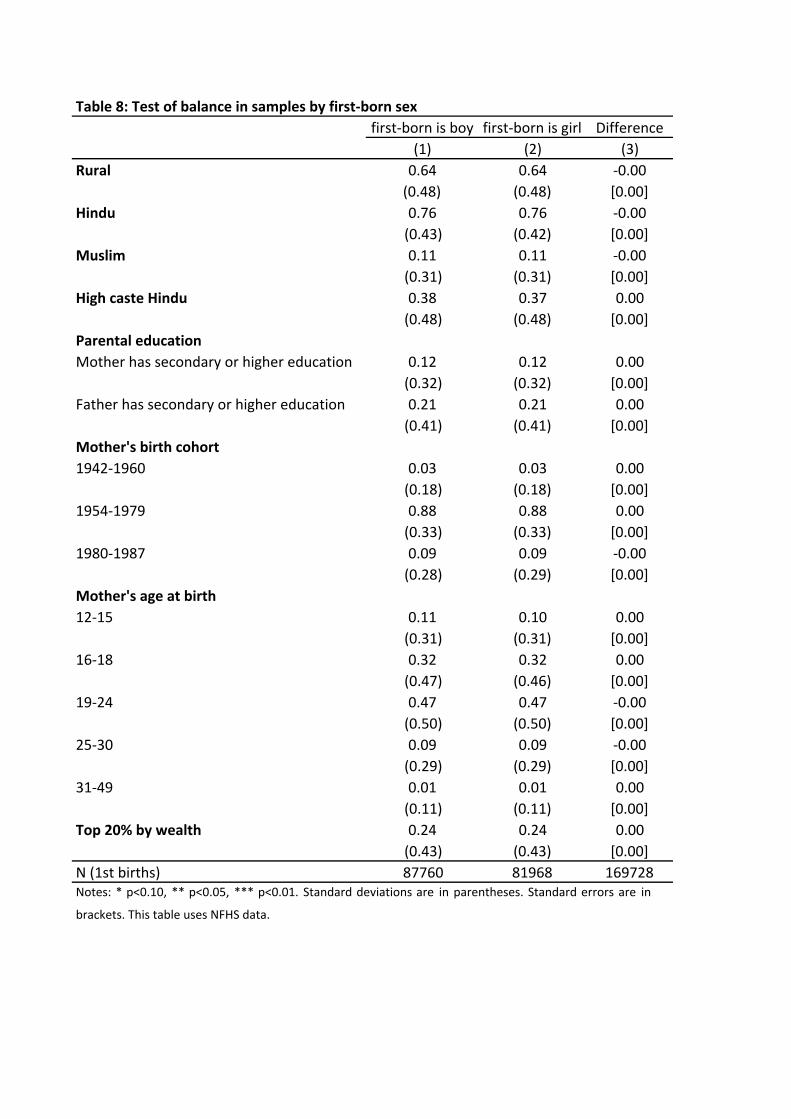
Table8:Testofbalanceinsamplesbyfirst-bornsexfirst-bornisboy first-bornisgirl Difference
(1) (2) (3)Rural 0.64 0.64 -0.00
(0.48) (0.48) [0.00]Hindu 0.76 0.76 -0.00
(0.43) (0.42) [0.00]Muslim 0.11 0.11 -0.00
(0.31) (0.31) [0.00]HighcasteHindu 0.38 0.37 0.00
(0.48) (0.48) [0.00]ParentaleducationMotherhassecondaryorhighereducation 0.12 0.12 0.00
(0.32) (0.32) [0.00]Fatherhassecondaryorhighereducation 0.21 0.21 0.00
(0.41) (0.41) [0.00]Mother'sbirthcohort1942-1960 0.03 0.03 0.00
(0.18) (0.18) [0.00]1954-1979 0.88 0.88 0.00
(0.33) (0.33) [0.00]1980-1987 0.09 0.09 -0.00
(0.28) (0.29) [0.00]Mother'sageatbirth12-15 0.11 0.10 0.00
(0.31) (0.31) [0.00]16-18 0.32 0.32 0.00
(0.47) (0.46) [0.00]19-24 0.47 0.47 -0.00
(0.50) (0.50) [0.00]25-30 0.09 0.09 -0.00
(0.29) (0.29) [0.00]31-49 0.01 0.01 0.00
(0.11) (0.11) [0.00]Top20%bywealth 0.24 0.24 0.00
(0.43) (0.43) [0.00]N(1stbirths) 87760 81968 169728Notes: * p<0.10, ** p<0.05, *** p<0.01. Standard deviations are in parentheses. Standard errors are in
brackets.ThistableusesNFHSdata.

OnlineAppendix
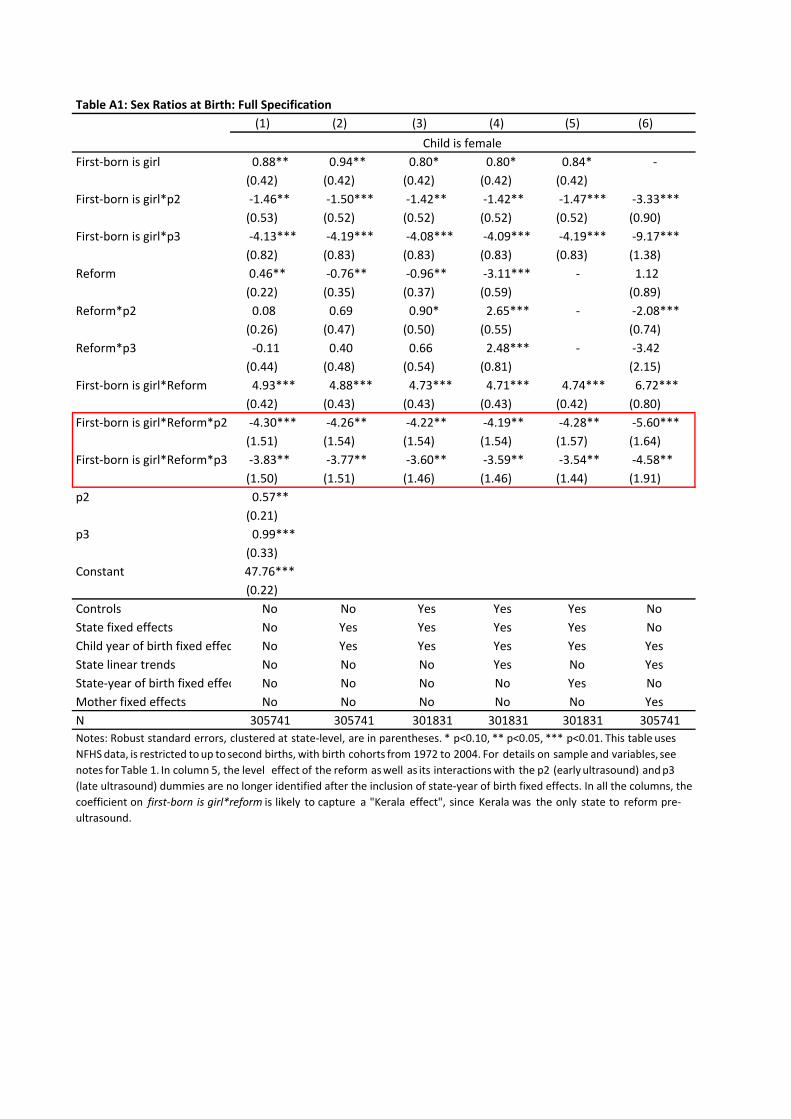
TableA1:SexRatiosatBirth:FullSpecification (1) (2) (3) (4) (5) (6)First-bornisgirl 0.88** 0.94** 0.80* 0.80* 0.84* - (0.42) (0.42) (0.42) (0.42) (0.42)First-bornisgirl*p2 -1.46** -1.50*** -1.42** -1.42** -1.47*** -3.33*** (0.53) (0.52) (0.52) (0.52) (0.52) (0.90)First-bornisgirl*p3 -4.13*** -4.19*** -4.08*** -4.09*** -4.19*** -9.17*** (0.82) (0.83) (0.83) (0.83) (0.83) (1.38)Reform 0.46** -0.76** -0.96** -3.11*** - 1.12 (0.22) (0.35) (0.37) (0.59) (0.89)Reform*p2 0.08 0.69 0.90* 2.65*** - -2.08*** (0.26) (0.47) (0.50) (0.55) (0.74)Reform*p3 -0.11 0.40 0.66 2.48*** - -3.42 (0.44) (0.48) (0.54) (0.81) (2.15)First-bornisgirl*Reform 4.93*** 4.88*** 4.73*** 4.71*** 4.74*** 6.72*** (0.42) (0.43) (0.43) (0.43) (0.42) (0.80)First-bornisgirl*Reform*p2 -4.30*** -4.26** -4.22** -4.19** -4.28** -5.60*** (1.51) (1.54) (1.54) (1.54) (1.57) (1.64)First-bornisgirl*Reform*p3 -3.83** -3.77** -3.60** -3.59** -3.54** -4.58**
(1.50) (1.51) (1.46) (1.46) (1.44) (1.91)p2 0.57**
(0.21)p3 0.99***
(0.33)Constant 47.76***
(0.22)Controls No No Yes Yes Yes NoStatefixedeffects No Yes Yes Yes Yes NoChildyearofbirthfixedeffects No Yes Yes Yes Yes YesStatelineartrends No No No Yes No YesState-yearofbirthfixedeffects No No No No Yes NoMotherfixedeffects No No No No No YesN 305741 305741 301831 301831 301831 305741
Childisfemale
Notes: Robust standard errors, clustered at state-level, are in parentheses. * p<0.10, ** p<0.05, *** p<0.01. This table usesNFHSdata, is restricted toup to second births, with birth cohorts from 1972 to 2004. For details on sample and variables, seenotes for Table 1. In column 5, the level effect of the reform aswell as its interactionswith the p2 (earlyultrasound) andp3(lateultrasound)dummiesarenolongeridentifiedaftertheinclusionofstate-yearofbirthfixedeffects.Inallthecolumns,thecoefficient on first-born is girl*reform is likely to capture a "Kerala effect", since Kerala was the only state to reform pre-ultrasound.
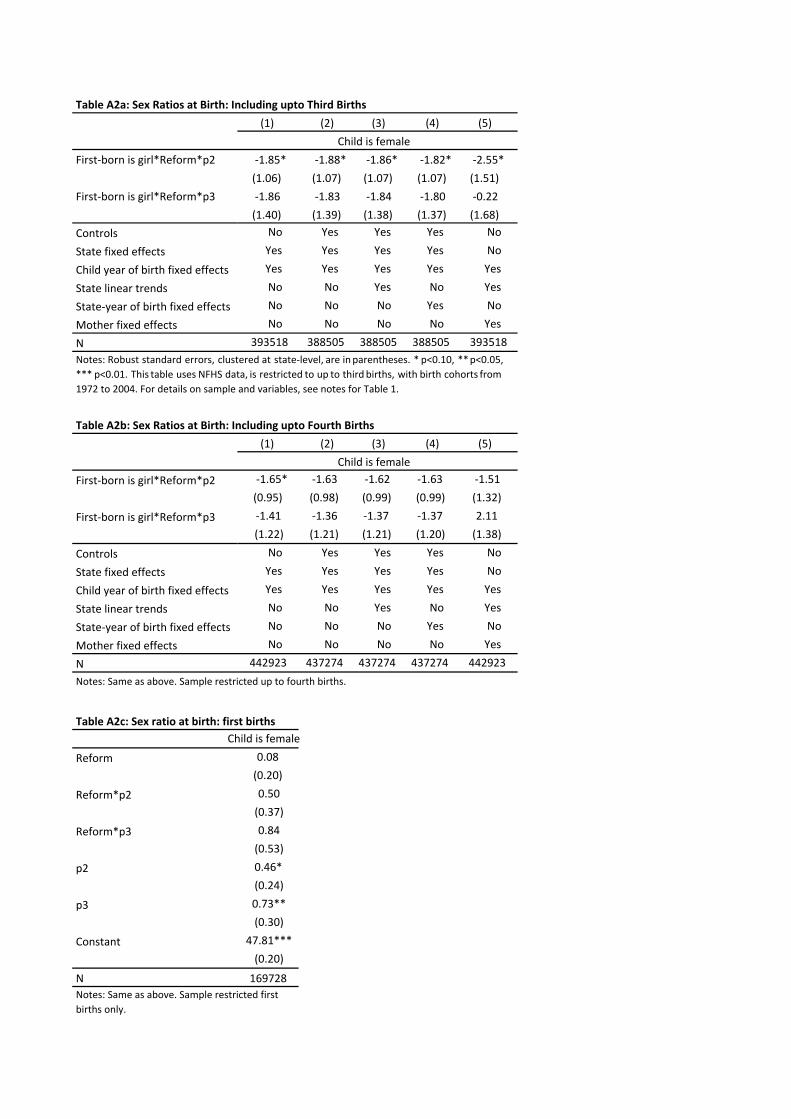
TableA2a:SexRatiosatBirth:IncludinguptoThirdBirths (1) (2) (3) (4) (5)First-bornisgirl*Reform*p2 -1.85* -1.88*-1.86* -1.82*-2.55* (1.06) (1.07) (1.07) (1.07) (1.51)First-bornisgirl*Reform*p3 -1.86 -1.83 -1.84 -1.80 -0.22 (1.40) (1.39) (1.38) (1.37) (1.68)Controls No Yes Yes Yes No
Statefixedeffects Yes Yes Yes Yes No
Childyearofbirthfixedeffects Yes Yes Yes Yes Yes
Statelineartrends No No Yes No Yes
State-yearofbirthfixedeffects No No No Yes No
Motherfixedeffects No No No No Yes
N 393518388505388505388505 393518
TableA2b:SexRatiosatBirth:IncludinguptoFourthBirths (1) (2) (3) (4) (5)First-bornisgirl*Reform*p2 -1.65* -1.63 -1.62 -1.63 -1.51
(0.95) (0.98) (0.99) (0.99) (1.32)
First-bornisgirl*Reform*p3 -1.41 -1.36 -1.37 -1.37 2.11
(1.22) (1.21) (1.21) (1.20) (1.38)
Controls No Yes Yes Yes No
Statefixedeffects Yes Yes Yes Yes No
Childyearofbirthfixedeffects Yes Yes Yes Yes Yes
Statelineartrends No No Yes No Yes
State-yearofbirthfixedeffects No No No Yes No
Motherfixedeffects No No No No Yes
N 442923 437274 437274 437274 442923
TableA2c:Sexratioatbirth:firstbirthsChildisfemale
Reform 0.08(0.20)
Reform*p2 0.50(0.37)
Reform*p3 0.84(0.53)
p2 0.46*(0.24)
p3 0.73**(0.30)
Constant 47.81***(0.20)
N 169728
Childisfemale
Childisfemale
Notes: Robust standard errors, clustered at state-level, are inparentheses. * p<0.10, **p<0.05,*** p<0.01. This table uses NFHS data, is restricted to up to third births, with birth cohorts from1972to2004.Fordetailsonsampleandvariables,seenotesforTable1.
Notes:Sameasabove.Samplerestricteduptofourthbirths.
Notes:Sameasabove.Samplerestrictedfirstbirthsonly.

TableA3a:SexRatiosatBirth:UsingAlternativedatasetREDS2006 (1) (2) (3) (4) (5)First-bornisgirl*Reform*post -8.25**-7.78*-7.66* -8.86* -9.13 (3.77)(4.27)(4.25) (4.69) (6.60)Controls No Yes Yes Yes NoStatefixedeffects Yes Yes Yes Yes NoChildyearofbirthfixedeffects Yes Yes Yes Yes YesStatelineartrends No No Yes No YesState-yearofbirthfixedeffects No No No Yes NoMotherfixedeffects No No No No YesN 119051085510855 10855 11905
TableA3b:SexRatiosatBirth:RobustnessChecks:UsingAlternativedatasetREDS2006 (1) (2) (3) (4) (5)
completedfertility
motherage>=35
First-bornisgirl*Reform*post -7.67* -6.93 -14.28*** -12.57 -12.67** (4.26)(5.14) (3.45) (6.73) (4.40)StateCommission 0.38 -0.41
(2.31) (2.47)Controls Yes Yes Yes Yes YesStatefixedeffects Yes Yes Yes Yes YesChildyearofbirthfixedeffects Yes Yes Yes Yes YesStatelineartrends Yes Yes No No YesFemale*statelineartrends No No No No NoState-yearofbirthfixedeffects No No Yes Yes NoN 10855 10855 9126 3759 8300Notes: Robust standard errors, clustered at state-level, are in parentheses. * p<0.10, ** p<0.05, *** p<0.01. Thistable uses REDS data. Due to smaller number of observations in REDS 2006 compared to NFHS,we combine thetwo ultrasound periods into a single “Post” dummy variable that captures the full ultrasound period1985-2004.We control for state-specific linear trends in Columns 1 and 2 since the relevant control variable (statecommission) is not identifiedwith state-year fixedeffects. For detailson the sample and restof variables variables,see notes for Tables 1 and 2. We cannot replicate the final column (6) of Table 2 as REDS does not provideinformationonmother'sidealnumberofchildren.
Notes: Robust standard errors, clustered at state-level, are in parentheses. * p<0.10, ** p<0.05, *** p<0.01. Thistable uses REDS data, and is restricted up to second births. Due to smaller number of observations in REDS 2006compared toNFHS,we combine the twoultrasound periods into asingle “Post” dummy variable that captures thefull ultrasound period 1985-2004. Control variables include household wealth, parental education, religiondummies, high-castedummy and age groupcategoriesofmother.For detailson the restof variables, see notes forTable1.
Childisfemale
StateWomen'sCommission
ExcludingMahaandKarna
OnlySouthernStates
Childisfemale
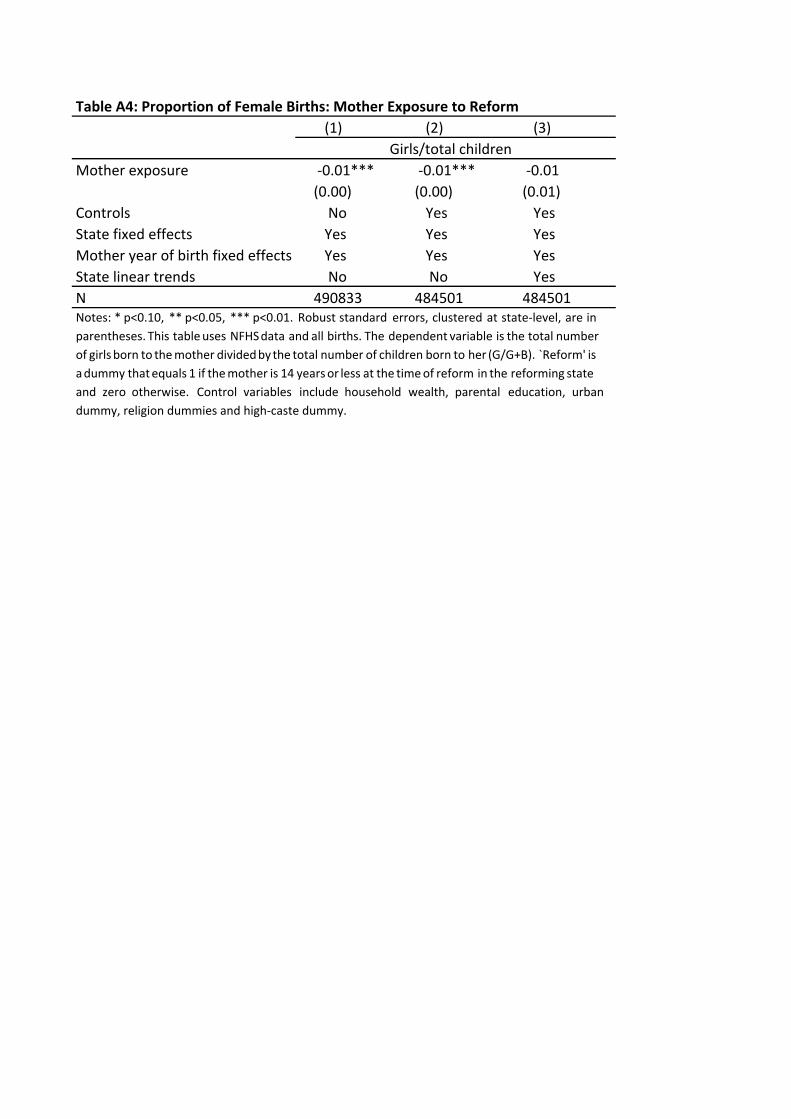
TableA4:ProportionofFemaleBirths:MotherExposuretoReform (1) (2) (3)Motherexposure -0.01*** -0.01*** -0.01 (0.00) (0.00) (0.01)Controls No Yes YesStatefixedeffects Yes Yes YesMotheryearofbirthfixedeffects Yes Yes YesStatelineartrends No No YesN 490833 484501 484501
Girls/totalchildren
Notes: * p<0.10, ** p<0.05, *** p<0.01. Robust standard errors, clustered at state-level, are inparentheses. This tableuses NFHSdata and all births. The dependent variable is the total numberof girls born to themother dividedbythe total number of children born to her (G/G+B). `Reform' isadummy thatequals 1 if themother is 14 yearsor less at the timeof reform in the reforming stateand zero otherwise. Control variables include household wealth, parental education, urbandummy,religiondummiesandhigh-castedummy.
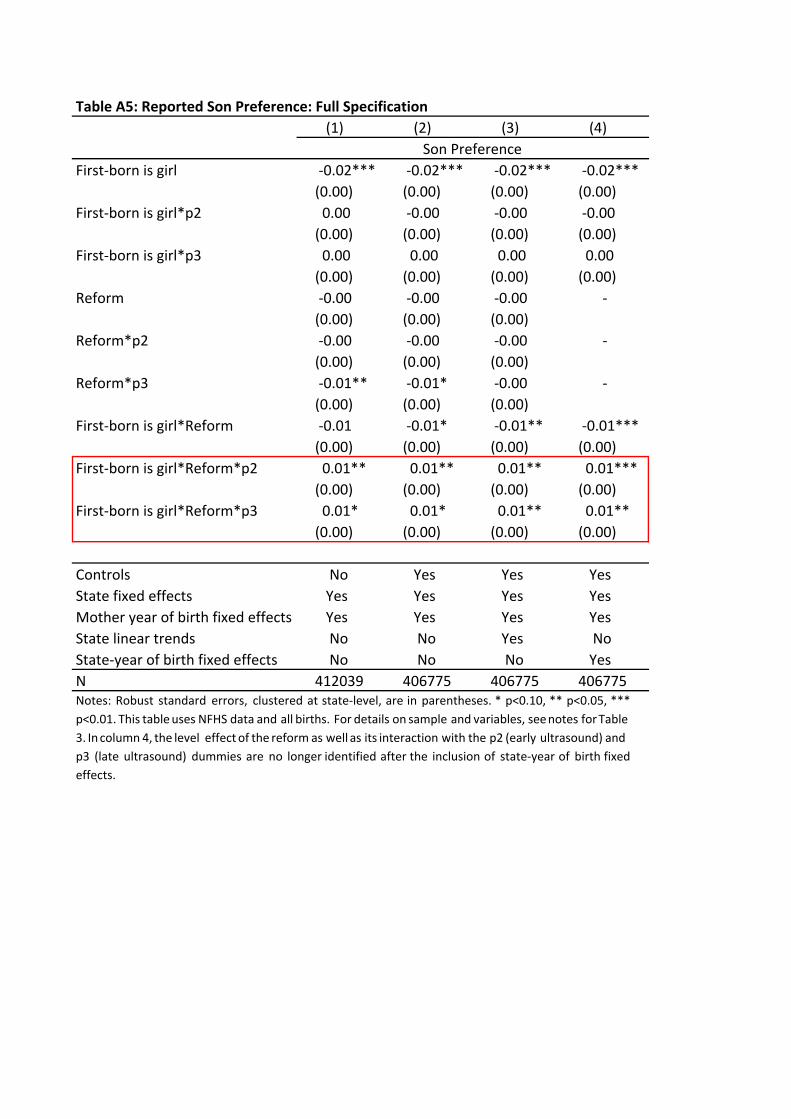
TableA5:ReportedSonPreference:FullSpecification (1) (2) (3) (4)First-bornisgirl -0.02*** -0.02*** -0.02*** -0.02*** (0.00) (0.00) (0.00) (0.00)First-bornisgirl*p2 0.00 -0.00 -0.00 -0.00 (0.00) (0.00) (0.00) (0.00)First-bornisgirl*p3 0.00 0.00 0.00 0.00 (0.00) (0.00) (0.00) (0.00)Reform -0.00 -0.00 -0.00 - (0.00) (0.00) (0.00)Reform*p2 -0.00 -0.00 -0.00 - (0.00) (0.00) (0.00)Reform*p3 -0.01** -0.01* -0.00 - (0.00) (0.00) (0.00)First-bornisgirl*Reform -0.01 -0.01* -0.01** -0.01*** (0.00) (0.00) (0.00) (0.00)First-bornisgirl*Reform*p2 0.01** 0.01** 0.01** 0.01*** (0.00) (0.00) (0.00) (0.00)First-bornisgirl*Reform*p3 0.01* 0.01* 0.01** 0.01**
(0.00) (0.00) (0.00) (0.00)Controls No Yes Yes YesStatefixedeffects Yes Yes Yes YesMotheryearofbirthfixedeffects Yes Yes Yes YesStatelineartrends No No Yes NoState-yearofbirthfixedeffects No No No YesN 412039 406775 406775 406775
SonPreference
Notes: Robust standard errors, clustered at state-level, are in parentheses. * p<0.10, ** p<0.05, ***p<0.01. This tableuses NFHS data and all births. For details on sample and variables, seenotes forTable3. Incolumn 4, the level effect of the reform as well as its interaction with the p2 (early ultrasound) andp3 (late ultrasound) dummies are no longer identified after the inclusion of state-year of birth fixedeffects.
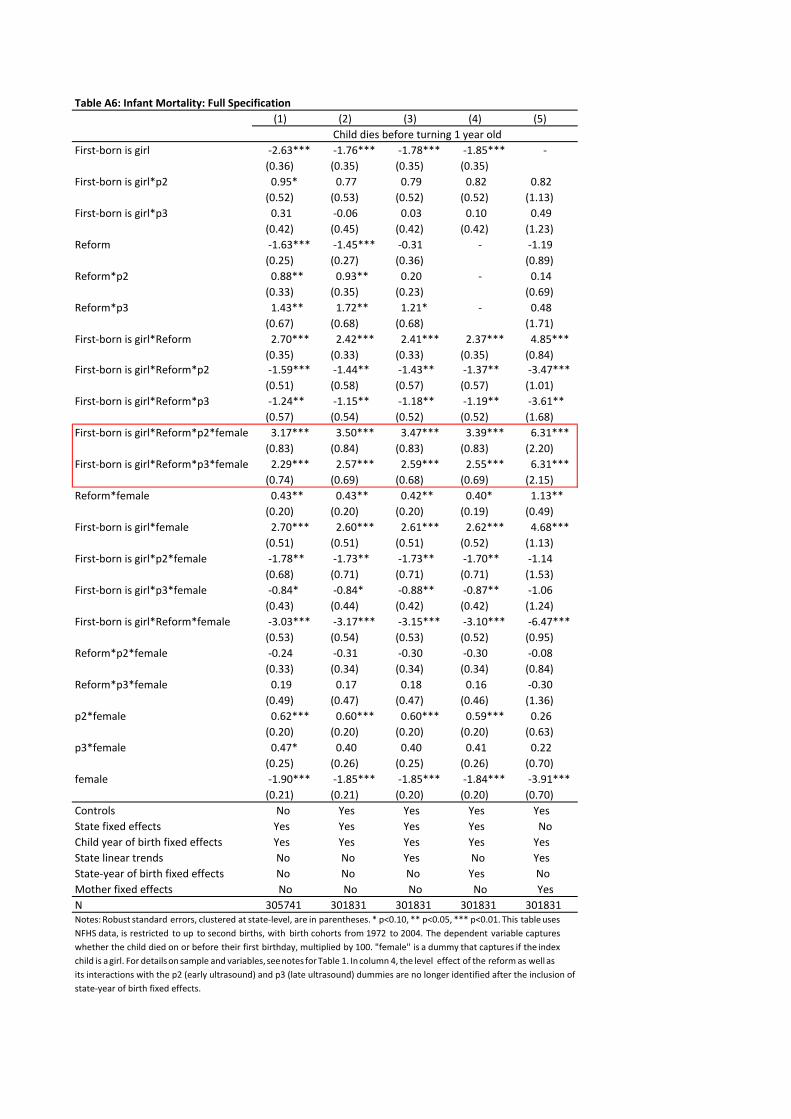
TableA6:InfantMortality:FullSpecification (1) (2) (3) (4) (5)First-bornisgirl -2.63*** -1.76*** -1.78*** -1.85*** - (0.36) (0.35) (0.35) (0.35)First-bornisgirl*p2 0.95* 0.77 0.79 0.82 0.82 (0.52) (0.53) (0.52) (0.52) (1.13)First-bornisgirl*p3 0.31 -0.06 0.03 0.10 0.49 (0.42) (0.45) (0.42) (0.42) (1.23)Reform -1.63*** -1.45*** -0.31 - -1.19 (0.25) (0.27) (0.36) (0.89)Reform*p2 0.88** 0.93** 0.20 - 0.14 (0.33) (0.35) (0.23) (0.69)Reform*p3 1.43** 1.72** 1.21* - 0.48 (0.67) (0.68) (0.68) (1.71)First-bornisgirl*Reform 2.70*** 2.42*** 2.41*** 2.37*** 4.85*** (0.35) (0.33) (0.33) (0.35) (0.84)First-bornisgirl*Reform*p2 -1.59*** -1.44** -1.43** -1.37** -3.47*** (0.51) (0.58) (0.57) (0.57) (1.01)First-bornisgirl*Reform*p3 -1.24** -1.15** -1.18** -1.19** -3.61** (0.57) (0.54) (0.52) (0.52) (1.68)First-bornisgirl*Reform*p2*female 3.17*** 3.50*** 3.47*** 3.39*** 6.31*** (0.83) (0.84) (0.83) (0.83) (2.20)First-bornisgirl*Reform*p3*female 2.29*** 2.57*** 2.59*** 2.55*** 6.31*** (0.74) (0.69) (0.68) (0.69) (2.15)Reform*female 0.43** 0.43** 0.42** 0.40* 1.13** (0.20) (0.20) (0.20) (0.19) (0.49)First-bornisgirl*female 2.70*** 2.60*** 2.61*** 2.62*** 4.68*** (0.51) (0.51) (0.51) (0.52) (1.13)First-bornisgirl*p2*female -1.78** -1.73** -1.73** -1.70** -1.14 (0.68) (0.71) (0.71) (0.71) (1.53)First-bornisgirl*p3*female -0.84* -0.84* -0.88** -0.87** -1.06 (0.43) (0.44) (0.42) (0.42) (1.24)First-bornisgirl*Reform*female -3.03*** -3.17*** -3.15*** -3.10*** -6.47*** (0.53) (0.54) (0.53) (0.52) (0.95)Reform*p2*female -0.24 -0.31 -0.30 -0.30 -0.08 (0.33) (0.34) (0.34) (0.34) (0.84)Reform*p3*female 0.19 0.17 0.18 0.16 -0.30 (0.49) (0.47) (0.47) (0.46) (1.36)p2*female 0.62*** 0.60*** 0.60*** 0.59*** 0.26 (0.20) (0.20) (0.20) (0.20) (0.63)p3*female 0.47* 0.40 0.40 0.41 0.22 (0.25) (0.26) (0.25) (0.26) (0.70)female -1.90*** -1.85*** -1.85*** -1.84*** -3.91*** (0.21) (0.21) (0.20) (0.20) (0.70)Controls No Yes Yes Yes YesStatefixedeffects Yes Yes Yes Yes NoChildyearofbirthfixedeffects Yes Yes Yes Yes YesStatelineartrends No No Yes No YesState-yearofbirthfixedeffects No No No Yes NoMotherfixedeffects No No No No YesN 305741 301831 301831 301831 301831
Childdiesbeforeturning1yearold
Notes: Robust standard errors, clustered at state-level, are in parentheses. * p<0.10, ** p<0.05, *** p<0.01. This tableusesNFHS data, is restricted to up to second births, with birth cohorts from 1972 to 2004. The dependent variable captureswhether the child died on or before their first birthday, multiplied by 100. "female" is a dummy that captures if the indexchild is agirl. For detailson sample and variables, seenotes forTable 1. Incolumn 4, the level effect of the reform as well asitsinteractionswiththep2(earlyultrasound)andp3(lateultrasound)dummiesarenolongeridentifiedaftertheinclusionofstate-yearofbirthfixedeffects.
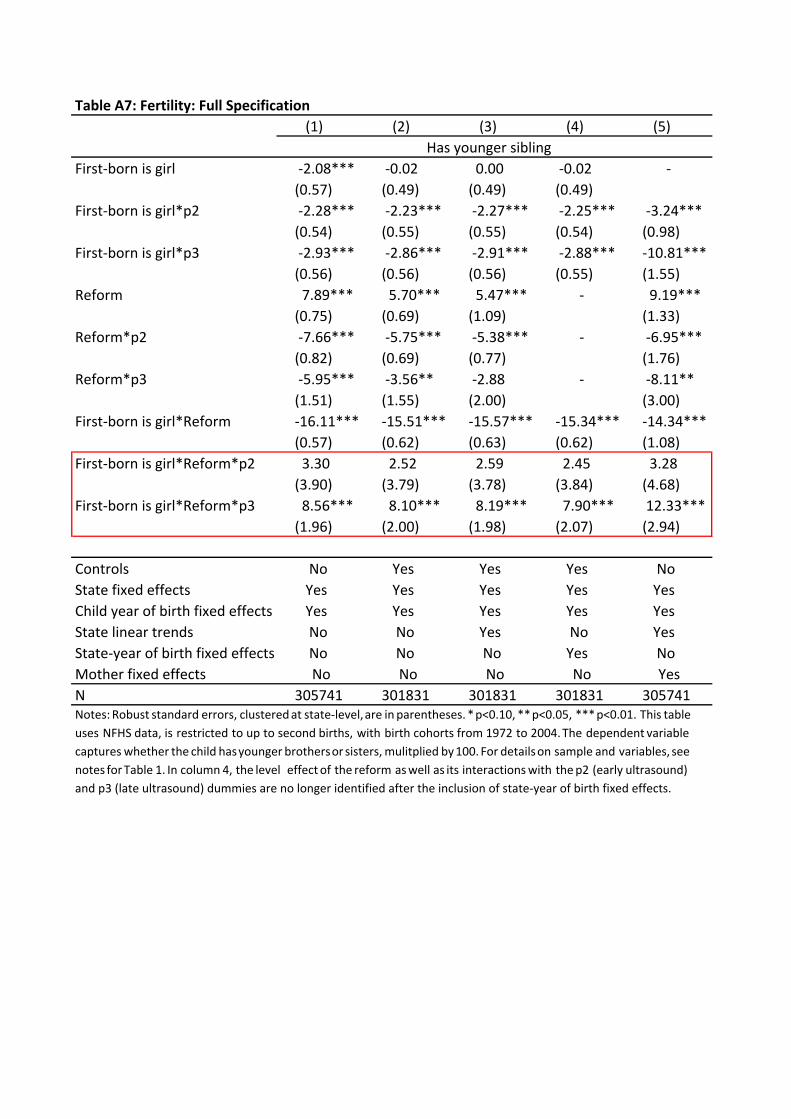
TableA7:Fertility:FullSpecification (1) (2) (3) (4) (5)First-bornisgirl -2.08*** -0.02 0.00 -0.02 - (0.57) (0.49) (0.49) (0.49)First-bornisgirl*p2 -2.28*** -2.23*** -2.27*** -2.25*** -3.24*** (0.54) (0.55) (0.55) (0.54) (0.98)First-bornisgirl*p3 -2.93*** -2.86*** -2.91*** -2.88*** -10.81*** (0.56) (0.56) (0.56) (0.55) (1.55)Reform 7.89*** 5.70*** 5.47*** - 9.19*** (0.75) (0.69) (1.09) (1.33)Reform*p2 -7.66*** -5.75*** -5.38*** - -6.95*** (0.82) (0.69) (0.77) (1.76)Reform*p3 -5.95*** -3.56** -2.88 - -8.11** (1.51) (1.55) (2.00) (3.00)First-bornisgirl*Reform -16.11*** -15.51*** -15.57*** -15.34*** -14.34*** (0.57) (0.62) (0.63) (0.62) (1.08)First-bornisgirl*Reform*p2 3.30 2.52 2.59 2.45 3.28 (3.90) (3.79) (3.78) (3.84) (4.68)First-bornisgirl*Reform*p3 8.56*** 8.10*** 8.19*** 7.90*** 12.33***
(1.96) (2.00) (1.98) (2.07) (2.94)Controls No Yes Yes Yes NoStatefixedeffects Yes Yes Yes Yes YesChildyearofbirthfixedeffects Yes Yes Yes Yes YesStatelineartrends No No Yes No YesState-yearofbirthfixedeffects No No No Yes NoMotherfixedeffects No No No No YesN 305741 301831 301831 301831 305741
Hasyoungersibling
Notes: Robust standard errors, clusteredat state-level,are in parentheses. *p<0.10, **p<0.05, ***p<0.01. This tableuses NFHS data, is restricted to up to second births, with birth cohorts from 1972 to 2004.The dependent variablecaptures whether the child hasyounger brothersor sisters,mulitplied by100. For detailson sample and variables, seenotes forTable 1. In column 4, the level effect of the reform aswell as its interactionswith thep2 (early ultrasound)andp3(lateultrasound)dummiesarenolongeridentifiedaftertheinclusionofstate-yearofbirthfixedeffects.
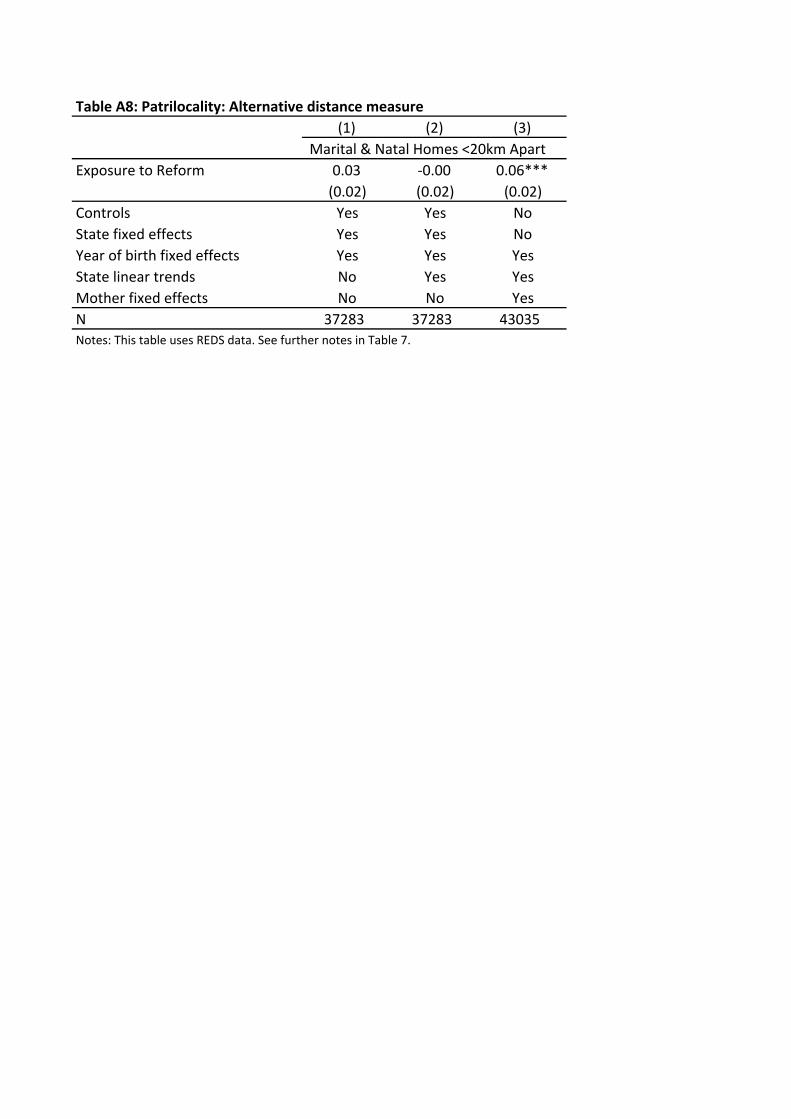
TableA8:Patrilocality:Alternativedistancemeasure(1) (2) (3)
Marital&NatalHomes<20kmApartExposuretoReform 0.03 -0.00 0.06***
(0.02) (0.02) (0.02)Controls Yes Yes NoStatefixedeffects Yes Yes NoYearofbirthfixedeffects Yes Yes YesStatelineartrends No Yes YesMotherfixedeffects No No YesN 37283 37283 43035Notes:ThistableusesREDSdata.SeefurthernotesinTable7.

TableA9:MeansofOutcomeVariablesoutcome variableusedtomeasure mean sdNFHSsexratio proboffemalebirth(%) 48.07sonpreference idealno.ofboys/idealno.ofchildren 0.57 0.14infantgirlmortality childdiesbeforefirstbirthday(%) 7.3infantboymortality childdiesbeforefirstbirthday(%) 7.7fertility(uptobirthorder2) childhasyoungersiblings(%) 73.2 44.3
REDSco-residence probthatparentresideswithadultson 0.24marriagedistance probthatdaughter'smaritalandnatalhomes<10kmApart 0.18 0.39
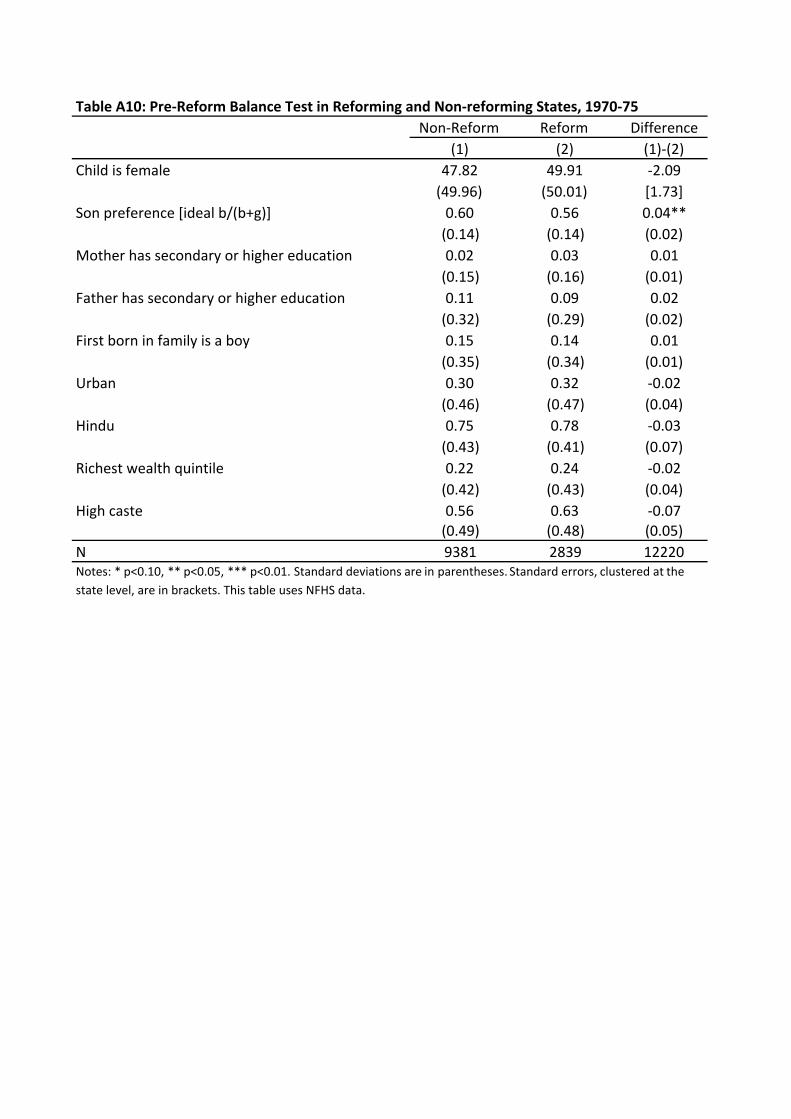
TableA10:Pre-ReformBalanceTestinReformingandNon-reformingStates,1970-75Non-Reform Reform Difference
(1) (2) (1)-(2)Childisfemale 47.82 49.91 -2.09
(49.96) (50.01) [1.73]Sonpreference[idealb/(b+g)] 0.60 0.56 0.04**
(0.14) (0.14) (0.02)Motherhassecondaryorhighereducation 0.02 0.03 0.01
(0.15) (0.16) (0.01)Fatherhassecondaryorhighereducation 0.11 0.09 0.02
(0.32) (0.29) (0.02)Firstborninfamilyisaboy 0.15 0.14 0.01
(0.35) (0.34) (0.01)Urban 0.30 0.32 -0.02
(0.46) (0.47) (0.04)Hindu 0.75 0.78 -0.03
(0.43) (0.41) (0.07)Richestwealthquintile 0.22 0.24 -0.02
(0.42) (0.43) (0.04)Highcaste 0.56 0.63 -0.07
(0.49) (0.48) (0.05)N 9381 2839 12220Notes: * p<0.10, ** p<0.05, *** p<0.01. Standard deviations are in parentheses. Standard errors, clustered at thestatelevel,areinbrackets.ThistableusesNFHSdata.