Embed Size (px)
Citation preview

Forschungsinstitut zur Zukunft der ArbeitInstitute for the Study of Labor
DI
SC
US
SI
ON
P
AP
ER
S
ER
IE
S
Did Cheaper Flights Change the Direction of Science?
IZA DP No. 9897
April 2016
Christian CataliniChristian Fons-RosenPatrick Gaulé
Did Cheaper Flights Change the
Direction of Science?
Christian Catalini MIT
Christian Fons-Rosen UPF, Barcelona GSE and CEPR
Patrick Gaulé CERGE-EI and IZA
Discussion Paper No. 9897 April 2016
IZA
P.O. Box 7240 53072 Bonn
Germany
Phone: +49-228-3894-0 Fax: +49-228-3894-180
E-mail: [email protected]
Any opinions expressed here are those of the author(s) and not those of IZA. Research published in this series may include views on policy, but the institute itself takes no institutional policy positions. The IZA research network is committed to the IZA Guiding Principles of Research Integrity. The Institute for the Study of Labor (IZA) in Bonn is a local and virtual international research center and a place of communication between science, politics and business. IZA is an independent nonprofit organization supported by Deutsche Post Foundation. The center is associated with the University of Bonn and offers a stimulating research environment through its international network, workshops and conferences, data service, project support, research visits and doctoral program. IZA engages in (i) original and internationally competitive research in all fields of labor economics, (ii) development of policy concepts, and (iii) dissemination of research results and concepts to the interested public. IZA Discussion Papers often represent preliminary work and are circulated to encourage discussion. Citation of such a paper should account for its provisional character. A revised version may be available directly from the author.
IZA Discussion Paper No. 9897 April 2016
ABSTRACT
Did Cheaper Flights Change the Direction of Science?* We test how a reduction in travel cost affects the rate and direction of scientific research. Using a fine-grained, scientist-level dataset within chemistry (1991-2012), we find that after Southwest Airlines enters a new route, scientific collaboration increases by 50%, an effect that is magnified when weighting output by quality. The benefits from the lower fares, however, are not uniform across scientist types: younger scientists and scientists that are more productive than their local peers respond the most. Thus, cheaper flights, by reducing frictions otherwise induced by geography and allowing for additional face-to-face interactions, seem to enable better matches over distance. JEL Classification: O3, R4, L93 Keywords: scientific collaboration, air travel, temporary co-location, face-to-face meetings Corresponding author: Patrick Gaulé CERGE-EI Politických vězňů 7 Prague 111 21 Czech Republic E-mail: [email protected]
* We appreciate helpful comments from Alberto Galasso, Ina Ganguli, Avi Goldfarb, Xavier Giroud, Jeff Furman, Stepan Jurajda, Mara Lederman, Nikolas Mittag, Alex Oettl, Erin Scott, Paula Stephan, Scott Stern and seminar participants at Academy of Management, Charles University, the EPFL, Harvard Business School, Imperial College London, Stockholm School of Economics, Universidad Carlos III, and National University of Singapore for helpful discussions and advice. All errors are our own. This research contributes to the agenda Strategie AV21. Fons-Rosen acknowledges financial support by the Spanish Ministry of Economy and Competitiveness (ECO2014-55555-P).

1 Introduction
Scientific collaboration has evolved substantially in recent years. Two stylized facts stand
out in particular. First, the share of coauthored papers has increased over time, and high
impact papers are increasingly the result of teams of authors (Jones, Wuchty & Uzzi 2008,
Wuchty, Jones & Uzzi 2007)1. Second, distant and multi-institutional collaborations are on
the rise (Adams et al. 2005, Jones, Wuchty & Uzzi 2008).
Several explanations have been brought forward to explain these findings. Jones (2009)
ties the rise in collaboration to the necessity for highly specialized scientists to build teams
that cover multiple, potentially complementary sets of skills: as the body of pre-existing
knowledge rapidly expands over time, no single scientist is able to master all the information
required to advance the knowledge frontier on her own. In Jones’ model, collaboration is a
rational response to an increase in knowledge complexity.
A second explanation links the increase in co-authorship to the drastic reduction in
communication costs brought by the internet: as coordination and communication costs
go down, scientists are able to sustain collaboration over distance in a more efficient way.
Direct empirical evidence of the effect comes from Agrawal & Goldfarb’s (2008) study of
Bitnet, an internet predecessor that connected multiple universities in the U.S. in the early
80s: as more institutions joined the network, collaboration among affected scientists in the
field of electrical engineering increased. Interestingly, their results hint at the technology
being potentially complementary to offline interactions (e.g. face-to-face meetings), as co-
authorship increases disproportionately among university pairs that are co-located.2
In this paper, we test a complementary hypothesis: that the increase in distant collab-
oration may also be the result of the dramatic reduction in air travel costs that took place
within the United States over the last 30 years (Perry 2014), where the cost per mile dropped
by over 50%. To the extent that face-to-face interactions are important to establish trust,
monitor effort and communicate complex ideas (Storper & Venables 2004), cheaper flights
may be instrumental in starting and sustaining collaboration over distance.3 Moreover, if
offline an online interactions are complements (Gaspar & Glaeser, 1998), then the decline in
air travel costs could have amplified the documented impact of the internet.
1By 2000, less than 20% of papers in science and engineering were single authored. Similar patterns, andin particular the rise of coauthorship and distant coauthorship, have been documented in economics. SeeGaspar & Glaeser (1998), Hamermesh & Oster (2004), Rosenblatt & Mobius (2004)
2Other studies have found an effect of bitnet on collaborations in the academic life sciences (Ding et al.2010), and of the internet on R&D cooperation within firms (Forman & Zeebroeck 2012).
3Kim, Morse & Zingales (2009) and Freeman, Ganguli & Murciano-Goroff (2014) note that the seculardeclines in both communication costs and air travel costs may have facilitated long distance collaborations.
2
To address endogeneity concerns, we rely on a source of variation in air travel costs that
is plausibly exogenous to the scientists’ research trajectories: the expansion of Southwest
Airlines, a low-cost air carrier, across the United States from 1993 to 2010. Southwest
has been described as the most significant development in the market structure of the U.S.
airline industry by the Transportation Research Board (1999) and by industrial economists
(Morrison 2001, Borenstein & Rose 2007, Goolsbee & Syverson 2008). The introduction of
new airline routes, moreover, has been used in a different context (early-stage investment)
as an instrument for the frequency of face-to-face interactions between venture capitalists
and entrepreneurs (Bernstein, Giroud and Townsend, 2015).
We first document how entry by Southwest on a new route leads to, on average, a 20%
drop in fares and a resulting 40% increase in passengers (with little effect on miles flown and
availability of direct flights). We then exploit the differential timing of the introduction of
new routes to directly estimate the impact of Southwest on scientific collaboration among
U.S. cities. For this purpose we build a large sample of approximately one million4 scientific
articles (1990-2009) for which we map authors’ affiliations to a latitude-longitude pair, and
then U.S. cities and nearby airports. We find that after Southwest entry collaborations
across cities increase in chemistry (36%), physics (26%), engineering (49%), and biology
(85%). This suggests that the benefits of cheaper air travel are not specific to a scientific
field but may be present across the life and physical sciences.
A key concern with this first part of the analysis is that changes in local economic condi-
tions may drive both Southwest’s entry decision and the number and composition of scientists
at the endpoints of the new routes. To address this issue we build a new database at the
scientist-pair level for one of the fields of science in the larger sample: chemistry. This finer-
grained dataset enables us to use an econometric specification that includes scientist-pair
fixed effects, thus holding the number and composition of scientists fixed, as well as focusing
on a set of scientists - academic scientists - less likely to be immediately affected by local
economic conditions. Finally, we are able to directly control for (changes in) departmental
R&D budgets which are a remaining channel through which local economic conditions could
influence collaborations.
Besides helping us address identification concerns, the scientists-pair level data allows
us to explore more nuanced hypotheses and questions. In particular, our analysis within
chemistry focuses on changes in the rate and type of collaborations. For instance, we ask
which type of scientists pairs are more affected by Southwest entry, whether the quality of
4From the full sample, 1,169,458 articles have at least one author which resolves to a U.S. address, andwe are able to link 85% of them to a U.S. city.
3
collaborations is impacted, and whether this leads to changes in the overall collaboration
portfolio.
We leverage an original longitudinal dataset covering the population of faculty members
in chemistry departments of research-intensive U.S. universities between 1991 and 2012. Re-
gressing the number of copublications between pairs of scientists on Southwest entry, year
fixed effects, and pair fixed effects, we find that Southwest entry leads to a large (+50%), sta-
tistically significant increase in collaboration. The timing of the effect starts after Southwest
entry (i.e., we do not observe a pre-trend in collaboration), and our coefficient of interest
is unaffected when we control for time-varying departmental research budgets. The absence
of a pre-trend in collaboration reassures us of the exogeneity of Southwest entry to the
individual scientific trajectories involved.
We then use our empirical setting to explore how Southwest changes scientific collabo-
ration. First, we consider whether the additional publications induced by Southwest are of
high versus low quality by weighting them by the number of citations they receive: results
are stronger for citation-weighted publications, which suggests that the work enabled by
the cheaper fares was not of marginal quality. Next, we explore whether Southwest had a
stronger effect for established versus new collaborators. Whereas the effect is present both
on the intensive and the extensive margin, the intensive margin is twice as large, suggesting
that established co-authors benefited the most from the introduction of the cheaper fares. To
shed further light on potential mechanisms, we test if scientists rebalance their collaboration
portfolios away from distant scientists on routes not affected by the cheaper fares and in
favor of co-authors affected by Southwest. While we do not find direct evidence of crowding
out when looking at raw copublications numbers, when we weight papers by citations to
account for quality, the resulting collaborations increase at a substantially lower rate than
those affected by Southwest.
Finally, we explore heterogeneous effects by scientists type, and discover that Southwest
entry had a stronger effect among younger scientists, scientists that are more productive
than their department average, and scientists that are specialized in different areas (higher
distance in scientific space).
Besides highlighting the role of collaboration costs in shaping scientists’ co-authorship
decisions, our paper contributes to the growing literature on the role of geography on scien-
tific knowledge production. Early studies (Katz 1994, Mairesse & Turner 2005) found that
proximity among labs strongly correlates with the incidence of scientific collaboration. More
recently, Catalini (2015) identifies the causal effect of proximity on the rate and direction of
scientific collaboration using the natural experiment arising from the reshuffling of labs on
4

the Jussieu campus of Paris following the removal of asbestos from its buildings. Besides
permanent co-location, temporary co-location may also remove frictions to scientific collab-
oration: in a field experiment at Harvard University, Boudreau et al. (2014) find that being
in the same room during a scientific symposium leads to a large increase in the propensity
that any two scientists will co-apply for a grant. Similarly, Chai (2014) shows that participa-
tion in the same conference is positively correlated with future collaboration. Our findings
suggest that travel costs also have a tangible effect on the rate and trajectory of science,
potentially because of the way they influence the likelihood that any two scientists will spend
time interacting face-to-face.
The rest of the paper is as follows: in Section 2, we describe the data sources used in
the paper as well as the data construction process. In Section 3 we introduce the empirical
strategy. In Section 4 we present our main effect and heterogeneous effects in terms of
extensive and intensive margin and scientist characteristics. Section 5 concludes.
2 Data
2.1 Data Sources and Construction
To examine the effect of air travel costs on scientific collaboration, we combine data on
scientists with publication records and air transportation information. While we initially
show our main result within a large sample of scientific articles in biology, chemistry, physics
and engineering, we focus most of our analysis on our more detailed chemistry dataset.
Within the chemistry sample, biographical information on scientists enables us to effectively
disambiguate publication data, while also allowing us to separate faculty members from other
types of authors.
Air Transportation Data - To recover information on when Southwest operated flights
between different routes, as well as information on prices, passengers and miles flown, we
use data from the Airline Origin and Destination Survey (DB1B) of the U.S. Bureau of
Transportation Statistics. Reporting is mandatory for airlines and the data is a 10% sample
of U.S. domestic itineraries, tracking passengers across flight changes. This data is available
only from 1993, hence we will focus on Southwest entry decisions that occur after 1993.
Match Between Airports and Universities. We compute distances between airports and
universities using Google Maps. The matching between universities and airports is com-
plicated by the fact that the same metropolitan area could be served by multiple airports
5

(e.g. O’Hare and Midway in Chicago) or that a college town could be half-way between two
airports. We chose to match universities to all airports within a 50 miles radius.5 We code
the year of Southwest entry for a pair of universities as the first year in which Southwest
operates a flight on any route whose endpoints (airports) are within 50 miles of the respective
universities.
2.2 Large Sample of Publications in Biology, Chemistry, Physics
and Engineering
The larger sample of co-publications allows us to compare the effect of Southwest across
different disciplines. Since we do not have information on faculty members outside of chem-
istry, this dataset is based on geocoded publications and structured at the city-pair level.
The starting point for the construction of this sample is the population of scientific articles
published in 477 leading scientific journals in biology, chemistry, physics and engineering
between 1990 and 2009.6 We have a total of 2,773,560 papers published between 1990 and
2009, of which 1,169,458 had at least one author with a U.S. address. Out of all papers with
U.S. addresses, we were able to successfully map 994,672 (85%) to a U.S. CBSA7 using a
combination of three different geocoding services (Google Maps API, Bing Maps API, and
the Data Science Toolkit). This allows us to link the vast majority of U.S. papers to the
geographic regions involved in their production.
5Some universities do not have any airports in a 50 miles radius, and scientists located in those universitiesare excluded from the analysis. Results are robust to assigning them to the nearest airport.
6These journals include large multidisciplinary journals such as Science, Nature, Proceedings of the Na-tional Academy of Sciences. The leading journals in biology, chemistry, physics and engineering are included,but the coverage is skewed towards biology and chemistry with these disciplines representing a greater shareof the total number of journals.
7“CBSA is a collective term for both metro and micro areas. A metro area contains a core urban area pop-ulation of 50,000 or more and a micro area contains an urban core population of at least 10,000 (but less than50,000). Each metro or micro area consists of one or more counties and includes the counties containing thecore urban area, as well as any adjacent counties that have a high degree of social and economic integration (asmeasured by commuting to work) with the urban core.” Source: http://www.census.gov/population/metro/.The full list of CBSAs is available at: http://www.census.gov/population/metro/data/def.html. The 994,672papers with US authors had a total of 3,668,971 US affiliations on them.
6
2.3 Chemistry Dataset
2.3.1 Data on Scientists
Our focus is on collaborations across faculty members (and therefore effectively across labs8)
in the discipline of chemistry9, in part due to data availability, and in part because of
the short publications cycles in this discipline. For biographical information on scientists,
our data source is the directory of graduate research published by the American Chemical
Society. Intended as a source of information for prospective graduate students, this directory
provides comprehensive listings of faculty affiliated with U.S. departments granting PhDs in
chemistry, chemical engineering and biochemistry. Besides faculty names and departmental
affiliations, the directory provides information on year of birth, gender and education. The
directory is published biannually in print and, since 1999, on the web.10 We combine the
directories from 1991 to 2013 to build a longitudinal panel of over 20,000 scientists. We
complement this information with department-level R&D expenditures from The National
Science Foundation (NSF) Survey of Research and Development Expenditures at Universities
and Colleges.
2.3.2 Publication Data
We match faculty names to publication data from Scopus covering more than 200 chemistry
journals, multidisciplinary journals and major journals in neighboring disciplines.11 Within
chemistry, the match between publications and scientists is facilitated by the fact that we
know institutional affiliations from faculty data. We match publications to faculty based on
last name, first and (if non-missing) middle initials, departmental and university affiliation.
From publication data, we construct for each scientist time-varying measures of past pro-
ductivity (with a moving average over the last three years of publication counts weighted by
journal impact factor). We also infer our main outcome, copublications, from bibliometric
8In the hard and life sciences, an important share of authors on papers are graduate students, postdocsand technicians. These are typically employed in the lab of a faculty member who obtains funding for thelab, appears as a coauthor on lab publications, oversees resource allocation within the lab and effectivelydecides whether to collaborate with other (possibly geographically distant) labs.
9Chemistry, which focuses on the composition, structure, transformations and properties of matter, is alarge discipline, with chemistry PhD graduates accounting for 30% of U.S. PhD science graduates.
10The American Chemical Society also produced a CD-ROM for the years 1991-1993.11Scopus is one of the two major bibliometric databases (along with ISI Web of Science). Our set of
chemistry journals includes all journals from the American Chemical Society, as well as any chemistryjournal with impact factor above 2. Our set of multidisciplinary journals includes Nature, Science,Cell andthe Proceedings of the National Academy of Sciences. Our set of major journals in neighboring disciplinesincludes all journals with impact factor above 6 in physics, biology, material science and nanotechnology.
7

data. The majority (75%) of papers matched to a faculty member have exactly one faculty
author, 21% percent have two, and less than 4% have more than two authors.12 A paper
with more than 2 faculty authors is counted as a copublication between all pairs of faculty
members involved.
2.3.3 Sample Selection and Descriptive Statistics
Our chemistry dataset covers over 20,000 scientists and their collaborations. However, we
focus on a specific subset of pairs of scientists who experience Southwest entry and for whom
we have variation in collaboration over time. Since all regressions include scientist-pair fixed
effects, pairs that never collaborate drop out of the sample. We have 15,244 pairs of scientists
who collaborate at least once.13 Excluding co-authors that are in the same department, we
have 8,311 pairs of scientists. Only a minority (1,158) of those pairs experience Southwest
entry during our analysis period of 1993-2012, either because for the other 7,000 Southwest
is already operating a flight or because Southwest never flies between the relevant endpoints.
We drop pairs in locations where Southwest enters but then leaves within two years, as well
as pairs where Southwest entry coincides with the move of a scientist.14. Our final analysis
covers 819 pairs of scientists corresponding to 890 individuals.
[Insert table 1 about here]
Table 1 displays descriptive statistics for our chemistry sample at different levels of anal-
ysis: individual, individual-pair and individual-pair-year. Most individuals in the sample are
male (90%) with an average age at time of Southwest entry of 49.7. We do not observe indi-
vidual research budgets but as a rough proxy we use departmental R&D expenses divided by
the number of faculty members in the department. The median faculty member in our sam-
ple is in a department where departmental R&D expenses divided by the number of faculty
members is $212,000 at the time of Southwest entry. According to the NSF Survey, R&D
expenses include compensation for R&D personnel, equipment and indirect costs. In terms
12Both papers with one faculty author and papers with multiple faculty authors would typically haveseveral non-faculty authors. We focus on faculty authors for reasons mentioned earlier in text. We also findpapers in chemistry journals that are not matched to any of our U.S. faculty authors: these are probablyforeign scientists, or scientists working in corporate environments or federal labs.
13Our dyadic data is not directed, and thus is symmetric: the pair between i and j is the mirror image ofthe pair between j and i. The 15,244 figure is after dropping 15,244 symmetric observations.
14Scientists in our sample may move from one department to another, in some cases leading to a changein whether they are connected by Southwest or not. We want changes in Southwest status to be driven bySouthwest entry decisions rather than by location decisions, and thus exclude pairs who happen to move inthe same year as Southwest enters, the year before Southwest entry or the year after Southwest entry.
8
of specialization15, the largest area is physical chemistry (32%), followed by biochemistry
(23%), inorganic chemistry (13%), organic chemistry (14%) and material science (11%).
We observe our 819 pairs for 17 years on average16 for 14,187 observations at the individual-
pair-year level. Southwest entry corresponds to 413 distinct new routes. The median pair
experiences Southwest entry in 1999 but we observe Southwest entry from 1994 to 2011.
The mean number of copublications over the whole period is 1.9 but the majority of pairs
copublishes only once; only 9% of pairs collaborates both before and after Southwest entry.
3 Empirical Strategy
Our econometric specification is a straightforward difference-in-differences framework at the
scientist-pair level. We focus on a Poisson model with dyadic fixed effects, but show ro-
bustness to additional specifications in the Appendix. Our approach exploits variation in
Southwest entry across different airport pairs over time:
Yijt = βAfterSWijt + µt + γij + εijt
where Yijt is the number of co-publications between scientist i and scientist j in year t,
AfterSWijt is an indicator variable that takes value 1 after Southwest entry, µt is a year
fixed effect, γij is a pair fixed effect to control for underlying time-invariant differences across
pairs of scientists, and εijt is an idiosyncratic error term.
Our analysis examines the change in collaboration over time for pairs that co-publish at
least one paper during our sample period. The pair fixed effects completely capture dyads of
scientists for which we never see activity, and thus we remove these pairs from the analysis
without empirical consequence. Robust standard errors are clustered at the pair level.
15Specialization is inferred based upon the journals in which a scientists publishes. For instance, a facultymember who often publishes in the Journal of Biological Chemistry is assumed to to be specialized inbiochemistry. Appendix table A3 displays a listing of areas of specialization and an example journal for eachone of them.
16A pair is in our sample for a maximum of 22 years (from 1991 to 2011). We observe some pairs for lessthan 22 years due to pair members starting their first faculty appointment after 1991, retiring before 2011,or otherwise no longer being listed in the ACS faculty directory.
9
4 Results
We build our results in three steps: 1) we document the effect Southwest entry had on
the air travel market by providing descriptive information on its impact on the number of
passengers, prices, miles flown, and transfers; 2) we present data on how Southwest influenced
collaborations in biology, chemistry, physics and engineering; 3) we turn to our main result
and heterogeneous effects based on the econometric specification just introduced within the
fine-grained chemistry sample.
The larger dataset allows us to show that the airline’s entry had a broad and generally
comparable impact across a very diverse set of research environments. Since we do not have
access to information on individual faculty members outside of chemistry, we run this part of
the analysis at the U.S. CBSA-pair-year level, thereby including all collaborations between
scientists within each pair of regions.
The chemistry dataset provides us instead with the precision required to further test our
identification strategy: one concern with the city-pair regressions is that Southwest may be
more likely to enter pairs of cities that are growing. Growing cities may also attract an in-
creasing number of researchers over time, and their publications may grow as a result of this
overall trend. Moving to the scientist pair level, we can hold the sample of researchers con-
stant and specifically focus on changes occurring within pairs of individuals, thus mitigating
this concern. The chemistry dataset also allows us to control for R&D budgets, to exploit
heterogeneity by scientists type and observe changes in the overall portfolio of projects a
scientist is working on.
4.1 Southwest Entry and Passengers, Prices, Miles and Transfers
In Table 2 we look at how Southwest entry is correlated with some of the key passenger
and fare metrics of interests in the air travel industry. The coefficients reflect the types of
changes one would expect to take place after the entry of a low-cost competitor: the number
of passengers increases by approximately 44%, and prices drop by around 20%, both results
being strongly statistically significant. We do not find any effect on miles flown or direct
flights, and the reduction in the number of transfers is of very small magnitude. Overall,
these results are consistent with the idea that Southwest lowers the cost of air travel without
providing many new additional direct routes.
[Insert table 2 about here]
10
4.2 Aggregate Changes in the Rate of Collaboration Across US
Regions
To test if the availability of cheaper flights had an effect on scientific collaboration across
fields, we use a large-scale publication dataset covering close to a million papers matched to
a U.S. CBSAs. Specifically, we explore how collaboration between any two CBSAs changed
after Southwest starts operating a new route between them. The unit of analysis is the
CBSA-pair-year (48,274 pairs), and we include pair and year fixed effects to respectively
control for underlying differences across regions that are consistent over time, and overall
time trend. For the estimation, we use a Poisson model with standard errors clustered at
the CBSA-pair level.
[Insert table 3 about here]
Results are displayed in Table 3. In column (1) we find that Southwest entry is associated
with a 77% increase in collaborations in the full sample, with comparable effects across the
different fields of science (columns (2)-(5)).
A key issue with this specification is that we cannot control for scientists’ characteristics
and departmental funding, as we do not have access to a faculty directory list outside of
chemistry. Micropolitan and metropolitan areas may also be too large as a unit of analysis
for correctly measuring the effects of interest. For the rest of the analysis we therefore focus
on chemistry papers and scientists, and we shift from regional pairs to scientist pairs. This
allows us to introduce scientist-pair fixed effects and account for idiosyncratic, unobservable,
and time invariant reasons that may drive collaboration between any two scientists.
Since chemistry, according to the estimates in Table 3, is not an outlier in either direction
(if anything, the effects within the field are in the lower end of the spectrum), we believe the
results from the following sections are potentially generalizable to other fields.
4.3 Changes in Collaboration Within Chemistry
Cheaper flights make collaborating over distance less costly and potentially more efficient
(e.g. because of the ability to meet face-to-face), and should therefore lead to an increase in
the rate of collaboration among scientist-pairs who are now connected through Southwest.
Column (1) in Table 4 runs the main econometric specification previously described and
shows a large and statistically significant effect, with scientist-pairs increasing their pairwise
11

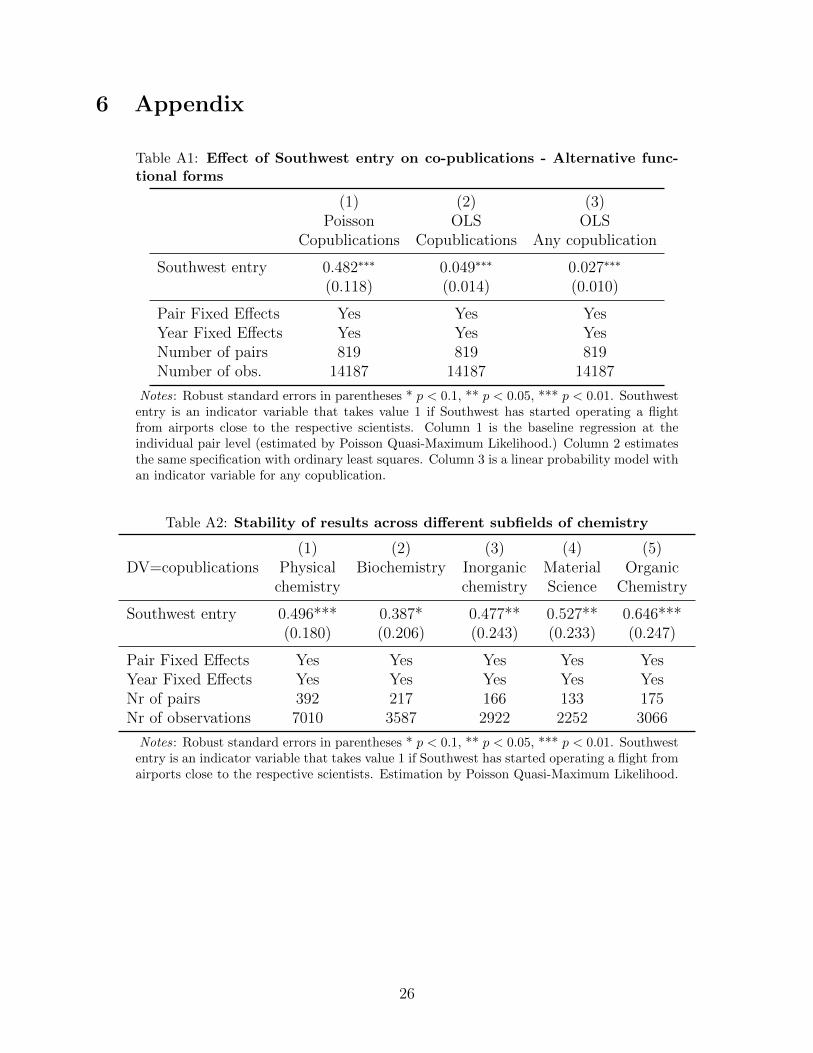
collaborations by approximately 50%.17 In the Appendix, we explore if our main effect varies
across fields of chemistry, and find very similar results for physical chemistry, biochemistry,
inorganic chemistry, material science and organic chemistry.
4.3.1 Endogeneity of Southwest Entry
One may worry that Southwest entry is systematically correlated with growth within the
universities involved at both ends of the routes, i.e., that collaboration would have increased
even in the absence of cheaper flights. While we cannot directly address the simultaneity is-
sue, in columns (2) and (3) we address the key endogeneity concerns by ruling out alternative
explanations.
[Insert table 4 about here]
In column (2) we control for the (log of) departmental R&D budget per faculty mem-
ber to account for variation in growth prospects across departments or regions. While the
coefficient is positive and statistically significant, our main result is unaffected. In column
(3) we follow Bernstein, Giroud, and Townsend (2015) and study the dynamic effects of the
introduction of new airline routes. Specifically, we replace the treatment indicator Southwest
entry in column (1) with a set of four indicator variables representing the years around the
treatment. For example, the indicator ’Southwest entry (-1)’ equals one if the scientist pair
observation is recorded one year prior to the treatment. The other indicator variables are
defined analogously with respect to the year of the treatment (0), the first year after the
treatment (1), and two or more years after the treatment (2+). We find that the coefficient
of ’Southwest entry (-1)’, which measures the ’effect’ of the new airline routes before their
introduction, is small and insignificant, suggesting that there are no pre-existing trends in
the data. It is only once Southwest opens the route that the coefficients turn positive and
statistically significant.
In an additional test of our identification strategy, Figure 1 explores the presence of a
pre-trend in the data by plotting the regression coefficient estimates for the 5 years before
and 5 years after Southwest entry. We again see no pre-trend before Southwest launches the
route. It is only after the new route is available that the estimated yearly coefficients are
positive and steadily increasing in their magnitude.
17Other studies find comparable effects when looking at the impact of communication costs and searchcost on collaboration: for instance, Agrawal & Goldfarb (2008) find that Bitnet increased the likelihood ofcollaboration between pairs of universities by 40%; Boudreau et al. (2014) find that a 90-minute structuredinformation sharing session leads to a 75% higher probability of co-applying for a grant.
12
Overall, we believe results in Table 4 and Figure 1 provide robustness to our interpretation
of the main effect, and reassure us that we are not simply measuring some underlying,
unobservable process that takes place with each entry (as we observe Southwest arrival
across multiple locations and years), and drives both Southwest decisions and the increase
in scientific collaboration.
4.3.2 Quality Effects, Portfolio Adjustments and Intensive versus Extensive
Margin
Until this point we have documented a tangible increase in the number of collaborations
between scientists following the introduction of a cheaper route between them. On the one
hand, one may worry that these are just marginal collaborations, and therefore less valuable
from a scientific viewpoint. On the other hand, if face-to-face meetings substantially improve
knowledge production (e.g., because of better monitoring, communication of complex ideas,
coordination etc.), then we would expect these additional collaborations to be of higher
average quality. Moreover, if cheaper access to temporary co-location is important enough
to shift the choice between alternative, distant research projects, scientists may adjust their
collaboration portfolio in response to lower prices.
[Insert table 5 about here]
In Table 5, we weight our dependent variable, copublications, by citations received (a
proxy for scientific impact and quality): whereas our main effect translated into a 50%
increase in collaborations when every scientific paper is considered the same, the increase is
closer to 80% when output is weighted by citations. This is inconsistent with the additional
collaborations being lower quality ones, and supports the idea that scientists may be able to
do higher quality work, select better collaboration opportunities, or potentially both when
travel costs are reduced.
In column (3), we explore if the cheaper fares crowd out collaborations with distant co-
authors not affected by Southwest entry. While we do not find a decline in collaboration
(distant copublications increase by approximately 11%), we do not observe a disproportionate
increase in collaboration when we weight papers by citations (column (4)), similar to the
one we found in columns (1) and (2). It is important to stress that we only observe research
projects that ultimately end up in a publication, so crowding out could still be taking place,
but we may not be able to fully capture it.
[Insert table 6 about here]
13

In Table 6 we decompose the effect between pairs of scientists who collaborate both
before and after Southwest entry (intensive margin pairs) versus pairs of scientists who
collaborate either before or after entry, but not both (extensive margin pairs). We find a
stronger effect for intensive margin pairs (column (2)), consistent with the idea that even a
few, additional face-to-face meetings could have a tangible impact on the rate of scientific
collaboration. Interestingly, cheaper fares also seem to enable experimentation in the form
of new collaborations over distance (column (3)).
The evidence from the full sample suggests that cheaper fares not only facilitated more
collaborations over distance, but also higher quality ones. While we observe an increase in
terms of copublications counts on both margins, larger effects on the intensive margin are
consistent with established pairs being more responsive to the availability of cheaper flights.
This is consistent with selection, as scientists that have already collaborated may incur lower
costs when adding a new project with the same distant scientist. On the intensive margin,
moreover, air travel costs may represent a larger relative share of the total, incremental costs
of an additional collaboration. Established co-author pairs may also become more efficient
at using temporary co-location to push projects forward or may derive higher consumption
utility from spending time together. This generates conflicting predictions in terms of output
quality, as in the first case (efficiency story) we would expect intensive margin collaborations
to generate higher quality work when the cheaper fares become available, whereas in the
second case (consumption utility story) we would observe the exact opposite.
Columns (5) and (6), while not conclusive, are suggestive of extensive margin pairs (col-
umn (6)) producing higher quality collaborations after Southwest entry. The coefficient in
column (5) is smaller and not significant, which may mean that both the efficiency and the
consumption utility story are present within the same sample, or that we simply we do not
have enough observations to estimate the effect precisely. The higher coefficient in column
(6) is also consistent with selection, i.e. conditional on starting a new collaboration over
distance, given that setup costs may be higher, we would expect outputs to be of higher
average quality.
4.3.3 Heterogeneous Effects as a Function of Scientist Characteristics
Taken together, results in Table 6 hint at potential arbitrage opportunities opened up by
the lower fares: scientists may be able to find better matches over distance when travel costs
drop, i.e. when the frictions introduced by geographic distance are reduced.
[Insert table 7 about here]
14

In Table 7 we directly test what types of scientists are more likely to benefit from this
reduction in costs due to geographic distance. Not surprisingly, younger scientists, who may
have more difficulty accessing funding, are more responsive to the cheaper fares (column
(1)). While the main coefficient is still statistically significant on its own (albeit with a lower
estimated value), the interaction term that includes the subset of pairs where both are less
than 50 years of age is three times larger than the main effect. This is consistent with our
interpretation that the fares had a causal effect on the rate of scientific collaboration.
Furthermore, in column (2) we observe that the effect is entirely driven by pairs where at
least one of the two individuals is more productive than the local departmental peers, and is
particularly strong when both scientists are more productive than their peers. Cheaper fares
seem to help individuals that are talented, but potentially do not have access to co-authors of
comparable quality within their local environment. They might be in peripheral institutions
because of mismatches in the labor market for scientific talent within chemistry, or because
of their geographic preferences. As travel cost drop and geography becomes less important
(potentially also because of the complementary role of the internet) these individuals are
able to find and sustain better matches over distance.
Another dimension along which arbitrage opportunities may arise as travel costs drop is
across different areas of expertise. In column (3), we test whether the effect of Southwest
entry was stronger for scientists more distant in knowledge space, as proxied by publishing
in different subfields of chemistry. Collaborations between different subdisciplines may also
benefit disproportionally from face-to-face meetings because of a greater need to exchange
complex information that is less familiar to at least one of the collaborators, or these pairs
may be simply collaborating to access specialized equipment or expertise not available lo-
cally. We find a stronger effect of Southwest entry for collaborations that are distant in
scientific space, which again is consistent with lower travel costs opening up different types
of collaboration opportunities.
In columns (4) and (5) we respectively interact the Southwest entry dummy with depart-
ments below median R&D budgets and at different levels of distance: while the coefficients
are positive and in the expected direction, results are fairly noisy and not significant. At
least, the results point in the direction that scientists with more severe budget constraints or
that are more distant (where travel costs are likely to play a larger role) benefit more from
Southwest.
The last column of Table 7, which includes all our interactions, summarizes the key
findings of this section: Southwest entry is associated with an increase in collaboration
among younger, more productive scientists, potentially at the cost of collaborations between
15
scientists that do not fit this pattern (the baseline in column (6) is negative and significant).
Cheaper fares, by lowering the cost of collaboration over distance (and allowing for additional
face-to-face meetings) have a tangible effect on the rate and direction of scientific research
within chemistry.
5 Conclusion
In this paper, we investigated the effects of a reduction in air travel costs on the rate and
direction of scientific research. We rely on the differential timing of entry of a low-cost carrier
(Southwest Airlines) across multiple U.S. locations to estimate if and how a reduction in air
fares influences scientific collaboration.
Our difference-in-differences empirical strategy, combined with our robustness tests, sup-
ports the idea that the availability of cheaper fares has a causal effect on the rate at which sci-
entists collaborate. The effect is present across multiple fields of science (chemistry, physics,
biology and engineering), and is robust to controlling for idiosyncratic scientist-pair char-
acteristics, trends in collaboration over time, and department R&D budgets. Moreover,
consistent with a causal interpretation, we do not observe a pre-trend in collaboration be-
tween scientist pairs that are going to experience Southwest entry in the future.
Using a fine-grained, scientist-level dataset covering all U.S. chemistry faculty members
(1991-2013), we show that the entry of a low-cost carrier did not induce marginal, lower-
quality collaborations: when we weight scientific output by citations, our estimates suggest
an 80% increase in quality-adjusted publications. Interestingly, whereas the increase in
raw output predominantly comes from established co-author pairs (intensive margin), the
quality result seems to be stronger for scientist pairs deciding to collaborate for the first
time (extensive margin). This is consistent with existing collaborators incurring lower costs
when adding additional projects (e.g., because of learning effects, efficiency improvements
over time or simply because of higher consumption utility), but also with the cheaper fares
enabling collaborations between scientists that would have not worked together otherwise.
Our results support the idea that as frictions due to geographic distance are reduced, sci-
entists are able to adjust their collaboration portfolios accordingly, potentially finding better
matches over distance. Whereas in Agrawal & Goldfarb (2008)’s paper the democratization
in the production of new scientific knowledge is the result of a reduction in communication
costs (the introduction of Bitnet, an internet predecessor), in our paper similar effects arise
from a drop in travel costs.
16

Cheaper air travel, by counterbalancing how geographic distance constrains collaboration
choices at stages when face-to-face interactions cannot be substituted for remote interactions,
may have a significant effect on the generation and recombination of scientific knowledge. Our
results point to younger scientists, scientists that have less access to funding, and scientists
that are more productive than their local peers as the main beneficiaries of the reduction in
travel costs. Given that the savings involved are relatively modest relatively to the overall
cost of a research project in the fields we studied, a potential policy implication of our results
would be to support scientists with limited budgets through travel grants.
17
References
Adams, J. D., Black, G. C., Clemmons, J. R., & Stephan, P. E. (2005). Scientific teams
and institutional collaborations: Evidence from US universities, 19811999. Research policy,
34(3), 259-285.
Agrawal, A., & Goldfarb, A. (2008). Restructuring Research: Communication Costs and
the Democratization of University Innovation. American Economic Review, 98(4), 1578-90.
Bernstein, S., Giroud, X., & Townsend, R. R. (2015). The Impact of Venture Capital
Monitoring. The Journal of Finance.
Borenstein, S., & Rose, N. L. (2007). How airline markets work... or do they? Regulatory
reform in the airline industry. No. w13452. National Bureau of Economic Research.
Boudreau, K. J., Brady, T., Ganguli, I., Gaule, P., Guinan, E., Hollenberg, T., & Lakhani,
K. (2014). A field experiment on search costs and the formation of scientific collaborations.
Available at SSRN 2486068.
Catalini, C. (2015). Microgeography and the direction of inventive activity. Rotman
School of Management Working Paper, (2126890).
Ding, W. W., Levin, S. G., Stephan, P. E., & Winkler, A. E. (2010). The impact
of information technology on academic scientists’ productivity and collaboration patterns.
Management Science, 56(9), 1439-1461.
Forman, C., & Zeebroeck, N. V. (2012). From wires to partners: How the Internet has
fostered R&D collaborations within firms. Management science, 58(8), 1549-1568.
Freeman, R. B., Ganguli, I., & Murciano-Goroff, R. (2014). Why and wherefore of
increased scientific collaboration (No. w19819). National Bureau of Economic Research.
Gaspar, J., & Glaeser, E. L. (1998). Information technology and the future of cities.
Journal of Urban Economics, 43(1), 136-156.
Goolsbee, A., & Syverson, C. (2008). How Do Incumbents Respond to the Threat of
Entry? Evidence from the Major Airlines. The Quarterly Journal of Economics, 123(4),
1611-1633.
Hamermesh, D., & Oster, S. (2002) ”Tools or Toys? The Impact of High Technology on
Scholarly Productivity” Economic Inquiry 40(4):539-555
Jones, B. F. (2009). The burden of knowledge and the death of the renaissance man: Is
innovation getting harder? The Review of Economic Studies, 76(1), 283-317.
18
Jones, B.F., Wuchty, S., Uzzi, B. (2008). Multi-University Research Teams: Shifting
Impact, Geography and Stratification in Science. Science 322(5905), 1259-1262
Katz, J. (1994). Geographical proximity and scientific collaboration. Scientometrics,
31(1), 31-43.
Kim, E. H., Morse, A., & Zingales, L. (2009). Are elite universities losing their competi-
tive edge? Journal of Financial Economics, 93(3), 353-381.
Mairesse, J., & Turner, L. (2005). Measurement and explanation of the intensity of co-
publication in scientific research: An analysis at the laboratory level. NBER Working Paper
No 11172. National Bureau of Economic Research.
Morrison, S. A. (2001). Actual, adjacent, and potential competition: Estimating the full
effect of Southwest Airlines. Journal of Transport Economics and Policy, 239-256.
Perry, M. (2014) “The cost of air travel in the US has been remarkably stable for
the last decade, and 17% cheaper than 20 years ago” Carpe Diem, Blog of American
Entreprise Institute. https://www.aei.org/publication/the-cost-of-air-travel-in-the-us-has-
been-remarkably-stable-for-the-last-decade-and-17-cheaper-than-20-years-ago/ accessed March
17, 2016
Rosenblatt T. & Mobius M. (2004) Getting closer or drifting apart? Quarterly Journal
of Economics 119(3):971-1009
Stephan, P. E. (2012). How Economics Shapes Science. Cambridge, MA: Harvard Uni-
versity Press.
Storper, M., & Venables, A. J. (2004). Buzz: face-to-face contact and the urban economy.
Journal of Economic Geography, 4(4), 351-370.
Transportation Research Board, National Research Council (1999): Entry and Compe-
tition in the US Airline Industry: Issues and Opportunities. Washington, DC: National
Academy Press
Wuchty, S., Jones, B. F., & Uzzi, B. (2007). The increasing dominance of teams in
production of knowledge. Science, 316(5827), 1036-1039.
19

Tables and Figures
Table 1: Summary statistics
Variable Obs Mean Std. Dev. Min Max P25 P50 P75
Individual scientist levelAge 890 49.7 11.2 27 85 41 49 58Female 890 .10 .30 0 1 0 0 0Average R&D budget 890 285.32 4 258.33 .55 2944 122.63 212.85 370.70in dept. (1000s USD)Speciality:
Physical chemistry 890 .32 .47 0 1 0 0 1Biochemistry 890 .23 .42 0 1 0 0 0Inorganic chemistry 890 .13 .34 0 1 0 0 0Organic chemistry 890 .14 .34 0 1 0 0 0Material science 890 .11 .31 0 1 0 0 0Other 890 .08 .26 0 1 0 0 0
Individual-pair levelYear of SW entry 819 2001 4.3 1994 2011 1999 1999 2005Distance (in miles) 819 1151 829.9 49 5086 443.5 878.1 1806.6Years in sample 819 17 4.6 4 22 14 18 22Total copublications 819 1.9 3.3 1 65 1 1 2Copub. both before and after 819 .09 .28 0 1 0 0 0In different field of chemistry 819 .45 .5 0 1 0 0 1
Individual-pair-year levelCopublications 14187 .11 .41 0 13 0 0 0Cites-weighted copublications 14187 4.1 27.8 0 1487 0 0 0Dummy for any copublication 14187 .08 .28 0 1 0 0 0
20
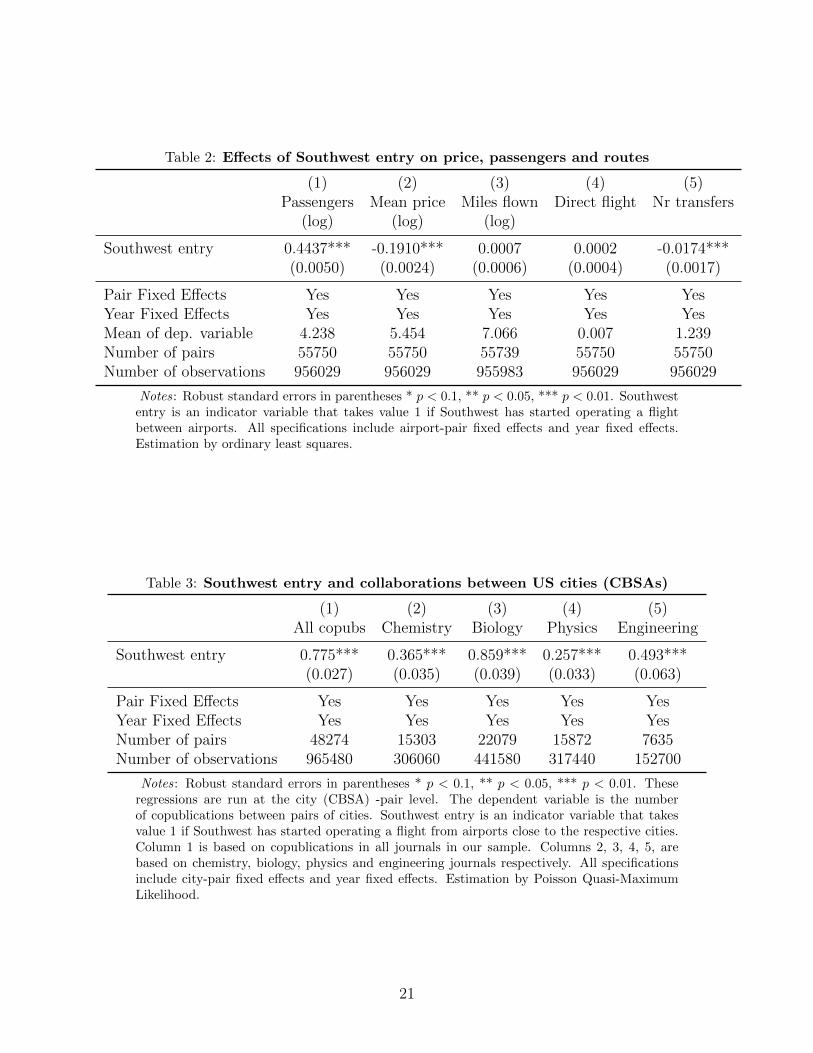
Table 2: Effects of Southwest entry on price, passengers and routes
(1) (2) (3) (4) (5)Passengers Mean price Miles flown Direct flight Nr transfers
(log) (log) (log)
Southwest entry 0.4437*** -0.1910*** 0.0007 0.0002 -0.0174***(0.0050) (0.0024) (0.0006) (0.0004) (0.0017)
Pair Fixed Effects Yes Yes Yes Yes YesYear Fixed Effects Yes Yes Yes Yes YesMean of dep. variable 4.238 5.454 7.066 0.007 1.239Number of pairs 55750 55750 55739 55750 55750Number of observations 956029 956029 955983 956029 956029
Notes: Robust standard errors in parentheses * p < 0.1, ** p < 0.05, *** p < 0.01. Southwestentry is an indicator variable that takes value 1 if Southwest has started operating a flightbetween airports. All specifications include airport-pair fixed effects and year fixed effects.Estimation by ordinary least squares.
Table 3: Southwest entry and collaborations between US cities (CBSAs)
(1) (2) (3) (4) (5)All copubs Chemistry Biology Physics Engineering
Southwest entry 0.775*** 0.365*** 0.859*** 0.257*** 0.493***(0.027) (0.035) (0.039) (0.033) (0.063)
Pair Fixed Effects Yes Yes Yes Yes YesYear Fixed Effects Yes Yes Yes Yes YesNumber of pairs 48274 15303 22079 15872 7635Number of observations 965480 306060 441580 317440 152700
Notes: Robust standard errors in parentheses * p < 0.1, ** p < 0.05, *** p < 0.01. Theseregressions are run at the city (CBSA) -pair level. The dependent variable is the numberof copublications between pairs of cities. Southwest entry is an indicator variable that takesvalue 1 if Southwest has started operating a flight from airports close to the respective cities.Column 1 is based on copublications in all journals in our sample. Columns 2, 3, 4, 5, arebased on chemistry, biology, physics and engineering journals respectively. All specificationsinclude city-pair fixed effects and year fixed effects. Estimation by Poisson Quasi-MaximumLikelihood.
21

Table 4: Effect of Southwest entry on co-publications at the individual-pairlevel
DV=Co-publications (1) (2) (3)Southwest entry 0.482*** 0.493***
(0.118) (0.117)
Dept R&D budget per faculty (log) 0.352***(0.123)
Southwest entry (-1) 0.041(0.148)
Southwest entry (0) 0.485***(0.146)
Southwest entry (1) 0.405**(0.162)
Southwest entry (2+) 0.564***(0.175)
Pair Fixed Effects Yes Yes YesYear Fixed Effects Yes Yes YesNumber of pairs 819 816 819Number of observations 14187 14147 14187
Notes: Robust standard errors in parentheses * p < 0.1, ** p < 0.05, *** p < 0.01. Thedependent variable is the number of copublications between pairs of scientists. Southwestentry is an indicator variable that takes value 1 if Southwest has started operating a flightfrom airports close to the respective scientists. SW entry (-1) is an indicator variable if theobservation is in the year preceding SW entry. SW entry (0) SW entry (1) SW entry (2+) aredefined analogously for the year of SW entry, the year after SW entry, and two years or moreafter SW entry, respectively. All specifications include individual-pair fixed effects and yearfixed effects. Estimation by Poisson Quasi-Maximum Likelihood.
22

Figure 1: Dynamics of the effect of Southwest entry
0
.2
.4
.6
.8
1
Copubs
−5 −4 −3 −2 −1 0 1 2 3 4 5
Years to/since Southwest entry
Notes: To generate this graph, we regress individual copublications on year fixed effects, pair effects and
a set of indicator variables corresponding to 4 years before SW entry, 3 years before SW entry, ..., 4 years
after SW entry, 5 years after SW entry (5 years before SW entry omitted). We then plot the coefficients
associated with these indicator variables against time from/to Southwest entry, superimposing a linear fit
line before entry and after entry.
Table 5: Effect of Southwest entry on cites-weighted co-publications, andother publications of the pair members
(1) (2) (3) (4)Copublications Copublications Other publications Other publications
(cites-weighted) (cites-weighted)Southwest entry 0.482*** 0.794*** 0.110*** 0.104***
(0.118) (0.185) (0.019) (0.032)
Pair Fixed Effects Yes Yes Yes YesYear Fixed Effects Yes Yes Yes YesNumber of pairs 819 798 819 819Number of obs. 14187 13807 14187 14187
Notes: Robust standard errors in parentheses * p < 0.1, ** p < 0.05, *** p < 0.01. Southwestentry is an indicator variable that takes value 1 if Southwest has started operating a flight fromairports close to the respective scientists. Other publications is defined as the publications ofthe first pair members plus the publications of the second pair member minus twice the numberof copublications between them. All specifications include individual-pair fixed effects and yearfixed effects. Estimation by Poisson Quasi-Maximum Likelihood.
23

Table 6: Effect of Southwest entry on co-publications - intensive and exten-sive margin
Copublications Cites-weighted copublications(1) (2) (3) (4) (5) (6)All Intensive Extensive All Intensive Extensive
Southwest entry 0.482∗∗∗ 0.746∗∗∗ 0.390∗∗∗ 0.794∗∗∗ 0.436 0.858∗∗∗
(0.118) (0.232) (0.131) (0.185) (0.365) (0.194)
Pair Fixed Effects Yes Yes Yes Yes Yes YesYear Fixed Effects Yes Yes Yes Yes Yes YesNumber of pairs 819 71 748 798 71 727Number of observations 14187 1284 12903 13807 1284 12523
Notes: Robust standard errors in parentheses * p < 0.1, ** p < 0.05, *** p < 0.01. Thedependent variable is the number of copublications between pairs of scientists (columns 1-3)or cites-weighted copublications (columns 4-6). Southwest entry is an indicator variable thattakes value 1 if Southwest has started operating a flight from airports close to the respectivescientists. Column 1 is the baseline specification. Column 2 and 5 restricts the sample topairs of scientists who collaborate both before and after Southwest entry, while column 3 andrestrict the sample to pairs of scientists who collaborate either before or after entry, but notboth. All specifications include individual-pair fixed effects and year fixed effects. Estimationby Poisson Quasi-Maximum Likelihood.
24
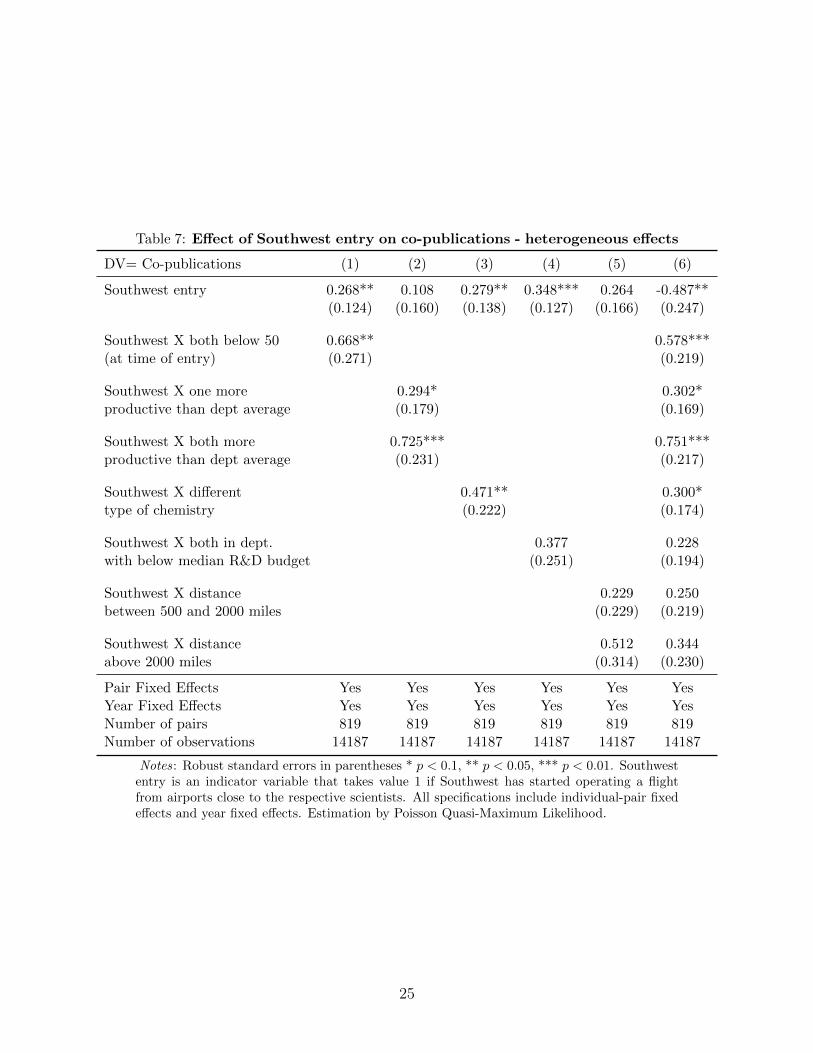
Table 7: Effect of Southwest entry on co-publications - heterogeneous effects
DV= Co-publications (1) (2) (3) (4) (5) (6)
Southwest entry 0.268** 0.108 0.279** 0.348*** 0.264 -0.487**(0.124) (0.160) (0.138) (0.127) (0.166) (0.247)
Southwest X both below 50 0.668** 0.578***(at time of entry) (0.271) (0.219)
Southwest X one more 0.294* 0.302*productive than dept average (0.179) (0.169)
Southwest X both more 0.725*** 0.751***productive than dept average (0.231) (0.217)
Southwest X different 0.471** 0.300*type of chemistry (0.222) (0.174)
Southwest X both in dept. 0.377 0.228with below median R&D budget (0.251) (0.194)
Southwest X distance 0.229 0.250between 500 and 2000 miles (0.229) (0.219)
Southwest X distance 0.512 0.344above 2000 miles (0.314) (0.230)
Pair Fixed Effects Yes Yes Yes Yes Yes YesYear Fixed Effects Yes Yes Yes Yes Yes YesNumber of pairs 819 819 819 819 819 819Number of observations 14187 14187 14187 14187 14187 14187
Notes: Robust standard errors in parentheses * p < 0.1, ** p < 0.05, *** p < 0.01. Southwestentry is an indicator variable that takes value 1 if Southwest has started operating a flightfrom airports close to the respective scientists. All specifications include individual-pair fixedeffects and year fixed effects. Estimation by Poisson Quasi-Maximum Likelihood.
25
6 Appendix
Table A1: Effect of Southwest entry on co-publications - Alternative func-tional forms
(1) (2) (3)Poisson OLS OLS
Copublications Copublications Any copublication
Southwest entry 0.482∗∗∗ 0.049∗∗∗ 0.027∗∗∗
(0.118) (0.014) (0.010)
Pair Fixed Effects Yes Yes YesYear Fixed Effects Yes Yes YesNumber of pairs 819 819 819Number of obs. 14187 14187 14187
Notes: Robust standard errors in parentheses * p < 0.1, ** p < 0.05, *** p < 0.01. Southwestentry is an indicator variable that takes value 1 if Southwest has started operating a flightfrom airports close to the respective scientists. Column 1 is the baseline regression at theindividual pair level (estimated by Poisson Quasi-Maximum Likelihood.) Column 2 estimatesthe same specification with ordinary least squares. Column 3 is a linear probability model withan indicator variable for any copublication.
Table A2: Stability of results across different subfields of chemistry
(1) (2) (3) (4) (5)DV=copublications Physical Biochemistry Inorganic Material Organic
chemistry chemistry Science Chemistry
Southwest entry 0.496*** 0.387* 0.477** 0.527** 0.646***(0.180) (0.206) (0.243) (0.233) (0.247)
Pair Fixed Effects Yes Yes Yes Yes YesYear Fixed Effects Yes Yes Yes Yes YesNr of pairs 392 217 166 133 175Nr of observations 7010 3587 2922 2252 3066
Notes: Robust standard errors in parentheses * p < 0.1, ** p < 0.05, *** p < 0.01. Southwestentry is an indicator variable that takes value 1 if Southwest has started operating a flight fromairports close to the respective scientists. Estimation by Poisson Quasi-Maximum Likelihood.
26

Table A3: Using journals to define field of specialization
Field Journal (examples)Biochemistry Journal of Biological Chemistry, BiochemistryInorganic Chemistry Inorganic ChemistryMaterial Science Macromolecules, Advanced MaterialsPhysical Chemistry Journal of Physical ChemistryOrganic Chemistry Journal of Organic Chemistry, Organic Letters
The area of specialization for a given faculty member is inferred from the journalss/he publishes in. For instance, a faculty member who publishes often in the Journal ofBiological Chemistry is assumed to be specialized in biochemistry.
27