Embed Size (px)
Citation preview

Dielectric Materials inMagnetic ResonanceA.G. WEBB
Department of Radiology, C.J. Gorter Center for High Field MRI, Leiden University Medical Center,Leiden, The Netherlands
ABSTRACT: High permittivity materials find extensive use in high frequency communica-
tions devices due to their small size (compared to lumped element circuits), low losses and
physical robustness. Recently, these types of materials have been applied in high field mag-
netic resonance imaging, based upon earlier work in electron paramagnetic resonance. This
review article describes the basic properties of high permittivity materials, how they can be
formed into both discrete resonators and also into deformable water-based suspensions, and
how these different structures can be used to improve many aspects of high frequency mag-
netic resonance. � 2011 Wiley Periodicals, Inc. Concepts Magn Reson Part A 38: 148–184, 2011.
KEY WORDS: dielectric; permittivity; RF coils; high field MRI
1. INTRODUCTION – WHAT IS A DIELECTRIC
MATERIAL?
With the continuing trend towards ever higher mag-
netic fields, whether for high resolution and solid
state nuclear magnetic resonance (NMR), human and
animal magnetic resonance imaging (MRI), or elec-
tron paramagnetic resonance (EPR), high permittivity
materials are finding increasing utility in producing
and shaping the electromagnetic (EM) fields used for
pulse transmission and signal reception.
The fact that high permittivity materials are efficient
magnetic field storage devices suggests that they could
be used in place of the more traditional conductor-
based radiofrequency (RF) coils, particularly for high
frequency applications. An example is shown in Figure
1(a). Alternatively, the incorporation of high dielectric
materials into a conventional RF probe (for example,
either by providing a dielectric liner to the coil, or by
filling the space between coil and shield) can signifi-
cantly change the distribution of magnetic and electric
fields within the sample. Finally, the placement of
‘‘pads’’ of high dielectric material around the sample,
in particular human subjects in high field (7 T and
above) MRI systems, can be used to ‘‘tailor’’ the distri-
bution and/or increase the homogeneity of the mag-
netic component of the RF field. A photograph of such
‘‘dielectric pads’’ is shown in Figure 1(b).
This review article first considers the basic proper-
ties of dielectrics at the molecular level to explain
why certain materials have very high permittivities,
and the behavior of the permittivity as a function of
frequency. The low-frequency characteristics of
dielectrics in capacitors, and the high frequency
behavior in terms of conduction and displacement
currents are then discussed. The design, construction
and characterization of dielectric resonators follows
with a brief review of the literature in terms of their
applications to EPR and high field MR microimag-
Received 24 March 2011; revised 22 May 2011;
accepted 20 June 2011
Correspondence to: AndrewWebb; E-mail: [email protected]
Concepts inMagnetic Resonance Part A, Vol. 38A(4) 148–184 (2011)
Published online in Wiley Online Library (wileyonlinelibrary.com). DOI 10.1002/cmr.a.20219
� 2011 Wiley Periodicals, Inc.
148

ing. Next, the incorporation of high dielectric materi-
als into high field MRI of humans is discussed.
Finally, some projected ideas about future applica-
tions of high permittivity materials in MR are pro-
vided. The material covered particularly with respect
to the role of dielectric materials in basic electromag-
netics, can be supplemented by classical texts such as
Kraus and Fleisch (1).
2. MATERIAL PROPERTIES OF DIELECTRICS
All materials have an absolute measure of permittivity
(e), and also a relative permittivity (er) which is meas-
ured relative to that of vacuum (e0¼8.854� 1012 F/m):
er ¼ ee0
[1]
Values of er range from 1 to 10 for many plastics,
10–100 for polar solvents including (very importantly
for MR applications) water, 100 to several thousand
for inorganic compounds such as perovskites (‘‘Perov-
skites—Inorganic Materials with High Permittivities’’
section), and above 10,000 for specialized materials
which exhibit what is known as ‘‘giant permittivity’’
(‘‘New Materials with Very High Permittivities’’ sec-
tion). Permittivity is a complex quantity, i.e., it has
both real (e0) and imaginary (e@) components, and is
often temperature and frequency dependent.
A dielectric material is one that can store energy
when an external electric field is applied. Small dis-
placements of atoms/ions and/or orientation of these
atoms/ions within the material lead to ‘‘polarization.’’
To what extent a material can be polarized in this
way is expressed by its permittivity or dielectric con-
stant. Although the two terms are technically equiva-
lent and interchangeable, the term permittivity is pre-
ferred since it does not imply a constant value which
is independent of external parameters such as fre-
quency and temperature, which is not the case.
Materials with a high permittivity find extensive
use within satellite, microwave and RF devices. They
form components of filter, oscillator and mixer cir-
cuits, as well as many others in which a resonant
structure is required. They are characterized by hav-
ing low losses which aids in constructing narrowband
filters for both transmission and reception, and have
very similar frequency characteristics to waveguide
filters, for example, but are much smaller in size due
to the high permittivity of the materials involved.
High permittivity materials are generally formed into
rectangular, cylindrical or (hemi-) spherical resonant
structures, acting effectively as ‘‘storage’’ or ‘‘con-
centrators’’ of both electric and magnetic fields. In
addition to forming circuit components, they can also
be used as very small transmission devices in the
form of dielectric resonator antennas.
Dielectric materials are also used in the construc-
tion of capacitors, and indeed for most engineers the
most common place in which dielectrics are found in
MR is in the nonmagnetic capacitors that are used to
tune and impedance match RF coils. Such nonmag-
netic capacitors are produced by a number of compa-
nies worldwide. In addition to high permittivity,
these materials must have a high breakdown voltage,
Figure 1 (a) A ceramic dielectric resonator made from sintered and pressed calcium titanate
powder, designed for operation at 14.1 T (600 MHz). (b) Dielectric pads consisting of a suspension
of calcium titanate powder in deuterated water, used for human imaging at 7 T (298.1 MHz).
DIELECTRIC MATERIALS IN MAGNETIC RESONANCE 149
Concepts in Magnetic Resonance Part A (Bridging Education and Research) DOI 10.1002/cmr.a

high mechanical stability, and have a permittivity
which is as independent of temperature as possible.
Electric Dipole Moments andPolarizabilities of Materials
To illustrate the fundamentals of dielectric materials,
consider three different molecules shown in Figure 2:
carbon tetrachloride (CCl4), water, and titanium
dioxide. The polarity of a molecule can be quantified
in terms of an electric dipole moment (p). For two
charges q (Coulombs), which are separated by a posi-
tion vector d, the value of p is given by:
p!¼ q~d [2]
The dipole moment has units of Debyes, with one
Debye equal to 3.33 � 10–30 Coulomb metres. For a
symmetric nonpolar compound such as CCl4 shown
in Figure 2(a), the centres of gravity of the positive
and negative charges are identical, and therefore there
is zero dipole moment. In contrast, water has a large
dipole moment (1.85 Debyes) due to the strong elec-
tronegativity of the oxygen atom relative to the hydro-
gen, as well as a highly nonsymmetric molecular ge-
ometry, as shown in Figure 2(b). Another class of
materials with high electric dipole moments are inor-
ganic compounds containing titanium oxides: the tita-
nate unit cell is shown in Figure 2(c). As discussed in
‘‘Perovskites—Inorganic Materials with High Permit-
tivities’’ section, the high permittivity (80–100) arises
from molecular distortions within the unit cell.
Appendix A Table A1 lists electric dipole
moments for a small selection of materials. Conside-
ring the simple chemical solvents shown in the
Appendix A Table A1, it is apparent that the more po-
lar the substance the greater the dipole moment.
However, even compounds such as CCl4 and C6H6,
which have zero dipole moment, do have a relative
permittivity which is greater than that of vacuum.
Therefore, in addition to the dipole moment, there
must be a second component to the permittivity,
described below, which is related to the polarizability.
As mentioned earlier the dielectric properties of
materials arise from their ‘‘reaction’’ to an applied
electric field. Depending upon the particular mole-cule there are a number of different mechanisms that
can give rise to an induced (and overall increased)electric dipole moment. The relationship between the
induced dipole moment (pind) and the electric field
(E) is quantified via the polarizability, a:
~pind ¼ e0a~E [3]
There are many mechanisms contributing to a com-
pound’s polarizability, the main ones of which are
listed below, and are shown schematically in Figure 3.
Electronic Polarizability. Consider the effects of
an electric field on the spherical orbital of an elec-
tron. The electrons experience a force (F) given by F¼ –eE, and as a result the orbital is spatially dis-
torted, as shown in Figure 3(a). The positive and neg-
ative charges are no longer spatially coincident and
this causes an electrostatic dipole moment (pelec) tobe formed with a value given by:
~pelec ¼ e0aelect~E [4]
where aelect is termed the electronic polarizability.
Figure 2 Three different molecules with (left) zero dipole moment, (centre) a high dipole
moment in a polar molecule, also showing the extensive hydrogen bonding in the bulk material,
and (right) a high dipole moment in an inorganic structure.
150 WEBB
Concepts in Magnetic Resonance Part A (Bridging Education and Research) DOI 10.1002/cmr.a

Ionic (or Atomic) polarizability. Refers to the
movement of atoms or ions within the lattice, again
caused by the external electric field. As shown sche-
matically in Figure 3(b) this motion can create an
electric dipole moment in symmetric molecules, and
can significantly increase its size in molecules with a
permanent electric dipole moment. An ionic dipole
moment is defined in terms of the ionic polarizabil-
ity, aionic, in exactly the same way as in Eq. [4].
Orientation (or Molecular or Dipole) polariz-ability. Refers to the phenomenon that if a polar
molecule with a permanent dipole moment (po) experi-ences an external electric field, then a torque (G) is
created which attempts to align the dipole with the
direction of the field. The torque produced is given by:
~G ¼ ~po ^ ~E [5]
The effect of the torque is to distort the molecule,
which produces an additional component porient in the
direction of the electric field, with a value propor-
tional to an orientational polarizability, aorient. Figure
3(c) shows this effect schematically for water mole-
cules, for which the orientation polarizability is par-
ticularly strong.
Interfacial (or Space-Charge) polarizability. Refers
to the action of charge carriers that can migrate short
distances within the material, as shown in Figure
3(d). Application of an electric field impedes the
motion of these carriers, resulting in a distortion of
the macroscopic field. In analogy to previous
equations, one can define an interfacial polarizability,
ainterface.
Assuming that the four contributions to polariza-
tion are independent, then the total polarizability of
the dielectric material is simply given by the sum of
the four separate mechanisms.
a ¼ aelec þ aionic þ aorient þ ainterface [6]
and the corresponding dipole moment by:
~p ¼ e0~E aelec þ aionic þ aorient þ ainterfaceð Þ [7]
In fact, many of the dielectric materials described
in this article are ‘‘directional dielectrics,’’ i.e., the
polarizatibility is not the same in each direction, and
therefore a full description of the dipole moment is
determined by the polarizability in tensor form:
~p ¼ e0a$~E; a
$ ¼axxaxyaxz
ayxayyayz
azxazyazz
24
35 [8]
where axy, for example, refers to the polarizability in
the x-direction induced by the y-component of the
electric field. For simplicity, the remainder of the ar-
ticle assumes that the direction-dependence of the
polarizability is small enough to be neglected.
For MR and EPR applications it is important to
consider the frequency dependence of these mecha-
nisms. In addition to different materials having very
different contributions from the respective polariz-
abilities, these contributions are also highly fre-
quency dependent. Interfacial polarization typically
has a strong contribution only at very low fre-
quencies (sub-MHz), whereas orientation, ionic and
Figure 3 Schematic illustration of the four most important polarizability mechanisms.
DIELECTRIC MATERIALS IN MAGNETIC RESONANCE 151
Concepts in Magnetic Resonance Part A (Bridging Education and Research) DOI 10.1002/cmr.a

electronic (in increasing order of frequency) can have
substantial contributions in the RF and microwave
frequency ranges. For frequencies in the hundreds of
MHz range (relevant to high field MR applications),
the two dominant mechanisms are ionic and elec-
tronic. A short summary of dielectric relaxation is
presented in Appendix B.
In a particular sample, the average electric dipole
moment per unit volume is termed the polarization (P).
~P ¼ N~p ¼ Na~E [9]
where N is the number of molecules per unit volume.
One can relate the polarization to the relative permit-
tivity of a material via its electric susceptibility we (ananalogue to magnetic susceptibility). In the first step,
the relationship between the polarization and total
electric field is given by:
~P ¼ e0we~E [10]
The electric displacement field (D) is defined by:
~D ¼ e0~Eþ ~P ¼ e0 1þ weð Þ~E [11]
D can also be expressed as:
~D ¼ e~E ¼ ere0~E [12]
and so:
er ¼ 1þ we ¼ 1þ~P
e0~E[13]
As would be expected, the larger the polarization
the higher the relative permittivity, with a linear rela-
tionship exhibited for high values of polarization.
Paraelectric, Ferroelectric andPiezoelectric Properties of Dielectrics
Dielectric materials can also be defined further in
terms of being paraelectric, ferroelectric and/or pie-
zoelectric. In a paraelectric material, polarization is
produced by the effect of an external applied electric
field, but the polarization is not retained when the
electric field is removed, as shown in Figure 4(a).
Mechanistically, any change in ionic displacement,
for example, returns to zero when the electric field is
switched off. In contrast, in a ferroelectric material
the polarization is retained when the electric field is
turned off, and ferroelectric materials display a hys-
teresis effect in the polarization, as shown in Figure
4(b). The applied electric field orders the permanent
electric dipoles within the material into domains, and
also aligns the domains themselves to produce a high
polarization. If the electric field is strong enough then
the material becomes saturated, with all the dipoles
fully aligned.
Many dielectrics can exist either in the paraelec-
tric or ferroelectric states depending upon the tem-
perature relative to the Curie temperature (Tc). AboveTc a material is paraelectric, whereas below Tc it is
ferroelectric. As shown in Figure 4(c) the permittiv-
ity changes rapidly close to the Curie temperature.
Ferroelectric materials, such as barium titanate
(covered in the next section), are typically crystal-
line, and have high permittivities (values over 1,000)
which are highly temperature and frequency depend-
ent: it should be noted that the prefix ‘‘ferro-’’ is a
historical misnomer in that most ferroelectric materi-
als do not, in fact, contain iron. Paraelectrics have
lower permittivities, which are much more constant
with respect to temperature and frequency than ferro-
electrics. Examples include tantalum oxide (er ¼ 23)
and niobium oxide (er ¼ 40).
Figure 4 (a) Polarization of a paraelectric material is linear with the applied electric field. (b)
Schematic of the hysteresis loop associated with ferroelectric behavior. (c) The temperature de-
pendence of the permittivity near the ferroelectric/paraelectric transition at the Curie temperature.
152 WEBB
Concepts in Magnetic Resonance Part A (Bridging Education and Research) DOI 10.1002/cmr.a

It should be noted that many high dielectric materi-
als are also piezoelectric. These types of materials pro-
duce a voltage when pressure is applied, and in a recip-
rocal manner an applied voltage causes the material to
change physical dimensions at the same frequency at
which the voltage is applied. These materials are used
extensively in ultrasound transducer design for medical
applications and nondestructive testing.
Perovskites—Inorganic Materialswith High Permittivities
Most applications of dielectrics in MR use materials
with high permittivity (er .100). One of the most im-
portant classes of high permittivity materials is the
perovskites, named after a renowned Russian miner-
alogist, Count Lev Alexevich von Perovski. This
class of compounds has an ABX3 chemical structure,
with A being a large metal cation which is close-
packed in layers with X ions (usually oxygen). B is a
smaller metal ion positioned in octahedrally-coordi-
nated holes between the close-packed layers: the gen-
eral structure of a perovskite is shown in Figure 5 (2).Barium titanate (BaTiO3) was the perovskite first
investigated in great detail, with early applications in
radar systems. The general structure is a network of
corner-linked anion octahedra, with the smaller cat-
ion filling the octahedral holes, and the larger cation
filling the dodecahedral holes, as shown in Figure 5.
Barium titanate exists in the paraelectric cubic phase
above its Curie temperature of 1208C, while between0 and 1208C the ferroelectric tetragonal phase is sta-
ble. The high permittivity of the material arises from
a structural change in which the central Ba and Ti
cations are displaced with respect to the oxygen ions,
the resulting reduction in symmetry leading to the
formation of large electric dipoles. Substitution of
different metals for Ba can change the Curie tem-
perature significantly. For example, replacing Ba
with strontium in the A-site reduces the Curie
temperature, whereas substituting Pb for Ba increases
it. The dielectric properties also depend on the
grain size of the material, with the highest permi-
ttivity found for very small (sub-micron-sized)
ceramics. This has been attributed (3) to the internal
stresses for the smaller particles being higher than for
larger particles.
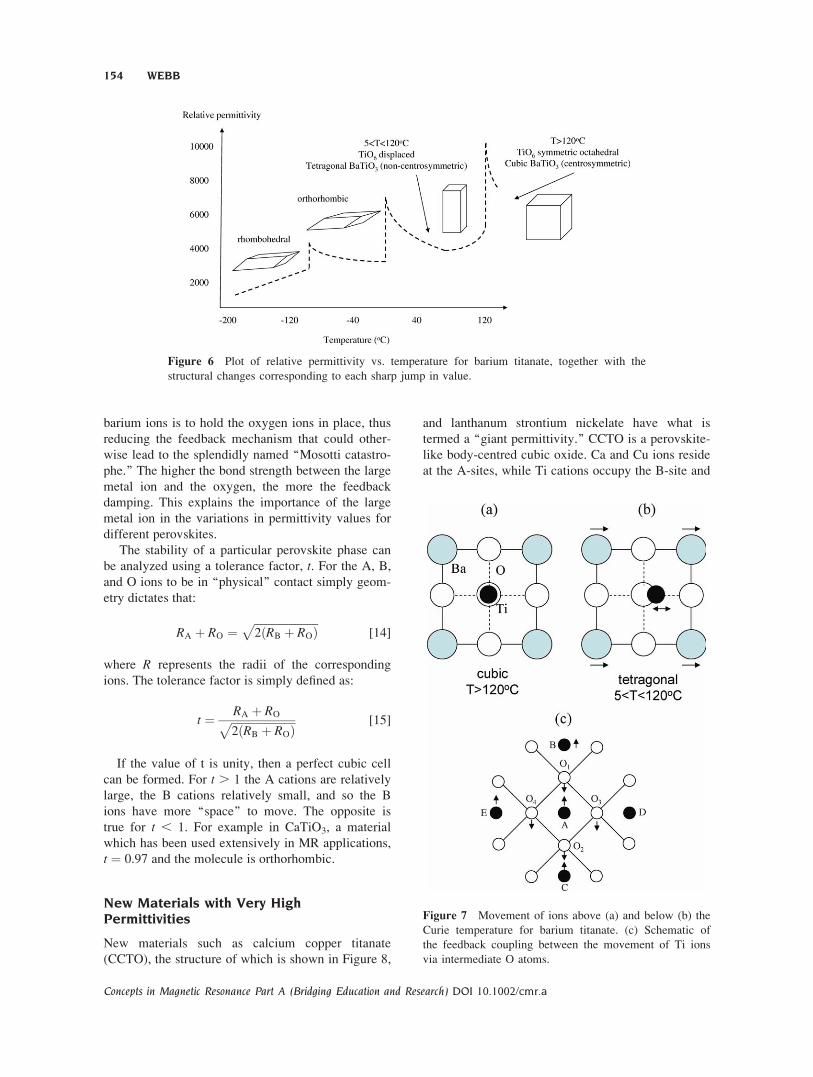
Major changes in structure are shown by sharp
jumps in the permittivity as a function of tempera-
ture, as shown in Figure 6. Of particular interest for
MR applications is its behavior between room tem-
perature and its Curie temperature of 1208C. AboveTc the thermal motions of the Ti atoms are sufficient
to be able to retain the ideal cubic perovskite struc-
ture. However, below Tc the residual strain in the unit
cell is too large, and the structure distorts.
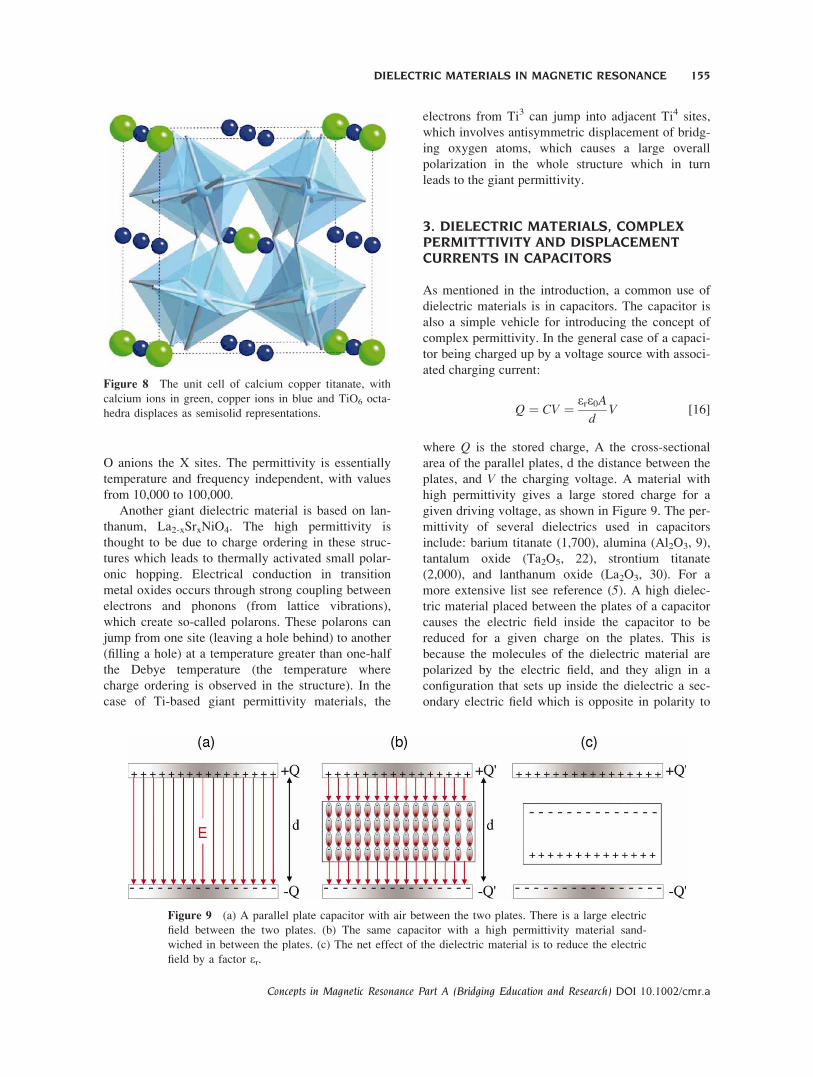
The ionic distortion in BaTiO3 is shown in more
detail in Figure 7. As shown in Figures 7(a,b) below
the Curie temperature, the central Ti atom shifts off-
centre, as well as smaller shifts occurring for the
barium atoms. In the perovskite structure all of the
octahedra are connected only at their corners and are
fixed in place by the A cations, so an efficient cou-
pling between the octahedra arises from any distur-
bance. Any displacement of a titanium ion has an
effective feedback mechanism via the oxygen lattice
which causes adjacent titanium ions to move in the
same direction, as shown in Figure 7(c). As described
by Hippel (4) as the titanium ion A moves towards
O1, the dipole moment between the two ions
becomes stronger and that between A and O2 weaker.
Therefore, O1 moves towards A and O2 away from it.
The result of this is that the two Ti ions, B and C,
both follow the motion of A. The titanium ions on
the side (D, E and their counterparts in the front and
back of the plane) also move in the same direction
due to the coupling O ions (O3, O4, etc.) moving
downwards due to repulsion from O1. The role of the
Figure 5 General structure of the perovskite, ABX3, with the particular example of barium
titanate shown. The barium atoms form a cubic structure, with the oxygen atoms forming a
tetragonal structure.
DIELECTRIC MATERIALS IN MAGNETIC RESONANCE 153
Concepts in Magnetic Resonance Part A (Bridging Education and Research) DOI 10.1002/cmr.a
barium ions is to hold the oxygen ions in place, thus
reducing the feedback mechanism that could other-
wise lead to the splendidly named ‘‘Mosotti catastro-
phe.’’ The higher the bond strength between the large
metal ion and the oxygen, the more the feedback
damping. This explains the importance of the large
metal ion in the variations in permittivity values for
different perovskites.
The stability of a particular perovskite phase can
be analyzed using a tolerance factor, t. For the A, B,
and O ions to be in ‘‘physical’’ contact simply geom-
etry dictates that:
RA þ RO ¼ffiffiffiffiffiffiffiffiffiffiffiffiffiffiffiffiffiffiffiffiffiffiffi2 RB þ ROð Þ
p[14]
where R represents the radii of the corresponding
ions. The tolerance factor is simply defined as:
t ¼ RA þ ROffiffiffiffiffiffiffiffiffiffiffiffiffiffiffiffiffiffiffiffiffiffiffi2 RB þ ROð Þp [15]
If the value of t is unity, then a perfect cubic cell
can be formed. For t . 1 the A cations are relatively
large, the B cations relatively small, and so the B
ions have more ‘‘space’’ to move. The opposite is
true for t , 1. For example in CaTiO3, a material
which has been used extensively in MR applications,
t ¼ 0.97 and the molecule is orthorhombic.
New Materials with Very HighPermittivities
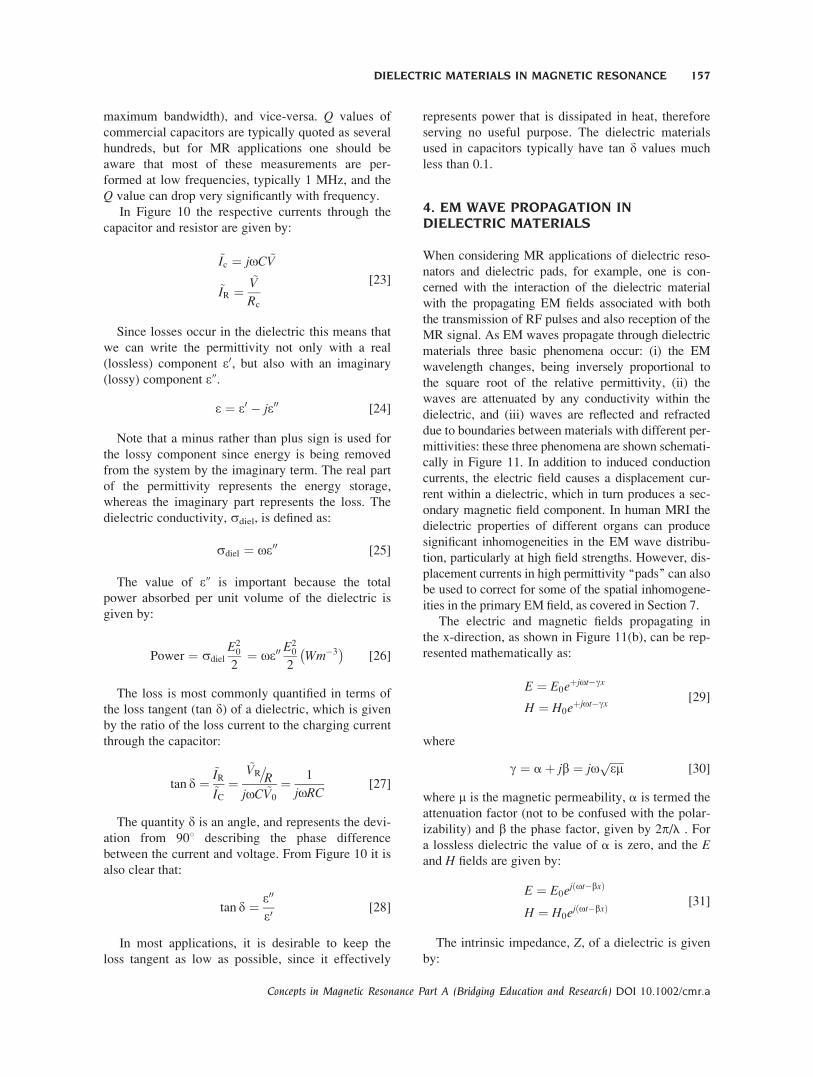
New materials such as calcium copper titanate
(CCTO), the structure of which is shown in Figure 8,
and lanthanum strontium nickelate have what is
termed a ‘‘giant permittivity.’’ CCTO is a perovskite-
like body-centred cubic oxide. Ca and Cu ions reside
at the A-sites, while Ti cations occupy the B-site and
Figure 6 Plot of relative permittivity vs. temperature for barium titanate, together with the
structural changes corresponding to each sharp jump in value.
Figure 7 Movement of ions above (a) and below (b) the
Curie temperature for barium titanate. (c) Schematic of
the feedback coupling between the movement of Ti ions
via intermediate O atoms.
154 WEBB
Concepts in Magnetic Resonance Part A (Bridging Education and Research) DOI 10.1002/cmr.a
O anions the X sites. The permittivity is essentially
temperature and frequency independent, with values
from 10,000 to 100,000.
Another giant dielectric material is based on lan-
thanum, La2-xSrxNiO4. The high permittivity is
thought to be due to charge ordering in these struc-
tures which leads to thermally activated small polar-
onic hopping. Electrical conduction in transition
metal oxides occurs through strong coupling between
electrons and phonons (from lattice vibrations),
which create so-called polarons. These polarons can
jump from one site (leaving a hole behind) to another
(filling a hole) at a temperature greater than one-half
the Debye temperature (the temperature where
charge ordering is observed in the structure). In the
case of Ti-based giant permittivity materials, the
electrons from Ti3 can jump into adjacent Ti4 sites,
which involves antisymmetric displacement of bridg-
ing oxygen atoms, which causes a large overall
polarization in the whole structure which in turn
leads to the giant permittivity.
3. DIELECTRIC MATERIALS, COMPLEXPERMITTTIVITY AND DISPLACEMENTCURRENTS IN CAPACITORS
As mentioned in the introduction, a common use of
dielectric materials is in capacitors. The capacitor is
also a simple vehicle for introducing the concept of
complex permittivity. In the general case of a capaci-
tor being charged up by a voltage source with associ-
ated charging current:
Q ¼ CV ¼ ere0Ad
V [16]
where Q is the stored charge, A the cross-sectional
area of the parallel plates, d the distance between the
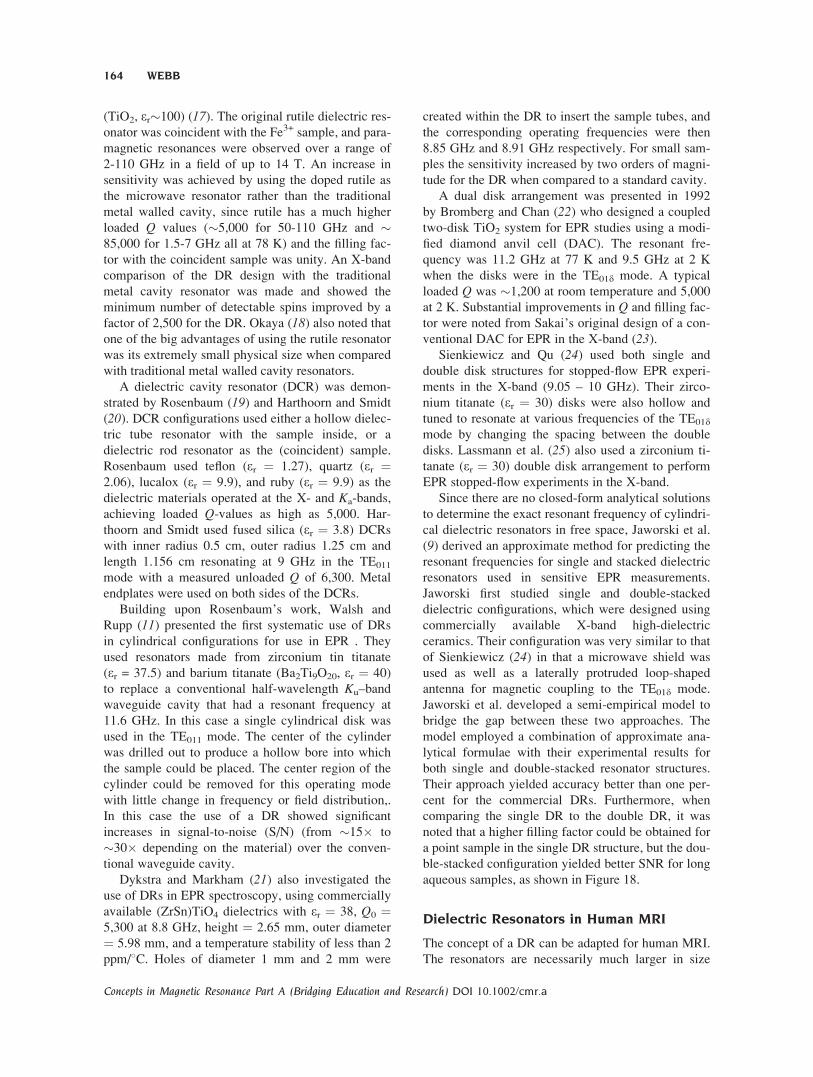
plates, and V the charging voltage. A material with
high permittivity gives a large stored charge for a
given driving voltage, as shown in Figure 9. The per-
mittivity of several dielectrics used in capacitors
include: barium titanate (1,700), alumina (Al2O3, 9),
tantalum oxide (Ta2O5, 22), strontium titanate
(2,000), and lanthanum oxide (La2O3, 30). For a
more extensive list see reference (5). A high dielec-
tric material placed between the plates of a capacitor
causes the electric field inside the capacitor to be
reduced for a given charge on the plates. This is
because the molecules of the dielectric material are
polarized by the electric field, and they align in a
configuration that sets up inside the dielectric a sec-
ondary electric field which is opposite in polarity to
Figure 8 The unit cell of calcium copper titanate, with
calcium ions in green, copper ions in blue and TiO6 octa-
hedra displaces as semisolid representations.
Figure 9 (a) A parallel plate capacitor with air between the two plates. There is a large electric
field between the two plates. (b) The same capacitor with a high permittivity material sand-
wiched in between the plates. (c) The net effect of the dielectric material is to reduce the electric
field by a factor er.
DIELECTRIC MATERIALS IN MAGNETIC RESONANCE 155
Concepts in Magnetic Resonance Part A (Bridging Education and Research) DOI 10.1002/cmr.a

the field from the capacitor plates. For a DC voltage,
charge builds up between the plates of the capacitor
and eventually no current flows through the capaci-
tor. However, for MRI purposes we are interested not
in a DC voltage but in alternating (cosinusoidal) vol-
tages, and associated alternating currents, magnetic
fields and electric fields. Assuming a driving voltage
given by:
V tð Þ ¼ V0 cosot [17]
The well-known expressions for current, electric
field, and impedance are given by:
I tð Þ ¼ �oCV0 sinot
EðtÞ ¼ V tð Þd
¼ V0 cosotd
Z ¼ V tð ÞI tð Þ ¼ 1
joC¼ �j
1
oC
[18]
Under the influence of an alternating driving volt-
age the direction of the electric field reverses polarity
at the frequency of the voltage source. The electric
field builds up from zero to maximum in one direc-
tion and then collapses back to zero. The field then
builds up to a maximum in the opposite direction and
then returns to zero.
An apparent problem is that the dielectric is an in-
sulator and therefore no current should pass through
it, and yet we know that alternating currents do pass
through capacitors. The key explanatory concept is
that there are two different types of current, namely
conduction and displacement currents. Conduction
currents refer to the conventional passage of elec-
trons through a material, and this type of current
indeed cannot flow through a pure insulator. In con-
trast, a displacement current is one that is produced
by the small (reversible) variations in the position of
the atoms and ions within the dielectric material: thus
a displacement current produces no net flow of ions
or electrons through the material. The displacement
current density (JD) is proportional to the time-deriv-
ative of the electric field:
JD ¼ e0erqEdt
[19]
Intuitively the displacement current must be equal
to the conduction current, and this is relatively easy
to show mathematically:
JD ¼ ed~E
dt¼ �eo
V0
dsinot [20]
Then the displacement current, ID, is given by:
ID ¼ JDA ¼ �AeoV0
dsinot ¼ �oCV0 sinot ¼ IC
[21]
As shown later in Section 7, displacement currents
are very important in the design of dielectric pads for
high field MRI.
The analysis so far has considered an ideal capaci-
tor with no resistance and therefore no loss. How-
ever, all capacitors have some loss which can be
modeled as a resistor, Rcap, in parallel with the ideal,
lossless capacitor, as shown in Figure 10. The loss is
typically specified in terms of a quality factor (Q),given by:
Qcap ¼ 1
oRcapC[22]
There are many ways of considering the Q value
of a component or an electrical circuit. Essentially a
low Q value indicates high loss, but also a large
frequency bandwidth (the Q value is given by the
resonance frequency divided by the full-width-half-
Figure 10 (a) Circuit diagram of a lossy capacitor. (b) The loss tangent (tan d) in relation to
the real (e0) and imaginary (e@) components of the permittivity.
156 WEBB
Concepts in Magnetic Resonance Part A (Bridging Education and Research) DOI 10.1002/cmr.a
maximum bandwidth), and vice-versa. Q values of
commercial capacitors are typically quoted as several
hundreds, but for MR applications one should be
aware that most of these measurements are per-
formed at low frequencies, typically 1 MHz, and the
Q value can drop very significantly with frequency.
In Figure 10 the respective currents through the
capacitor and resistor are given by:
~Ic ¼ joC ~V
~IR ¼~V
Rc
[23]
Since losses occur in the dielectric this means that
we can write the permittivity not only with a real
(lossless) component e0, but also with an imaginary
(lossy) component e@.
e ¼ e0 � je00 [24]
Note that a minus rather than plus sign is used for
the lossy component since energy is being removed
from the system by the imaginary term. The real part
of the permittivity represents the energy storage,
whereas the imaginary part represents the loss. The
dielectric conductivity, sdiel, is defined as:
sdiel ¼ oe00 [25]
The value of e@ is important because the total
power absorbed per unit volume of the dielectric is
given by:
Power ¼ sdiel
E20
2¼ oe00
E20
2Wm�3� �
[26]
The loss is most commonly quantified in terms of
the loss tangent (tan d) of a dielectric, which is given
by the ratio of the loss current to the charging current
through the capacitor:
tan d ¼~IR~IC
¼~VR�R
joC ~V0
¼ 1
joRC[27]
The quantity d is an angle, and represents the devi-
ation from 908 describing the phase difference
between the current and voltage. From Figure 10 it is
also clear that:
tan d ¼ e00
e0[28]
In most applications, it is desirable to keep the
loss tangent as low as possible, since it effectively
represents power that is dissipated in heat, therefore
serving no useful purpose. The dielectric materials
used in capacitors typically have tan d values much
less than 0.1.
4. EM WAVE PROPAGATION INDIELECTRIC MATERIALS
When considering MR applications of dielectric reso-
nators and dielectric pads, for example, one is con-
cerned with the interaction of the dielectric material
with the propagating EM fields associated with both
the transmission of RF pulses and also reception of the
MR signal. As EM waves propagate through dielectric
materials three basic phenomena occur: (i) the EM
wavelength changes, being inversely proportional to
the square root of the relative permittivity, (ii) the
waves are attenuated by any conductivity within the
dielectric, and (iii) waves are reflected and refracted
due to boundaries between materials with different per-
mittivities: these three phenomena are shown schemati-
cally in Figure 11. In addition to induced conduction
currents, the electric field causes a displacement cur-
rent within a dielectric, which in turn produces a sec-
ondary magnetic field component. In human MRI the
dielectric properties of different organs can produce
significant inhomogeneities in the EM wave distribu-
tion, particularly at high field strengths. However, dis-
placement currents in high permittivity ‘‘pads’’ can also
be used to correct for some of the spatial inhomogene-
ities in the primary EM field, as covered in Section 7.
The electric and magnetic fields propagating in
the x-direction, as shown in Figure 11(b), can be rep-
resented mathematically as:
E ¼ E0eþjot�gx
H ¼ H0eþjot�gx
[29]
where
g ¼ aþ jb ¼ joffiffiffiffiffiem
p[30]
where m is the magnetic permeability, a is termed the
attenuation factor (not to be confused with the polar-
izability) and b the phase factor, given by 2p/l . For
a lossless dielectric the value of a is zero, and the Eand H fields are given by:
E ¼ E0ej ot�bxð Þ
H ¼ H0ej ot�bxð Þ [31]
The intrinsic impedance, Z, of a dielectric is given
by:
DIELECTRIC MATERIALS IN MAGNETIC RESONANCE 157
Concepts in Magnetic Resonance Part A (Bridging Education and Research) DOI 10.1002/cmr.a

Z ¼ffiffiffime
r[32]
The index of refraction, n, is defined as the ratio
of the EM wavelength in vacuum (l0) to that in the
particular dielectric material:
n ¼ l0l
¼ l02p
b [33]
For a lossless dielectric:
n ¼ffiffiffiffiffiffiffiffiffie0m0
e0m0
s[34]
where (m0) is the real part of the magnetic permeability:
m0 ¼ Re mrm0f g [35]
m0 is the magnetic permeability of free space, equal
to 4p � 107 Hm1. For most materials (with the
exception of ferromagnetics which have a very high
value of magnetic permeability) m0 � m0, giving the
well-known formula relating the EM wavelength to
material permittivity.
l ¼ l0
ffiffiffiffiffie0e0
r[36]
The wavelength within the dielectric is therefore
inversely proportional to the square root of the real
part of the permittivity. If the loss in the dielectric
cannot be ignored, then the corresponding equation
is given by:
l
l0¼ 1
2
ee0
1þffiffiffiffiffiffiffiffiffiffiffiffiffiffiffiffiffiffiffiffi1þ tan2 d
p� �� ��12
[37]
which reverts to Eq. [36] in the case that tan d ¼ 0.
It is important to note that, despite the mathemati-
cal relationship between n and e, since permittivity is
frequency dependent the value of the refractive index
which is measured at optical frequencies does not, in
general, correspond to the same value of permittivity
measured at microwave or radio frequencies. The
values would only be exactly equal if the polarization
mechanisms were the same at both frequencies: this
is almost never the case. Referring back to the mech-
anisms outlined in Section 2, orientation polarization
mechanisms, for example, are effective at RF but are
much less efficient at optical frequencies.
Displacement and Conduction Currentsin Dielectrics at High Frequencies
Although dielectric materials are essentially insula-
tors they do have some conductivity, in other words
they support conduction currents, at high frequencies.
Such dielectric losses occur due to the physical pro-
perties of the material arising from, for example,
damping forces during the repeated polarization
changes due to an oscillating external electric field.
These losses appear in phase with any inherent
Figure 11 (a) As an EM wave enters a region of high permittivity (gray box) the wavelength
decreases by a factor of Her. At the boundary between materials with different permittivities part
of the wave is transmitted and part reflected. (b) Convention for propagation of planar EM
waves, with the H and E fields perpendicular to the direction of propagation.
158 WEBB
Concepts in Magnetic Resonance Part A (Bridging Education and Research) DOI 10.1002/cmr.a

conduction current. Therefore, at high frequencies, the
loss tangent includes contributions from both dielec-
tric loss and the conduction current. The relationship
between the magnetic and electric fields inside an iso-
tropic dielectric material which has a finite conducti-
vity, is given by one of Maxwell’s equations:
r� H ¼ sþ joeð ÞE [38]
By including conductivity and damping loss mech-
anisms outlined above, the modified Maxwell’s equa-
tion becomes:
r� H ¼ e0 � jo e00 þ so
� �� �E [39]
As mentioned earlier, the total losses therefore
comprise ones from the complex permittivity and
those from the small DC conductivity, resulting in an
effective conductivity (seff):
seff ¼ sþ oe00 [40]
At high frequencies the second term on the right
hand side dominates, and so often the simplification
is made that:
seff � oe00 [41]
5. DIELECTRIC RESONATORS INEPR AND MRI
The first applications of high permittivity materials
were in EPR using dielectric resonators (DRs)
formed from high permittivity ceramics. With operat-
ing frequencies in the 1–250 GHz range, conven-
tional EPR detection uses cavity resonators. As men-
tioned in the introduction, the use of high permittiv-
ity materials can reduce the size of devices
significantly. DRs use low loss ceramic structures
that can store energy effectively. The ideal situation
for both EPR and MR experiments is to contain as
much of the magnetic energy within the structure
itself. Various materials have been used for DRs
for EPR including TiO2 (rutile, er � 100), SrTiO3
(er � 300), BaTiO3 (er � 3,000), and BaxSr1-xTiO3
(300 � er � 3,000 based on the ratio of Ba to Sr).
Commonly used DR geometries include rectangular,
cylindrical, and annular structures. The properties of
DRs and their use in EPR and MRI are described in
the following sections.
Modal Distributions in DielectricResonators
Specific resonant modes of a DR refers to stable
time-invariant electric- and magnetic-field patterns
that are formed within the resonator. Cylindrical DRs
have transverse electric (TE) and transverse magnetic
(TM) modes, as well as hybrid electromagnetic
(HEM) modes. A TE mode is defined as one whose
electric field vector is normal to the direction of
propagation (zero electric field in the propagation
direction), a TM mode as one whose magnetic field
vector is normal to the direction of propagation (zero
magnetic field in the propagation direction), and an
HEM mode with nonzero electric and magnetic fields
in the propagation direction. Different modes are
denoted by subscripts, e.g., TE01, TM21, and HEM11.
The two subscripts for each mode (TEmn) denote the
number of half-wavelength field variations in the fand r directions respectively, with the convention
shown in Figure 12.
In the case of a cylindrical DR pure TE and TM
modes exist only when the field variations are inde-
pendent of f, meaning m¼0 for all TE and TM
modes, which must therefore be cylindrically sym-
metric. Figure 13 shows the distribution of electric
and magnetic fields for the most commonly used
mode of a cylindrical DR, the TE01d mode. The sub-
script d is applied when there is less than half-a-
Figure 12 Axes and co-ordinate convention used for dielectric resonators
DIELECTRIC MATERIALS IN MAGNETIC RESONANCE 159
Concepts in Magnetic Resonance Part A (Bridging Education and Research) DOI 10.1002/cmr.a

wavelength variation in the transverse fields within
the dielectric. In this mode the electric and magnetic
are tangential to one another. The electric field is
zero at the centre of the DR, and is almost entirely
constrained within the structure of the DR.
At a dielectric-air interface one can define the
plane wave reflection coefficient (G) as the ratio of
the intensity of the EM wave reflected at the bound-
ary divided by the intensity transmitted through the
boundary. The value of G is given by:
G ¼ffiffiffiffim0e0
q�
ffiffiffiffiffiffim0e0er
qffiffiffiffim0e0
qþ
ffiffiffiffiffiffim0e0er
q [42]
Since the relative magnetic permeability, mr, of theresonator is very close to unity, as er becomes larger so
does the value of G, approaching its maximum value of
1 as er goes to infinity. Under these conditions, the EMwave is reflected back into the resonator at the bounda-
ries, effectively storing the entire magnetic energy
within the resonator, as shown in Figure 13(b).
The magnetic, H(t), and electric, E(t), field pat-
terns for four lower order DR modes are shown in
Figure 14. The snapshots in Figure 14 were acquired
when each field was at its maximum value. The
larger, darker vectors correspond to where the field is
the strongest. The magnetic fields are in time quadra-
ture with the electric fields, meaning that the mag-
netic field maximum occurs one-quarter period later
in time than that of the electric field.
As mentioned above, the most commonly used
mode in a DR is the TE01d mode, which is the lowest
order mode. In this mode, the magnetic field resembles
that of a magnetic dipole and is highly axial and homo-
geneous. The electric field forms concentric circles
around the z-axis, is at a maximum at the periphery of
the cylinder and is zero along the central axis where
the magnetic field is the strongest. Consequently, a
hole can be bored down the axis of the DR, for place-
ment of an EPR or NMR sample, without appreciably
disrupting the distribution of the fields, as shown in
Figure 15, providing that the hole is not too large.
The field pattern of the TE01d mode is such that it
can be excited with a small wire loop (or dipole)
probe placed above, or to the side of, the DR. Alter-
natively the TE01 mode of a rectangular waveguide
can be used as the excitation source, or a microstrip
line placed near the resonator’s circular end face.
The orientation of any coupling mechanism should
be such that the magnetic field lines link with those
of the DR, as shown in Figure 16.
Resonant Frequencies of DielectricResonators
Although the exact frequency for a given resonant
mode in a dielectric cylinder can only be calculated
by rather complicated numerical procedures, an em-
pirical estimation of the resonant frequency (fr) of theTE01d mode of an isolated dielectric cylinder in free
space is given by:
Figure 13 Schematic of the magnetic (red) and electric (blue) field lines for the TE01d mode in
a solid cylindrical dielectric resonator. (a) shows the case for a DR with a low relative permitti-
vity, in which evernescent fields protrude from the resonator, whereas in (b) the permittivity is
much higher and the fields are almost entirely contained within the resonator itself.
160 WEBB
Concepts in Magnetic Resonance Part A (Bridging Education and Research) DOI 10.1002/cmr.a

fr ¼ 3; 400
rffiffiffiffier
p r
hþ 3:45
� �[43]
where r is the radius, and h the height, of the cylinder
in centimetres and fr has units of MHz. This formula
was originally derived (6) by fitting a straight line to
the results of numerical solutions and is known to be
accurate to about 2% in the range 0.5 , r/h , 2 and
30 ,er , 50. Although many DRs use materials with
er well above this range, the equation is a useful start-
ing point in determining design parameters.
The shielding conditions also affect the resonant
frequency (7, 8). If a shield is placed around the
circumference, or above and below the ends of the
DR, then the resonant frequency is affected due to
displacement of the electric and magnetic fields by
the shield, and the direction of change of fr can be
determined from cavity perturbation theory (9). If thestored energy is mostly electric, moving a metal
shielding wall closer to the resonator decreases
the resonant frequency. Conversely, for a displaced
field that is predominantly magnetic, the resonant
Figure 14 Electromagnetic simulations of the magnetic (top) and electric (bottom) field patterns
at their peak values for the four lowest order modes of a cylindrical dielectric resonator: TE01d,
HEM11d, HEM12d, and TM01d. The fields are strongest where the vectors (cones) are largest and
darkest in color. Temporally, the H(t) and E(t) fields are 908 out of phase with each other.
Figure 15 Magnetic (left) and electric (right) field distributions for the TE01d mode of a cylin-
drical dielectric resonator with a hollow bore. The magnetic field is highly axial and homogenous
along the hollow bore. The electric field vectors are orthogonal to the plane of the page and are
strongest at the periphery of the cylinder and zero within the hollow bore where the magnetic
field is the strongest.
DIELECTRIC MATERIALS IN MAGNETIC RESONANCE 161
Concepts in Magnetic Resonance Part A (Bridging Education and Research) DOI 10.1002/cmr.a

frequency increases. In the specific case of a DR
operating in its TE01d mode, the frequency increases
as a metal wall moves inwards towards the sides
of the DR since the displaced energy is predomi-
nantly magnetic.
Knowledge of how shielding conditions affect the
resonant frequency of a DR can be particularly useful
when implementing tuning mechanisms. For the
TE01d mode, bringing metal plates, or a tuning screw,
closer to the circular surfaces of the DR will increase
the resonant frequency, and vice-versa. One negative
consequence of bringing a metal plate near the DR is
that surface currents will be created, which reduce the
Q value of the resonator. The unloaded quality factor,
Qu, of a DR is affected mainly by the dielectric losses
in the DR itself (10) and so can be defined as:
Qu ¼ 1
tan d¼ e0
e00[44]
In general, e0 is relatively constant, and e@ increaseslinearly with frequency, hence the Qu of a dielectric
resonator is inversely proportional to frequency.
External losses can reduce the unloaded Q, and these
losses include radiation, tuning mechanisms, adhe-
sives used to support the resonators, and dissipation
in the surrounding metal shield. It has been suggested
that eddy currents in an outer shield become negligi-
ble for a shield 2–3 times larger in diameter than that
of the resonator (11).
Temperature Stability
For MR experiments it is very important that the res-
onant frequency of the DR is constant during data ac-
quisition to ensure maximum sensitivity. However,
the properties of many dielectric materials are highly
temperature dependent. The two major temperature-
dependent effects in dielectric materials relate to
thermal expansion of the material and an intrinsic
variation in the permittivity itself.
Solids generally expand as a function of an
increase in temperature. The linear coefficient
of expansion (aL) relates the change in a material’s
linear dimensions (DL) to a change in temperature
(DT) by
DLL
¼ aLDT [45]
where L is the material’s initial linear dimension. An
increase in temperature produces an increase in L, the
resonant wavelength of the DR therefore increases,
and the resonant frequency decreases.
The relative permittivity of a material also varies
with temperature. For most materials, over the lim-
ited range of temperatures relevant for MR operation,
this effect is approximately linear:
Derer
¼ teDT [46]
where te is the temperature coefficient of the permit-
tivity, which can be either positive or negative
depending upon the particular material. Since the
resonant frequency is inversely proportional to Her, apositive value of te results in a decrease in the reso-
nant frequency. Hence, the resonant frequency of a
DR changes as a function of temperature due to both
linear expansion and the change in permittivity. The
combined effect of both of these factors is called the
temperature coefficient of the resonant frequency
(tf). For the TEmn or TMmn modes of a DR the value
of tf is given by:
tf ¼ �aL � 1
2te [47]
This equation is useful when to trying to achieve
temperature compensation to minimize the tempera-
ture dependence of the resonance frequency of the
Figure 16 A schematic diagram of four different meth-
ods (microstrip, loop, dipole, and waveguide) of coupling
energy into the DR, while also ideally providing an im-
pedance match for maximum power transfer.
162 WEBB
Concepts in Magnetic Resonance Part A (Bridging Education and Research) DOI 10.1002/cmr.a

DR, either by modifying the composition or configu-
ration. A temperature stable material needs to have a
negative value of te given by:
te ¼ �2aL [48]
Commercial examples of such temperature com-
pensated materials are those found in NP0 (negative-
positive-zero) capacitors. These are used in a variety
of high-power devices, including MR coils, and typi-
cally have a permittivity between 15 and 100, with a
change of less than 0.4% in the permittivity over a
temperature range of 55 to 1258C. These capacitors
have a barium titanate content of between 15 and
50%, with calcium titanate, titanium dioxide, and
traces of rare earth oxides such as samarium and neo-
dynium added for temperature compensation. The
grain size of the composite ceramic is �1 mm, since
the smaller the grain size the lower the temperature
dependence. Values of te for specific dielectrics are
given in Appendix A.
Dielectric Resonator Constructionand Characterization
The typical starting material for a solid DR for EPR
or MR applications is a dielectric such as BaTiO3,
SrTiO3 or CaTiO3 in powder form. This is moulded
into a cylindrical shape using a die of the appropriate
diameter. Forming uses both an axial press (at a pres-
sure of �15,000 psi) and a cold isostatic press
(25,000 psi). The resulting green samples are then
sintered in a furnace at 1,5008C for �four hours. The
powder typically has a lateral shrinkage of �20%
during sintering, and so the size must be made corre-
spondingly larger than the final desired dimension,
which is specified for a given resonance frequency
from Eq. [43]. Once sintered, holes can be created in
the ceramic discs using a diamond core drill. A dia-
mond surface grinding wheel is used to achieve the
final desired height, which is fine-tuned through ex-
perimental S21 measurements with a network ana-
lyzer using a standard two pickup-coil arrangement
and a copper shielding tube identical to that used on
the actual MR probe, with the assembly centered in a
silver cavity as shown in Figure 17. The resonant fre-
quency of the TE01d mode is divided by the -3 dB
bandwidth to derive the Q value.
The resonant frequency of a DR can also be meas-
ured using methods that confine EM energy within
the dielectric material. One of the most common
methods is that of Hakki and Coleman (12) who used
a dielectric resonant post bounded by two parallel
conducting plates to measure the resonant frequency.
Many other measurement methods are possible (13–15), although these are appropriate for very accurate
measurements which are not typically required for
MR applications.
Applications of DielectricResonators in EPR
This section comprises a short review of the use of
DRs in EPR. The advantages of using DRs in EPR
experiments have been well-documented and inter-
ested readers are pointed to a comprehensive review
article (16).The first use in EPR was by Carter and Okaya who
discovered that a DR could be used to detect EPR sig-
nals of artificially produced boules of Fe3 in rutile
Figure 17 Setup for measuring the resonant frequency of a dielectric resonator via S-parameter
methods using a standard two pickup-coil arrangement and copper shielding tube with identical
dimensions to the RF shield used in the MR probe.
DIELECTRIC MATERIALS IN MAGNETIC RESONANCE 163
Concepts in Magnetic Resonance Part A (Bridging Education and Research) DOI 10.1002/cmr.a
(TiO2, er�100) (17). The original rutile dielectric res-onator was coincident with the Fe3+ sample, and para-
magnetic resonances were observed over a range of
2-110 GHz in a field of up to 14 T. An increase in
sensitivity was achieved by using the doped rutile as
the microwave resonator rather than the traditional
metal walled cavity, since rutile has a much higher
loaded Q values (�5,000 for 50-110 GHz and �85,000 for 1.5-7 GHz all at 78 K) and the filling fac-
tor with the coincident sample was unity. An X-band
comparison of the DR design with the traditional
metal cavity resonator was made and showed the
minimum number of detectable spins improved by a
factor of 2,500 for the DR. Okaya (18) also noted that
one of the big advantages of using the rutile resonator
was its extremely small physical size when compared
with traditional metal walled cavity resonators.
A dielectric cavity resonator (DCR) was demon-
strated by Rosenbaum (19) and Harthoorn and Smidt
(20). DCR configurations used either a hollow dielec-
tric tube resonator with the sample inside, or a
dielectric rod resonator as the (coincident) sample.
Rosenbaum used teflon (er ¼ 1.27), quartz (er ¼2.06), lucalox (er ¼ 9.9), and ruby (er ¼ 9.9) as the
dielectric materials operated at the X- and Ka-bands,
achieving loaded Q-values as high as 5,000. Har-
thoorn and Smidt used fused silica (er ¼ 3.8) DCRs
with inner radius 0.5 cm, outer radius 1.25 cm and
length 1.156 cm resonating at 9 GHz in the TE011
mode with a measured unloaded Q of 6,300. Metal
endplates were used on both sides of the DCRs.
Building upon Rosenbaum’s work, Walsh and
Rupp (11) presented the first systematic use of DRs
in cylindrical configurations for use in EPR . They
used resonators made from zirconium tin titanate
(er = 37.5) and barium titanate (Ba2Ti9O20, er ¼ 40)
to replace a conventional half-wavelength Ku–band
waveguide cavity that had a resonant frequency at
11.6 GHz. In this case a single cylindrical disk was
used in the TE011 mode. The center of the cylinder
was drilled out to produce a hollow bore into which
the sample could be placed. The center region of the
cylinder could be removed for this operating mode
with little change in frequency or field distribution,.
In this case the use of a DR showed significant
increases in signal-to-noise (S/N) (from �15� to
�30� depending on the material) over the conven-
tional waveguide cavity.
Dykstra and Markham (21) also investigated the
use of DRs in EPR spectroscopy, using commercially
available (ZrSn)TiO4 dielectrics with er ¼ 38, Q0 ¼5,300 at 8.8 GHz, height ¼ 2.65 mm, outer diameter
¼ 5.98 mm, and a temperature stability of less than 2
ppm/8C. Holes of diameter 1 mm and 2 mm were
created within the DR to insert the sample tubes, and
the corresponding operating frequencies were then
8.85 GHz and 8.91 GHz respectively. For small sam-
ples the sensitivity increased by two orders of magni-
tude for the DR when compared to a standard cavity.
A dual disk arrangement was presented in 1992
by Bromberg and Chan (22) who designed a coupled
two-disk TiO2 system for EPR studies using a modi-
fied diamond anvil cell (DAC). The resonant fre-
quency was 11.2 GHz at 77 K and 9.5 GHz at 2 K
when the disks were in the TE01d mode. A typical
loaded Q was �1,200 at room temperature and 5,000
at 2 K. Substantial improvements in Q and filling fac-
tor were noted from Sakai’s original design of a con-
ventional DAC for EPR in the X-band (23).Sienkiewicz and Qu (24) used both single and
double disk structures for stopped-flow EPR experi-
ments in the X-band (9.05 – 10 GHz). Their zirco-
nium titanate (er ¼ 30) disks were also hollow and
tuned to resonate at various frequencies of the TE01d
mode by changing the spacing between the double
disks. Lassmann et al. (25) also used a zirconium ti-
tanate (er ¼ 30) double disk arrangement to perform
EPR stopped-flow experiments in the X-band.
Since there are no closed-form analytical solutions
to determine the exact resonant frequency of cylindri-
cal dielectric resonators in free space, Jaworski et al.
(9) derived an approximate method for predicting the
resonant frequencies for single and stacked dielectric
resonators used in sensitive EPR measurements.
Jaworski first studied single and double-stacked
dielectric configurations, which were designed using
commercially available X-band high-dielectric
ceramics. Their configuration was very similar to that
of Sienkiewicz (24) in that a microwave shield was
used as well as a laterally protruded loop-shaped
antenna for magnetic coupling to the TE01d mode.
Jaworski et al. developed a semi-empirical model to
bridge the gap between these two approaches. The
model employed a combination of approximate ana-
lytical formulae with their experimental results for
both single and double-stacked resonator structures.
Their approach yielded accuracy better than one per-
cent for the commercial DRs. Furthermore, when
comparing the single DR to the double DR, it was
noted that a higher filling factor could be obtained for
a point sample in the single DR structure, but the dou-
ble-stacked configuration yielded better SNR for long
aqueous samples, as shown in Figure 18.
Dielectric Resonators in Human MRI
The concept of a DR can be adapted for human MRI.
The resonators are necessarily much larger in size
164 WEBB
Concepts in Magnetic Resonance Part A (Bridging Education and Research) DOI 10.1002/cmr.a

and are resonant at much lower frequencies than for
EPR. Wen et al. (26) constructed a series of cylindri-
cal and annular dielectric resonators that used either
water or D2O as the dielectric for a whole-body 4 T
(170.75 MHz) MRI system. Using a complete cylin-
der of water of diameter 24.8 cm, they measured the
frequencies of the first three modes using cylinder
lengths of 6.5 cm (TE01d, �100 MHz), 12.1 cm
(HEM11d, �170 MHz) and 25 cm (a tilted TM01d
mode �280 MHz). They also showed that a cylinder
of water with an outer diameter 19 cm, inner diame-
ter 8 cm, and height 16.9 cm gave a TE01d resonance
at �170 MHz. Coupling to the DRs in this case was
via an inductive loop and a matching circuit placed
above the resonator. The TE01d mode was utilized,
and the object to be imaged was placed into a cylin-
der containing water or D2O. This study was success-
ful in obtaining an image of a hand, but the authors
noted that the high-loss factor of water does not
make it an ideal dielectric, in addition to the fact that
the sample becomes ‘‘undesirably wet’’! The authors
also noted that if the coil is to be used as a head or
body resonator, then the HEM mode must be used
since it produces a (quadrature) field perpendicular to
the main magnetic field, B0.
Dielectric Resonators in MagneticResonance Microscopy
The higher frequencies (400–900 MHz) used for MR
microscopy in combination with the small diameter
of, in particular, vertical bore systems means that
high permittivity materials need to be used. The use
of high permittivity dielectrics for high field MR
microimaging was first shown by Neuberger et al.
(27) at 14.1 T (600 MHz). The ceramic material used
was barium strontium titanate (Ba0.04Sr0.96TiO3),
which has a very high relative permittivity of 323,
but is relatively difficult to machine. Due to this and
other manufacturing constraints, a solid (as opposed
to hollow) double-stacked arrangement was used,
with the sample placed between the two discs. The
resonant frequency of the two disks, each of diameter
28.5 mm and height 12.2 mm, was fine-tuned with
copper ‘‘paddles,’’ as shown in Figure 19(a). The
magnetic field was coupled into the resonators using
a transmit/receive loop probe placed between the
discs. The simulated EM fields shown in Figure
19(b) illustrate that there is a small dip in the mag-
netic field between the two resonators, and that the
electric field is zero at the centre of the resonator, as
expected. While Neuberger’s resonator setup is not
the optimal geometry in terms of available sample
space or B1 homogeneity, the configuration achieved
significantly higher S/N when compared to a conven-
tional saddle coil of similar dimensions. Example
images from the DR are shown in Figure 19(c).
An alternative material for a DR is CaTiO3, ervalue 156, which is much more easy to machine, and
is widely available at reasonable cost (,$100 per RF
coil). By drilling a hole through the center of the
cylindrical resonator (Fig. 15) the magnetic field dis-
tribution of the resonator is used more efficiently
than the Neuberger design and larger samples up to
Figure 18 (a) A comparison of the relative estimated and measured EPR line intensities as a
function of the point-DPPH sample position. On the far left the relative EPR signal intensity for
the point sample probing H2z along the z axis of the single DR. Adjacent is the relative EPR sig-
nal intensity along the z-axis of the double-stacked DR. The solid squares represent experimental
results and the solid line the estimated signal. (b) EPR spectra of TE point-DPPH sample meas-
ured in a double-stacked DR structure and in a standard TE102 cavity. The spectra were recorded
with the same incident microwave power (0.2 mW) and with the same effective magnetic field
modulation (0.5 G). Figure adapted from reference (9).
DIELECTRIC MATERIALS IN MAGNETIC RESONANCE 165
Concepts in Magnetic Resonance Part A (Bridging Education and Research) DOI 10.1002/cmr.a

4.5 mm in diameter could be investigated (28). Theefficiency of the DR was quantified by measuring a
B1 per square root of power of 294 mT/HWatts. For
comparison, a loop gap resonator was constructed
with equal length and inner diameter to the DR. The
pulse width for this RF coil was �25% larger than
for the DR, indicating a higher sensitivity for the DR.
MR microscopy experiments were performed on an
ex vivo six week old zebrafish. After euthanizing the
fish, it was fixed in a 4% formalin solution for 24
hours. Before imaging, the fish was placed into a
phosphate buffered saline (PBS) with a 2% v/v Gd-
DPTA (Magnevist) solution for two days to shorten
the T1 relaxation time: sodium azide was added as a
biocide. The fish was then placed inside a 4 mm
diameter glass tube of length 2 cm and filled with a
perfluorinated liquid for the imaging experiment. The
tube was centered within the DR, and a 3D spin-echo
sequence (TR/TE 250/20 ms, spatial resolution 47 �42 � 42 mm, four signal averages, total scan time
1 hour) was performed. Higher spatial resolution
(20 � 20 � 25 mm) experiments were also per-
formed, using 12 averages and took 16 hours to
acquire. Representative images are shown in Figure 20.
The highest frequency at which DRs have been
designed for MR is 900 MHz on the wide bore spec-
trometer at the National High Magnetic Field Labora-
tory in Tallahassee, Florida. The probe was constructed
from CaTiO3, with the following parameters: measured
er ¼ 166 (a different commercial source to the previ-
ously described resonator), height ¼ 1.43 cm, radius ¼1.5 cm, and hole diameter ¼ 4.8 mm. The cylindrical
DR was enclosed within a copper shield of diameter
3.8 cm to fit snugly within the gradient set. In simula-
tions this configuration gave a TE01d mode resonance
at 874.8 MHz. The frequency was tuned to 900 MHz
using copper paddles as described previously. Figure
21 shows the resonator, a measured transmit RF (Bþ1 )
field map along the axis of the hole, and images from
excised rat spinal cord and muscle tissue.
With the trend towards ever-increasing magnetic
field strengths, and concrete plans from at least
two facilities to design MR magnets at 1.3 GHz by
incorporating high-temperature superconducting
inserts into standard magnet designs, the use of DRs
is a very promising approach for constructing RF
probes for such systems. At higher frequencies the
dimensions of the DR become smaller, the very sim-
Figure 19 (a) Schematic and photographs of split cylinder barium strontium titanate DR operat-
ing at 600 MHz. (b) plots of the magnetic field and electric fields produced by the split resonator
fed by a small loop coil. (c) One slice of a three-dimensional data set from a spin-echo imaging
sequence of the lipid signal in a canola seed using the dielectric resonator. 192 � 192 � 140
data matrix, spatial resolution 20 � 20 � 30 mm, TR 1s, TE 10 ms, 4 averages. Also shown is
the three-dimensional surface plot of the seed.
166 WEBB
Concepts in Magnetic Resonance Part A (Bridging Education and Research) DOI 10.1002/cmr.a

ple construction obviates the need for extensive
lumped elements, there are no skin effects (such as
occur in conductors), and the NMR environment typ-
ically provides very tight temperature control for
highly stable operating conditions.
6. USE OF DIELECTRIC INSERTS FORINCREASED SENSITIVITY ANDREDUCED SAMPLE HEATING
An alternative use of dielectric materials is to incor-
porate them into the structure of a conventional reso-
nator such as a birdcage or TEM coil. There are three
basic possibilities:
i. the dielectric can be placed between the RF
coil and the RF shield surrounding the coil to
increase the radial RF homogeneity,
ii. the dielectric can be used as a ‘‘circular’’ liner
to the RF coil to increase the sensitivity and/
or shield the sample from the conservative
electric field of the RF coil, or
iii. the dielectric can be selectively placed
around different parts of the sample to
Figure 20 (a) (top) Single slice from a 3D data set of a fixed zebrafish acquired at a spatial
resolution of 47 � 42 � 42 mm. (middle) Single slice from a 3D data set acquired at a spatial
resolution of 25 � 20 � 20 mm. (bottom) Full 3D high resolution data set, volume rendered.
(b) Detailed mapping of structures and organs based upon the images acquired at a resolution of
25 � 20 � 20 mm.
Figure 21 (a) Photograph of the calcium titanate DR probehead for operation at 900 MHz
(without the shielding tube). (b) Measured distribution of tip angles along the length of the reso-
nator. (c) top: excised amyotrophic lateral sclerosis (ALS) mouse spinal cord at 25 mm isotropic
resolution, bottom: Excised rat soleus muscle at isotropic 20 mm resolution.
DIELECTRIC MATERIALS IN MAGNETIC RESONANCE 167
Concepts in Magnetic Resonance Part A (Bridging Education and Research) DOI 10.1002/cmr.a
increase the RF sensitivity in areas of low
transmission/reception efficiency.
Each of these possibilities have been explored by
different groups, and each represents a promising so-
lution to some intrinsic problems of very high fre-
quency magnetic resonance. These three ideas are
summarized below.
Increasing the Radial RFHomogeneity at High Field
For the first case mentioned above, Foo et al. (29)placed high dielectric material between the rungs and
shield of a high-pass birdcage coil, with experiments
and simulations performed at 170 MHz (4 T). At
high field, due to the high permittivity of the body
(30–32), the wavelength of EM energy in the body is
shortened considerably compared to that in free
space, Eq. [36], and areas of significant constructive
and destructive interference occur in the body at field
strengths above �3 T. The authors showed that these
sample-induced radial (x,y) field inhomogeneities
could be reduced by using dielectric material placed
between the RF coil and shield, although they also
showed the trade-offs in terms of the power required
for a certain B1 field at the centre of the sample being
increased, and the axial (z-direction) B1 homogeneity
being decreased substantially. For a high-pass bird-
cage, the current density J(f,z) is a function of the
RF propagation constant, kz, in the z-direction:
~J f; zð Þ ¼ J0 sinfe�jkzzz [49]
where f is the azimuthal angle measured tangentially to the
axial direction, and kz is the axial wavenumber given by:
kz ¼ 2plz
[50]
At low field, kz can be assumed to be zero, with no
subsequent phase variation along the length of the
rungs of the birdcage, and the current density is sim-
ply given by J0 sin f. However, this is not true at highfield where significant phase variations can occur
along the length of the birdcage rungs.
In terms of the magnetic, dielectric and conductiv-
ity properties of tissue, the propagation constant (k)in the body is given by:
k2 ¼ o2me0er � joms [51]
The RF field amplitude distribution in the radial
plane is characterized by a corresponding radial prop-
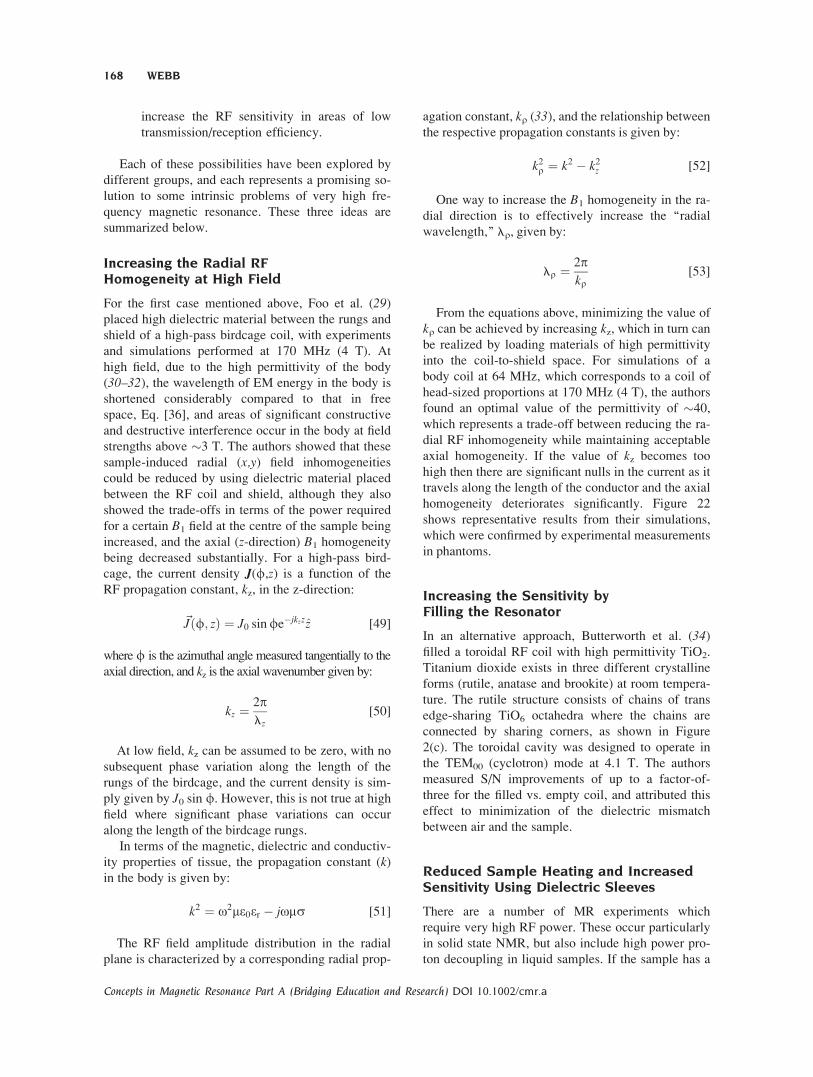
agation constant, kr (33), and the relationship betweenthe respective propagation constants is given by:
k2r ¼ k2 � k2z [52]
One way to increase the B1 homogeneity in the ra-
dial direction is to effectively increase the ‘‘radial
wavelength,’’ lr, given by:
lr ¼ 2pkr
[53]
From the equations above, minimizing the value of
kr can be achieved by increasing kz, which in turn can
be realized by loading materials of high permittivity
into the coil-to-shield space. For simulations of a
body coil at 64 MHz, which corresponds to a coil of
head-sized proportions at 170 MHz (4 T), the authors
found an optimal value of the permittivity of �40,
which represents a trade-off between reducing the ra-
dial RF inhomogeneity while maintaining acceptable
axial homogeneity. If the value of kz becomes too
high then there are significant nulls in the current as it
travels along the length of the conductor and the axial
homogeneity deteriorates significantly. Figure 22
shows representative results from their simulations,
which were confirmed by experimental measurements
in phantoms.
Increasing the Sensitivity byFilling the Resonator
In an alternative approach, Butterworth et al. (34)filled a toroidal RF coil with high permittivity TiO2.
Titanium dioxide exists in three different crystalline
forms (rutile, anatase and brookite) at room tempera-
ture. The rutile structure consists of chains of trans
edge-sharing TiO6 octahedra where the chains are
connected by sharing corners, as shown in Figure
2(c). The toroidal cavity was designed to operate in
the TEM00 (cyclotron) mode at 4.1 T. The authors
measured S/N improvements of up to a factor-of-
three for the filled vs. empty coil, and attributed this
effect to minimization of the dielectric mismatch
between air and the sample.
Reduced Sample Heating and IncreasedSensitivity Using Dielectric Sleeves
There are a number of MR experiments which
require very high RF power. These occur particularly
in solid state NMR, but also include high power pro-
ton decoupling in liquid samples. If the sample has a
168 WEBB
Concepts in Magnetic Resonance Part A (Bridging Education and Research) DOI 10.1002/cmr.a

high conductivity (such as biological samples con-
taining a significant salt content) then the sample can
undergo significant heating due to the electric fields
produced by the RF coil. The coil geometry with the
highest intrinsic S/N, the solenoid shown in Figure
23(a), is particularly problematic in that it produces a
very high electric field at the centre of the sample, as
shown in Figure 23(c). Although other types of coil
with lower E-fields can be used, such as modified Al-
derman-Grant designs (35–38) or scroll-coils (39),these geometries typically have a lower S/N than the
solenoid. Crum and Zilm (40) have suggested that it
should be possible to shield the sample from the con-
servative component of the electric fields that are
produced by a solenoid, without significantly altering
either the B1 field distribution or amplitude, by the
use of a cylindrical dielectric sleeve which is placed
between the sample and coil as shown in Figure
23(b). EM simulations presented in Figure 23 shows
that this is indeed the case. The reduction of the con-
servative E field in Figure 23(d) with the dielectric
shield in place, compared to the situation in Figure
23(c) with no shield, is quite substantial. Also Fig-
ures 23(e,f) show that the shield has very little effect
on the magnetic field distribution within the sample.
This concept has been further developed by
Neufeld et al. (41) who inserted a dielectric cylinder
of deuterated water into a high field NMR probe.
They measured a S/N increase of �20% compared to
Figure 23 Electromagnetic simulations showing the effect of a dielectric shield (yellow) on the
conservative electric fields, (c) and (d), and the magnetic field, (e) and (f), when placed inside a
solenoidal coil (a). The magnitude of the conservative electric field is reduced substantially.
Figure 22 Radial field amplitude profiles for different
permittivity materials placed between the RF coil and
shield for a full-sized body coil at 64 MHz. A homogene-
ous phantom was placed symmetrically within the coil.
DIELECTRIC MATERIALS IN MAGNETIC RESONANCE 169
Concepts in Magnetic Resonance Part A (Bridging Education and Research) DOI 10.1002/cmr.a
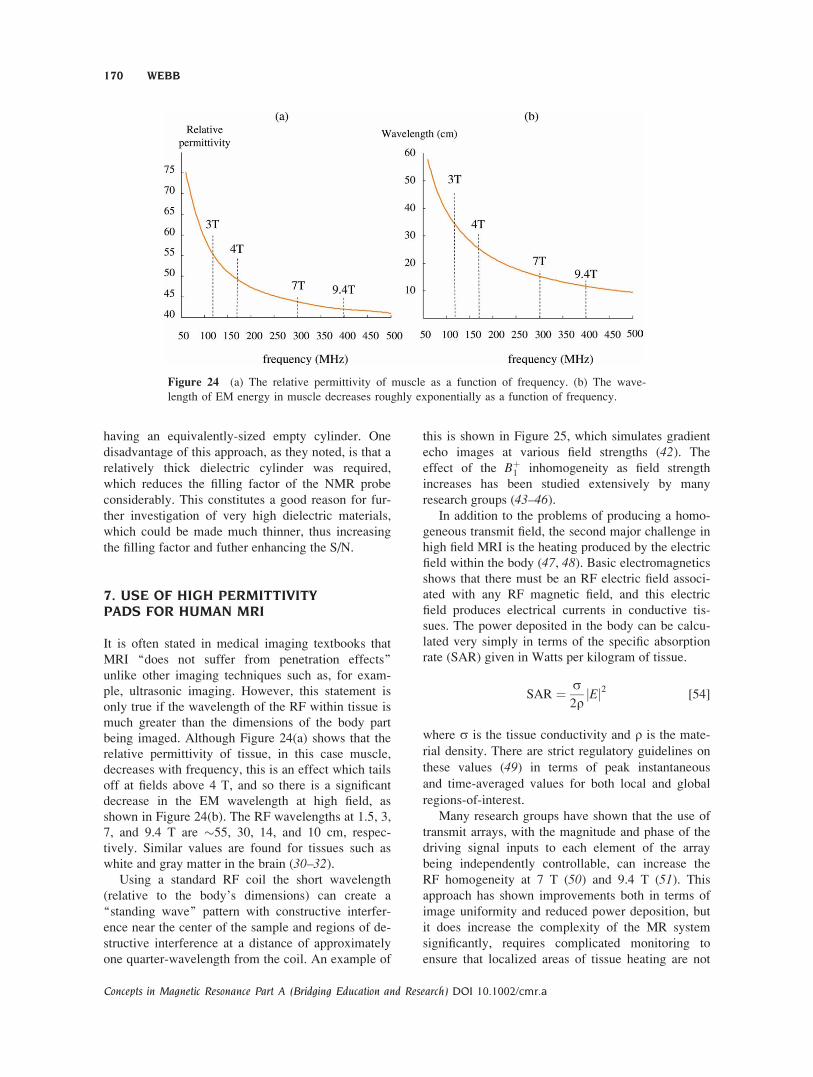
having an equivalently-sized empty cylinder. One
disadvantage of this approach, as they noted, is that a
relatively thick dielectric cylinder was required,
which reduces the filling factor of the NMR probe
considerably. This constitutes a good reason for fur-
ther investigation of very high dielectric materials,
which could be made much thinner, thus increasing
the filling factor and futher enhancing the S/N.
7. USE OF HIGH PERMITTIVITYPADS FOR HUMAN MRI
It is often stated in medical imaging textbooks that
MRI ‘‘does not suffer from penetration effects’’
unlike other imaging techniques such as, for exam-
ple, ultrasonic imaging. However, this statement is
only true if the wavelength of the RF within tissue is
much greater than the dimensions of the body part
being imaged. Although Figure 24(a) shows that the
relative permittivity of tissue, in this case muscle,
decreases with frequency, this is an effect which tails
off at fields above 4 T, and so there is a significant
decrease in the EM wavelength at high field, as
shown in Figure 24(b). The RF wavelengths at 1.5, 3,
7, and 9.4 T are �55, 30, 14, and 10 cm, respec-
tively. Similar values are found for tissues such as
white and gray matter in the brain (30–32).Using a standard RF coil the short wavelength
(relative to the body’s dimensions) can create a
‘‘standing wave’’ pattern with constructive interfer-
ence near the center of the sample and regions of de-
structive interference at a distance of approximately
one quarter-wavelength from the coil. An example of
this is shown in Figure 25, which simulates gradient
echo images at various field strengths (42). The
effect of the Bþ1 inhomogeneity as field strength
increases has been studied extensively by many
research groups (43–46).In addition to the problems of producing a homo-
geneous transmit field, the second major challenge in
high field MRI is the heating produced by the electric
field within the body (47, 48). Basic electromagnetics
shows that there must be an RF electric field associ-
ated with any RF magnetic field, and this electric
field produces electrical currents in conductive tis-
sues. The power deposited in the body can be calcu-
lated very simply in terms of the specific absorption
rate (SAR) given in Watts per kilogram of tissue.
SAR ¼ s2r
jEj2 [54]
where s is the tissue conductivity and r is the mate-
rial density. There are strict regulatory guidelines on
these values (49) in terms of peak instantaneous
and time-averaged values for both local and global
regions-of-interest.
Many research groups have shown that the use of
transmit arrays, with the magnitude and phase of the
driving signal inputs to each element of the array
being independently controllable, can increase the
RF homogeneity at 7 T (50) and 9.4 T (51). Thisapproach has shown improvements both in terms of
image uniformity and reduced power deposition, but
it does increase the complexity of the MR system
significantly, requires complicated monitoring to
ensure that localized areas of tissue heating are not
Figure 24 (a) The relative permittivity of muscle as a function of frequency. (b) The wave-
length of EM energy in muscle decreases roughly exponentially as a function of frequency.
170 WEBB
Concepts in Magnetic Resonance Part A (Bridging Education and Research) DOI 10.1002/cmr.a
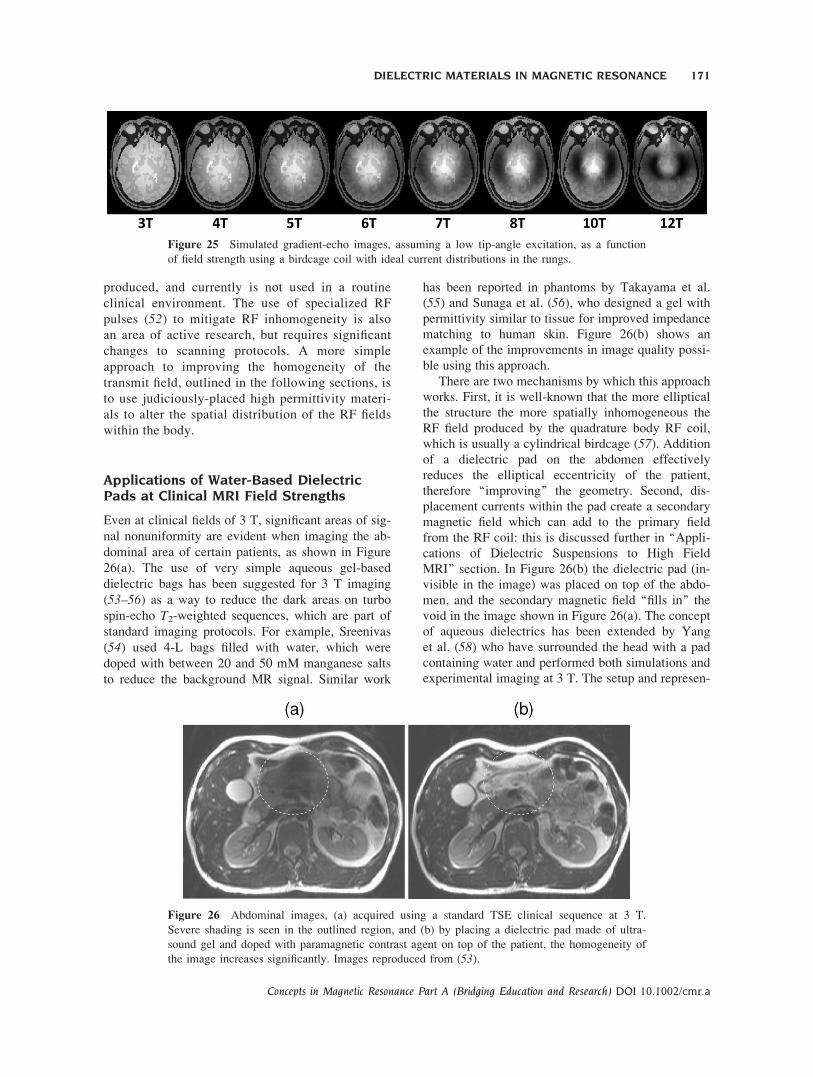
produced, and currently is not used in a routine
clinical environment. The use of specialized RF
pulses (52) to mitigate RF inhomogeneity is also
an area of active research, but requires significant
changes to scanning protocols. A more simple
approach to improving the homogeneity of the
transmit field, outlined in the following sections, is
to use judiciously-placed high permittivity materi-
als to alter the spatial distribution of the RF fields
within the body.
Applications of Water-Based DielectricPads at Clinical MRI Field Strengths
Even at clinical fields of 3 T, significant areas of sig-
nal nonuniformity are evident when imaging the ab-
dominal area of certain patients, as shown in Figure
26(a). The use of very simple aqueous gel-based
dielectric bags has been suggested for 3 T imaging
(53–56) as a way to reduce the dark areas on turbo
spin-echo T2-weighted sequences, which are part of
standard imaging protocols. For example, Sreenivas
(54) used 4-L bags filled with water, which were
doped with between 20 and 50 mM manganese salts
to reduce the background MR signal. Similar work
has been reported in phantoms by Takayama et al.
(55) and Sunaga et al. (56), who designed a gel with
permittivity similar to tissue for improved impedance
matching to human skin. Figure 26(b) shows an
example of the improvements in image quality possi-
ble using this approach.
There are two mechanisms by which this approach
works. First, it is well-known that the more elliptical
the structure the more spatially inhomogeneous the
RF field produced by the quadrature body RF coil,
which is usually a cylindrical birdcage (57). Additionof a dielectric pad on the abdomen effectively
reduces the elliptical eccentricity of the patient,
therefore ‘‘improving’’ the geometry. Second, dis-
placement currents within the pad create a secondary
magnetic field which can add to the primary field
from the RF coil: this is discussed further in ‘‘Appli-
cations of Dielectric Suspensions to High Field
MRI’’ section. In Figure 26(b) the dielectric pad (in-
visible in the image) was placed on top of the abdo-
men, and the secondary magnetic field ‘‘fills in’’ the
void in the image shown in Figure 26(a). The concept
of aqueous dielectrics has been extended by Yang
et al. (58) who have surrounded the head with a pad
containing water and performed both simulations and
experimental imaging at 3 T. The setup and represen-
Figure 26 Abdominal images, (a) acquired using a standard TSE clinical sequence at 3 T.
Severe shading is seen in the outlined region, and (b) by placing a dielectric pad made of ultra-
sound gel and doped with paramagnetic contrast agent on top of the patient, the homogeneity of
the image increases significantly. Images reproduced from (53).
Figure 25 Simulated gradient-echo images, assuming a low tip-angle excitation, as a function
of field strength using a birdcage coil with ideal current distributions in the rungs.
DIELECTRIC MATERIALS IN MAGNETIC RESONANCE 171
Concepts in Magnetic Resonance Part A (Bridging Education and Research) DOI 10.1002/cmr.a

tative images are shown in Figure 27. The authors
find significantly increased S/N measured over the
whole brain, and point out that this in turn leads to a
decreased SAR since the input power necessary to
reach a certain flip angle is reduced. The only disad-
vantage of this approach is the fact that a large space
is required for the relatively thick water bag, and this
reduces the filling factor. In practice a close-fitting
phased array receiver would be used, and so again
the use of high dielectric materials might be antici-
pated to improve this situation by being able to use
much thinner pads. The next section describes how
different liquids and liquids/solids can be mixed to
give permittivities of specified values.
Mixing Rules for Dielectrics
In many cases, the optimum permittivity required fora particular application may not correspond to a mate-
rial with appropriate physical properties. For example,
there is no liquid with a permittivity of �60 whichcould be used for (bio)medical applications. The
obvious solution is to mix different liquids, or alterna-tively liquids and solids to form a suspension, to
obtain the desired value of er. This section summarizes
some of the very simple mixing rules used to predictthe value of er of mixtures or suspensions, or to esti-
mate the composition to produce a desired value of er.
Mixing Rules for Liquids. By varying the propor-
tions of miscible liquids with high and low permittiv-ities, a continuum of values can be produced. For
MR applications any background MR signal can be
reduced significantly either by using deuterated sol-vents, or alternatively by dissolving paramagnetic or
ferromagnetic compounds to reduce the T2 value ofprotonated solvents,.
When liquids are mixed, it should be noted that
there can be signifcant changes in volume and also
quite complicated orientational correlations between
different (particularly polar) species. However, one
usually assumes that the polarization for each com-
ponent does not change when mixed, in which case
the effective dielectric constant (eeff) of the mixture
is simply given by:
eeff ¼ e0a~pmixture ¼ e0rmixture
Xni¼1
aixivi~pi [55]
where xi is the mole fraction, vi is the molar volume,
pi the polarization of species i, n the total number of
components, and r the density. Equation [55] is
known as Oster’s rule (59). Assuming zero volume
change, this can be simplified to:
eeff ¼ e0Xni¼1
aiFipi [56]
where Fi is the volume fraction based on the molar
volumes of the pure components:
Fi ¼ xiviPnk¼1 xkvk
[57]
For an extensive discussion of estimating the per-
mittivity of fluid mixtures at different temperatures
and pressures, see Harvey and Prausnitz (60).
Mixing Rules for Suspensions. As described in
the next section, the use of deuterated suspensions of
metal titanates shows great promise for improving
the RF homogeneity in human imaging at 7 T and
above. The concept of an effective macroscopic per-
Figure 27 (a) Computer model of a birdcage coil, human head, and water padding around the
head. Axial images through the brain, with (b) and without (c) the water padding, with measured
S/N over the whole slice.
172 WEBB
Concepts in Magnetic Resonance Part A (Bridging Education and Research) DOI 10.1002/cmr.a
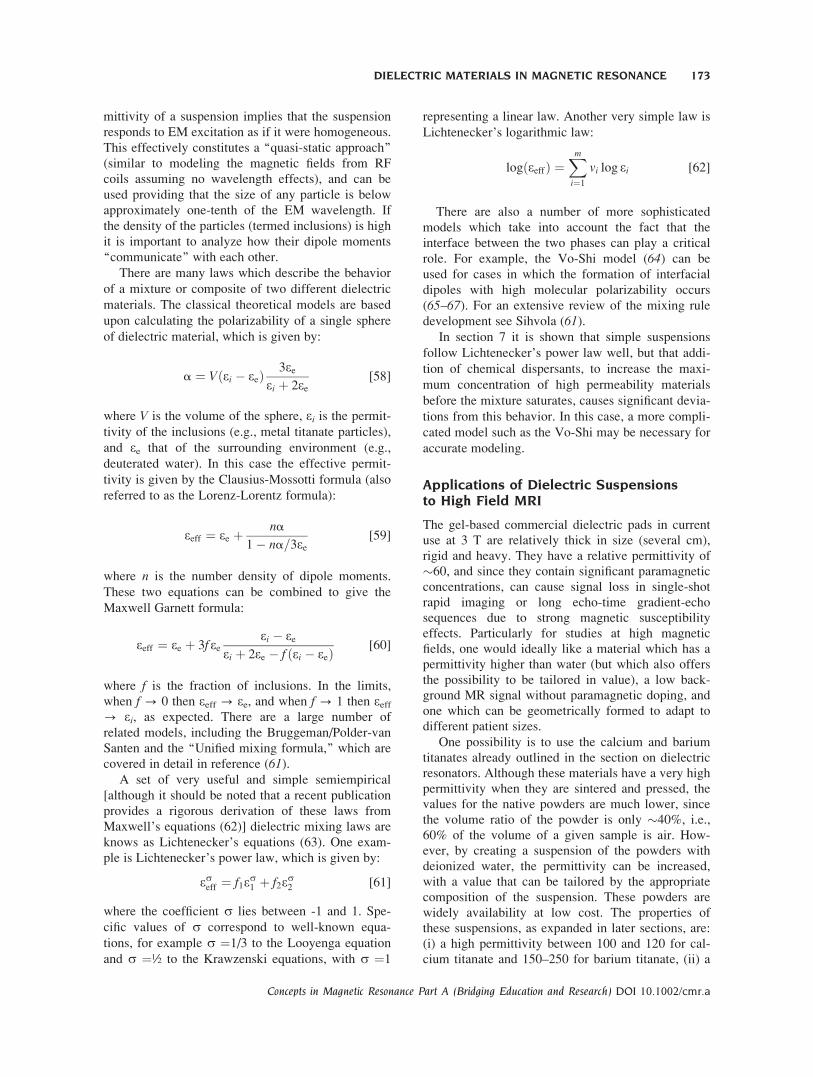
mittivity of a suspension implies that the suspension
responds to EM excitation as if it were homogeneous.
This effectively constitutes a ‘‘quasi-static approach’’
(similar to modeling the magnetic fields from RF
coils assuming no wavelength effects), and can be
used providing that the size of any particle is below
approximately one-tenth of the EM wavelength. If
the density of the particles (termed inclusions) is high
it is important to analyze how their dipole moments
‘‘communicate’’ with each other.
There are many laws which describe the behavior
of a mixture or composite of two different dielectric
materials. The classical theoretical models are based
upon calculating the polarizability of a single sphere
of dielectric material, which is given by:
a ¼ V ei � eeð Þ 3eeei þ 2ee
[58]
where V is the volume of the sphere, ei is the permit-
tivity of the inclusions (e.g., metal titanate particles),
and ee that of the surrounding environment (e.g.,
deuterated water). In this case the effective permit-
tivity is given by the Clausius-Mossotti formula (also
referred to as the Lorenz-Lorentz formula):
eeff ¼ ee þ na
1� na=3ee[59]
where n is the number density of dipole moments.
These two equations can be combined to give the
Maxwell Garnett formula:
eeff ¼ ee þ 3f eeei � ee
ei þ 2ee � f ei � eeð Þ [60]
where f is the fraction of inclusions. In the limits,
when f ? 0 then eeff ? ee, and when f ? 1 then eeff? ei, as expected. There are a large number of
related models, including the Bruggeman/Polder-van
Santen and the ‘‘Unified mixing formula,’’ which are
covered in detail in reference (61).A set of very useful and simple semiempirical
[although it should be noted that a recent publication
provides a rigorous derivation of these laws from
Maxwell’s equations (62)] dielectric mixing laws are
knows as Lichtenecker’s equations (63). One exam-
ple is Lichtenecker’s power law, which is given by:
eseff ¼ f1es1 þ f2es2 [61]
where the coefficient s lies between -1 and 1. Spe-
cific values of s correspond to well-known equa-
tions, for example s ¼1/3 to the Looyenga equation
and s ¼½ to the Krawzenski equations, with s ¼1
representing a linear law. Another very simple law is
Lichtenecker’s logarithmic law:
log eeffð Þ ¼Xmi¼1
vi log ei [62]
There are also a number of more sophisticated
models which take into account the fact that the
interface between the two phases can play a critical
role. For example, the Vo-Shi model (64) can be
used for cases in which the formation of interfacial
dipoles with high molecular polarizability occurs
(65–67). For an extensive review of the mixing rule
development see Sihvola (61).In section 7 it is shown that simple suspensions
follow Lichtenecker’s power law well, but that addi-
tion of chemical dispersants, to increase the maxi-
mum concentration of high permeability materials
before the mixture saturates, causes significant devia-
tions from this behavior. In this case, a more compli-
cated model such as the Vo-Shi may be necessary for
accurate modeling.
Applications of Dielectric Suspensionsto High Field MRI
The gel-based commercial dielectric pads in currentuse at 3 T are relatively thick in size (several cm),
rigid and heavy. They have a relative permittivity of�60, and since they contain significant paramagnetic
concentrations, can cause signal loss in single-shot
rapid imaging or long echo-time gradient-echosequences due to strong magnetic susceptibility
effects. Particularly for studies at high magneticfields, one would ideally like a material which has a
permittivity higher than water (but which also offers
the possibility to be tailored in value), a low back-ground MR signal without paramagnetic doping, and
one which can be geometrically formed to adapt todifferent patient sizes.
One possibility is to use the calcium and barium
titanates already outlined in the section on dielectricresonators. Although these materials have a very high
permittivity when they are sintered and pressed, thevalues for the native powders are much lower, since
the volume ratio of the powder is only �40%, i.e.,
60% of the volume of a given sample is air. How-ever, by creating a suspension of the powders with
deionized water, the permittivity can be increased,with a value that can be tailored by the appropriate
composition of the suspension. These powders are
widely availability at low cost. The properties ofthese suspensions, as expanded in later sections, are:
(i) a high permittivity between 100 and 120 for cal-cium titanate and 150–250 for barium titanate, (ii) a
DIELECTRIC MATERIALS IN MAGNETIC RESONANCE 173
Concepts in Magnetic Resonance Part A (Bridging Education and Research) DOI 10.1002/cmr.a

low background signal due primarily to short T2 andT�2 values, but also to a reduced water content, (iii)
the possibility to essentially eliminate the back-
ground signal completely via the use of deuterated
water, and (iv) the formation of a geometrically de-
formable but stable suspension (68).CaTiO3 is available as a fine powder with a den-
sity of �4.1 g/cc. To form a suspension CaTiO3 can
be mixed with distilled, de-ionized water in volume/
volume ratios up to 40%, at which point the suspen-
sion becomes saturated. Barium titanate is also avail-
able in fine powder form, but becomes saturated at a
much lower volume/volume ratio of �25%. The per-
mittivities and loss tangents of the two types of sus-
pension are shown as a function of frequency
between 100 and 400 MHz in Figure 28. As can be
seen, for pure water the real component of the per-
mittivity does not vary very much with frequency,
and the imaginary component is much smaller than
the real one. The imaginary component, and there-
fore also the loss tangent, increases with frequency.
This behavior is well-known, and has been described
in detail in, for example, the context of very high
field superconducting high-resolution NMR probe
design (69). For the titanate suspensions, the real
component is also quite independent of frequency
above �250 MHz, whereas the imaginary component
decreases as a 1/f function for CaTiO3 and is almost
frequency independent for BaTiO3. As the percent-
age of titanates increase both the real and imaginary
components of the permittivity increase.
Theoretical values of permittivity as a function of
the volume fraction can be calculated using Lichte-
necker’s logarithmic power law, Eq. [62], as shown
in Figure 29. It should be noted that the data points
corresponding to 10 and 15% CaTiO3 do not fit the
power law particularly well due to the physical diffi-
culty of producing a stable suspension at such low
concentrations of the powder: the probe measure-
ments are made at the top of the suspension, so this
means that the measured values are underestimates.
These data are therefore not shown.
For the calcium titanate suspension the T1 value
for the dielectric pad was measured to be 110 ms, the
T2-value 12 ms, and the T�2 value less than 2 ms. The
shortening of the transverse relaxation times in a sus-
pension is very familiar from the field of porous
media magnetic resonance.
Both CaTiO3 and BaTiO3 suspensions have been
used for imaging at 7 T. To maintain clinical utility
in terms of high sensitivity and parallel imaging
capability, a close-fitting 16-channel receive array
Figure 28 Plots of the real and imaginary components, as well as the derived loss tangent for
water and different concentrations of calcium and barium titanates.
174 WEBB
Concepts in Magnetic Resonance Part A (Bridging Education and Research) DOI 10.1002/cmr.a
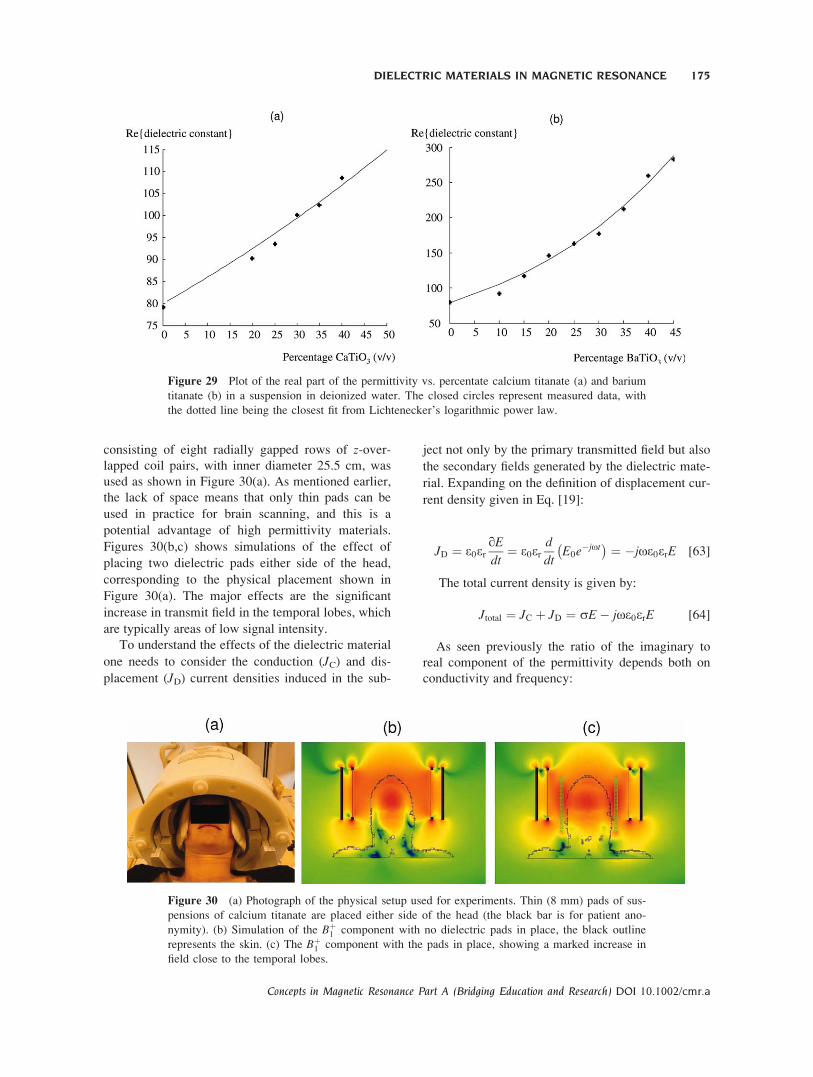
consisting of eight radially gapped rows of z-over-lapped coil pairs, with inner diameter 25.5 cm, was
used as shown in Figure 30(a). As mentioned earlier,
the lack of space means that only thin pads can be
used in practice for brain scanning, and this is a
potential advantage of high permittivity materials.
Figures 30(b,c) shows simulations of the effect of
placing two dielectric pads either side of the head,
corresponding to the physical placement shown in
Figure 30(a). The major effects are the significant
increase in transmit field in the temporal lobes, which
are typically areas of low signal intensity.
To understand the effects of the dielectric material
one needs to consider the conduction (JC) and dis-
placement (JD) current densities induced in the sub-
ject not only by the primary transmitted field but also
the secondary fields generated by the dielectric mate-
rial. Expanding on the definition of displacement cur-
rent density given in Eq. [19]:
JD ¼ e0erqEdt
¼ e0erd
dtE0e
�jot� � ¼ �joe0erE [63]
The total current density is given by:
Jtotal ¼ JC þ JD ¼ sE� joe0erE [64]
As seen previously the ratio of the imaginary to
real component of the permittivity depends both on
conductivity and frequency:
Figure 29 Plot of the real part of the permittivity vs. percentate calcium titanate (a) and barium
titanate (b) in a suspension in deionized water. The closed circles represent measured data, with
the dotted line being the closest fit from Lichtenecker’s logarithmic power law.
Figure 30 (a) Photograph of the physical setup used for experiments. Thin (8 mm) pads of sus-
pensions of calcium titanate are placed either side of the head (the black bar is for patient ano-
nymity). (b) Simulation of the Bþ1 component with no dielectric pads in place, the black outline
represents the skin. (c) The Bþ1 component with the pads in place, showing a marked increase in
field close to the temporal lobes.
DIELECTRIC MATERIALS IN MAGNETIC RESONANCE 175
Concepts in Magnetic Resonance Part A (Bridging Education and Research) DOI 10.1002/cmr.a
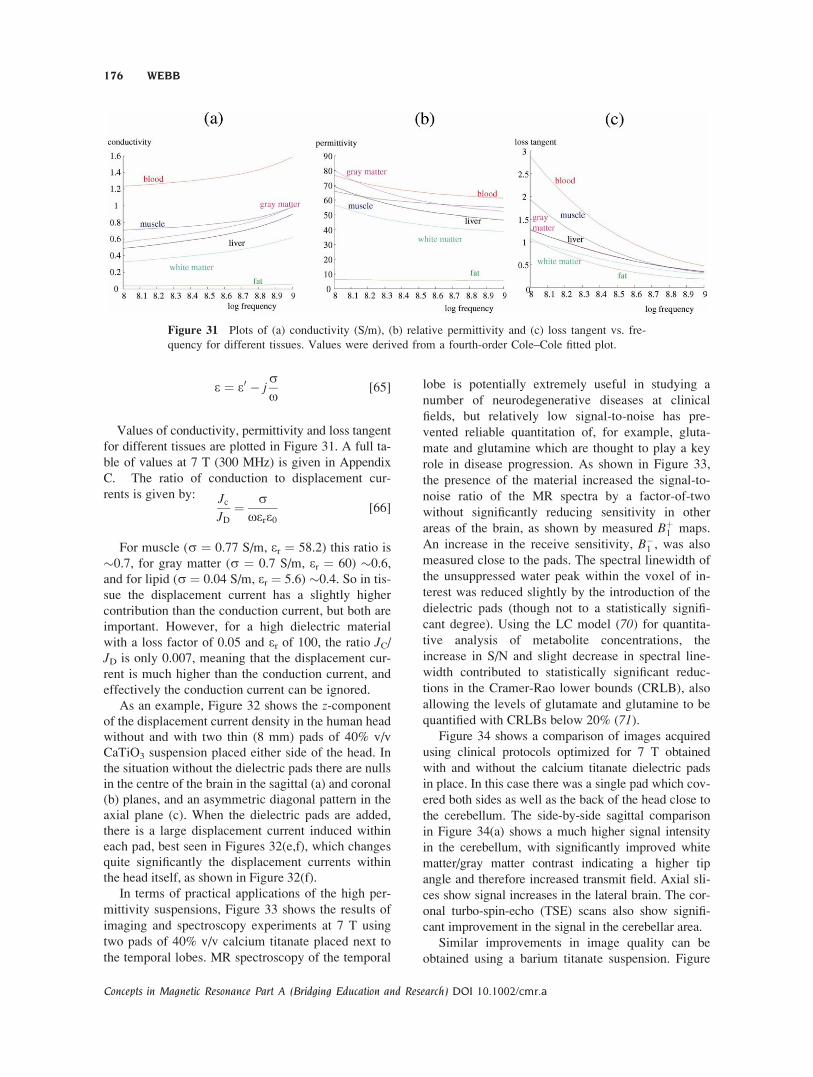
e ¼ e0 � jso
[65]
Values of conductivity, permittivity and loss tangent
for different tissues are plotted in Figure 31. A full ta-
ble of values at 7 T (300 MHz) is given in Appendix
C. The ratio of conduction to displacement cur-
rents is given by: JcJD
¼ soere0
[66]
For muscle (s ¼ 0.77 S/m, er ¼ 58.2) this ratio is
�0.7, for gray matter (s ¼ 0.7 S/m, er ¼ 60) �0.6,
and for lipid (s ¼ 0.04 S/m, er ¼ 5.6) �0.4. So in tis-
sue the displacement current has a slightly higher
contribution than the conduction current, but both are
important. However, for a high dielectric material
with a loss factor of 0.05 and er of 100, the ratio JC/JD is only 0.007, meaning that the displacement cur-
rent is much higher than the conduction current, and
effectively the conduction current can be ignored.
As an example, Figure 32 shows the z-component
of the displacement current density in the human head
without and with two thin (8 mm) pads of 40% v/v
CaTiO3 suspension placed either side of the head. In
the situation without the dielectric pads there are nulls
in the centre of the brain in the sagittal (a) and coronal
(b) planes, and an asymmetric diagonal pattern in the
axial plane (c). When the dielectric pads are added,
there is a large displacement current induced within
each pad, best seen in Figures 32(e,f), which changes
quite significantly the displacement currents within
the head itself, as shown in Figure 32(f).
In terms of practical applications of the high per-
mittivity suspensions, Figure 33 shows the results of
imaging and spectroscopy experiments at 7 T using
two pads of 40% v/v calcium titanate placed next to
the temporal lobes. MR spectroscopy of the temporal
lobe is potentially extremely useful in studying a
number of neurodegenerative diseases at clinical
fields, but relatively low signal-to-noise has pre-
vented reliable quantitation of, for example, gluta-
mate and glutamine which are thought to play a key
role in disease progression. As shown in Figure 33,
the presence of the material increased the signal-to-
noise ratio of the MR spectra by a factor-of-two
without significantly reducing sensitivity in other
areas of the brain, as shown by measured Bþ1 maps.
An increase in the receive sensitivity, B�1 , was also
measured close to the pads. The spectral linewidth of
the unsuppressed water peak within the voxel of in-
terest was reduced slightly by the introduction of the
dielectric pads (though not to a statistically signifi-
cant degree). Using the LC model (70) for quantita-tive analysis of metabolite concentrations, the
increase in S/N and slight decrease in spectral line-
width contributed to statistically significant reduc-
tions in the Cramer-Rao lower bounds (CRLB), also
allowing the levels of glutamate and glutamine to be
quantified with CRLBs below 20% (71).Figure 34 shows a comparison of images acquired
using clinical protocols optimized for 7 T obtained
with and without the calcium titanate dielectric pads
in place. In this case there was a single pad which cov-
ered both sides as well as the back of the head close to
the cerebellum. The side-by-side sagittal comparison
in Figure 34(a) shows a much higher signal intensity
in the cerebellum, with significantly improved white
matter/gray matter contrast indicating a higher tip
angle and therefore increased transmit field. Axial sli-
ces show signal increases in the lateral brain. The cor-
onal turbo-spin-echo (TSE) scans also show signifi-
cant improvement in the signal in the cerebellar area.
Similar improvements in image quality can be
obtained using a barium titanate suspension. Figure
Figure 31 Plots of (a) conductivity (S/m), (b) relative permittivity and (c) loss tangent vs. fre-
quency for different tissues. Values were derived from a fourth-order Cole–Cole fitted plot.
176 WEBB
Concepts in Magnetic Resonance Part A (Bridging Education and Research) DOI 10.1002/cmr.a

Figure 32 Electromagnetic simulations of the z-component of the displacement current within
the head: (a), (b), and (c) no dielectric pads present: sagittal, coronal and axial views, respectively.
(d), (e), and (f) corresponding images with two dielectric pads present on either side of the head.
Figure 33 (a) Low-resolution magnitude image without dielectric pads used for B1 mapping, (b)
corresponding image with the pads in place. (c) Changes in the Bþ1 over the slice, measured as a per-
centage, showing significant increases in the spectroscopic voxel. 1H NMR spectra acquired from the
temporal lobe of the same subject with the dielectric material present (d) and without the pads (e).
DIELECTRIC MATERIALS IN MAGNETIC RESONANCE 177
Concepts in Magnetic Resonance Part A (Bridging Education and Research) DOI 10.1002/cmr.a
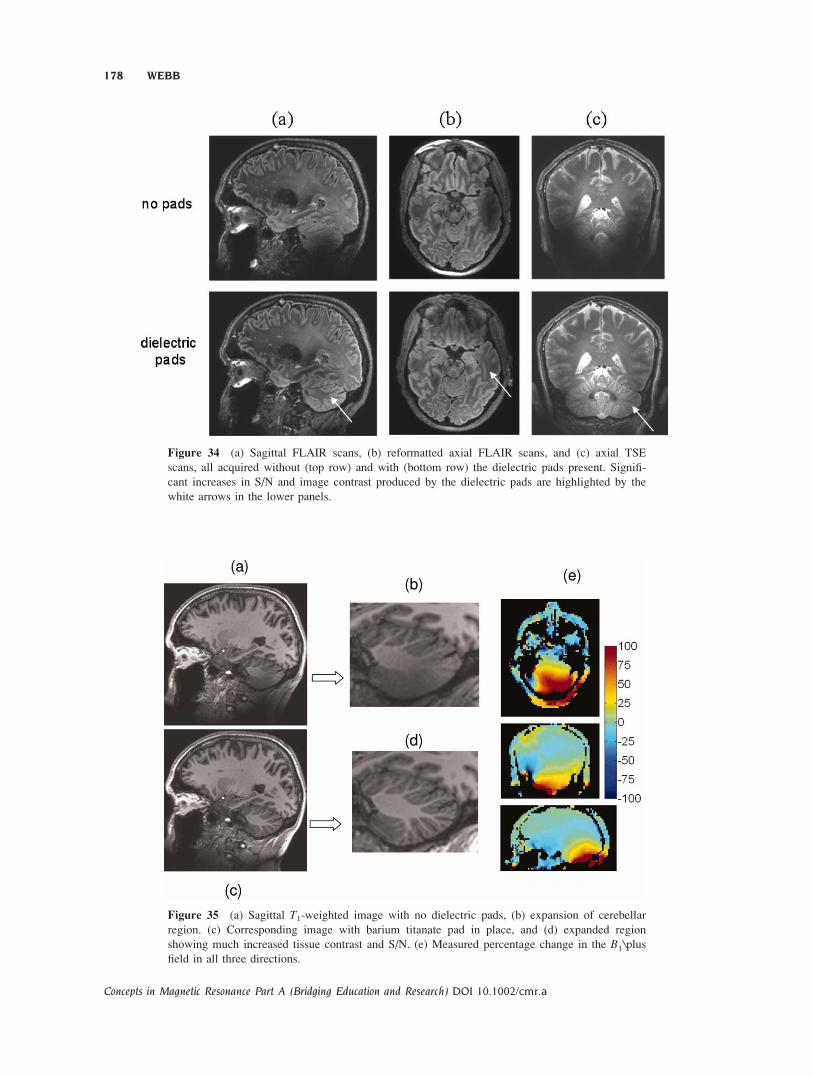
Figure 34 (a) Sagittal FLAIR scans, (b) reformatted axial FLAIR scans, and (c) axial TSE
scans, all acquired without (top row) and with (bottom row) the dielectric pads present. Signifi-
cant increases in S/N and image contrast produced by the dielectric pads are highlighted by the
white arrows in the lower panels.
Figure 35 (a) Sagittal T1-weighted image with no dielectric pads, (b) expansion of cerebellar
region. (c) Corresponding image with barium titanate pad in place, and (d) expanded region
showing much increased tissue contrast and S/N. (e) Measured percentage change in the B1\plus
field in all three directions.
178 WEBB
Concepts in Magnetic Resonance Part A (Bridging Education and Research) DOI 10.1002/cmr.a

35 below shows results using a single pad placed
behind the head of a volunteer. Increases of up to
100% in the Bþ1 at the posterior of the brain are
shown, with corresponding improvements in S/N and
image contrast in the cerebellum.
8. CONCLUSIONS AND FUTURE WORK
The use of high dielectric materials in magnetic reso-
nance is a relatively recent area of research, although
as outlined in this article, it builds upon a body of
work in EPR which is over 20 years old. Dielectric
materials can be used to form the MR resonator
itself, or alternatively to shape the EM field by plac-
ing them around the sample/subject, or by integrating
them into the RF coil itself. There are a number of areas
in which one can imagine that this area could grow.
i. Dielectric resonators used for MR have so
far only used materials with relatively low per-
mittivities (150-330), and so for microsamples
it would be extremely interesting to use mate-
rials with values in the thousands to tens
of thousands. Manufacturing tolerances would
be very tight, but extremely small resonators
or arrays of resonators should be possible to
construct.
ii. Optimizing geometries, shapes and material
properties of dielectric pads for different clinical
applications. From a simple point-of-view, a ma-
terial with unity permittivity will have no effect
of the RF field, whereas one with an extremely
high value will simply contain the magnetic field
within the material itself, and therefore decrease
the overall field available for MR excitation.
Therefore, an optimum value of the permittivity
must exist, and this value will be different
depending upon whether one wants to optimize
the S/N and RF homogeneity over a large area
such at the entire head or over a small localized
Figure 36 An illustration of the behavior of the B1\plus transmit field from a 16 leg birdcage
with materials with different permittivities placed in a cylindrical geometry inside the RF coil.
DIELECTRIC MATERIALS IN MAGNETIC RESONANCE 179
Concepts in Magnetic Resonance Part A (Bridging Education and Research) DOI 10.1002/cmr.a

area close to the surface. As an example Fig-
ure 36 shows the transmit field as a function
of the permittivity for a ring of material
placed around the head. As expected, a very
high permittivity is not useful. However, in
these cases a single large structure should not
be used, and an improved performance can
be obtained by splitting the pad into smaller
discrete elements.
iii. Another way in which high dielectrics might
be useful is in targetting the RF energy pro-
vided by an external antenna in a technique
known as ‘‘travelling wave MR’’ (72, 73).In this technique the RF shield of the mag-
net bore acts like a waveguide, allowing the
propagation of EM waves from an external
antenna, provided that the dimensions and/or
dielectric filling of the bore reduce the cut-
off frequency to below the Larmor fre-
quency. In practise this limits application to
human scanners at 7 T and above. As
shown in (73) the Poynting vector (which
represents the direction of energy flow) dif-
fracts whenever the EM encounters a high
dielectric material (such as the body), and
therefore by using low and high dielectrics
it should be possible to ‘‘focus’’ the energy
to specific areas.
ACKNOWLEDGMENTS
The authors acknowledge extremely about the use-
ful discussions with a number of people including:
Qing Yang, Chris Collins, Michael Lanagan, Chris
Randall, and Kristina Haines at the Penn State
University. Wouter Teeuwisse from the Leiden
University Medical Center provided much input into
the final document.
APPENDIX A
APPENDIX B
DIELECTRIC RELAXATION
Dielectric relaxation refers to the time delay in
the induction of molecular polarization which is
caused by the application of an electric field.
When the electric field is removed (or changes
in the case of an alternating electric field) then
there is a time associated with the molecule
returning to its equilibrium state, and this time is
called the relaxation time (t). One can consider
this to be analogous to time constants in voltage-
driven RC and RL circuits, for example. In the
case of low frequency electric fields, there is suf-
ficient time for the dipoles to reach equilibrium
between periods of the wave. This is not true at
high frequencies, and the resulting time-lag leads
to energy dissipation, i.e., the imaginary compo-
nent of the permittivity increases. Mathematically
the behavior in a pure liquid is described by the
Debye equation.
e oð Þ ¼ e0o¼1 þ e0o¼0 � e0o¼11þ jot
[B1]
Figure B1(a) shows a plot of the real and imagi-
nary components of the permittivity of water as a
function of frequency. At frequencies well below
relaxation, the rate of change of the alternating elec-
tric field is slow enough so that the dipole reorienta-
tions can keep pace. Therefore, the imaginary
(lossy) component of the permittivity is linearly
dependent upon frequency. As the frequency
increases, so that there is now a time-lag between
the dipole alignment and the changing electric field,
the real component (representing energy storage) of
the permittivity decreases rapidly. At frequencies
Table A1 Dielectric Properties of SelectedMaterials
Solvent
Electric Dipole
Moment
Relative
Permittivity
CCl4 0 2.24
C6H6 0 2.28
CH3CH2OH 1.69 24.3
HCO2H 1.41 58
H2O 1.85 80
HCONH2 3.73 109
Dielectric
Relative
Permittivity
Temperature Dependence
of the Relative
Permittivity (ppm/8C)
TiO2 (rutile) 80–100 80
Calcium titanate 150–160 200
Strontium titanate 300 300
Strontium zirconate 60 12
Barium titanatea 2,000–
10,000
40
aValues are highly dependent upon grain size and processing
conditions for most dielectrics, and so these numbers are only
intended to give an indication of the relative permittivity and tem-
perature dependence.
180 WEBB
Concepts in Magnetic Resonance Part A (Bridging Education and Research) DOI 10.1002/cmr.a

well above the relaxation frequency, both real
and imaginary components of the permittivity
decrease, since orientation polarizability ceases to
be an effective mechanism due to the dipole rota-
tion effectively ‘‘not seeing’’ the much higher fre-
quency fluctuations in the electric field. For the
frequencies associated with NMR and MRI experi-
ments the real component of the permittivity
changes relative little from the DC value, but the
imaginary component increases significantly. For
high frequency EPR experiments the imaginary
component can be significantly higher than the
real component, leading to very high losses
in aqueous samples. At still higher frequencies
(f . 1012 Hz) other mechanisms of relaxation
occur involving resonant behavior associated with
ionic polarization, but these are not relevant for
MR or EPR measurements.
The Debye equation only holds for certain sam-
ples. A generalization of the Debye equation is the
Cole–Cole equation, which can be used for water-
containing substances:
e oð Þ ¼ e0o¼1 þ e0o¼0 � e0o¼11þ jotð Þ1�a [B2]
where 0 , a , 1, which of course becomes
the Debye equation when a ¼ 0. Figure B1(b)
shows a typical Cole–Cole plot, which lots the real
vs. imaginary component of the permittivity, and
which is a semicircle for materials with a single
relaxation frequency. The peak of the loss factor,
i.e., the highest point on the vertical axis, corre-
sponds to the relaxation frequency.
APPENDIX C
REFERENCES
1. Kraus JD, Fleisch DA. 1999. Electromagnetics with
Applications, Chapters 4 and 7. McGraw-Hill.
2. Galasso FS. 1969. Structure Properties and Prepara-
tion of Perovskite Type Compounds. Oxford: Perga-
mon Press. 3 p.
3. Buessem WR, Cross LE, Goswami AK. 1966.
Phenomenological theory of high permittivity in
Conductivities and Permittivities of BiologicalTissue at 300 mhz
Tissue
Conductivity
(S/m)
Relative
Permittivity
Skin 49.8 0.64
Tendon 48.0 0.54
Fat 5.6 0.04
Cortical bone 13.4 0.08
Cancellous bone 23.2 0.22
Blood 65.7 1.32
Muscle 58.2 0.77
Gray matter 60.0 0.69
White matter 43.8 0.41
Cerebrospinal fluid 72.7 2.22
Cerebellum 59.7 0.97
Sclera 58.9 0.98
Vitreous humor 69.0 1.52
Nerve 36.9 0.42
Cartilage 46.8 0.55
Tongue 58.9 0.74
Stomach 68.7 0.97
Lung 24.8 0.36
Figure B1 Behavior of the complex permittivity of water as a function of frequency. (a) values
of real (bold lines) and imaginary (thin lines) follow the Debye equation. (b) the corresponding
Cole–Cole plot.
DIELECTRIC MATERIALS IN MAGNETIC RESONANCE 181
Concepts in Magnetic Resonance Part A (Bridging Education and Research) DOI 10.1002/cmr.a

fine-grained barium titanate. J Am Cer Soc 49:
33–36.
4. von Hippel AR. 1954. Dielectric Materials and Appli-
cations. New York: MIT Technical and John Wiley.
5. Nalwa H. 1999. Handbook of low and high dielectric
constant materials and their applications. London,
UK: Academic Press.
6. Glisson AW. 1986. Dielectric resonators. In: Kajfez
D,Guillon P, eds. Norwood, Massachusetts: Artech House.
7. Fiedzius S, Jelenski A. 1971. Influence of conducting
walls on resonant frequencies of dielectric microwave
resonator. IEEE Trans Microwave Theory Tech
MT19:778.
8. Pospieszalski MW. 1979. Cylindrical dielectric
resonators and their applications in tem line micro-
wave circuits. IEEE Trans Microwave Theory Tech
27:233–238.
9. Jaworski M, Sienkiewicz A, Scholes CP. 1997. Dou-
ble-stacked dielectric resonator for sensitive EPR
measurements. J Magn Reson 124:87–96.
10. Gurevich VL, Tagantsev AK. 1991. Intrinsic dielec-
tric loss in crystals. Adv Phys 40:719–767.
11. Walsh WM, Rupp LW. 1986. Enhanced electron-
spin-resonance sensitivity using a dielectric resonator.
Rev Sci Instrum 57:2278–2279.
12. Hakki BW, Coleman PD. 1960. A dielectric resonator
method of measuring inductive capacities in the milli-
meter range. Microwave Theory Tech IRE Trans
8:402–410.
13. Cohn SB, Kelly KC. 1966. Microwave measurement
of high-dielectric-constant materials. IEEE Trans
Microwave Theory Tech MT14:406.
14. Courtney WE. 1970. Analysis and evaluation of a
method of measuring complex permittivity and per-
meability of microwave insulators. IEEE Trans
Microwave Theory Tech MT18:476.
15. Kobayashi Y, Katoh M. 1985. Microwave measure-
ment of dielectric-properties of low-loss materials by
the dielectric rod resonator method. IEEE Trans
Microwave Theory Tech 33:586–592.
16. Annino G, Cassettari M, Longo I, Martinelli M.
1999. Dielectric resonators in ESR: overview, com-
ments and perspectives. Appl Magn Reson 16:45–62.
17. Carter DL, Okaya A. 1960. Electron paramagnetic
resonance of Fe-3 in Tio2 (Rutile). Phys Rev 118:
1485–1490.
18. Okaya A. 1960. The rutile microwave resonator. Proc
Inst Radio Eng 48:1921.
19. Rosenbaum FJ. 1964. Dielectric cavity resonator for
ESR experiments. Rev Sci Instrum 35:1550–1554.
20. Harthhoorn JL, Smidt J. 1969. Dielectric cavity reso-
nator applied to electron spin resonance. Appl Sci
Res 20:148–160.
21. Dykstra RW, Markham GD. 1986. A dielectric sam-
ple resonator design for enhanced sensitivity of elec-
tron paramagnetic resonance spectroscopy. J Magn
Reson 69:350–355.
22. Bromberg SE, Chan IY. 1992. Enhanced sensitivity
for high-pressure EPR using dielectric resonators.
Rev Sci Instrum 63:3670–3673.
23. Sakai N, Pifer JH. 1985. Electron-paramagnetic reso-
nance at high-pressure using a diamond anvil cell.
Rev Sci Instrum 56:726–731.
24. Sienkiewicz A, Qu KB, Scholes CP. 1994. Dielectric
resonator-based stopped-flow electron-paramagnetic-
resonance. Rev Sci Instrum 65:68–74.
25. Lassmann G, Schmidt PP, Lubitz W. 2005. An
advanced EPR stopped-flow apparatus based on a
dielectric ring resonator. J Magn Reson 172:312–323.
26. Wen H, Jaffer FA, Denison TJ, Duewell S, Chesnick
AS, Balaban RS. 1996. The evaluation of dielectric
resonators containing H2O or D2O as RF coils for
high-field MR imaging and spectroscopy. J Magn
Reson Ser B 110:117–123.
27. Neuberger T, Tyagi V, Semouchkina E, Lanagan M,
Baker A, Haines K, et al. 2008. Design of a ceramic
dielectric resonator for NMR microimaging at 14.1
tesla. Concept Magn Reson Part B: Magn Reson Eng
33B:109–114.
28. Haines K, Neuberger T, Lanagan M, Semouchkina E,
Webb AG. 2009. High Q calcium titanate cylindrical
dielectric resonators for magnetic resonance microi-
maging. J Magn Reson 200:349–353.
29. Foo TK, Hayes CE, Kang YW. 1992. Reduction of
RF penetration effects in high field imaging. Magn
Reson Med 23:287–301.
30. Gabriel C, Gabriel S, Corthout E. 1996. The dielec-
tric properties of biological tissues: I. Literature sur-
vey. Phys Med Biol 41:2231–2249.
31. Gabriel S, Lau RW, Gabriel C. 1996. The dielectric
properties of biological tissues: III. Parametric models
for the dielectric spectrum of tissues. Phys Med Biol
41:2271–2293.
32. Gabriel S, Lau RW, Gabriel C. 1996. The dielectric
properties of biological tissues: II. Measurements in
the frequency range 10 Hz to 20 GHz. Phys Med Biol
41:2251–2269.
33. Foo TK, Hayes CE, Kang YW. 1991. An analytical
model for the design of RF resonators for MR body
imaging. Magn Reson Med 21:165–177.
34. Butterworth EJ, Walsh EG, Hugg JW. 2001. TiO2
dielectric filled toroidal radio frequency cavity reso-
nator for high-field NMR. NMR Biomed 14:184–191.
35. Gor’kov PL, Witter R, Chekmenev EY, Nozirov F,
Fu R, Brey WW. 2007. Low-E probe for (19)F-(1)H
NMR of dilute biological solids. J Magn Reson
189:182–189.
36. Gor’kov PL, Chekmenev EY, Li C, Cotten M, Buffy
JJ, Traaseth NJ, et al. 2007. Using low-E resonators
to reduce RF heating in biological samples for static
solid-state NMR up to 900 MHz. J Magn Reson
185:77–93.
37. McNeill SA, Gor’ kov PL, Shetty K, Brey WW,
Long JR. 2009. A low-E magic angle spinning probe
182 WEBB
Concepts in Magnetic Resonance Part A (Bridging Education and Research) DOI 10.1002/cmr.a

for biological solid state NMR at 750 MHz. J Magn
Reson 197:135–144.
38. Grant CV, Wu CH, Opella SJ. 2010. Probes for high
field solid-state NMR of lossy biological samples.
J Magn Reson 204:180–188.
39. Stringer JA, Bronnimann CE, Mullen CG, Zhou DH,
Stellfox SA, Li Y, et al. 2005. Reduction of RF-
induced sample heating with a scroll coil resonator
structure for solid-state NMR probes. J Magn Reson
173:40–48.
40. Crum LA, Zilm KW. 2007. Resonator designs for
decreasing sample heating in solid state NMR experi-
ments. Presented at the Exp NMR Conf, Asilomar,
April 2007.
41. Neufeld A, Landsberg N, Boag A. 2009. Dielectric
inserts for sensitivity and RF magnetic field enhance-
ment in NMR volume coils. J Magn Reson 200:49–55.
42. Webb AG, Collins CM. 2010. Parallel transmit and
receive technology in high-field magnetic resonance
neuroimaging. Int J Imaging Syst Technol 20:2–13.
43. Collins CM, Smith MB. 2001. Calculations of B1 dis-
tribution, SNR, and SAR for a surface coil adjacent
to an anatomically-accurate human body model.
Magn Reson Med 45:692–699.
44. Collins CM, Yang B, Yang QX, Smith MB. 2002.
Numerical calculations of the static magnetic field in
three-dimensional multi-tissue models of the human
head. Magn Reson Imaging 20:413–424.
45. Collins CM, Yang QX, Wang JH, Zhang X, Liu H,
Michaeli S, et al. 2002. Different excitation and recep-
tion distributions with a single-loop transmit-receive
surface coil near a head-sized spherical phantom at
300 MHz. Magn Reson Med 47:1026–1028.
46. Wang J, Yang QX, Zhang X, Collins CM, Smith
MB, Zhu XH, et al. 2002. Polarization of the RF field
in a human head at high field: a study with a quadra-
ture surface coil at 7.0 T. Magn Reson Med 48:362–
369.
47. Collins CM, Liu W, Wang J, Gruetter R, Vaughan
JT, Ugurbil K, et al. 2004. Temperature and SAR cal-
culations for a human head within volume and sur-
face coils at 64 and 300 MHz. J Magn Reson Imag-
ing 19:650–656.
48. Wang Z, Lin JC, Mao W, Liu W, Smith MB, Collins
CM. 2007. SAR and temperature: simulations and
comparison to regulatory limits for MRI. J Magn
Reson Imaging 26:437–441.
49. IEC. 2002. International standard, medical equip-
ment—part 2: particular requirements for the safetyof
magnetic resonance equipment for medical diagnosis,
2nd revision. International Electrotechnical Commis-
sion Brussels 601–2-33.
50. Metzger GJ, Snyder C, Akgun C, Vaughan T, Ugurbil
K, van de Moortele PF. 2008. Local B1 shimming
for prostate imaging with transceiver arrays at 7T
based on subject-dependent transmit phase measure-
ments. Magn Reson Med 59:396–409.
51. Vaughan T, DelaBarre L, Snyder C, Tian J, Akgun
C, Shrivastava D, et al. 2006. 9.4T human MRI: pre-
liminary results. Magn Reson Med 56:1274–1282.
52. Zelinski AC, Wald LL, Setsompop K, Alagappan V,
Gagoski BA, Goyal VK, et al. 2008. Fast slice-selec-
tive radio-frequency excitation pulses for mitigating
B1 inhomogeneity in the human brain at 7 tesla.
Magn Reson Med 59:1355–1364.
53. Franklin KM, Dale BM, Merkle EM. 2008. Improve-
ment in B1-inhomogeneity artifacts in the abdomen
at 3T MR imaging using a radiofrequency cushion.
J Magn Reson Imaging 27:1443–1447.
54. Sreenivas A, Lowry M, Gibbs P, Pickles M, Turnbull
LW. 2007. A simple solution for reducing artefacts
due to conductive and dielectric effects in clinical
magnetic resonance imaging at 3 T. Eur J Radiol
62:143–146.
55. Takayama Y, Nonaka H, Nakajima M, Obata T,
Ikehira H. 2008. Reduction of a high-field dielectric
artifact with homemade gel. Magn Reson Med Sci
7:37–41.
56. Sunaga T, Ikehira H, Furukawa S, Tamura M, Yoshi-
tome E, Obata T, Shinkai H, Tanada S, Murata H,
Sasaki Y. 2003. Development of a dielectric equiva-
lent gel for better impedance matching for human
skin. Bioelectromagnetics 24:214–217.
57. Sled JG, Pike GB. 1998. Standing-wave and RF pene-
tration artifacts caused by elliptic geometry: an elec-
trodynamic analysis of MRI. IEEE Trans Med Imag-
ing 17:653–662.
58. Yang QX, Mao W, Wang J, Smith MB, Lei H, Zhang
X, Ugurbil K, Chen W. 2006. Manipulation of image
intensity distribution at 7.0 T: passive RF shimming
and focusing with dielectric materials. J Magn Reson
Imaging 24:197–202.
59. Oster G. 1946. The dielectric properties of liquid
mixtures. J Am Chem Soc 68:2036–2041.
60. Harvey AH, Prausnitz JM. 1987. Dielectric-constants
of fluid mixtures over a wide-range of temperature
and density. J Solution Chem 16:857–869.
61. Sihvola A. 2000. Mixing rules with complex dielec-
tric coefficients. Subsurface Sensing Technol Appl
1:393–415.
62. Simpkin R. 2010. Derivation of Lichtenecker’s loga-
rithmic mixture formula from Maxwell’s equations.
IEEE Trans Microwave Theory Tech 58:545–550.
63. Goncharenko AV, Lozovski VZ, Venger EF. 2000.
Lichtenecker’s equation: applicability and limitations.
Opt Commun 174:19–32.
64. Vo HT, Shi FG. 2002. Towards model-based engi-
neering of optoelectronic packaging materials: dielec-
tric constant modeling. Microelectron J 33:409–415.
65. Tuncer E, Serdyuk YV, Gubanski SM. 2002. Dielec-
tric mixtures: electrical properties and modeling.
IEEE Trans Dielect Elect Insul 9:809–828.
66. Tuncer E, Nettelblad B, Gubanski SM. 2002.
Non-Debye dielectric relaxation in binary dielectric
DIELECTRIC MATERIALS IN MAGNETIC RESONANCE 183
Concepts in Magnetic Resonance Part A (Bridging Education and Research) DOI 10.1002/cmr.a

mixtures (50–50): randomness and regularity in mix-
ture topology. J Appl Phys 92:4612–4624.
67. Tuncer E. 2004. Signs of low frequency dispersions
in disordered binary dielectric mixtures (fifty-fifty). J
Phys D: Appl Phys 37:334–342.
68. Haines K, Smith NB, Webb AG. 2010. New high
dielectric constant materials for tailoring the B-1()
distribution at high magnetic fields. J Magn Reson
203:323–327.
69. Horiuchi T, Takahashi M, Kikuchi J, Yokoyama S,
Maeda H. 2005. Effect of dielectric properties of
solvents on the quality factor for a beyond 900
MHz cryogenic probe model. J Magn Reson
174:34–42.
70. Provencher SW. 1993. Estimation of metabolite con-
centrations from localized in vivo proton NMR spec-
tra. Magn Reson Med 30:672–679.
71. Snaar JE, Teeuwisse WM, Versluis MJ, van Buchem
MA, Kan HE, Smith NB, et al. 2010. Improvements
in high-field localized MRS of the medial temporal
lobe in humans using new deformable high-dielectric
materials. NMR Biomed. DOI: 10.1002/nbm.1638
72. Brunner DO, De ZN, Frohlich J, Paska J, Pruessmann
KP. 2009. Travelling-wave nuclear magnetic reso-
nance. Nature 457:994–998.
73. Webb AG, Collins CM, Versluis MJ, Kan HE,
Smith NB. 2010. MRI and localized proton
spectroscopy in human leg muscle at 7 T using lon-
gitudinal traveling waves. Magn Reson Med 63:
297–302.
BIOGRAPHIES
Andrew Webb received his Bachelors
degree in Chemistry from the University
of Bristol in 1986 and his Ph.D. from
the University of Cambridge in 1989.
He is currently a Full Professor in the
Department of Radiology at the Leiden
University Medical Center in The Neth-
erlands, and is Director of the C.J.
Gorter Center for High Field Magnetic
Resonance Imaging. His major area of research is the develop-
ment of new engineering techniques for clinical applications of
high field MRI.
184 WEBB
Concepts in Magnetic Resonance Part A (Bridging Education and Research) DOI 10.1002/cmr.a