Embed Size (px)
Citation preview
S. Singha and M. J. Thomas: Dielectric Properties of Epoxy Nanocomposites
1070-9878/08/$25.00 © 2008 IEEE
12
Dielectric Properties of Epoxy Nanocomposites
Santanu Singha and M. Joy Thomas High Voltage Laboratory
Department of Electrical Engineering Indian Institute of Science Bangalore, India 560 012
ABSTRACT
The dielectric properties of epoxy nanocomposites with insulating nano-fillers, viz., TiO2, ZnO and Al2O3 were investigated at low filler concentrations by weight. Epoxy nanocomposite samples with a good dispersion of nanoparticles in the epoxy matrix were prepared and experiments were performed to measure the dielectric permittivity and tan delta (400 Hz-1 MHz), dc volume resistivity and ac dielectric strength. At very low nanoparticle loadings, results demonstrate some interesting dielectric behaviors for nanocomposites and some of the electrical properties are found to be unique and advantageous for use in several existing and potential electrical systems. The nanocomposite dielectric properties are analyzed in detail with respect to different experimental parameters like frequency (for permittivity/tan delta), filler size, filler concentration and filler permittivity. In addition, epoxy microcomposites for the same systems were synthesized and their dielectric properties were compared to the results already obtained for nanocomposites. The interesting dielectric characteristics for epoxy based nanodielectric systems are attributed to the large volume fraction of interfaces in the bulk of the material and the ensuing interactions between the charged nanoparticle surface and the epoxy chains.
Index Terms — epoxy nanocomposites, dielectrics, permittivity, tan delta, volume resistivity, dielectric strength
1 INTRODUCTION
EPOXY and epoxy based composites are preferred insulating materials for several electrical applications, especially printed circuit boards, bushings, GIS spacers, generator groundwall insulation system and cast resin transformers. Recently, epoxy based nanodielectric systems are being increasingly investigated for their electrical properties, since the introduction of nano-fillers demonstrate several advantages in their properties when compared with the similar properties obtained for epoxy systems with micrometer sized fillers [1,2,3]. Several dielectric properties in epoxy nanocomposites have been evaluated in the last couple of years and the permittivity and tan delta values in nanocomposites are reported to be lower than that of base epoxy and microcomposites when insulating oxides are used as the fillers [1,3]. A similar reduction in the values of permittivity and tan delta were also observed when layered nano-silicates were dispersed in epoxy [4]. An epoxy nanocomposite system displays high permittivity at low frequencies and high electrical conductivities with low percolation thresholds when conducting fillers are dispersed [5]. With respect to the electrical breakdown characteristics in polymer nanocomposites, several reports are available on different polymeric systems. In epoxy nanocomposites filled with TiO2 fillers, the ac voltage endurance,
short-term dc and ac dielectric strengths and impulse breakdown strengths are found to be higher as compared to microcomposites [6,7]. Similarly, a higher ac electrical breakdown time is recorded in epoxy composites with Al2O3 nano-fillers as compared to unfilled epoxy [8]. In another study on the electrical breakdown characteristics in SiO2 filled epoxy systems, it is seen that although the insulation breakdown strengths in nanocomposites are less than that of base epoxy, they can be higher if silane coated SiO2 nano-fillers are utilized [9]. These interesting observations in the electrical properties of epoxy nanocomposites are highly encouraging and they are mainly attributed to the unique properties of nanoparticles and the dynamics at the interfacial region [10,11,12].
It can be observed from the reported investigations mentioned in the previous paragraph that most of the studies on epoxy nanocomposites were performed at filler loadings of 1% and above. Since the surfaces of nanoparticles are highly active, a significant change in the electrical properties of the epoxy nanocomposites can also occur at very low nano-filler concentrations. With this expectation, this study attempts to analyze the electrical characteristics of epoxy nanocomposites at low nano-filler concentrations (≤ 5% by weight). The fillers considered for the investigations are TiO2, ZnO and Al2O3, the characteristics of which are mainly insulating in nature. The electrical properties under evaluation are the following: (a) Manuscript received on 16 July 2007, in final form 12 December 2007.
IEEE Transactions on Dielectrics and Electrical Insulation Vol. 15, No. 1; February 2008 13
dielectric permittivity and tan delta (4×10²–106 Hz) [TiO2, ZnO]; (b) dc volume resistivity [TiO2, ZnO, Al2O3]; (c) ac dielectric strength [TiO2, Al2O3]. The nanocomposite electrical properties are compared and analyzed with respect to the corresponding properties obtained for unfilled base epoxy and epoxy microcomposites (wherever possible).
2 EXPERIMENTAL DETAILS
2.1 MATERIALS Epoxy, one of the most widely used insulating materials
in the electrical industry is used as the base polymer material in the present study. A Bisphenol-A epoxy resin (CY1300) along with hardener (HY956), supplied by Huntsman is used for the investigations. One of the advantages of this particular epoxy resin is that it doesn’t contain any fillers and it has a low initial viscosity. For processing a sample using this epoxy resin and hardener, 100 parts by weight of the CY1300 resin is mixed homogenously with 25 parts by weight of the HY956 hardener. As for the fillers, highly pure grades of commercially available uncoated particles of TiO2 [nano-filler size ≈ 50 nm, micron filler size ≈ 0.5 μm], Al2O3 [nano-filler size ≈ 45 nm, micron filler size ≈ 50-60 μm] and ZnO [nano-filler size ≈ 45-70 nm] are procured from Sigma Aldrich and used for the experiments.
2.2 EPOXY NANOCOMPOSITE SYNTHESIS AND SAMPLE PREPARATION
A processing method involving combination of two different techniques is used to prepare the nanocomposite samples with different fillers – high shear mechanical mixing at 700 rpm for 60 s followed by ultrasonication for 1 h [13]. These processing methods are preferred because they are not very complicated from laboratory processing point of view and commercially available polymers and particles could be mixed with ease to prepare a composite. In ultrasonication technique, the required quantity of inorganic fillers are mixed to the epoxy resin under normal hand stirring and then sonication is carried out in a water bath at a frequency of 24 kHz. With respect to the mechanical mixing method, the particles are mixed to the epoxy resin in a high shear mechanical mixer at a speed of 700 rpm.
Before initiating the process to prepare nanocomposite samples, the epoxy resin and hardener are taken in two different beakers and they are both degassed at 40 0C for 2 h to remove trapped air bubbles and moisture. The TiO2 particles of both sizes are dried at 90 0C for 24 h. An important parameter during the experiments is the need for vacuum evacuation during polymer processing. The presence of air bubbles, moisture or other unintended matter in the polymer matrix can act as defects, which in turn can significantly influence the dielectric properties of the epoxy composites. During the composite preparation, air bubbles can get trapped in the material, especially during the mixing processes. To negate the influence of air bubbles on the
dielectric measurements, degassing of the polymer-particle mix was carried out at several stages during processing, before the curing of the resin-particle-hardener mix is carried out.
To begin with, approximately 40 ml of resin is poured into the mixer immediately after the degassing process and the required quantity of fillers (based on weight fractions) is slowly dispersed into the epoxy resin with continuous hand stirring. The mechanical mixer is then used at 700 rpm for 1 h. The resin-particle mix is then degassed till the air bubbles stopped coming out of the mix (around 5 minutes due to reduced viscosity of the mixture). Immediately after this degassing, 7 ml of mix (required for one sample preparation) each was poured into different smaller beakers and they are sonicated for the desired duration. Then, the appropriate amount of hardener is poured into the beaker, mixed vigorously with hand for few minutes and poured into the mold. The mold with the composite material is again degassed (to remove the air bubbles formed during hardener mixing) till the air bubbles fully stopped coming out of the material. The mold is then left for curing inside an oven at 60 0C for 4 h. The choice of curing temperature and time was considered based on the material specifications data sheet. For preparing the microcomposite samples, only mechanical mixing for a duration of 120 s was used for mixing the fillers to epoxy since it was found that a good dispersion could be obtained with this method. Samples of 75 mm diameter and 1 mm thickness were molded and then they are kept under vacuum desiccation for at least 24 h before the dielectric property measurements.
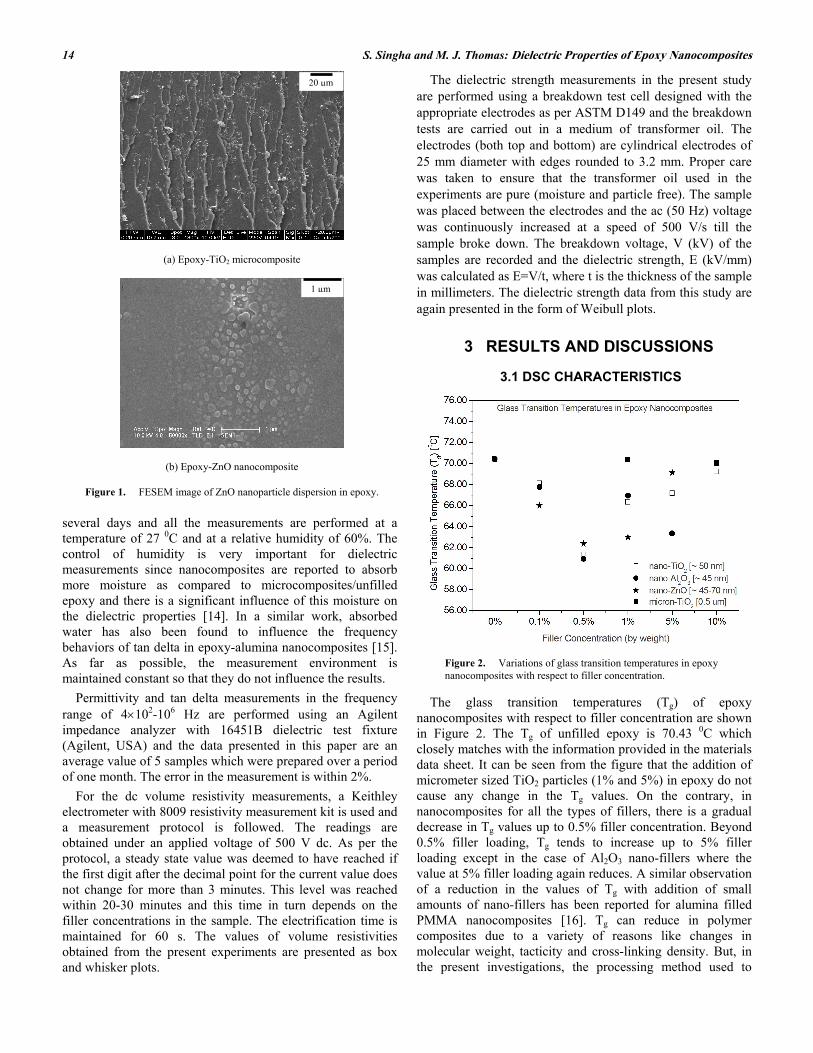
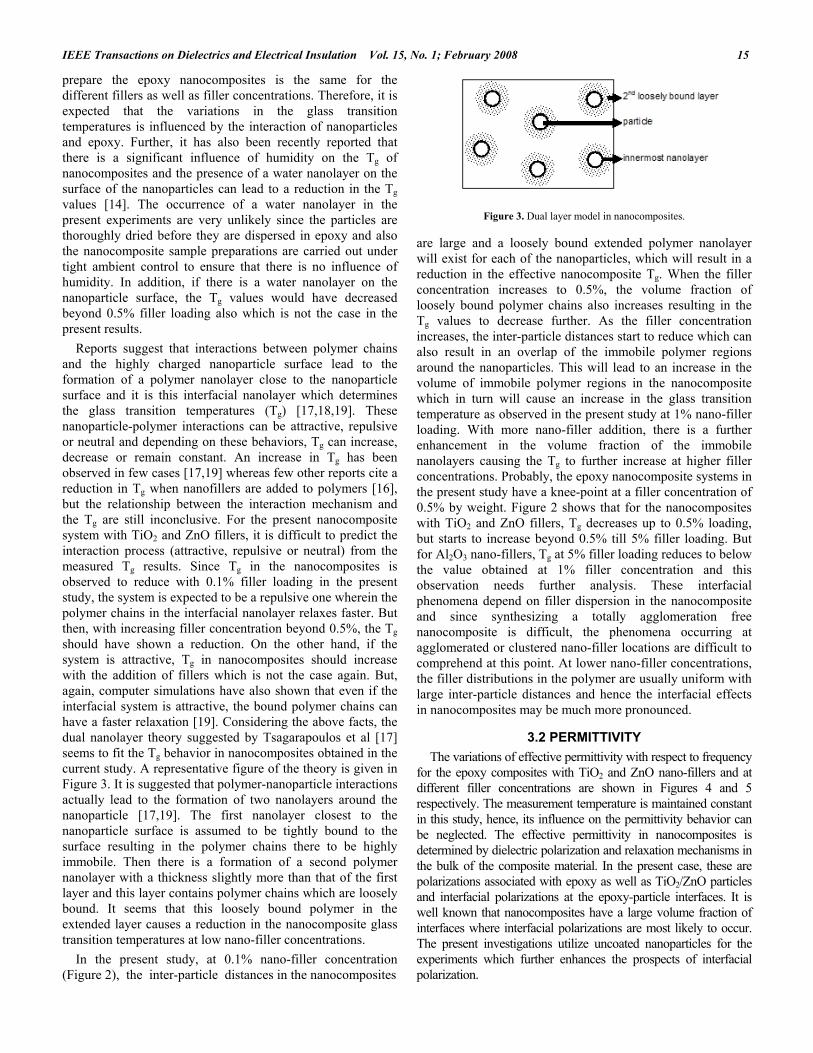
The dispersion of fillers in the epoxy micro/nano composites were investigated by examining the sample cross-sections under a JEOL field emission scanning electron microscope (FESEM). Samples of approximately 1 mm × 1 mm × 1 mm for microscopy are prepared by cutting the epoxy composites at different locations and analyzed. Representative SEM micrographs are shown in Figure 1 where the uniform dispersion of particles in the epoxy composites can be seen. The obtained nano-filler dispersion in the composite confirms the effectiveness of the two-step processing method for epoxy nanocomposite synthesis.
2.3 DSC MEASUREMENTS To analyze the material characteristics of nanocomposites,
their glass transition temperatures (Tg) were measured using a Mettler Differential Scanning Calorimetry (DSC) equipment. The experiments were performed at 5 0C/minute rate of rise of temperature with scanning upto 200 0C. The Tg data reported in this paper are an average value of 3 measurements and the error in the measurement is around 1%.
2.4 DIELECTRIC PROPERTY MEASUREMENTS The dielectric properties of the epoxy micro/nano
composites in the present study are measured using standard ASTM test procedures. Nanocomposite samples were prepared at least 24 h prior to the experiments and they are kept under vacuum evacuation before they are used for the measurements. Samples for the experiments are randomly picked from different batches of preparations spread over
S. Singha and M. J. Thomas: Dielectric Properties of Epoxy Nanocomposites 14
(a) Epoxy-TiO2 microcomposite
(b) Epoxy-ZnO nanocomposite
Figure 1. FESEM image of ZnO nanoparticle dispersion in epoxy.
several days and all the measurements are performed at a temperature of 27 0C and at a relative humidity of 60%. The control of humidity is very important for dielectric measurements since nanocomposites are reported to absorb more moisture as compared to microcomposites/unfilled epoxy and there is a significant influence of this moisture on the dielectric properties [14]. In a similar work, absorbed water has also been found to influence the frequency behaviors of tan delta in epoxy-alumina nanocomposites [15]. As far as possible, the measurement environment is maintained constant so that they do not influence the results.
Permittivity and tan delta measurements in the frequency range of 4×10²-106 Hz are performed using an Agilent impedance analyzer with 16451B dielectric test fixture (Agilent, USA) and the data presented in this paper are an average value of 5 samples which were prepared over a period of one month. The error in the measurement is within 2%.
For the dc volume resistivity measurements, a Keithley electrometer with 8009 resistivity measurement kit is used and a measurement protocol is followed. The readings are obtained under an applied voltage of 500 V dc. As per the protocol, a steady state value was deemed to have reached if the first digit after the decimal point for the current value does not change for more than 3 minutes. This level was reached within 20-30 minutes and this time in turn depends on the filler concentrations in the sample. The electrification time is maintained for 60 s. The values of volume resistivities obtained from the present experiments are presented as box and whisker plots.
The dielectric strength measurements in the present study are performed using a breakdown test cell designed with the appropriate electrodes as per ASTM D149 and the breakdown tests are carried out in a medium of transformer oil. The electrodes (both top and bottom) are cylindrical electrodes of 25 mm diameter with edges rounded to 3.2 mm. Proper care was taken to ensure that the transformer oil used in the experiments are pure (moisture and particle free). The sample was placed between the electrodes and the ac (50 Hz) voltage was continuously increased at a speed of 500 V/s till the sample broke down. The breakdown voltage, V (kV) of the samples are recorded and the dielectric strength, E (kV/mm) was calculated as E=V/t, where t is the thickness of the sample in millimeters. The dielectric strength data from this study are again presented in the form of Weibull plots.
3 RESULTS AND DISCUSSIONS
3.1 DSC CHARACTERISTICS
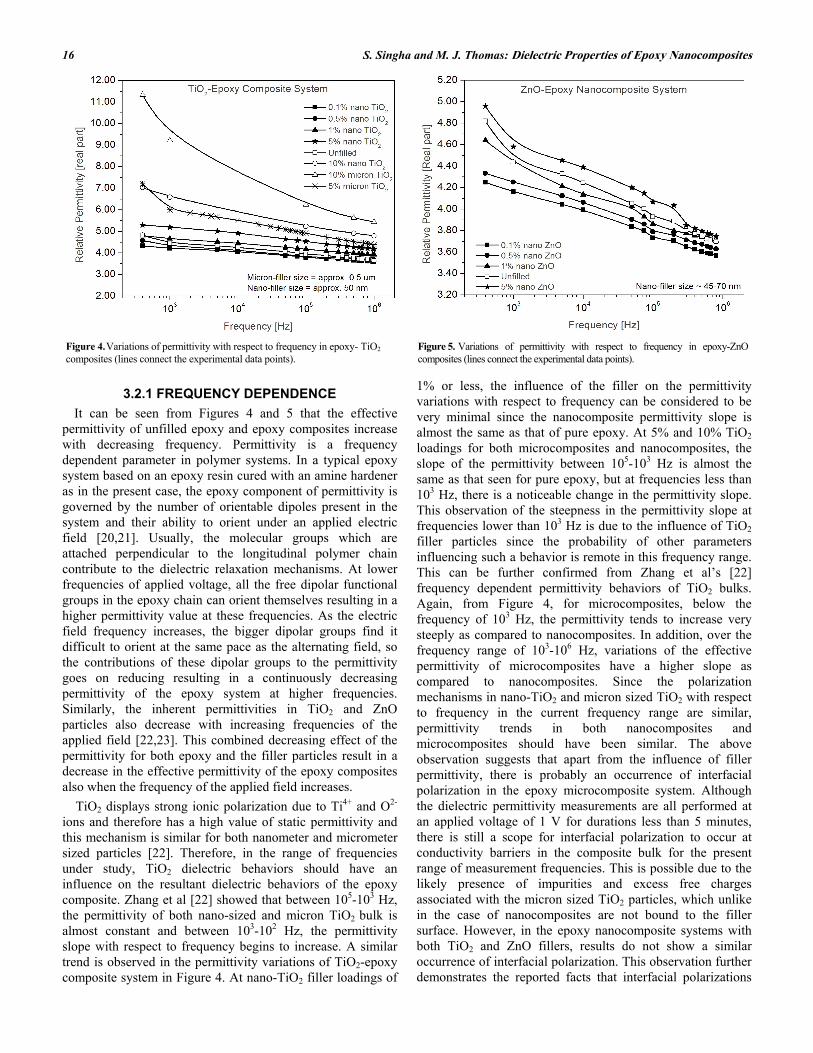
Figure 2. Variations of glass transition temperatures in epoxy nanocomposites with respect to filler concentration.
The glass transition temperatures (Tg) of epoxy nanocomposites with respect to filler concentration are shown in Figure 2. The Tg of unfilled epoxy is 70.43 0C which closely matches with the information provided in the materials data sheet. It can be seen from the figure that the addition of micrometer sized TiO2 particles (1% and 5%) in epoxy do not cause any change in the Tg values. On the contrary, in nanocomposites for all the types of fillers, there is a gradual decrease in Tg values up to 0.5% filler concentration. Beyond 0.5% filler loading, Tg tends to increase up to 5% filler loading except in the case of Al2O3 nano-fillers where the value at 5% filler loading again reduces. A similar observation of a reduction in the values of Tg with addition of small amounts of nano-fillers has been reported for alumina filled PMMA nanocomposites [16]. Tg can reduce in polymer composites due to a variety of reasons like changes in molecular weight, tacticity and cross-linking density. But, in the present investigations, the processing method used to
1 µm
20 µm
IEEE Transactions on Dielectrics and Electrical Insulation Vol. 15, No. 1; February 2008 15
prepare the epoxy nanocomposites is the same for the different fillers as well as filler concentrations. Therefore, it is expected that the variations in the glass transition temperatures is influenced by the interaction of nanoparticles and epoxy. Further, it has also been recently reported that there is a significant influence of humidity on the Tg of nanocomposites and the presence of a water nanolayer on the surface of the nanoparticles can lead to a reduction in the Tg values [14]. The occurrence of a water nanolayer in the present experiments are very unlikely since the particles are thoroughly dried before they are dispersed in epoxy and also the nanocomposite sample preparations are carried out under tight ambient control to ensure that there is no influence of humidity. In addition, if there is a water nanolayer on the nanoparticle surface, the Tg values would have decreased beyond 0.5% filler loading also which is not the case in the present results. Reports suggest that interactions between polymer chains and the highly charged nanoparticle surface lead to the formation of a polymer nanolayer close to the nanoparticle surface and it is this interfacial nanolayer which determines the glass transition temperatures (Tg) [17,18,19]. These nanoparticle-polymer interactions can be attractive, repulsive or neutral and depending on these behaviors, Tg can increase, decrease or remain constant. An increase in Tg has been observed in few cases [17,19] whereas few other reports cite a reduction in Tg when nanofillers are added to polymers [16], but the relationship between the interaction mechanism and the Tg are still inconclusive. For the present nanocomposite system with TiO2 and ZnO fillers, it is difficult to predict the interaction process (attractive, repulsive or neutral) from the measured Tg results. Since Tg in the nanocomposites is observed to reduce with 0.1% filler loading in the present study, the system is expected to be a repulsive one wherein the polymer chains in the interfacial nanolayer relaxes faster. But then, with increasing filler concentration beyond 0.5%, the Tg should have shown a reduction. On the other hand, if the system is attractive, Tg in nanocomposites should increase with the addition of fillers which is not the case again. But, again, computer simulations have also shown that even if the interfacial system is attractive, the bound polymer chains can have a faster relaxation [19]. Considering the above facts, the dual nanolayer theory suggested by Tsagarapoulos et al [17] seems to fit the Tg behavior in nanocomposites obtained in the current study. A representative figure of the theory is given in Figure 3. It is suggested that polymer-nanoparticle interactions actually lead to the formation of two nanolayers around the nanoparticle [17,19]. The first nanolayer closest to the nanoparticle surface is assumed to be tightly bound to the surface resulting in the polymer chains there to be highly immobile. Then there is a formation of a second polymer nanolayer with a thickness slightly more than that of the first layer and this layer contains polymer chains which are loosely bound. It seems that this loosely bound polymer in the extended layer causes a reduction in the nanocomposite glass transition temperatures at low nano-filler concentrations. In the present study, at 0.1% nano-filler concentration (Figure 2), the inter-particle distances in the nanocomposites
Figure 3. Dual layer model in nanocomposites.
are large and a loosely bound extended polymer nanolayer will exist for each of the nanoparticles, which will result in a reduction in the effective nanocomposite Tg. When the filler concentration increases to 0.5%, the volume fraction of loosely bound polymer chains also increases resulting in the Tg values to decrease further. As the filler concentration increases, the inter-particle distances start to reduce which can also result in an overlap of the immobile polymer regions around the nanoparticles. This will lead to an increase in the volume of immobile polymer regions in the nanocomposite which in turn will cause an increase in the glass transition temperature as observed in the present study at 1% nano-filler loading. With more nano-filler addition, there is a further enhancement in the volume fraction of the immobile nanolayers causing the Tg to further increase at higher filler concentrations. Probably, the epoxy nanocomposite systems in the present study have a knee-point at a filler concentration of 0.5% by weight. Figure 2 shows that for the nanocomposites with TiO2 and ZnO fillers, Tg decreases up to 0.5% loading, but starts to increase beyond 0.5% till 5% filler loading. But for Al2O3 nano-fillers, Tg at 5% filler loading reduces to below the value obtained at 1% filler concentration and this observation needs further analysis. These interfacial phenomena depend on filler dispersion in the nanocomposite and since synthesizing a totally agglomeration free nanocomposite is difficult, the phenomena occurring at agglomerated or clustered nano-filler locations are difficult to comprehend at this point. At lower nano-filler concentrations, the filler distributions in the polymer are usually uniform with large inter-particle distances and hence the interfacial effects in nanocomposites may be much more pronounced.
3.2 PERMITTIVITY The variations of effective permittivity with respect to frequency
for the epoxy composites with TiO2 and ZnO nano-fillers and at different filler concentrations are shown in Figures 4 and 5 respectively. The measurement temperature is maintained constant in this study, hence, its influence on the permittivity behavior can be neglected. The effective permittivity in nanocomposites is determined by dielectric polarization and relaxation mechanisms in the bulk of the composite material. In the present case, these are polarizations associated with epoxy as well as TiO2/ZnO particles and interfacial polarizations at the epoxy-particle interfaces. It is well known that nanocomposites have a large volume fraction of interfaces where interfacial polarizations are most likely to occur. The present investigations utilize uncoated nanoparticles for the experiments which further enhances the prospects of interfacial polarization.
S. Singha and M. J. Thomas: Dielectric Properties of Epoxy Nanocomposites 16
Figure 4. Variations of permittivity with respect to frequency in epoxy- TiO2 composites (lines connect the experimental data points).
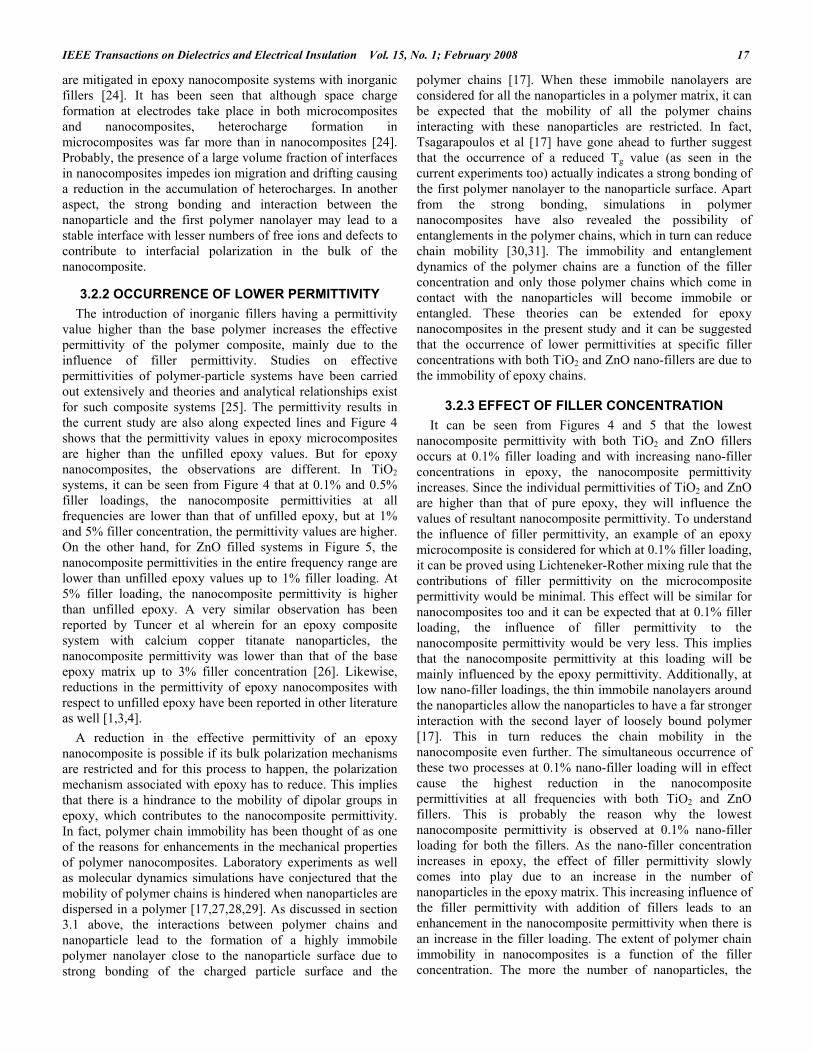
Figure 5. Variations of permittivity with respect to frequency in epoxy-ZnO composites (lines connect the experimental data points).
3.2.1 FREQUENCY DEPENDENCE It can be seen from Figures 4 and 5 that the effective
permittivity of unfilled epoxy and epoxy composites increase with decreasing frequency. Permittivity is a frequency dependent parameter in polymer systems. In a typical epoxy system based on an epoxy resin cured with an amine hardener as in the present case, the epoxy component of permittivity is governed by the number of orientable dipoles present in the system and their ability to orient under an applied electric field [20,21]. Usually, the molecular groups which are attached perpendicular to the longitudinal polymer chain contribute to the dielectric relaxation mechanisms. At lower frequencies of applied voltage, all the free dipolar functional groups in the epoxy chain can orient themselves resulting in a higher permittivity value at these frequencies. As the electric field frequency increases, the bigger dipolar groups find it difficult to orient at the same pace as the alternating field, so the contributions of these dipolar groups to the permittivity goes on reducing resulting in a continuously decreasing permittivity of the epoxy system at higher frequencies. Similarly, the inherent permittivities in TiO2 and ZnO particles also decrease with increasing frequencies of the applied field [22,23]. This combined decreasing effect of the permittivity for both epoxy and the filler particles result in a decrease in the effective permittivity of the epoxy composites also when the frequency of the applied field increases.
TiO2 displays strong ionic polarization due to Ti4+ and O2- ions and therefore has a high value of static permittivity and this mechanism is similar for both nanometer and micrometer sized particles [22]. Therefore, in the range of frequencies under study, TiO2 dielectric behaviors should have an influence on the resultant dielectric behaviors of the epoxy composite. Zhang et al [22] showed that between 105-103 Hz, the permittivity of both nano-sized and micron TiO2
bulk is almost constant and between 103-102 Hz, the permittivity slope with respect to frequency begins to increase. A similar trend is observed in the permittivity variations of TiO2-epoxy composite system in Figure 4. At nano-TiO2 filler loadings of
1% or less, the influence of the filler on the permittivity variations with respect to frequency can be considered to be very minimal since the nanocomposite permittivity slope is almost the same as that of pure epoxy. At 5% and 10% TiO2 loadings for both microcomposites and nanocomposites, the slope of the permittivity between 105-103 Hz is almost the same as that seen for pure epoxy, but at frequencies less than 103 Hz, there is a noticeable change in the permittivity slope. This observation of the steepness in the permittivity slope at frequencies lower than 103 Hz is due to the influence of TiO2 filler particles since the probability of other parameters influencing such a behavior is remote in this frequency range. This can be further confirmed from Zhang et al’s [22] frequency dependent permittivity behaviors of TiO2 bulks. Again, from Figure 4, for microcomposites, below the frequency of 103 Hz, the permittivity tends to increase very steeply as compared to nanocomposites. In addition, over the frequency range of 103-106 Hz, variations of the effective permittivity of microcomposites have a higher slope as compared to nanocomposites. Since the polarization mechanisms in nano-TiO2 and micron sized TiO2 with respect to frequency in the current frequency range are similar, permittivity trends in both nanocomposites and microcomposites should have been similar. The above observation suggests that apart from the influence of filler permittivity, there is probably an occurrence of interfacial polarization in the epoxy microcomposite system. Although the dielectric permittivity measurements are all performed at an applied voltage of 1 V for durations less than 5 minutes, there is still a scope for interfacial polarization to occur at conductivity barriers in the composite bulk for the present range of measurement frequencies. This is possible due to the likely presence of impurities and excess free charges associated with the micron sized TiO2 particles, which unlike in the case of nanocomposites are not bound to the filler surface. However, in the epoxy nanocomposite systems with both TiO2 and ZnO fillers, results do not show a similar occurrence of interfacial polarization. This observation further demonstrates the reported facts that interfacial polarizations
IEEE Transactions on Dielectrics and Electrical Insulation Vol. 15, No. 1; February 2008 17
are mitigated in epoxy nanocomposite systems with inorganic fillers [24]. It has been seen that although space charge formation at electrodes take place in both microcomposites and nanocomposites, heterocharge formation in microcomposites was far more than in nanocomposites [24]. Probably, the presence of a large volume fraction of interfaces in nanocomposites impedes ion migration and drifting causing a reduction in the accumulation of heterocharges. In another aspect, the strong bonding and interaction between the nanoparticle and the first polymer nanolayer may lead to a stable interface with lesser numbers of free ions and defects to contribute to interfacial polarization in the bulk of the nanocomposite.
3.2.2 OCCURRENCE OF LOWER PERMITTIVITY The introduction of inorganic fillers having a permittivity value higher than the base polymer increases the effective permittivity of the polymer composite, mainly due to the influence of filler permittivity. Studies on effective permittivities of polymer-particle systems have been carried out extensively and theories and analytical relationships exist for such composite systems [25]. The permittivity results in the current study are also along expected lines and Figure 4 shows that the permittivity values in epoxy microcomposites are higher than the unfilled epoxy values. But for epoxy nanocomposites, the observations are different. In TiO2 systems, it can be seen from Figure 4 that at 0.1% and 0.5% filler loadings, the nanocomposite permittivities at all frequencies are lower than that of unfilled epoxy, but at 1% and 5% filler concentration, the permittivity values are higher. On the other hand, for ZnO filled systems in Figure 5, the nanocomposite permittivities in the entire frequency range are lower than unfilled epoxy values up to 1% filler loading. At 5% filler loading, the nanocomposite permittivity is higher than unfilled epoxy. A very similar observation has been reported by Tuncer et al wherein for an epoxy composite system with calcium copper titanate nanoparticles, the nanocomposite permittivity was lower than that of the base epoxy matrix up to 3% filler concentration [26]. Likewise, reductions in the permittivity of epoxy nanocomposites with respect to unfilled epoxy have been reported in other literature as well [1,3,4]. A reduction in the effective permittivity of an epoxy nanocomposite is possible if its bulk polarization mechanisms are restricted and for this process to happen, the polarization mechanism associated with epoxy has to reduce. This implies that there is a hindrance to the mobility of dipolar groups in epoxy, which contributes to the nanocomposite permittivity. In fact, polymer chain immobility has been thought of as one of the reasons for enhancements in the mechanical properties of polymer nanocomposites. Laboratory experiments as well as molecular dynamics simulations have conjectured that the mobility of polymer chains is hindered when nanoparticles are dispersed in a polymer [17,27,28,29]. As discussed in section 3.1 above, the interactions between polymer chains and nanoparticle lead to the formation of a highly immobile polymer nanolayer close to the nanoparticle surface due to strong bonding of the charged particle surface and the
polymer chains [17]. When these immobile nanolayers are considered for all the nanoparticles in a polymer matrix, it can be expected that the mobility of all the polymer chains interacting with these nanoparticles are restricted. In fact, Tsagarapoulos et al [17] have gone ahead to further suggest that the occurrence of a reduced Tg value (as seen in the current experiments too) actually indicates a strong bonding of the first polymer nanolayer to the nanoparticle surface. Apart from the strong bonding, simulations in polymer nanocomposites have also revealed the possibility of entanglements in the polymer chains, which in turn can reduce chain mobility [30,31]. The immobility and entanglement dynamics of the polymer chains are a function of the filler concentration and only those polymer chains which come in contact with the nanoparticles will become immobile or entangled. These theories can be extended for epoxy nanocomposites in the present study and it can be suggested that the occurrence of lower permittivities at specific filler concentrations with both TiO2 and ZnO nano-fillers are due to the immobility of epoxy chains.
3.2.3 EFFECT OF FILLER CONCENTRATION It can be seen from Figures 4 and 5 that the lowest nanocomposite permittivity with both TiO2 and ZnO fillers occurs at 0.1% filler loading and with increasing nano-filler concentrations in epoxy, the nanocomposite permittivity increases. Since the individual permittivities of TiO2 and ZnO are higher than that of pure epoxy, they will influence the values of resultant nanocomposite permittivity. To understand the influence of filler permittivity, an example of an epoxy microcomposite is considered for which at 0.1% filler loading, it can be proved using Lichteneker-Rother mixing rule that the contributions of filler permittivity on the microcomposite permittivity would be minimal. This effect will be similar for nanocomposites too and it can be expected that at 0.1% filler loading, the influence of filler permittivity to the nanocomposite permittivity would be very less. This implies that the nanocomposite permittivity at this loading will be mainly influenced by the epoxy permittivity. Additionally, at low nano-filler loadings, the thin immobile nanolayers around the nanoparticles allow the nanoparticles to have a far stronger interaction with the second layer of loosely bound polymer [17]. This in turn reduces the chain mobility in the nanocomposite even further. The simultaneous occurrence of these two processes at 0.1% nano-filler loading will in effect cause the highest reduction in the nanocomposite permittivities at all frequencies with both TiO2 and ZnO fillers. This is probably the reason why the lowest nanocomposite permittivity is observed at 0.1% nano-filler loading for both the fillers. As the nano-filler concentration increases in epoxy, the effect of filler permittivity slowly comes into play due to an increase in the number of nanoparticles in the epoxy matrix. This increasing influence of the filler permittivity with addition of fillers leads to an enhancement in the nanocomposite permittivity when there is an increase in the filler loading. The extent of polymer chain immobility in nanocomposites is a function of the filler concentration. The more the number of nanoparticles, the
S. Singha and M. J. Thomas: Dielectric Properties of Epoxy Nanocomposites 18
more immobile are the polymer chains. So indirectly, the effective permittivity should reduce with increasing nano-filler concentration. But again, the nanocomposite permittivity is also a function of the number of nanoparticles in the matrix and with increasing filler concentration, the permittivity will tend to go up due to the influence of filler permittivity. The interaction dynamics between these two processes which happen simultaneously in the nanocomposite is difficult to understand at this point and needs further study. But, it can be assumed that the rate of chain immobilization and the rate of permittivity enhancement with respect to filler loading will determine the variations in the nanocomposite permittivity.
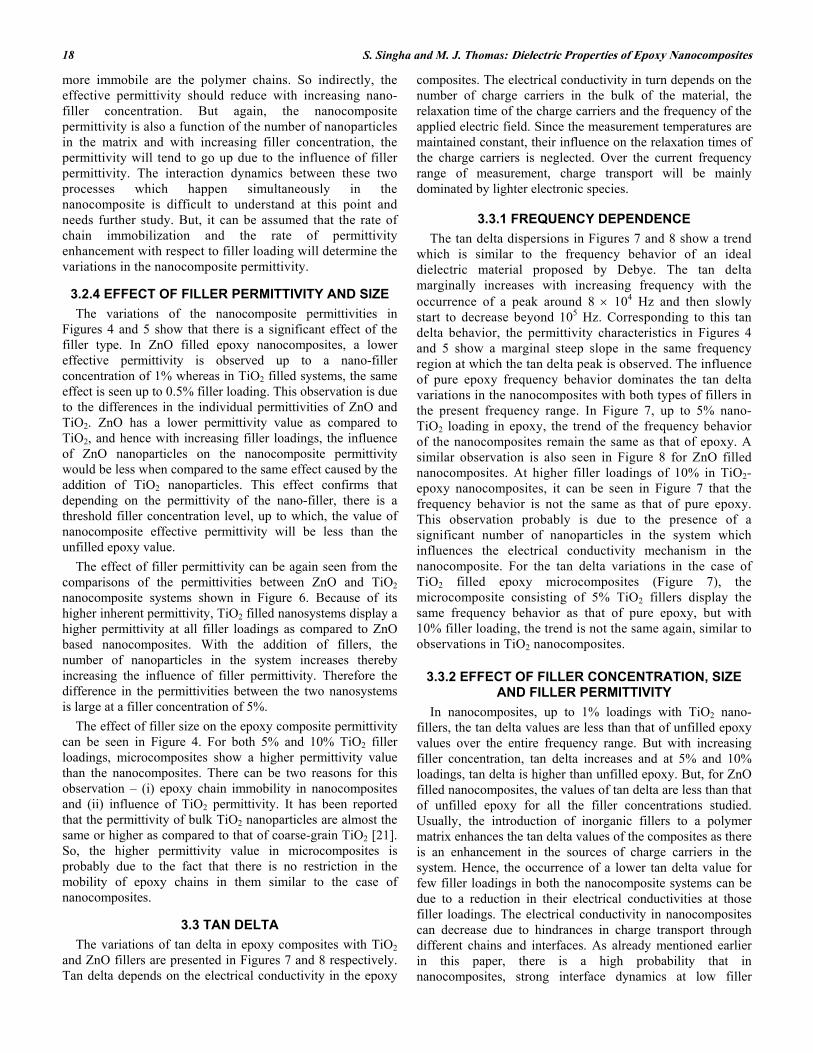
3.2.4 EFFECT OF FILLER PERMITTIVITY AND SIZE The variations of the nanocomposite permittivities in Figures 4 and 5 show that there is a significant effect of the filler type. In ZnO filled epoxy nanocomposites, a lower effective permittivity is observed up to a nano-filler concentration of 1% whereas in TiO2 filled systems, the same effect is seen up to 0.5% filler loading. This observation is due to the differences in the individual permittivities of ZnO and TiO2. ZnO has a lower permittivity value as compared to TiO2, and hence with increasing filler loadings, the influence of ZnO nanoparticles on the nanocomposite permittivity would be less when compared to the same effect caused by the addition of TiO2 nanoparticles. This effect confirms that depending on the permittivity of the nano-filler, there is a threshold filler concentration level, up to which, the value of nanocomposite effective permittivity will be less than the unfilled epoxy value. The effect of filler permittivity can be again seen from the comparisons of the permittivities between ZnO and TiO2 nanocomposite systems shown in Figure 6. Because of its higher inherent permittivity, TiO2 filled nanosystems display a higher permittivity at all filler loadings as compared to ZnO based nanocomposites. With the addition of fillers, the number of nanoparticles in the system increases thereby increasing the influence of filler permittivity. Therefore the difference in the permittivities between the two nanosystems is large at a filler concentration of 5%. The effect of filler size on the epoxy composite permittivity can be seen in Figure 4. For both 5% and 10% TiO2 filler loadings, microcomposites show a higher permittivity value than the nanocomposites. There can be two reasons for this observation – (i) epoxy chain immobility in nanocomposites and (ii) influence of TiO2 permittivity. It has been reported that the permittivity of bulk TiO2 nanoparticles are almost the same or higher as compared to that of coarse-grain TiO2 [21]. So, the higher permittivity value in microcomposites is probably due to the fact that there is no restriction in the mobility of epoxy chains in them similar to the case of nanocomposites.
3.3 TAN DELTA The variations of tan delta in epoxy composites with TiO2
and ZnO fillers are presented in Figures 7 and 8 respectively. Tan delta depends on the electrical conductivity in the epoxy
composites. The electrical conductivity in turn depends on the number of charge carriers in the bulk of the material, the relaxation time of the charge carriers and the frequency of the applied electric field. Since the measurement temperatures are maintained constant, their influence on the relaxation times of the charge carriers is neglected. Over the current frequency range of measurement, charge transport will be mainly dominated by lighter electronic species.
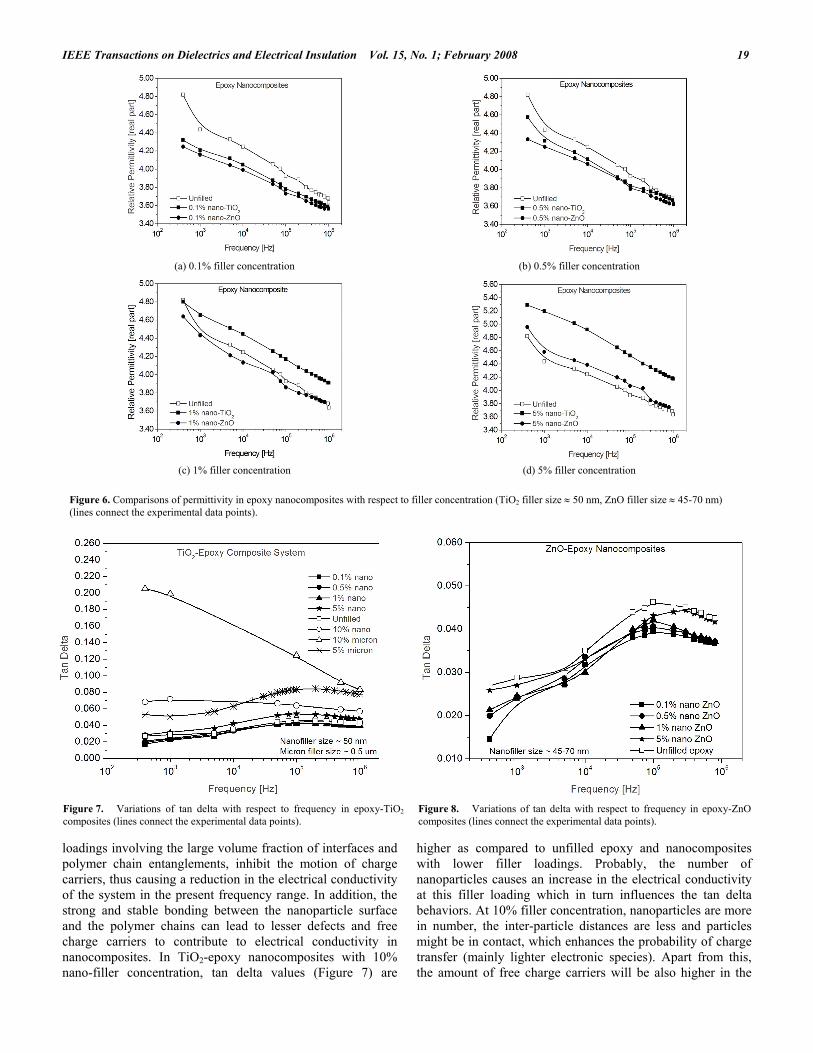
3.3.1 FREQUENCY DEPENDENCE The tan delta dispersions in Figures 7 and 8 show a trend which is similar to the frequency behavior of an ideal dielectric material proposed by Debye. The tan delta marginally increases with increasing frequency with the occurrence of a peak around 8 × 10⁴ Hz and then slowly start to decrease beyond 105 Hz. Corresponding to this tan delta behavior, the permittivity characteristics in Figures 4 and 5 show a marginal steep slope in the same frequency region at which the tan delta peak is observed. The influence of pure epoxy frequency behavior dominates the tan delta variations in the nanocomposites with both types of fillers in the present frequency range. In Figure 7, up to 5% nano-TiO2 loading in epoxy, the trend of the frequency behavior of the nanocomposites remain the same as that of epoxy. A similar observation is also seen in Figure 8 for ZnO filled nanocomposites. At higher filler loadings of 10% in TiO2-epoxy nanocomposites, it can be seen in Figure 7 that the frequency behavior is not the same as that of pure epoxy. This observation probably is due to the presence of a significant number of nanoparticles in the system which influences the electrical conductivity mechanism in the nanocomposite. For the tan delta variations in the case of TiO2 filled epoxy microcomposites (Figure 7), the microcomposite consisting of 5% TiO2 fillers display the same frequency behavior as that of pure epoxy, but with 10% filler loading, the trend is not the same again, similar to observations in TiO2 nanocomposites.
3.3.2 EFFECT OF FILLER CONCENTRATION, SIZE AND FILLER PERMITTIVITY
In nanocomposites, up to 1% loadings with TiO2 nano-fillers, the tan delta values are less than that of unfilled epoxy values over the entire frequency range. But with increasing filler concentration, tan delta increases and at 5% and 10% loadings, tan delta is higher than unfilled epoxy. But, for ZnO filled nanocomposites, the values of tan delta are less than that of unfilled epoxy for all the filler concentrations studied. Usually, the introduction of inorganic fillers to a polymer matrix enhances the tan delta values of the composites as there is an enhancement in the sources of charge carriers in the system. Hence, the occurrence of a lower tan delta value for few filler loadings in both the nanocomposite systems can be due to a reduction in their electrical conductivities at those filler loadings. The electrical conductivity in nanocomposites can decrease due to hindrances in charge transport through different chains and interfaces. As already mentioned earlier in this paper, there is a high probability that in nanocomposites, strong interface dynamics at low filler
IEEE Transactions on Dielectrics and Electrical Insulation Vol. 15, No. 1; February 2008 19
(a) 0.1% filler concentration
(b) 0.5% filler concentration
(c) 1% filler concentration
(d) 5% filler concentration Figure 6. Comparisons of permittivity in epoxy nanocomposites with respect to filler concentration (TiO2 filler size ≈ 50 nm, ZnO filler size ≈ 45-70 nm) (lines connect the experimental data points).
Figure 7. Variations of tan delta with respect to frequency in epoxy-TiO2 composites (lines connect the experimental data points).
Figure 8. Variations of tan delta with respect to frequency in epoxy-ZnO composites (lines connect the experimental data points).
loadings involving the large volume fraction of interfaces and polymer chain entanglements, inhibit the motion of charge carriers, thus causing a reduction in the electrical conductivity of the system in the present frequency range. In addition, the strong and stable bonding between the nanoparticle surface and the polymer chains can lead to lesser defects and free charge carriers to contribute to electrical conductivity in nanocomposites. In TiO2-epoxy nanocomposites with 10% nano-filler concentration, tan delta values (Figure 7) are
higher as compared to unfilled epoxy and nanocomposites with lower filler loadings. Probably, the number of nanoparticles causes an increase in the electrical conductivity at this filler loading which in turn influences the tan delta behaviors. At 10% filler concentration, nanoparticles are more in number, the inter-particle distances are less and particles might be in contact, which enhances the probability of charge transfer (mainly lighter electronic species). Apart from this, the amount of free charge carriers will be also higher in the
S. Singha and M. J. Thomas: Dielectric Properties of Epoxy Nanocomposites 20
system. In a different aspect, it is also possible that at 10% nano-filler loadings, there is an overlapping of the interfacial zones in the nanocomposite leading to the percolation of charge carriers, thus causing an enhancement in the electrical conductivity [32]. The overlapping of interfacial zones depends on the dispersion of nanoparticles in the epoxy matrix as well as on the size of the nano-fillers. If there are agglomerations in the nanocomposite, interfacial areas are most likely to overlap causing localized charge transport. In another case, the size of the nanoparticles will dictate the level of filler loading at which nanoparticles start to overlap. As an example, considering the case of Fothergill et al [32], the average size of the TiO2 nanoparticles is 23 nm as compared to around 45 nm in the present study. This means that for the same filler concentration in a polymer, the number of nanoparticles with 23 nm sized fillers will be more than with 45 nm sized ones. Therefore, with 23 nm sized particles, the nanocomposite can have overlapping interfacial regions at lower filler loadings. A comparison of the tan delta characteristics between microcomposites and nanocomposites in Figure 7 shows that microcomposites display very high tan delta values. This is due to the presence of a large number of charge carriers (due to defects, poor particle-epoxy bonding and TiO2 particles) in the bulk of the microcomposite which are free to drift or migrate under an applied electric field without any barriers. There is a marginal effect of the permittivity also on the tan delta characteristics of the nanocomposites. At nano-filler loadings up to 1%, the tan delta values in the nanocomposites with TiO2 and ZnO fillers are almost the same. But at 5% nano-filler concentration, TiO2 filled system shows a higher tan delta value as compared to the ZnO filled system. TiO2, being a high permittivity material compared to ZnO, introduces more free charges into the system at high filler loadings causing an enhancement in the tan delta values.
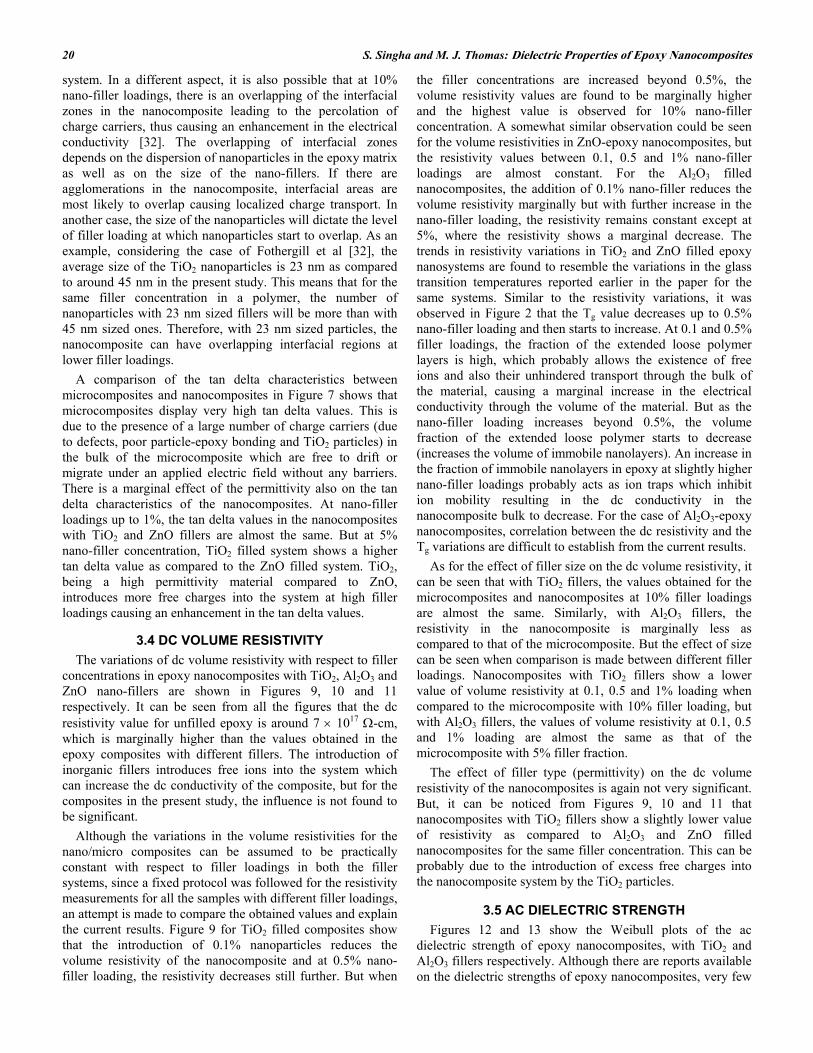
3.4 DC VOLUME RESISTIVITY The variations of dc volume resistivity with respect to filler concentrations in epoxy nanocomposites with TiO2, Al2O3 and ZnO nano-fillers are shown in Figures 9, 10 and 11 respectively. It can be seen from all the figures that the dc resistivity value for unfilled epoxy is around 7 × 10¹⁷ Ω-cm, which is marginally higher than the values obtained in the epoxy composites with different fillers. The introduction of inorganic fillers introduces free ions into the system which can increase the dc conductivity of the composite, but for the composites in the present study, the influence is not found to be significant. Although the variations in the volume resistivities for the nano/micro composites can be assumed to be practically constant with respect to filler loadings in both the filler systems, since a fixed protocol was followed for the resistivity measurements for all the samples with different filler loadings, an attempt is made to compare the obtained values and explain the current results. Figure 9 for TiO2 filled composites show that the introduction of 0.1% nanoparticles reduces the volume resistivity of the nanocomposite and at 0.5% nano-filler loading, the resistivity decreases still further. But when
the filler concentrations are increased beyond 0.5%, the volume resistivity values are found to be marginally higher and the highest value is observed for 10% nano-filler concentration. A somewhat similar observation could be seen for the volume resistivities in ZnO-epoxy nanocomposites, but the resistivity values between 0.1, 0.5 and 1% nano-filler loadings are almost constant. For the Al2O3 filled nanocomposites, the addition of 0.1% nano-filler reduces the volume resistivity marginally but with further increase in the nano-filler loading, the resistivity remains constant except at 5%, where the resistivity shows a marginal decrease. The trends in resistivity variations in TiO2 and ZnO filled epoxy nanosystems are found to resemble the variations in the glass transition temperatures reported earlier in the paper for the same systems. Similar to the resistivity variations, it was observed in Figure 2 that the Tg value decreases up to 0.5% nano-filler loading and then starts to increase. At 0.1 and 0.5% filler loadings, the fraction of the extended loose polymer layers is high, which probably allows the existence of free ions and also their unhindered transport through the bulk of the material, causing a marginal increase in the electrical conductivity through the volume of the material. But as the nano-filler loading increases beyond 0.5%, the volume fraction of the extended loose polymer starts to decrease (increases the volume of immobile nanolayers). An increase in the fraction of immobile nanolayers in epoxy at slightly higher nano-filler loadings probably acts as ion traps which inhibit ion mobility resulting in the dc conductivity in the nanocomposite bulk to decrease. For the case of Al2O3-epoxy nanocomposites, correlation between the dc resistivity and the Tg variations are difficult to establish from the current results. As for the effect of filler size on the dc volume resistivity, it can be seen that with TiO2 fillers, the values obtained for the microcomposites and nanocomposites at 10% filler loadings are almost the same. Similarly, with Al2O3 fillers, the resistivity in the nanocomposite is marginally less as compared to that of the microcomposite. But the effect of size can be seen when comparison is made between different filler loadings. Nanocomposites with TiO2 fillers show a lower value of volume resistivity at 0.1, 0.5 and 1% loading when compared to the microcomposite with 10% filler loading, but with Al2O3 fillers, the values of volume resistivity at 0.1, 0.5 and 1% loading are almost the same as that of the microcomposite with 5% filler fraction. The effect of filler type (permittivity) on the dc volume resistivity of the nanocomposites is again not very significant. But, it can be noticed from Figures 9, 10 and 11 that nanocomposites with TiO2 fillers show a slightly lower value of resistivity as compared to Al2O3 and ZnO filled nanocomposites for the same filler concentration. This can be probably due to the introduction of excess free charges into the nanocomposite system by the TiO2 particles.
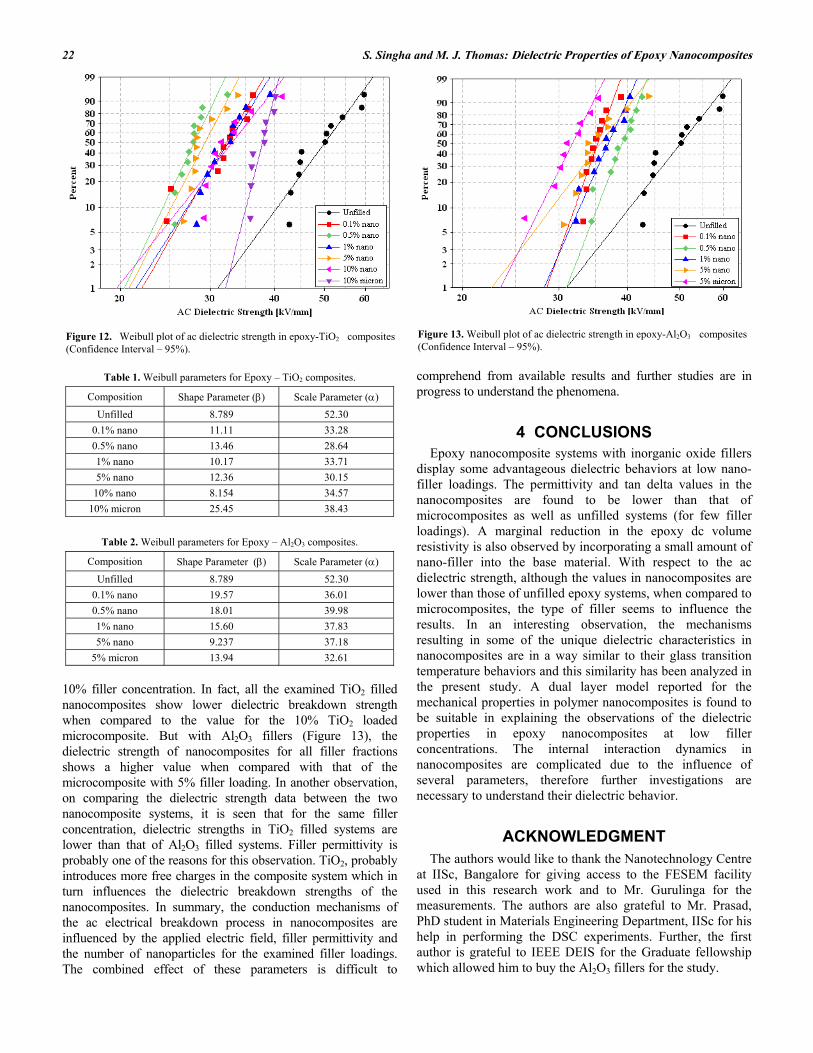
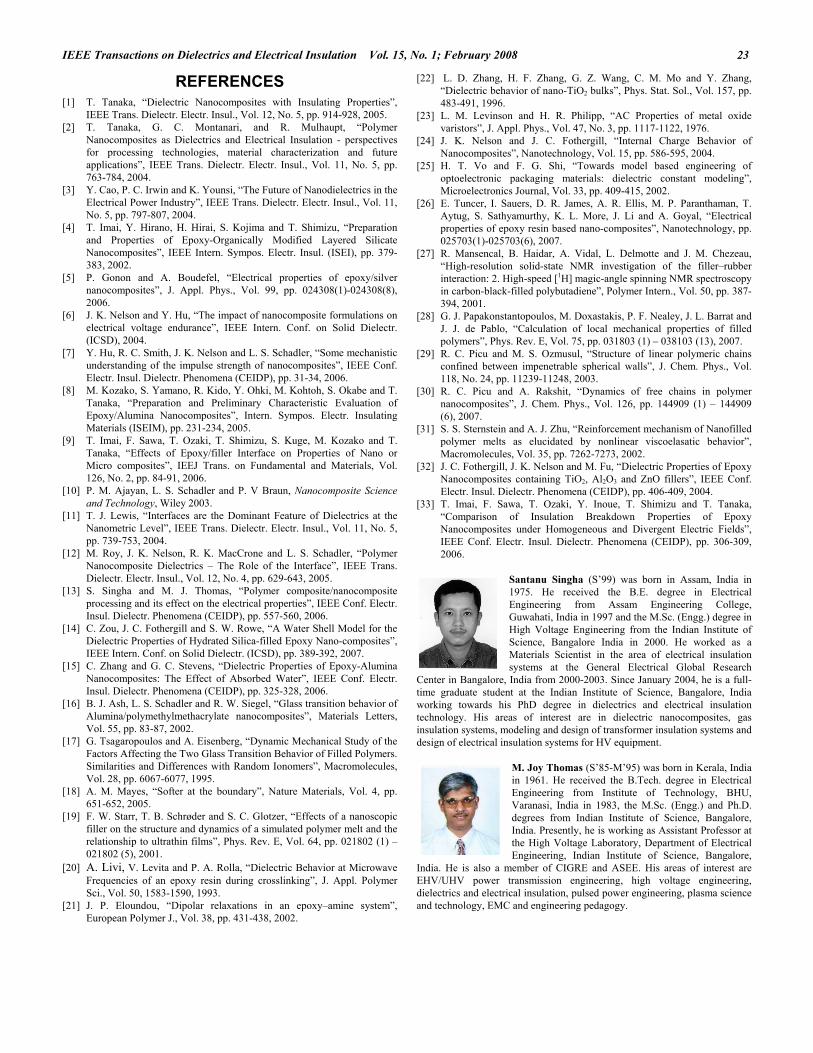
3.5 AC DIELECTRIC STRENGTH Figures 12 and 13 show the Weibull plots of the ac dielectric strength of epoxy nanocomposites, with TiO2 and Al2O3 fillers respectively. Although there are reports available on the dielectric strengths of epoxy nanocomposites, very few
IEEE Transactions on Dielectrics and Electrical Insulation Vol. 15, No. 1; February 2008 21
Figure 9. Variations of dc volume resistivity with respect to filler loading in epoxy-TiO2 composites.
Figure 10. Variations of dc volume resistivitywith respect to filler loading in epoxy-Al2O3 composites.
Figure 11. Variations of dc volume resistivity with respect to filler loading in epoxy-ZnO composites.
of them [7, 33] pertain to the ac dielectric strength with a ramp type ac voltage application similar to the present results. Imai et al [33] shows that with 5% by weight of fillers in an epoxy nanocomposite, the ac dielectric strengths of layered silicate and TiO2 fillers are marginally lower (considering the median value of the data) than that of unfilled epoxy whereas with SiO2 fillers it is higher. In another result, Hu et al [7] shows that the 60 Hz ac electric strength in nanocomposites is marginally higher than base epoxy and significantly higher than microcomposites. The introduction of fillers into polymers usually introduces defects in the system causing centers of charge concentrations leading to lower dielectric strengths, but nanocomposites do not seem to obey this rule. Contrary to enhancements in the ac dielectric strengths for some of the nanocomposite systems, the present result show that the ac dielectric strength in nanocomposites are less than the value obtained for unfilled epoxy. The size of the nanoparticles and the thickness of the samples considered for the experiments can be a possible reason for this difference. In the published results, Imai et al have used TiO2 nanoparticles of 15 nm APS (Average Particle Size) whereas Hu et al used particles of 23 nm APS. But, in the present study, the TiO2 nanoparticles have an APS of 45 nm and it can be believed that for the same filler concentration, the number of nanoparticles in the case of the earlier published results would be much more than in the present study, which might influence the values of the ac dielectric strengths. Apart from this, the published results used nanocomposite samples with thicknesses of around 0.5 mm or less as compared to 1 mm in the current study. In spite of the fact that the comparisons of the ac dielectric strengths between unfilled and filled systems are made for a constant thickness in both the cases, the probabilistic nature of defects in a composite for different sample thicknesses can be vastly different. In other words, defects in a composite sample of 1 mm can be much larger than the defects in a 0.5 mm sample.
Tables 1 and 2 list the Weibull shape and scale parameters of the epoxy composite systems with TiO2 and Al2O3 fillers respectively. The Weibull shape parameter (β) increases with the addition of nanoparticles to epoxy and a similar occurrence has been observed by others too [1,7]. This reflects
that the dielectric breakdown mechanisms in nanocomposites are more stable as compared to the base epoxy resin. In another interesting observation in TiO2 filled epoxy systems, surprisingly again, the trend of the ac dielectric strength with respect to the filler concentration is similar to the trend of glass transition temperatures observed in the present investigations. It can be seen that the introduction of just 0.1% nano-fillers drastically reduces the dielectric strength and when the filler loading is increased to 0.5%, the dielectric strength reduces still further. But, beyond 0.5% filler concentration, a marginal increase in the dielectric strength could be observed. At 10% nano-TiO2 loading, the dielectric strength is sufficiently high as compared to the nanocomposite with 0.5% filler loading. At lower filler concentrations (0.1%, 0.5%), the number of nanoparticles is less, the inter-particle distances are more and the volume fraction of the loose second polymer nanolayer is large. Under the conditions of a high ac electrical stress, a large fraction of this loose polymer nanolayer allows the transfer of charge carriers between the electrodes resulting in a lower breakdown voltage. But when the filler loading increases to 1%, the number of particles in the nanocomposite is higher, the inter-particle distances are smaller, the volume fraction of loose polymer layer reduces and the nanoparticles themselves start acting as barriers to the flow of current between the electrodes. These factors can cause a hindrance to the flow of current in the nanocomposite resulting in an increase in the dielectric breakdown strength at 1%, 5% and 10% nano-TiO2 concentration. But, in Al2O3 filled epoxy nanocomposites, only at 0.1% nano-Al2O3 loading, the dielectric strength is significantly less. But beyond 0.1%, it can be seen that the dielectric strength values remain almost constant up to 5% filler concentration. This result shows that Al2O3 nano-fillers do not have too much of an influence on the ac dielectric strength between 0.1% and 5% filler concentration, although in comparison to unfilled epoxy, their dielectric strengths are less. There is an effect of the filler size and type too on the ac dielectric strength of the epoxy nanocomposites. Figure 12 shows that with TiO2 fillers, nanocomposites show a lower dielectric strength as compared to the microcomposites for
S. Singha and M. J. Thomas: Dielectric Properties of Epoxy Nanocomposites 22
Figure 12. Weibull plot of ac dielectric strength in epoxy-TiO2 composites (Confidence Interval – 95%).
Figure 13. Weibull plot of ac dielectric strength in epoxy-Al2O3 composites (Confidence Interval – 95%).
Table 1. Weibull parameters for Epoxy – TiO2 composites.
Composition Shape Parameter (β) Scale Parameter (α) Unfilled 8.789 52.30
0.1% nano 11.11 33.28 0.5% nano 13.46 28.64 1% nano 10.17 33.71 5% nano 12.36 30.15 10% nano 8.154 34.57
10% micron 25.45 38.43
Table 2. Weibull parameters for Epoxy – Al2O3 composites.
Composition Shape Parameter (β) Scale Parameter (α) Unfilled 8.789 52.30
0.1% nano 19.57 36.01 0.5% nano 18.01 39.98 1% nano 15.60 37.83 5% nano 9.237 37.18
5% micron 13.94 32.61
10% filler concentration. In fact, all the examined TiO2 filled nanocomposites show lower dielectric breakdown strength when compared to the value for the 10% TiO2 loaded microcomposite. But with Al2O3 fillers (Figure 13), the dielectric strength of nanocomposites for all filler fractions shows a higher value when compared with that of the microcomposite with 5% filler loading. In another observation, on comparing the dielectric strength data between the two nanocomposite systems, it is seen that for the same filler concentration, dielectric strengths in TiO2 filled systems are lower than that of Al2O3 filled systems. Filler permittivity is probably one of the reasons for this observation. TiO2, probably introduces more free charges in the composite system which in turn influences the dielectric breakdown strengths of the nanocomposites. In summary, the conduction mechanisms of the ac electrical breakdown process in nanocomposites are influenced by the applied electric field, filler permittivity and the number of nanoparticles for the examined filler loadings. The combined effect of these parameters is difficult to
comprehend from available results and further studies are in progress to understand the phenomena.
4 CONCLUSIONS Epoxy nanocomposite systems with inorganic oxide fillers
display some advantageous dielectric behaviors at low nano-filler loadings. The permittivity and tan delta values in the nanocomposites are found to be lower than that of microcomposites as well as unfilled systems (for few filler loadings). A marginal reduction in the epoxy dc volume resistivity is also observed by incorporating a small amount of nano-filler into the base material. With respect to the ac dielectric strength, although the values in nanocomposites are lower than those of unfilled epoxy systems, when compared to microcomposites, the type of filler seems to influence the results. In an interesting observation, the mechanisms resulting in some of the unique dielectric characteristics in nanocomposites are in a way similar to their glass transition temperature behaviors and this similarity has been analyzed in the present study. A dual layer model reported for the mechanical properties in polymer nanocomposites is found to be suitable in explaining the observations of the dielectric properties in epoxy nanocomposites at low filler concentrations. The internal interaction dynamics in nanocomposites are complicated due to the influence of several parameters, therefore further investigations are necessary to understand their dielectric behavior.
ACKNOWLEDGMENT The authors would like to thank the Nanotechnology Centre
at IISc, Bangalore for giving access to the FESEM facility used in this research work and to Mr. Gurulinga for the measurements. The authors are also grateful to Mr. Prasad, PhD student in Materials Engineering Department, IISc for his help in performing the DSC experiments. Further, the first author is grateful to IEEE DEIS for the Graduate fellowship which allowed him to buy the Al2O3 fillers for the study.
IEEE Transactions on Dielectrics and Electrical Insulation Vol. 15, No. 1; February 2008 23
REFERENCES [1] T. Tanaka, “Dielectric Nanocomposites with Insulating Properties”,
IEEE Trans. Dielectr. Electr. Insul., Vol. 12, No. 5, pp. 914-928, 2005. [2] T. Tanaka, G. C. Montanari, and R. Mulhaupt, “Polymer
Nanocomposites as Dielectrics and Electrical Insulation - perspectives for processing technologies, material characterization and future applications”, IEEE Trans. Dielectr. Electr. Insul., Vol. 11, No. 5, pp. 763-784, 2004.
[3] Y. Cao, P. C. Irwin and K. Younsi, “The Future of Nanodielectrics in the Electrical Power Industry”, IEEE Trans. Dielectr. Electr. Insul., Vol. 11, No. 5, pp. 797-807, 2004.
[4] T. Imai, Y. Hirano, H. Hirai, S. Kojima and T. Shimizu, “Preparation and Properties of Epoxy-Organically Modified Layered Silicate Nanocomposites”, IEEE Intern. Sympos. Electr. Insul. (ISEI), pp. 379-383, 2002.
[5] P. Gonon and A. Boudefel, “Electrical properties of epoxy/silver nanocomposites”, J. Appl. Phys., Vol. 99, pp. 024308(1)-024308(8), 2006.
[6] J. K. Nelson and Y. Hu, “The impact of nanocomposite formulations on electrical voltage endurance”, IEEE Intern. Conf. on Solid Dielectr. (ICSD), 2004.
[7] Y. Hu, R. C. Smith, J. K. Nelson and L. S. Schadler, “Some mechanistic understanding of the impulse strength of nanocomposites”, IEEE Conf. Electr. Insul. Dielectr. Phenomena (CEIDP), pp. 31-34, 2006.
[8] M. Kozako, S. Yamano, R. Kido, Y. Ohki, M. Kohtoh, S. Okabe and T. Tanaka, “Preparation and Preliminary Characteristic Evaluation of Epoxy/Alumina Nanocomposites”, Intern. Sympos. Electr. Insulating Materials (ISEIM), pp. 231-234, 2005.
[9] T. Imai, F. Sawa, T. Ozaki, T. Shimizu, S. Kuge, M. Kozako and T. Tanaka, “Effects of Epoxy/filler Interface on Properties of Nano or Micro composites”, IEEJ Trans. on Fundamental and Materials, Vol. 126, No. 2, pp. 84-91, 2006.
[10] P. M. Ajayan, L. S. Schadler and P. V Braun, Nanocomposite Science and Technology, Wiley 2003.
[11] T. J. Lewis, “Interfaces are the Dominant Feature of Dielectrics at the Nanometric Level”, IEEE Trans. Dielectr. Electr. Insul., Vol. 11, No. 5, pp. 739-753, 2004.
[12] M. Roy, J. K. Nelson, R. K. MacCrone and L. S. Schadler, “Polymer Nanocomposite Dielectrics – The Role of the Interface”, IEEE Trans. Dielectr. Electr. Insul., Vol. 12, No. 4, pp. 629-643, 2005.
[13] S. Singha and M. J. Thomas, “Polymer composite/nanocomposite processing and its effect on the electrical properties”, IEEE Conf. Electr. Insul. Dielectr. Phenomena (CEIDP), pp. 557-560, 2006.
[14] C. Zou, J. C. Fothergill and S. W. Rowe, “A Water Shell Model for the Dielectric Properties of Hydrated Silica-filled Epoxy Nano-composites”, IEEE Intern. Conf. on Solid Dielectr. (ICSD), pp. 389-392, 2007.
[15] C. Zhang and G. C. Stevens, “Dielectric Properties of Epoxy-Alumina Nanocomposites: The Effect of Absorbed Water”, IEEE Conf. Electr. Insul. Dielectr. Phenomena (CEIDP), pp. 325-328, 2006.
[16] B. J. Ash, L. S. Schadler and R. W. Siegel, “Glass transition behavior of Alumina/polymethylmethacrylate nanocomposites”, Materials Letters, Vol. 55, pp. 83-87, 2002.
[17] G. Tsagaropoulos and A. Eisenberg, “Dynamic Mechanical Study of the Factors Affecting the Two Glass Transition Behavior of Filled Polymers. Similarities and Differences with Random Ionomers”, Macromolecules, Vol. 28, pp. 6067-6077, 1995.
[18] A. M. Mayes, “Softer at the boundary”, Nature Materials, Vol. 4, pp. 651-652, 2005.
[19] F. W. Starr, T. B. Schrøder and S. C. Glotzer, “Effects of a nanoscopic filler on the structure and dynamics of a simulated polymer melt and the relationship to ultrathin films”, Phys. Rev. E, Vol. 64, pp. 021802 (1) – 021802 (5), 2001.
[20] A. Livi, V. Levita and P. A. Rolla, “Dielectric Behavior at Microwave Frequencies of an epoxy resin during crosslinking”, J. Appl. Polymer Sci., Vol. 50, 1583-1590, 1993.
[21] J. P. Eloundou, “Dipolar relaxations in an epoxy–amine system”, European Polymer J., Vol. 38, pp. 431-438, 2002.
[22] L. D. Zhang, H. F. Zhang, G. Z. Wang, C. M. Mo and Y. Zhang, “Dielectric behavior of nano-TiO2 bulks”, Phys. Stat. Sol., Vol. 157, pp. 483-491, 1996.
[23] L. M. Levinson and H. R. Philipp, “AC Properties of metal oxide varistors”, J. Appl. Phys., Vol. 47, No. 3, pp. 1117-1122, 1976.
[24] J. K. Nelson and J. C. Fothergill, “Internal Charge Behavior of Nanocomposites”, Nanotechnology, Vol. 15, pp. 586-595, 2004.
[25] H. T. Vo and F. G. Shi, “Towards model based engineering of optoelectronic packaging materials: dielectric constant modeling”, Microelectronics Journal, Vol. 33, pp. 409-415, 2002.
[26] E. Tuncer, I. Sauers, D. R. James, A. R. Ellis, M. P. Paranthaman, T. Aytug, S. Sathyamurthy, K. L. More, J. Li and A. Goyal, “Electrical properties of epoxy resin based nano-composites”, Nanotechnology, pp. 025703(1)-025703(6), 2007.
[27] R. Mansencal, B. Haidar, A. Vidal, L. Delmotte and J. M. Chezeau, “High-resolution solid-state NMR investigation of the filler–rubber interaction: 2. High-speed [1H] magic-angle spinning NMR spectroscopy in carbon-black-filled polybutadiene”, Polymer Intern., Vol. 50, pp. 387-394, 2001.
[28] G. J. Papakonstantopoulos, M. Doxastakis, P. F. Nealey, J. L. Barrat and J. J. de Pablo, “Calculation of local mechanical properties of filled polymers”, Phys. Rev. E, Vol. 75, pp. 031803 (1) – 038103 (13), 2007.
[29] R. C. Picu and M. S. Ozmusul, “Structure of linear polymeric chains confined between impenetrable spherical walls”, J. Chem. Phys., Vol. 118, No. 24, pp. 11239-11248, 2003.
[30] R. C. Picu and A. Rakshit, “Dynamics of free chains in polymer nanocomposites”, J. Chem. Phys., Vol. 126, pp. 144909 (1) – 144909 (6), 2007.
[31] S. S. Sternstein and A. J. Zhu, “Reinforcement mechanism of Nanofilled polymer melts as elucidated by nonlinear viscoelasatic behavior”, Macromolecules, Vol. 35, pp. 7262-7273, 2002.
[32] J. C. Fothergill, J. K. Nelson and M. Fu, “Dielectric Properties of Epoxy Nanocomposites containing TiO2, Al2O3 and ZnO fillers”, IEEE Conf. Electr. Insul. Dielectr. Phenomena (CEIDP), pp. 406-409, 2004.
[33] T. Imai, F. Sawa, T. Ozaki, Y. Inoue, T. Shimizu and T. Tanaka, “Comparison of Insulation Breakdown Properties of Epoxy Nanocomposites under Homogeneous and Divergent Electric Fields”, IEEE Conf. Electr. Insul. Dielectr. Phenomena (CEIDP), pp. 306-309, 2006.
Santanu Singha (S’99) was born in Assam, India in 1975. He received the B.E. degree in Electrical Engineering from Assam Engineering College, Guwahati, India in 1997 and the M.Sc. (Engg.) degree in High Voltage Engineering from the Indian Institute of Science, Bangalore India in 2000. He worked as a Materials Scientist in the area of electrical insulation systems at the General Electrical Global Research
Center in Bangalore, India from 2000-2003. Since January 2004, he is a full-time graduate student at the Indian Institute of Science, Bangalore, India working towards his PhD degree in dielectrics and electrical insulation technology. His areas of interest are in dielectric nanocomposites, gas insulation systems, modeling and design of transformer insulation systems and design of electrical insulation systems for HV equipment.
M. Joy Thomas (S’85-M’95) was born in Kerala, India in 1961. He received the B.Tech. degree in Electrical Engineering from Institute of Technology, BHU, Varanasi, India in 1983, the M.Sc. (Engg.) and Ph.D. degrees from Indian Institute of Science, Bangalore, India. Presently, he is working as Assistant Professor at the High Voltage Laboratory, Department of Electrical Engineering, Indian Institute of Science, Bangalore,
India. He is also a member of CIGRE and ASEE. His areas of interest are EHV/UHV power transmission engineering, high voltage engineering, dielectrics and electrical insulation, pulsed power engineering, plasma science and technology, EMC and engineering pedagogy.


![EPOXY RESINS - Krishna districtkrishna.nic.in/PDFfiles/MSME/Chemical/EPOXY RESINS[1].pdf · EPOXY RESINS CONTENTS SECTION I ... PROJECT COST AND PROFITABILITY PROJECTIONS ... Epoxy](https://img.pdfslide.net/doc/110x75/5aa5b17b7f8b9ab4788d7c0f/epoxy-resins-krishna-resins1pdfepoxy-resins-contents-section-i-project.jpg)

![INFLUENCE OF TRIBOELECTRIFICATION ON FRICTION …Dielectric and friction behaviour of unidirectional glass fibre reinforced epoxy (GFRE) were studied, [14]. It was found that the glass](https://img.pdfslide.net/doc/110x75/5f0cce287e708231d437380a/influence-of-triboelectrification-on-friction-dielectric-and-friction-behaviour.jpg)