Embed Size (px)
Citation preview

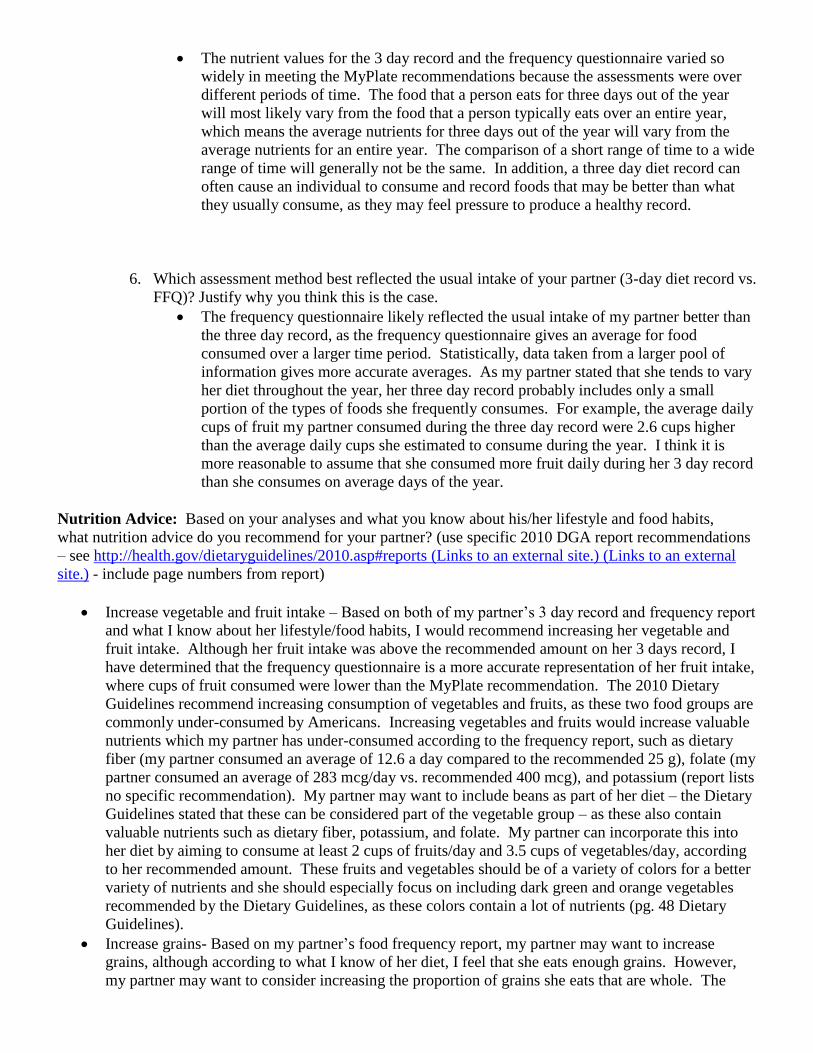
Dietary Assessment MyPlate Comparison Chart
3-Day Diet Record and Food Frequency Questionnaire (DHQ) (submit with Parts 2 & 3- so keep a copy!)
Name of interviewer: Molly Carroll _________________
Client information:
Initials: _ET________ Sex: _female_________ Age:_22______
Habitual physical activity:
Type(s): _Running, walking__________________________________________
Exertion level:_moderate-intense___ Minutes per day:_2 hours__________
Food Group My Plate Recommended
Quantity1
*Note: used physically active listing
on MyPlate site under Daily Food
Plan
DRI calorie goal: _2,600_________
3-Day Diet Record
(Average quantity/day)2
*Note: averaged by NutriCalc:
1,756 kcals
Food Frequency
Questionnaire (DHQ)
(Approximate
quantity/day):
1,120 kcals
grams % of total
calories
grams % of total
calories
grams % of total
calories
Protein (total) 52.62 10-35% 95.7 21% 46.2 16.5%
Carbohydrate
(total) 357.46 45-65% 235.3 52% 120 42.9%
Fat (total) 80.88 20-35% 50.0 25% 37.9 30.5%
Fruits (cups) 2 cups 3.6 cups 1.0 cups
Vegetables (cups) 3.5 cups 1.9 cups 1.5 cups
Grains (oz-eq) 9 oz. 6.6 oz. 2.7 oz.
Protein foods (oz,
tsp, cups) 6.5 oz. 5.4 oz. 6.6 oz.
Dairy (cups) 3 cups 0.6 cups 0.8 cups
Added Oils/Fats
(tsp)3 8 tsp. 9 tsp.
8.4 tsp. (see below for
calculation)
Discretionary
calories (kcals)3 360 kcals 179 kcals 491.3 kcals
Calculation for added oils/ fats in 3 day record:
Day 1: 2 tablespoons of added fats ( 1 tbsp. vinaigrette & 1 tbsp. olive oil)
Day 2: 4 tablespoons of added fats (1 tbsp. cream cheese & ~ 3 tbsp. oil in Pad Thai)
Day 3: 3 tablespoons of added fats (1 tbsp. vinaigrette & 2 tbsp. Tahini – sesame seeds)
(2+4+3)/3= an average of 3 tablespoons of added fats/day

3 tsp.= 1 tbsp. then 3 tbsp.= 9 tsp.
Discretionary kcals in 3 day record:
Day 2: 1 beer- 179 kcals
Added oils/fats in food frequency questionnaire:
Total fats (g): 37.9 g x 1 tsp./4.5 g = 8.4 tsp. fat
Discretionary kcals in food frequency questionnaire:
Discretionary oil (g) + discretionary solid fat (g) + added sugars (tsp) + alcohol (g) = 12.8 g + 16.7 g +
5.2 tsp. + 19.8 g
Oil kcals: 12.8 g x 9 kcals/1 g = 115.2 kcals discretionary oil
Solid fat kcals: 16.7 g x 9 kcals/1 g = 150.3 kcals discretionary solid fat
According to http://msue.anr.msu.edu/news/how_to_convert_grams_of_sugars_into_teaspoons, there are
4.2 g in 1 tsp. of sugar
So 5.2 tsp. sugar x 4.2 g/1 tsp. = 21.8 g x 4 kcal/1 g = 87.2 kcals added sugar
Alcohol kcals: 19.8 g x 7 kcals/1 g = 138.6 kcals
So total discretionary kcals= 115.2 kcals + 150.3 kcals + 87.2 kcals + 138.6 kcals = 491.3 kcals
1 The MyPlate food group recommended listings are appropriate for individuals who get less than 30 minutes per day of moderate physical
activity, beyond normal daily activities. You will need to make recommendation adjustments for clients who are more physically active. 2 For 3-day diet record, total the quantity eaten over three days for each food group on a separate sheet, then divide by three to determine
average daily intake. Report averages in the table above. 3 When completing the Comparison Chart, be mindful that you will need to use your professional judgment when deciding what to include in the
Oils/Fats (tsp) and Discretionary/empty calories (kcals) sections.
Examples in the Oils/Fats (tsp) category may include: salad dressing, butter, oils, etc.; there are 4.5 grams in a tsp.
Examples in the Discretionary/empty calories (kcals) section may include: energy drinks, soda, alcohol, high- octane desserts, etc.
Observations and Responses
Process of Completing the DHQ: Reflect on the process of completing the DHQ electronically
1. Roles as interviewer AND interviewee:
It was quite tedious to interview as reading my partner questions took much longer
than it would have for her to simply answer the questions herself. My partner was
unsure about how often she would eat or drink something during the year for many of
the food items, as she said she varies her diet throughout the year. Not only was the
process time-consuming with this uncertainty, but the report may also have been
inaccurate because of this. Being the interviewee went similarly. It was tedious for
both my partner to ask me questions and for me to answer the questions and took a
while. I too was unsure about how often I ate certain foods, how much I ate of certain
foods, and specific details about my food – such as how often my juice was calcium-
fortified and how often lettuce was dark green in my salads. Consequently, I am not
sure my frequency report was entirely accurate either. By the end, I would say we
were both frustrated from the time it took to accomplish the questionnaires and I was
additionally frustrated because of the inaccuracy I perceived.

2. Your evaluation of the FFQ (what did you like about the program? areas for improvement?)
I liked how many foods the program included; for myself, I could not think of a
specific food that I frequently eat which the questionnaire did not include. However,
it was difficult to remember how I ate of certain foods and how often I ate them,
especially for the foods that I do not eat that often. I tend not to pay too much
attention to the specific amount of foods that I eat as well, so this question was also
hard to answer. As stated before, my partner also had a difficult time remembering
how often she would eat or drink something, and had issues remembering specific
details about foods – such as whether or not she ate white meat chicken. Although we
may not have been able to answer the questions accurately due to our uncertainty, I am
not sure how you could improve the program to fix the issue. I think an inability to
remember every food item eaten and the amount eaten is simply a part of food
frequency questionnaires. Even with the potential inaccuracy, the questionnaire can
generally identify which food groups are under or over-consumed – such as cups of
vegetables per day – even if the exact amounts are slightly off.
3. Were any of the foods or beverages you or your partner typically consume missing from the
data base? etc.
As I stated before, I do not think that any of the foods I frequently consume were
missed in the questionnaire; however, my partner felt that the questionnaire did not
include many cultural foods. She stated that she eats Japanese foods frequently and
many of these items were not in the database. In addition, there was no chocolate soy
milk option, which my partner frequently consumes, but only a chocolate milk option.
Compare and Contrast dietary intake assessment methods: Compare MyPlate recommended food group
quantities to both assessment methods on the Diet Assessment Comparison Table.
4. How do each of the analyses compare to the MyPlate recommendations? Which are higher or
lower?
Protein/carbs/fat:
Protein/carbs/fat are all within range of MyPlate recommendations for both
assessments, except the percent carbs for the food frequency questionnaire, but the
percentage is only slightly lower than recommended, lower than the MyPlate range by
only 2.1%. Grams of protein were higher (by about 43 g) than the MyPlate gram
recommendation for the 3 day record and slightly lower (by about 6 g) than the
MyPlate gram recommendation for the frequency questionnaire. Grams of
carbohydrates were significantly lower than the gram recommendation for both the 3
day record and the frequency questionnaire, but the frequency questionnaire was lower
than the recommendation by about 237 grams while the 3 day diet record was lower
than the recommendation by about 122 grams. Grams of fat were lower than the
MyPlate recommendation by about 30 grams for the 3 day record and lower than the
MyPlate recommendation by about 42 grams for the frequency questionnaire. For
both assessments, the macronutrients consumed occupied the MyPlate goal range of
kcal percentage (excepting the slight difference for the food frequency carb %).
However, because my partner did not meet the DRI kcal goal on the MyPlate column
of the table, the macronutrient gram amounts in both assessments differed widely from
the goal gram amounts.

Fruit:
Cups of fruit were higher than the MyPlate recommendation for the 3 day record, but
lower than the recommendation for the food frequency report. The fruit amounts
varied quite a bit between assessments, 1.6 cups higher than recommended for the 3
day record and 1 cup lower than recommended for the food frequency questionnaire.
Vegetables:
Cups of vegetables were lower than the MyPlate recommendation by 1.6 cups for the
3 day record and lower than the recommendation by 2 cups for the frequency
questionaire.
Grains:
Ounces of grains were lower than the MyPlate recommendation for both the 3 day
record and the food frequency report, although grain ounces were 2.4 ounces lower
than recommended for the 3 day diet record and 6.3 ounces lower than recommended
for the food frequency report.
Protein foods:
Ounces of protein were lower than the recommended MyPlate amount by about 1
ounce for the 3 day record, but the food frequency questionnaire nearly met the
recommended amount, higher than the MyPlate recommendation by only 0.1 ounces –
which I would say met the recommendation.
Dairy:
Dairy was lower than recommended for both the 3 day record and the frequency
questionnaire. Both assessments had similar amounts with 0.6 cups for the 3 day
record and 0.8 cups for the frequency questionnaire, a little over 2 cups below the
MyPlate amount.
Added oils/fats:
The 3 day record was higher than the MyPlate recommended amount by 1 teaspoon,
while the food frequency questionnaire was higher than the recommended amount by
only 0.4 teaspoons.
Discretionary calories:
While discretionary kcals for the 3 day record were lower than the MyPlate
recommendation by about 181 kcals, discretionary kcals for the frequency
questionnaire were higher than the recommended MyPlate amount by 131 kcals.
5. Elaborate on your response to the aforementioned question. Provide an explanation/tell me
why?
The nutrient values for the 3 day record and the frequency questionnaire varied so
widely in meeting the MyPlate recommendations because the assessments were over
different periods of time. The food that a person eats for three days out of the year
will most likely vary from the food that a person typically eats over an entire year,
which means the average nutrients for three days out of the year will vary from the
average nutrients for an entire year. The comparison of a short range of time to a wide
range of time will generally not be the same. In addition, a three day diet record can
often cause an individual to consume and record foods that may be better than what
they usually consume, as they may feel pressure to produce a healthy record.
6. Which assessment method best reflected the usual intake of your partner (3-day diet record vs.
FFQ)? Justify why you think this is the case.
The frequency questionnaire likely reflected the usual intake of my partner better than
the three day record, as the frequency questionnaire gives an average for food
consumed over a larger time period. Statistically, data taken from a larger pool of
information gives more accurate averages. As my partner stated that she tends to vary
her diet throughout the year, her three day record probably includes only a small
portion of the types of foods she frequently consumes. For example, the average daily
cups of fruit my partner consumed during the three day record were 2.6 cups higher
than the average daily cups she estimated to consume during the year. I think it is
more reasonable to assume that she consumed more fruit daily during her 3 day record
than she consumes on average days of the year.
Nutrition Advice: Based on your analyses and what you know about his/her lifestyle and food habits,
what nutrition advice do you recommend for your partner? (use specific 2010 DGA report recommendations
– see http://health.gov/dietaryguidelines/2010.asp#reports (Links to an external site.) (Links to an external
site.) - include page numbers from report)
Increase vegetable and fruit intake – Based on both of my partner’s 3 day record and frequency report
and what I know about her lifestyle/food habits, I would recommend increasing her vegetable and
fruit intake. Although her fruit intake was above the recommended amount on her 3 days record, I
have determined that the frequency questionnaire is a more accurate representation of her fruit intake,
where cups of fruit consumed were lower than the MyPlate recommendation. The 2010 Dietary
Guidelines recommend increasing consumption of vegetables and fruits, as these two food groups are
commonly under-consumed by Americans. Increasing vegetables and fruits would increase valuable
nutrients which my partner has under-consumed according to the frequency report, such as dietary
fiber (my partner consumed an average of 12.6 a day compared to the recommended 25 g), folate (my
partner consumed an average of 283 mcg/day vs. recommended 400 mcg), and potassium (report lists
no specific recommendation). My partner may want to include beans as part of her diet – the Dietary
Guidelines stated that these can be considered part of the vegetable group – as these also contain
valuable nutrients such as dietary fiber, potassium, and folate. My partner can incorporate this into
her diet by aiming to consume at least 2 cups of fruits/day and 3.5 cups of vegetables/day, according
to her recommended amount. These fruits and vegetables should be of a variety of colors for a better
variety of nutrients and she should especially focus on including dark green and orange vegetables
recommended by the Dietary Guidelines, as these colors contain a lot of nutrients (pg. 48 Dietary
Guidelines).
Increase grains- Based on my partner’s food frequency report, my partner may want to increase
grains, although according to what I know of her diet, I feel that she eats enough grains. However,
my partner may want to consider increasing the proportion of grains she eats that are whole. The

Dietary Guidelines state that at least half of all grains consumed should be whole, as whole grains
contain key nutrients such as the B vitamins and dietary fiber. I would recommend to my partner to
choose a whole grain option whenever possible. Although this is not possible at some restaurants or
when eating at a guest’s home, there are generally many whole grain options provided in stores that
can be purchased instead of the refined grain form (pg. 49-50 Dietary Guidelines).
Increase dairy- Although my partner does include some dairy in her diet, she does not include
enough, based on evidence from the frequency report and what I know of her diet. The frequency
questionnaire results may have been skewed slightly by the lack of a chocolate soy milk option,
which my partner more frequently consumes. However, increasing the amount of dairy she
consumes per day by about two cups would increase valuable nutrients in her diet such as calcium,
vitamin D, and vitamin A – if products are fortified. I would recommended that my partner look for
products that are fortified, especially soy milk products fortified with vitamin A and D, as my partner
likes to consume soy milk, and the Dietary Guidelines list fortified soy milk as a milk product. Two
additional cups of dairy per day could be present in the form of glasses of milk/soy milk, or cups of
yogurt or cottage cheese as a snack, which my partner also enjoys consuming (pg 51 Dietary
Guidelines).
Discretionary kcals- These values are too high according to the frequency report for my partner, and
based on my knowledge of her diet, I would recommend that she decrease added oils/fats and alcohol
in her diet slightly. Her discretionary kcals are not excessively over the limit amount of the MyPlate
recommendation, so I would not focus too much on this recommendation, but suggest that she limit
added oils when she can, such as using a tsp. less of oils in cooking or in salad dressing, and to limit
alcohol to no more than one drink a day, according to the Dietary Guidelines (pg. 40 and 44 of
Dietary Guidelines).
Experience and Reflection: After completing this assignment, how do you empathize with nutrition
program clients who must complete these assessments to participate in food assistance programs or research
projects? Use the advantages and limitations of each assessment to support your observations.
I empathize with both the clients and the interviewers very much. From both the point of the
interviewer and the interviewee, the process of either assessment is tedious, long, and frustrating.
The same or similar questions are asked over and over again – with the multiple passes used in
reviewing the 3 day record and the amounts of every food and how often each food is consumed for
the frequency questionnaire.
Limitations and advantages:
I would think that if an interview was performed for too long in one period of time, the
client may begin to give inaccurate answers to questions due to exhaustion. This
could provide inaccurate answers for the multiple pass method of a 3 day diet record
and for answers to the food frequency questionnaire.
Limitations of the 3 day diet record include the inconvenience of recording a diet
record for three days. It takes time to remember to bring your record sheet with you
wherever you eat and to remember to record what you eat even when you have the
record with you. It also takes time to record the amount of a food consumed to the
closest accuracy possible. The food frequency questionnaire has an advantage over
the 3 day record as it does not involve the inconvenience of recording food eaten on
the client’s own time.
However, the 3 day record has an advantage over the food frequency questionnaire in
that the 3 day record does not rely much on memory. As my partner and I both
demonstrated, it was quite difficult to remember average amounts of foods eaten and
how often they were eaten – especially for foods that were not frequently eaten – with
the food frequency questionnaire.

Another limitation of both methods of assessment is that the amounts of food may be
inaccurately represented. For the 3 day record, the client may inaccurately record the
amount eaten without actually measuring the food or simply fail to record the amount
eaten. The interviewer will then have to ask the client how much was eaten, but the
client may inaccurately remember the amount eaten or misperceive the amount that
they ate. For the frequency questionnaire, it is difficult to remember amounts of food
eaten and the frequency they were eaten, as stated before, which may give inaccurate
results.
Finally, as stated before, because the frequency questionnaire records food eaten over
a larger period of time, its averages are likely more accurate than the 3 day record
averages, giving the frequency questionnaire an advantage over the 3 day record.