Embed Size (px)
Citation preview

Journal of Anthropological Archaeology xxx (2012) xxx–xxx
Contents lists available at SciVerse ScienceDirect
Journal of Anthropological Archaeology
journal homepage: www.elsevier .com/ locate/ jaa
Dietary life histories in Stone Age Northern Europe
Gunilla Eriksson ⇑, Kerstin LidénArchaeological Research Laboratory, Stockholm University, SE-10691 Stockholm, Sweden
a r t i c l e i n f o a b s t r a c t
Article history:Available online xxxx
Keywords:Life historyIntra-individual analysisArchaeologyStable carbon and nitrogen isotopesDietMigrationBreastfeedingMesolithicNeolithicNorthern Europe
0278-4165/$ - see front matter � 2012 Elsevier Inc. Adoi:10.1016/j.jaa.2012.01.002
⇑ Corresponding author.E-mail address: [email protected] (G. Eriksson).
Please cite this article in press as: Eriksson, G.,j.jaa.2012.01.002
We present here a framework for using stable isotope analysis of bone and teeth to study individual lifehistory. A sampling strategy and analytical approach for stable carbon and nitrogen analysis of bone anddentine collagen optimised for intra-individual purposes is put forward. The rationale behind this strat-egy, various requirements and constrains, and recommendations on how to modify it according to vari-ations in material and analytical instrumentation, are discussed and explained in detail. Based on intra-individual data for 131 human individuals from Mesolithic and Neolithic sites in Northern Europe, weconsider the sources and various kinds of variation one is likely to find, and how the data can beexplained and transformed into an archaeologically meaningful interpretation. It is concluded that theuse of stable isotope analysis to trace individual life history is not limited to carefully excavated, neatlypreserved, single burials with articulate skeletal remains. Even collective burials, disturbed graves, disar-ticulated human remains in cultural layers, or other depositions that deviate from what is often consid-ered as a ‘‘proper burial’’, offer the possibility to look at individual life biographies.
� 2012 Elsevier Inc. All rights reserved.
Introduction
Recent years have seen developing theories and methods mov-ing beyond the view of groups and populations as the smallest unitof analysis of prehistoric people, putting the individual at the cen-tre of attention. Especially within the realm of burial archaeology,there has been an expansion of data concerning individual lifebiographies. The possibility to trace individual life history is, how-ever, not limited to carefully excavated, neatly preserved, singleburials with articulate skeletal remains. Even collective burials,disturbed graves, disarticulated human remains in cultural layers,or other depositions that deviate from what we as archaeologistsoften consider as ‘‘proper burials’’, offer the possibility to look atindividual life history. We will present here how stable isotopeanalysis of bone and teeth can do just that – what kind of require-ments need to be fulfilled in order for it to work, and what the con-strains are. We are concerned here only with carbon (d13C) andnitrogen (d15N) isotope analysis of bone and dentine collagen fromhumans. Summarising intra-individual data for 131 individualsfrom Mesolithic and Neolithic sites, with a geographical focus onpresent-day Sweden and Latvia, we will demonstrate both thesources and various kinds of variation one is likely to find, andhow the data can be explained and transformed into an archaeo-logically meaningful interpretation.
ll rights reserved.
Lidén, K. Dietary life histories i
Stable isotope analysis
It may seem that establishing palaeodiet is trivial, merely amatter of recording the mode of subsistence, but that would begrossly underestimating the cultural significance of food. In fact,eating is shaped so much by culture that it is almost impossibleto predict what people eat on the basis of available resources only(this goes for today as well as for the Stone Age). Although food is abiological necessity, culture regulates what potential foodstuffs areconsidered edible, the proper ways to prepare and serve them,when and how to eat, and, not least important, who is approvedto consume certain foodstuffs or dishes. Food traditions are gener-ally both strong and rigid, and therefore also important as culturalexpressions. Accordingly, revealing the diet of a prehistoric personmay be at least as informative as knowing the manner of burial orwhat grave goods were associated with the interred person. Intruth, usually more informative, because it relates to the life ofthe person, not just to the event of the ritual surrounding deathand burial.
Every archaeologist is familiar with the importance of doingarchaeological fieldwork in order to understand how archaeologi-cal knowledge is formed, and knowing how to evaluate it. Not leastthe issue of representativity is crucial in every archaeologicalstudy; what individuals are chosen for analysis, and how represen-tative are they of the whole population? It is of course equallyimportant to have a basic understanding of how isotopic data areproduced, what basic assumptions the interpretations rest upon,and what potential sources of error there are. Stable isotope
n Stone Age Northern Europe. J. Anthropol. Archaeol. (2012), doi:10.1016/

2 G. Eriksson, K. Lidén / Journal of Anthropological Archaeology xxx (2012) xxx–xxx
analysis has by now been employed within archaeology for morethan three decades. For general, and in many respects more de-tailed, introductions to stable carbon and nitrogen isotope analysisin archaeology, the reader is referred to reviews by, for example,Schoeninger and Moore (1992), Katzenberg and Harrison (1997)or Sealy (2001). In the present contribution, only certain aspects,namely those pertaining to intra-individual analyses, will bediscussed.
Stable isotope analysis is based on the fact that the body usescomponents in the diet to form tissue, encapsulated in the phrase‘‘you are what you eat’’. The implication is that when tissues suchas bone and tooth dentine are analysed, the stable isotope data re-flect the time of formation of the tissue. For bone, which is con-stantly remodelled throughout life (although the rate slowsdown with age), the stable isotope signature represents an averagefor several years prior to death. Teeth, on the other hand, form dur-ing childhood and do not remodel, and the isotopic signature for atooth therefore represents a distinct period early in life.
Stable isotopes fractionate, that is, their proportions change dueto natural processes, and accordingly these differences can be usedto distinguish between important aspects of the diet. Isotopic val-ues are denoted in the delta notation relative to a standard specificfor each element, and expressed in per mil, ‰. The stable carbonisotope value, d13C, distinguishes between plants such as maize,millet, sorghum, and other tropical grasses, called C4 plants, onthe one hand, and most other plants, called C3 plants, on the other.Consumers of C4 plants, or of animals feeding on C4 plants, typi-cally have very high d13C values, around �10‰, whereas C3 plantconsumers usually have values lower (more negative) than�20‰ (Fig. 1). While this difference has been used to study theintroduction of maize in North America, and the habitat of ancienthominids in Southern Africa (although using tooth enamel – notcollagen), it has no significance at all for Stone Age Northern Eur-ope, due to the lack of tropical climate, or of imported domesti-cated C4 crops – all plants were of the C3 type. Instead, theimportant d13C difference in this area is that between marine andterrestrial resources, where the former usually produce valuesaround �12‰ or lower. The stable nitrogen isotope value, d15N, re-flects level in the food web, with plant values around 3‰, and thenincreasing on average 3‰ for each trophic level, resulting in valuesup to 18‰ for marine top predators such as polar bears.
Fig. 1. Stable isotope values typical for terrestrial (C3) and marine mammals, and for frvalues approximately 3‰ higher.
Please cite this article in press as: Eriksson, G., Lidén, K. Dietary life histories ij.jaa.2012.01.002
For a long time, bone was the first choice for stable isotope anal-ysis, since it provided a dietary signal that was not so sensitive toshort-term fluctuations in diet, but instead levelled out any suchvariation. Many were aware that teeth did not form in the sameway as bone, and therefore would not provide the same type ofsignal, but this was primarily seen as an anomaly or deviation fromthe normal, a problematic fact that one had to deal with by avoid-ing using teeth for analysis whenever possible. It was not until the1990s that this fact was turned into an advantage, something youcould actually make use of. The first published paper employingthis approach on human archaeological material was a study of fiveindividuals by Judy Sealy et al. (1995): ‘‘Beyond lifetime averages:Analysis of different calcified tissues from archaeological humanskeletons’’. For each of the five individuals, they analysed dentinefrom two different teeth (with different formation periods) andtwo bones (a rib and a long bone) for stable carbon, nitrogen andstrontium isotopes, and in addition tooth enamel for strontium.They were able to demonstrate that this analytical strategy offeredtotally new insights about the lives of the analysed individuals, notonly about their diet, but also about their identity. Somewhatsurprisingly, it took several years before this pioneering studywas followed by more than a handful papers employing the samesuccessful approach.
Sampling strategy
Although the principle is easy to grasp, there are several, some-times conflicting, interests that need to be considered when decid-ing what elements to choose for a life history analysis. It is always atrade-off between gleaning as much information as possible andworking efficiently, while taking into account the archaeologicalrealities of availability, preservation and damage done to thematerial (remember that we are dealing here with a destructivemethod). After more than a decade’s experience of intra-individualanalyses, we present here an optimised sampling strategy, therationale behind it, and suggestions on how to modify it accordingto variations in material and analytical instrumentation. Archaeo-logical cases where we have employed this methodology arepresented more fully in separate sections below.
eshwater and marine fish. Please note that consumers will in each case have d15N
n Stone Age Northern Europe. J. Anthropol. Archaeol. (2012), doi:10.1016/

G. Eriksson, K. Lidén / Journal of Anthropological Archaeology xxx (2012) xxx–xxx 3
In the best of all possible worlds, the whole population was bur-ied and excavated, the prehistoric person to be analysed wasdeposited separately in a single episode, not subject to any subse-quent manipulation or disturbance (prehistoric or modern), andthen remained under excellent preservation conditions untilcompetently excavated and documented by professional archaeol-ogists. However, this is rarely the case, and accordingly one has toadapt the approach to the reality that we are most commonly facedwith.
Skeletal remains are finite resources, and for that reason it isimportant to take out as small samples as possible, and to be care-ful not to destroy any morphological characters of the bone ortooth, since these could provide vital information regarding theindividual. Using a dentist’s drill is a good way of obtaining onlythe amount of material needed for analysis, while concomitantlygetting it powdered. To avoid contamination, the surface layershould always be discarded. It is also essential to always documentthe material both prior to and after sampling, most convenientlywith a digital camera.
The turnover rate for bone tissue varies across the skeleton, andeven within one single element. If one wants to compare individu-als of the same biological age, it is therefore advisable to consis-tently use the same bone element from all individuals within oneinvestigation. Preferred elements are those with large amounts ofcortical bone, such as, for example, skull bone, femora, tibiae orhumeri. Compact bone is, as a rule, less affected by degradationthan cancellous bone, which is also why the diaphysis (mid-shaft)of long bones is targeted. Even though ribs are commonly used forstable isotope analysis (probably because ribs are ‘‘affordable’’from an osteological point of view), we strongly advice against it;when the thin surface layer has been removed, there is only spongymatter left. It must be better to get reliable results from one smallsample, than having to repeatedly destroy large amounts of bonein order to acquire enough material for analysis. The amount of(compact) bone needed for analysis is so limited that there willusually be a hole only a few millimetres in size, which is acceptableto most parties involved. Even if the skeletal remains later will beexhibited in a museum, this should not prevent sampling. Eitherthe element in question can be positioned so that the drilled holeis not visible, or a skilled conservator can fill the hole with a sub-stance coloured to match the bone. On the other hand, most mu-seum visitors will find it intriguing and fascinating with visiblesigns of archaeological research, especially if the results for thevery individual at display are accounted for.
When it comes to dental material, another set of considerationsmust be made. A tooth usually has two preserved tissues: dentineand enamel. Being structurally very similar to bone, dentine is thecomponent that makes up the bulk of the tooth. At the crown, thepart of the tooth exposed in the mouth in a living person, a layer ofenamel covers the dentine.
Tooth formation is initiated already in the foetus (in utero), andgenerally ends in late adolescence (although wisdom teeth cancontinue to develop into mature age). This process thus providesthe opportunity to trace change, at the level of the individual, overof period of some 15 years. The earliest formed teeth make up thedeciduous dentition, which is then gradually replaced by the per-manent teeth. Accordingly, for several years during childhood,deciduous and permanent teeth coexist in the jaws, and recordthe same dietary circumstances. Morphologically, there are fourmain types of tooth, distinguished by their shape: incisors (frontteeth), canines (eye teeth), premolars and molars (anterior andposterior grinders). When more than one tooth of each main typeoccur (which is true for all but the canines), they are numberedconsecutively from the front backwards. The deciduous dentitionhas five tooth types: first and second incisors, canines, and firstand second molars (di1, di2, dc, dm1, dm2), whereas a full perma-
Please cite this article in press as: Eriksson, G., Lidén, K. Dietary life histories ij.jaa.2012.01.002
nent dentition consists of first and second incisors, canines, firstand second premolars, and first, second and third molars (I1, I2,C1, P1, P2, M1, M2, M3). Since there are both an upper and a lowerjaw, each with a left and a right side, there are in optimal cases fourteeth of each tooth type available, a redundancy which facilitatessampling and subsequent analysis of individual life history.
Anyone observing an infant will notice that the first teeth eruptin a certain order; incisors precede molars, for example. This re-flects the differences in formation time between tooth types, a fun-damental fact for our purposes. In order to select which tooth typesto get samples from, it is essential to make sure that the time offormation is sufficiently different to make any archaeologicalsense. As a rule, one should seek to get as many data points as pos-sible, while ensuring that the formation time for each sample isdiscrete, that is, not overlapping with any of the others. For chil-dren with deciduous teeth, this could be very hard to accomplish,partly for morphological reasons. Deciduous teeth are small andfracture easily, and therefore it can be problematic to obtainenough material for analysis. Furthermore, the root resorbs priorto shedding, and as a consequence it is frequently the case thatonly the crown yields any dentine worth mentioning. The forma-tion ranges for all tooth types also overlap noticeably. However,there are differences, and with a bit of modelling it is doable to ac-quire relevant data on, for example, breastfeeding patterns (see be-low, and Lidén et al., 2003). Consequently, first choice of deciduoustooth types are the incisors (regardless of first or second – they canbe pooled, if necessary), the canine, the first molar, and the secondmolar. Inclusion of the deciduous canine can be considered op-tional – the formation time after birth overlaps to a great extentwith that of the second deciduous molar, but by contrast about30% of the canine crown is formed in utero.
For adults and juveniles, taking samples from the three molars(first, second, and third, respectively) has proven a successful wayof getting the most out of the material. There are a number of well-founded reasons behind this choice of tooth types, based on mor-phology, tissue formation, and preservation. Molars generally havetwo or three roots, often slightly curved, and they are therefore lesssusceptible to post-mortem loss than other tooth types. Further-more, their size enhances the possibility to obtain large enoughsamples while causing minimal visible damage to the teeth. Thesample is usually drilled at the cervix, that is, right below thecrown, perpendicular to the length axis of the tooth (Fig. 2).
Targeting this particular region has several advantages. Thedentine is laid down in incremental layers, starting from the topof the crown, and, consequently, the crown is always formed atan earlier age than the root. Although the layers run diagonally rel-ative to the horizontal axis (Fig. 2), so that a sample at the cervixwill actually target a number of layers formed during sequentialperiods, the general principle nevertheless holds true: the closerto the occlusal surface, the earlier formed is the dentine. Accord-ingly, a dentine sample from any part of a tooth represents thetime of formation for that specific part.
Unlike the case for deciduous teeth, all available data on the for-mation pattern for permanent molars suggest that there is negligi-ble overlap with regard to the formation periods of the cervicalportion between the first, second and third molars, respectively(Hillson, 1996, and references cited therein; Reid et al., 1998). Con-sequently, such samples from one individual will reflect three dis-tinct/discrete periods of her/his childhood life, thus offering theopportunity to trace life-history data. There is of course consider-able individual and regional variation in formation age, so it isnot possible to establish any exact age for each tooth type, butrather an average age with standard deviations (or an interval),as presented in Fig. 3. The important point here is that we get achronological sequence, and the ages represented thus correspondto the young child, the older child, and the teenager. For each tooth
n Stone Age Northern Europe. J. Anthropol. Archaeol. (2012), doi:10.1016/

Fig. 2. Positioning of sample at the cervix of the tooth. (Left) principal drawing of a section of a canine, sample intersecting more than one incremental layer; (top, right)second molar from the man in burial 165 at Zvejnieki; (lower right) first molar from the same individual – in this case it was not possible to remove the tooth from themandible so drilling was carried out with the jaw and remaining teeth covered by aluminium foil to avoid contamination.
Fig. 3. Ages represented by samples from the three molars and bone, see main text.
Fig. 4. Isotopic variation for each tooth type, as recorded from grave 8 at Ire. I1–2 = incisors, P2 = second premolar, M1, M2, M3 = first, second and third molar.
4 G. Eriksson, K. Lidén / Journal of Anthropological Archaeology xxx (2012) xxx–xxx
type, it is furthermore estimated that the cervical section formsduring approximately one year at the particular age, so that anyseasonal variation should be levelled out. Any of the four speci-mens of each tooth type, whether from the left or the right side,or from the upper or lower jaw, will work for the purpose of theisotopic analyses in question. Although there could be slight differ-ences in formation age in between the four, they are still clearlyseparated in time from the other molars.
Avoiding drilling into the enamel will also prevent cracking, andensure that only dentine is obtained (cement is rarely present inarchaeological samples, and the surface layer is discarded anyway).It will actually also protect the drill bit from damage – being thehardest tissue of the body, tooth enamel can cause cuts. Further-more, the location below the crown but above the part wherethe root separates into two or more root tips, means that the toothstill has the full width and it will therefore be possible to maximisethe amount of dentine obtained.
Please cite this article in press as: Eriksson, G., Lidén, K. Dietary life histories ij.jaa.2012.01.002
In order to test the isotopic variance within each tooth type,samples for all available molars from one individual at the PittedWare site Ire were analysed (Fig. 4, Appendix). The data for eachtooth type are very homogeneous, demonstrating that any of thefour available teeth (left/right, upper/lower) can be used for analy-sis. Except for the third molar, the isotopic differences betweenteeth of the same type are 0.5‰ or less for both d13C and d15N. Thisis true even when one includes a second premolar with the secondmolar, indicating that it works as a reasonable approximation if noteeth of the latter type are available, since the formation period forthe section analysed is the same. The isotopic range for third mo-lars is slightly larger, 0.7‰ for d13C, which could be explained bythe greater variability of formation for wisdom teeth in general.This means that the period in life represented by a sample fromthis tooth lies within a longer age span than for other teeth, butit is still discrete and separate from those represented by the firstand second molars, respectively, and formed during an equallyshort period.
n Stone Age Northern Europe. J. Anthropol. Archaeol. (2012), doi:10.1016/

Fig. 5. Mandible from subject VI, Algutsrum, from three different angles, illustrating positioning of a sample at the horizontal ramus.
G. Eriksson, K. Lidén / Journal of Anthropological Archaeology xxx (2012) xxx–xxx 5
The sampling strategy described above is excellent for caseswhen all skeletal elements are available and an optimal selectioncan be made. Acknowledging that this is not always applicable,there are some viable compromises. For example, one of thepremolars is a good alternative for the second molar, with virtuallyno difference in formation time, as demonstrated above. If thematerial is very fragmented, with disarticulated remains and com-mingled individuals, an excellent strategy is to use the mandiblesto establish a minimum number of individuals, while retainingthe possibility of tracing life-history data. Very often the molarsare the only teeth still present in the jaw, so that both teeth andbone from one individual can be sampled. In this case it is advis-able to drill at the horizontal ramus of the mandible (Fig. 5). Thisstrategy was successfully employed in both Resmo and Köpingsvik,where both prehistoric practices and later intrusions made thematerial fragmented (see below). One should also bear in mindthat even in cases where none of these elements are available, itis still worthwhile to attempt life-history analyses, as will be dem-onstrated below (the ‘‘ad hoc approach’’).
Magnitude of variation
Variation is a tricky concept, which can imply both deviationsfrom a norm and/or a population, or simply change. When it comesto stable isotope analysis of intra-individual variation, however,there is always a temporal aspect involved; each specimen repre-sents a certain period in the life of the individual analysed.
In order to evaluate the archaeological implications of intra-individual isotope data, it is necessary to assess the scale of varia-tion. We have therefore developed a model which is used toclassify the magnitude into limited, moderate or pronounced vari-ation (Fig. 6). The model draws on extensive experience of stableisotope analyses of a rich variety of material, but is based primarilyon a data set from Öland, an island in the Baltic with populationsemploying a wide range of dietary strategies, demonstrating allsorts of intra-individual variability (Eriksson et al., 2008).
The scale of variation is related to the isotopic end-values with-in a certain context. In our case, the maximum differences in bothcarbon and nitrogen isotope values within each site is roughly10‰. A 10‰ shift would thus represent the maximum possibleshift, whereas a 3‰ shift equals thirty percent of the maximumshift. Accordingly, when the stable isotope data for one individualcluster closely together, with a range of less than 1‰ for both car-bon and nitrogen, this is classified as limited variation (up to tenpercent). The archaeological implication is that the person hasnot made any radical change of diet during her/his lifetime (or,more accurately, during the period represented by the specimensanalysed). The overall composition of dietary protein has thus re-
Please cite this article in press as: Eriksson, G., Lidén, K. Dietary life histories ij.jaa.2012.01.002
mained more or less the same, and the small differences actuallyregistered could be due to minor changes in diet, seasonal varia-tion, or be within analytical error.
Individuals exhibiting moderate variation (between ten andtwenty percent) typically display isotopic values that range around1–2‰ for either carbon or nitrogen, or both (Fig. 6). This meansthat the person has clearly changed her/his diet at some point,and this transition has to be interpreted in relation to the specificpopulation, isotope ecology and archaeological setting at hand. In-tra-individual variation involving shifts of more than 2–3‰, finally,is classified as pronounced (more than twenty percent), and is onlyrarely encountered.
One has to bear in mind that there are of course no absolutelimits or measures valid for all regions and ecological settings;the model may have to be adjusted to fit local conditions. It does,however, provide a tool for interpreting the stable isotope data,which will be elaborated on below.
Stone Age case studies
Although we present here only analyses of material from sitesof Mesolithic and Neolithic date, we draw on experience from anal-yses of at least as many individuals from other periods. The sitestreated here are summarised in Table 1, and their geographicallocation plotted in Fig. 7 (for more detailed information on the var-ious sites, please refer to the publications cited in Table 1; all stableisotope data are listed in Appendix). The cases will illustrate typicalcategories of change and various ways to transform the isotopicdata into archaeologically relevant interpretations.
Whenever possible, we have employed a systematic approachaccording to the recommendations above, analysing the three mo-lars and consistently the same bone element throughout for adults.However, when a selection of skeletal elements according to thesystematic approach is not possible, one simply has to use whatis available, something which we have labelled the ‘‘ad hoc ap-proach’’. There are a number of possible reasons for limited accessto skeletal elements, such as, for instance, prehistoric practice ofdeposition, poor preservation, museum policy, dispersal of mate-rial into different collections under separate jurisdictions, allegeduniqueness of material (generally a weak argument), permanentexhibition of the material, or the material may simply have beencoincidentally discovered when going through other collections(happens surprisingly often). Whatever the cause for scarcity indesired elements, there is no reason to exclude such material fromintra-individual analyses on these grounds alone. There is, how-ever, need for extra attention to details in both sampling strategyand interpretation. In particular, an awareness of what each ele-ment actually represents, in terms of formation period, is required.
n Stone Age Northern Europe. J. Anthropol. Archaeol. (2012), doi:10.1016/

Fig. 6. Examples of limited (top), moderate (centre) and pronounced (bottom) variation; stable isotope data from various sites on Öland. Open symbols = tooth dentine,closed symbols = bone.
6 G. Eriksson, K. Lidén / Journal of Anthropological Archaeology xxx (2012) xxx–xxx
If the skeletal preservation is poor, it may be advisable not toinitiate sampling of several elements for each individual at once.It is often more efficient to target only those individuals for whichsuccessful collagen extraction of a first sample is possible, therebyavoiding unnecessary sampling and subsequent extraction at-tempts. Success rates for the populations presented here rangefrom 10% (i.e., one out of ten samples produced any collagen) to
Please cite this article in press as: Eriksson, G., Lidén, K. Dietary life histories ij.jaa.2012.01.002
100%, but even for the first (worst) case, we argue that the effortswere worthwhile. The kind of information gained from these anal-yses provides unique insights into prehistoric individual life histo-ries, and would not be possible to achieve in any other way.
It must be stressed, that the presence or lack of contextual datadoes not determine what approach to use – both proper burialsand disarticulated remains in a cultural layer could be approached
n Stone Age Northern Europe. J. Anthropol. Archaeol. (2012), doi:10.1016/

Table 1Stone Age sites: the number of individuals for which there are intra-individual data,and the original place of publication. For all sites outside of Öland, stable isotope datais presented in the Appendix. All Ölandic stable isotope data is available in Erikssonet al., 2008 (and in the Electronic supplement).
Site (province, country) nind
References
Alby (Öland, Sweden) 1 Lidén et al. (2004) and Eriksson et al.(2008)
Algutsrum (Öland, Sweden) 5 Eriksson et al. (2008)Dragby (Uppland, Sweden) 10 Roumelis (2002)Hanaskede (Västergötland,
Sweden)1 Lidén et al. (2004)
Ire (Gotland, Sweden) 8 Lidén and Eriksson (2007); this studyKalleguta (Öland, Sweden) 1 Eriksson et al. (2008)Korsnäs (Södermanland,
Sweden)3 Fornander et al. (2008)
Köpingsvik (Öland, Sweden) 16 Eriksson et al. (2008)Resmo (Öland, Sweden) 24 Eriksson et al. (2008)Selgas (Latvia) 1 Eriksson et al. (2003)Skateholm I (Skåne, Sweden) 2 Eriksson and Lidén (2003); this studySvemb (Östergötland, Sweden) 3 This studyTorsborg (Öland, Sweden) 9 Eriksson et al. (2008)Vedbæk (Sjælland, Denmark) 6 This studyVickleby (Öland, Sweden) 2 Eriksson et al. (2008)Visby (Gotland, Sweden) 15 Lidén and Eriksson (2007); this studyVästerbjers (Gotland, Sweden) 17 Eriksson (2004)Västerbys (Gotland, Sweden) 2 Lidén and Eriksson (2007); this studyZvejnieki (Vidzeme, Latvia) 5 Eriksson et al. (2003) and Eriksson
(2006, 2007); this study
G. Eriksson, K. Lidén / Journal of Anthropological Archaeology xxx (2012) xxx–xxx 7
either systematically or ‘‘ad hoc’’ depending on the circumstances.Thus, a closed context is no guarantee for a systematic approach; itis all a matter of what material is available for analyses.
Mesolithic hunter–gatherers
The first case is a stray find of a male adult skull from Hanask-ede in the interior of Sweden, radiocarbon dated to the Early Meso-lithic (Boreal period), for which we employed a systematicapproach with samples from the first and second molars as wellas from the skull (no third molar was present). The man exhibitsstable isotope signatures typical of a diet predominated by terres-trial resources, with some minor marine protein input, and moder-ate variation during his lifetime (Fig. 8). The fact that the marinecomponent is diminishing with age, together with the fact thathe was recovered far from the coast, is interpreted as a sign ofmigration. The marine resources available during his childhoodseem not to have been utilised by him as an adult. And since thefood culture acquired early in life tends to be retained, we
Fig. 7. Map indicating the location of sites tre
Please cite this article in press as: Eriksson, G., Lidén, K. Dietary life histories ij.jaa.2012.01.002
accordingly suggest that he moved away from a location closerto the coast after the age of ten.
Further south, at a former lagoon, the well-known Skateholmcomplex, with Late Mesolithic (Atlantic) cemeteries and settlementlayers, was situated. Poor preservation of collagen allowed an adhoc approach on only two individuals, both displaying limitedvariation. From the man in grave 7 only childhood values wereavailable, so any potential change when he reached adult age is un-known. The woman from grave 24, however, evidently had notchanged her diet since she was a girl. The few individuals success-fully analysed from this site, show an unusually wide range incarbon isotope values, from �20.1‰ to �16.1‰, whereas the nitro-gen isotope values are consistently high for all, the latter implyingsubstantial consumption of aquatic resources (Fig. 8). Local faunalreference data indicate that the highest (least negative) d13C valuesfor humans must derive from somewhere else, thus indicating thatsuch individuals were not permanently living at the site. In thelight of this, the intra-individual data can be interpreted in twoways: either these two persons are considered indigenous toSkateholm, buried there alongside people from more distantcommunities. This interpretation could perhaps be supported bythe fact that both were buried in a crouched position, whereasthe others analysed were buried in supine position. Or, Skateholmshould be considered a central place for Late Mesolithic communi-ties (cf. Larsson, 2003), attracting people from a vast area, and allthose buried there were from somewhere else.
Roughly contemporaneous with Skateholm, there are equallyspectacular burials at the coastal site of Vedbæk situated on theeast coast of Zealand in Denmark (Albrethsen and Brinch Petersen,1976), for which there are intra-individual data from six individu-als – one infant, three adult females and two adult males, gener-ated by an ad hoc approach. The overall isotopic signatures ofthis population are indicative of a massive intake of marine proteinof high trophic level, such as cod, seal, and sea fowl (Fig. 8). Two ofthe women – both from double burials (burial 8A and 19A) – dis-play only limited variation between childhood and adult age, asdoes the man in burial 5. The infant from double burial 19 hasextremely elevated nitrogen isotope values, peaking at 18.1‰.Breastfeeding is the only likely cause of such a high value; anexclusively breastfed baby is, so to speak, preying on its mother,and would therefore be at one trophic level above her, correspond-ing to approximately 3‰. Once complementary foods are intro-duced, the d15N value will start to drop, until the baby is fullyweaned. The fact that the bone value is considerably lower thanthat for the deciduous tooth, indicates that this weaning processhad been initiated prior to the death of the baby – early weaning
ated in the text, close-up on Öland (left).
n Stone Age Northern Europe. J. Anthropol. Archaeol. (2012), doi:10.1016/

Fig. 8. Stable isotope data for Mesolithic individuals from Hanaskede (HAN), Skateholm (SKA) and Vedbæk (VED). Open symbols = tooth dentine, closed symbols = bone.
8 G. Eriksson, K. Lidén / Journal of Anthropological Archaeology xxx (2012) xxx–xxx
may even have contributed to its death before the age of one year.Interestingly, the woman buried together with the infant (19A) hasd15N values 4–5‰ lower than the infant, that is, more than onewould expect for one trophic level, suggesting that this was per-haps not the mother of the child – or at least not the womanbreastfeeding the baby. For the woman in burial 6/15, there areonly data from teeth, indicating that she clearly changed her dietfrom early to late childhood. The stable isotope signature for heras an older child conforms to the rest of the population, whereasthe carbon isotope value for her as a young child is considerablylower (more negative). This most likely derive from a higher con-sumption of freshwater fish, considering the elevated nitrogen iso-tope value, although it could also partly be explained by lateweaning. In conclusion, we propose the interpretation that the girlmoved into Vedbæk as a five-year old, or thereabout. The man fromburial 14, finally, shows a pronounced dietary change betweenchildhood and adult age. The d15N value has increased by almost5‰, which clearly indicates that he grew up elsewhere. The com-bination of a high d13C value and a low d15N value suggests highconsumption of shellfish, such as oysters or other marine molluscs.As evident from the presence of shell middens, such resourceswere abundant on the northern or western coasts of Zealand, orin the Roskilde Fjord, so this could be the origin of this man.
The spectacular Stone Age complex of Zvejnieki, in the interiorof Latvia, with more than 300 graves, and adjoining settlementlayers, was in continuous use from the Early Mesolithic to the LateNeolithic (Pre-Boreal to Sub-Boreal). Some 40 individuals have sofar been analysed using an ad hoc approach, and five of those havealso permitted intra-individual analysis (Fig. 9). Extensive stableisotope analyses of faunal remains to support the human data haveestablished that freshwater fish dominated the overall diet of thepopulation. Analyses of deciduous teeth from the child (1.5–2.5 years of age) in burial 5 display only limited variation, whereasthe other individuals display moderate, and in one case pro-nounced, variation. The youngest person was a newborn (possiblystillborn) baby in burial 189, with two bone specimens displayingquite large differences. The bone formed in utero, so the elementsfrom the foetus in fact recorded the diet of the pregnant motherduring a few months. Since the formation period varies between
Please cite this article in press as: Eriksson, G., Lidén, K. Dietary life histories ij.jaa.2012.01.002
elements, we have here a unique possibility to actually traceshort-term fluctuations in diet, and we can say with some certaintythat the variation reflects seasonal differences. With this in mind,we propose that seasonality could also account for the variationdisplayed by the man in burial 179, where the pelvis is likely to re-cord diet during a shorter period than the skull bone. For the manin burial 158, the nitrogen isotope value was elevated with almost2‰ in early childhood (as recorded by an incisor) compared toadult age, apparently as a result of nursing. The man in burial165 displays the most exceptional variation. He was the only indi-vidual analysed at Zvejnieki indicating any marine protein intake,as recorded by the analysis of skull bone. In order to explorewhether he was an immigrant from the coast, a commuterbetween the coast and the interior, or someone who had left Zvej-nieki for the coast and then returned, all three molars were subse-quently analysed. The variation during childhood is moderate, butstill within range for the rest of the population, so this man wasprobably no immigrant, but someone who had left Zvejnieki asan adult and spent some years at the coast. Unfortunately, anattempt to analyse another bone element (with a faster collagenturnover than skull bone) failed – it would otherwise haveprovided information on the likelihood of permanent change ofresidence or frequent commuting.
The Pitted Ware culture
There are intra-individual data from six sites of the Middle Neo-lithic (Sub-Boreal) Pitted Ware culture, mainly from the big islandsin the Baltic because of favourable preservation conditions: Ire,Västerbjers, Visby and Västerbys on Gotland, and Köpingsvik(treated in more detail in the next section) on Öland, and finallyKorsnäs on the Swedish mainland, situated in what was then theinner archipelago. They represent a distinct group of hunter–gath-erers, heavily relying on marine resources, where various species ofseal comprised the single most important source of protein.Although remains of wild boar are commonly retrieved at PittedWare sites, the stable isotope data show that pigs were only rarelyconsumed, possibly in connection with ritual feasting, and wereimportant primarily on a symbolic level – an illustration of the
n Stone Age Northern Europe. J. Anthropol. Archaeol. (2012), doi:10.1016/

Fig. 9. Stable isotope data for individuals from Zvejnieki. Please note that the carbon isotope axis differs from other plots. Open symbols = tooth dentine, closedsymbols = bone.
G. Eriksson, K. Lidén / Journal of Anthropological Archaeology xxx (2012) xxx–xxx 9
tension between culturally important resources and actual con-sumption. Most Pitted Ware individuals display limited variation,and some show moderate changes, but they are all within the mar-ine spectrum. For Västerbjers, a thorough statistical analysis re-vealed that there are systematic intra-individual changes visibleat the population level, so that individuals consistently displaytheir lowest nitrogen isotope values as young children (first molar),reaching a maximum as teenagers (third molar), only to drop againas adults (bone). Subject K from Köpingsvik also conforms to thispattern, displaying moderate variation with the lowest value dur-ing early childhood (Fig. 6). A possible cause for this general pat-tern in early childhood could be particular weaning foods oflower trophic level, whereas the maximum values during adoles-cence could point to a cultural practice, such as a rite de passage,involving intensified seal hunting.
Cultural diversity on Öland
Seven sites with Mesolithic or Neolithic (Atlantic and Sub-Bor-eal) burials of various cultural affiliations were situated within adistance of 50 km at the island of Öland. Employing a systematicapproach, intra-individual data for 58 individuals were obtained.Whenever possible, they were also individually radiocarbon dated,revealing dates from the Late Mesolithic into the Bronze Age.
The hunter–gatherers of Mesolithic and Middle Neolithic datesfrom Alby and Köpingsvik, the latter designated as the Pitted WareCulture, all have diets predominated by marine resources of hightrophic level; faunal isotopic data suggest that seal was the mostimportant prey. The majority of Köpingsvik individuals show onlylimited variation, but three children (grave 3, subjects M and U)display moderate variation with regard to their nitrogen values –clearly signs of breastfeeding patterns. The only Mesolithic individ-ual from Köpingsvik (subject N) displays moderate variation, dem-onstrating a particularly heavy marine protein intake duringadolescence (Fig. 6). This is possibly associated with a specialcultural practice for teenagers, such as that suggested for the PittedWare Culture, but as this is based on merely one individual, suchan interpretation remains somewhat speculative.
Two of the sites on Öland stand out by their extraordinary die-tary practices: Resmo and Torsborg. Resmo is a megalithic passagegrave, usually associated with the Funnel Beaker Culture. Radiocar-bon dating showed, however, that it was in use during three
Please cite this article in press as: Eriksson, G., Lidén, K. Dietary life histories ij.jaa.2012.01.002
subsequent phases, of which only the first could strictly count asFunnel Beaker Culture, spanning the end of the Early Neolithicand the first half of the Middle Neolithic. The second phaseincludes the second half of the Middle Neolithic and the beginningof the Late Neolithic, whereas the third phase is restricted to theBronze Age. During the first phase, the overall diet is characterisedby a mixture of marine and terrestrial resources. Four individualsdisplay limited, and another two moderate, variation. One of thelatter, subject 6, is a child who displays elevated nitrogen isotopevalues for the teeth, and a lower value for the bone, indicating thatit was breastfed and that weaning had been initiated and possiblycompleted prior to death. The other, subject 29, is an adult whoshows progressively less marine and more terrestrial protein in-take during life (Fig. 6). During the second phase, we encounterall sorts of variation: subject 20 is the only to display limitedchange, two children (subjects 3 and 19) display signs of breast-feeding (moderate variation), and the remaining five individuals(subjects 12, 15, 16, 21, and 25) show pronounced variation(Fig. 6). They all run along the continuum of mixed marine/terres-trial resources, but there is no systematic direction of change. Theimplications of this will be discussed together with the Torsborgdata.
Torsborg is a complex of gallery graves, collective inhumationgraves typical of the Late Neolithic in Sweden. Radiocarbon datingrevealed that it was in use from the Middle Neolithic to the BronzeAge. Only two individuals with recorded life history date to theMiddle Neolithic, subjects II and XXIV. Together with the five Res-mo individuals they stand out as the most extreme differences wehave ever encountered at the individual level – up to 4‰ for carbonand 4.5‰ for nitrogen (Fig. 6). Apart from the extreme variation,these seven individuals have the date in common. They all dateto the Middle Neolithic or the transition to the Late Neolithic –the very period when the big dietary shift takes place on Ölandas seen on the level of population, interpreted as the large-scaleintroduction of farming. The wiggles in isotopic signatures at theindividual level cannot be explained by seasonal fluctuations, norby migration. We claim that what we see here is, in fact, the dietarytransition taking place at the level of the individual, involving in-tense contacts and interaction between different cultural groups.
The individuals from Kalleguta, Vickleby and Algutsrum, datingfrom the Late Neolithic to the Bronze Age, display uniformly terres-trial-based diets with limited, or in a few cases moderate, intra-
n Stone Age Northern Europe. J. Anthropol. Archaeol. (2012), doi:10.1016/
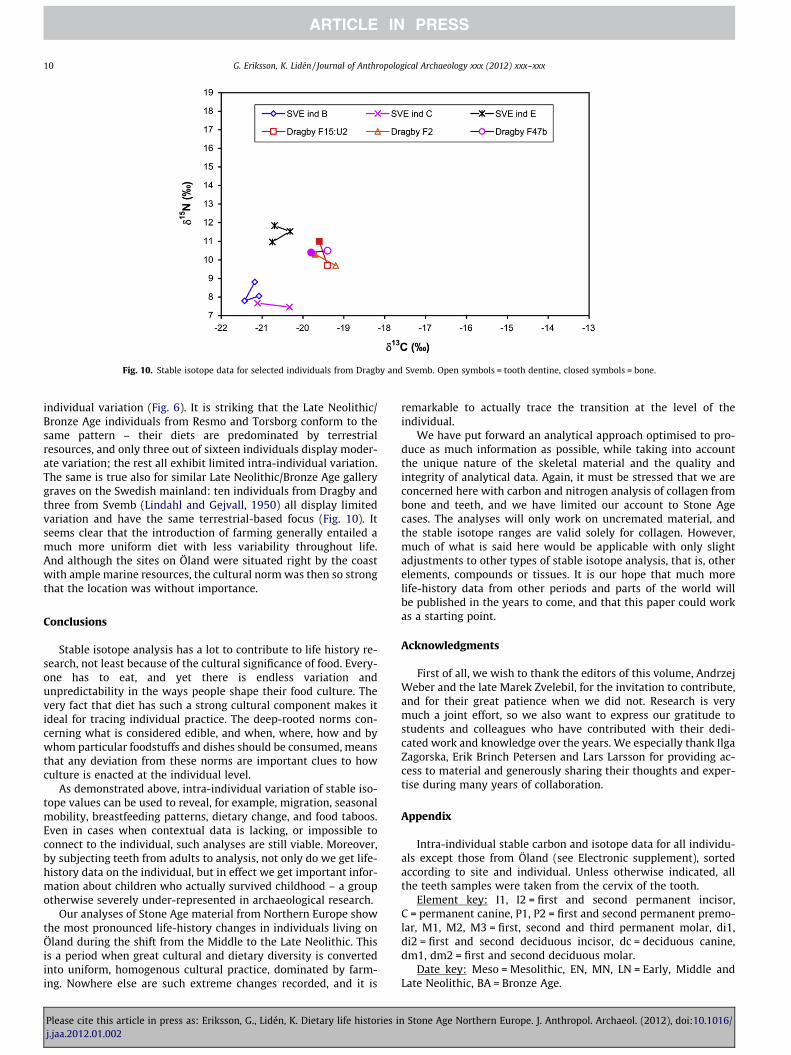
Fig. 10. Stable isotope data for selected individuals from Dragby and Svemb. Open symbols = tooth dentine, closed symbols = bone.
10 G. Eriksson, K. Lidén / Journal of Anthropological Archaeology xxx (2012) xxx–xxx
individual variation (Fig. 6). It is striking that the Late Neolithic/Bronze Age individuals from Resmo and Torsborg conform to thesame pattern – their diets are predominated by terrestrialresources, and only three out of sixteen individuals display moder-ate variation; the rest all exhibit limited intra-individual variation.The same is true also for similar Late Neolithic/Bronze Age gallerygraves on the Swedish mainland: ten individuals from Dragby andthree from Svemb (Lindahl and Gejvall, 1950) all display limitedvariation and have the same terrestrial-based focus (Fig. 10). Itseems clear that the introduction of farming generally entailed amuch more uniform diet with less variability throughout life.And although the sites on Öland were situated right by the coastwith ample marine resources, the cultural norm was then so strongthat the location was without importance.
Conclusions
Stable isotope analysis has a lot to contribute to life history re-search, not least because of the cultural significance of food. Every-one has to eat, and yet there is endless variation andunpredictability in the ways people shape their food culture. Thevery fact that diet has such a strong cultural component makes itideal for tracing individual practice. The deep-rooted norms con-cerning what is considered edible, and when, where, how and bywhom particular foodstuffs and dishes should be consumed, meansthat any deviation from these norms are important clues to howculture is enacted at the individual level.
As demonstrated above, intra-individual variation of stable iso-tope values can be used to reveal, for example, migration, seasonalmobility, breastfeeding patterns, dietary change, and food taboos.Even in cases when contextual data is lacking, or impossible toconnect to the individual, such analyses are still viable. Moreover,by subjecting teeth from adults to analysis, not only do we get life-history data on the individual, but in effect we get important infor-mation about children who actually survived childhood – a groupotherwise severely under-represented in archaeological research.
Our analyses of Stone Age material from Northern Europe showthe most pronounced life-history changes in individuals living onÖland during the shift from the Middle to the Late Neolithic. Thisis a period when great cultural and dietary diversity is convertedinto uniform, homogenous cultural practice, dominated by farm-ing. Nowhere else are such extreme changes recorded, and it is
Please cite this article in press as: Eriksson, G., Lidén, K. Dietary life histories ij.jaa.2012.01.002
remarkable to actually trace the transition at the level of theindividual.
We have put forward an analytical approach optimised to pro-duce as much information as possible, while taking into accountthe unique nature of the skeletal material and the quality andintegrity of analytical data. Again, it must be stressed that we areconcerned here with carbon and nitrogen analysis of collagen frombone and teeth, and we have limited our account to Stone Agecases. The analyses will only work on uncremated material, andthe stable isotope ranges are valid solely for collagen. However,much of what is said here would be applicable with only slightadjustments to other types of stable isotope analysis, that is, otherelements, compounds or tissues. It is our hope that much morelife-history data from other periods and parts of the world willbe published in the years to come, and that this paper could workas a starting point.
Acknowledgments
First of all, we wish to thank the editors of this volume, AndrzejWeber and the late Marek Zvelebil, for the invitation to contribute,and for their great patience when we did not. Research is verymuch a joint effort, so we also want to express our gratitude tostudents and colleagues who have contributed with their dedi-cated work and knowledge over the years. We especially thank IlgaZagorska, Erik Brinch Petersen and Lars Larsson for providing ac-cess to material and generously sharing their thoughts and exper-tise during many years of collaboration.
Appendix
Intra-individual stable carbon and isotope data for all individu-als except those from Öland (see Electronic supplement), sortedaccording to site and individual. Unless otherwise indicated, allthe teeth samples were taken from the cervix of the tooth.
Element key: I1, I2 = first and second permanent incisor,C = permanent canine, P1, P2 = first and second permanent premo-lar, M1, M2, M3 = first, second and third permanent molar, di1,di2 = first and second deciduous incisor, dc = deciduous canine,dm1, dm2 = first and second deciduous molar.
Date key: Meso = Mesolithic, EN, MN, LN = Early, Middle andLate Neolithic, BA = Bronze Age.
n Stone Age Northern Europe. J. Anthropol. Archaeol. (2012), doi:10.1016/

Lab code Individual Age (sex) Date Element Collagen(mg)
Collagen(%)
d13C (‰) d15N (‰) % C % N C/N
DragbyDragby01 Subject F2 Adult M LN M2 0.6 0.9 �19.2 9.7 34.4 12.7 3.2Dragby02 Subject F2 Adult M LN Mandible 0.4 0.7 �19.7 10.3 32.8 12.3 3.1Dragby03 Subject F4 Adult LN M2 0.6 0.9 �19.5 10.1 41.9 15.1 3.2Dragby04 Subject F4 Adult LN Cranium 0.6 0.7 �20.1 10.4 32.4 11.6 3.3Dragby05 Subject F8 Adult M LN M2 0.5 0.8 �19.7 9.9 30.7 11.4 3.1Dragby06 Subject F8 Adult M LN Mandible 0.6 1.0 �19.9 10.1 40.9 14.6 3.3Dragby07 Subject F15 Adult M LN M2 0.4 0.7 �19.2 9.9 32.5 12.3 3.1Dragby08 Subject F15 Adult M LN Mandible 0.4 0.6 �19.4 10.5 39.5 14.4 3.2Dragby09 Subject F15:U2 Adult M LN M2 0.4 0.6 �19.4 9.7 35.8 13.4 3.1Dragby10 Subject F15:U2 Adult M LN Mandible 0.6 0.7 �19.6 11.0 38.2 13.6 3.3Dragby11 Subject F33 Adult F LN P2 0.4 0.7 �19.4 10.6 31.0 11.5 3.1Dragby12 Subject F33 Adult F LN Mandible 0.4 0.7 �19.5 9.8 28.7 11.0 3.0Dragby13 Subject F47a Adult M? LN M2 0.7 1.2 �18.6 9.9 39.8 14.4 3.2Dragby14 Subject F47a Adult M? LN Mandible 0.6 1.0 �19.7 10.5 34.1 12.4 3.2Dragby15 Subject F47b Adult M? LN P2 0.6 1.2 �19.4 10.5 38.9 14.0 3.2Dragby16 Subject F47b Adult M? LN Mandible 0.6 1.0 �19.8 10.4 36.5 13.2 3.2Dragby17 Subject H5-7 Adult LN P2 0.5 1.0 �19.2 9.2 38.0 13.6 3.3Dragby18 Subject H5-7 Adult LN Mandible 0.5 0.7 �19.3 10.1 37.9 13.6 3.3Dragby19 Subject H6-U1 Adult M LN M2 0.7 0.9 �19.6 9.7 32.7 11.8 3.2Dragby20 Subject H6-U1 Adult M LN Mandible 0.6 0.6 �19.6 10.3 37.0 13.5 3.2
HanaskedeHAN 02 Subject 1 Adult M Meso M1 2.5 3.5 �19.0 10.9 38.6 14.0 3.2HAN 01 Subject 1 Adult M Meso M2 1.5 2.6 �18.3 11.5 39.0 14.1 3.2HAN 03 Subject 1 Adult M Meso Cranium 6.6 7.5 �19.7 9.9 42.9 15.6 3.2
IreIRE 44 Ad grave 2 mand 1 Adult MN M2 3.2 6.1 �14.4 16.3 40.9 15.3 3.1IRE 45 Ad grave 2 mand 1 Adult MN Mandible 1.8 2.5 �15.0 16.0 38.7 14.3 3.2IRE 43 Grave 1 Adult M MN M1/M2 3.2 5.0 �13.8 15.2 39.5 14.8 3.1IRE 42 Grave 1 Adult M MN Cranium 1.2 1.6 �14.2 15.6 38.8 14.5 3.1IRE 32 Grave 2 Adult M MN M1 2.5 4.5 �14.4 15.8 41.1 15.2 3.2IRE 08 Grave 2 Adult M MN M2 2.0 3.8 �14.6 15.2 40.4 15.0 3.1IRE 31 Grave 2 Adult M MN M3 1.9 3.7 �13.8 16.1 41.3 15.4 3.1IRE 33 Grave 2 Adult M MN Cranium 6.1 7.1 �14.3 15.9 42.0 15.7 3.1IRE 38 Grave 3 Adult F MN M1 2.7 5.2 �13.4 16.1 40.1 15.1 3.1IRE 39 Grave 3 Adult F MN M2 1.6 3.0 �13.3 16.5 39.6 14.8 3.1IRE 40 Grave 3 Adult F MN M3 1.9 3.9 �13.5 16.6 41.2 15.1 3.2IRE 41 Grave 3 Adult F MN Cranium 4.0 5.2 �14.0 16.4 42.1 15.6 3.1IRE 25 Grave 4 Adult M MN M2 0.9 1.6 �14.2 15.9 36.1 13.0 3.2IRE 27 Grave 4 Adult M MN Cranium 0.9 1.2 �14.6 16.3 35.3 12.3 3.3IRE 29 Grave 5 Adult M MN M2 0.8 1.0 �14.4 16.1 33.7 12.2 3.2IRE 49 Grave 5 Adult M MN Mandible 1.5 2.1 �14.6 16.2 39.5 14.7 3.1IRE 15 Grave 8 Adult F MN I1 dx 0.9 1.5 �14.4 16.5 37.5 13.3 3.3IRE 16 Grave 8 Adult F MN I2 dx 0.5 1.0 �14.9 16.7 32.5 11.1 3.4IRE 24 Grave 8 Adult F MN M1 dx 0.5 0.8 �14.6 16.3 37.5 12.4 3.5IRE 17 Grave 8 Adult F MN M1 sin 2.5 4.6 �14.4 16.1 41.2 15.4 3.1IRE 23 Grave 8 Adult F MN M1 sin 0.7 1.8 �14.1 16.1 39.0 14.1 3.2IRE 09 Grave 8 Adult F MN M2 dx 0.8 1.4 �15.0 14.8 33.8 12.0 3.3IRE 14 Grave 8 Adult F MN M2 sin 1.5 1.9 �15.1 15.3 39.2 14.1 3.2IRE 13 Grave 8 Adult F MN M2 sin 1.9 3.3 �15.1 15.0 37.6 13.7 3.2IRE 12 Grave 8 Adult F MN P2 sin 0.4 1.0 �15.2 15.3 39.0 13.2 3.4IRE 10 Grave 8 Adult F MN M3 dx 1.4 2.0 �14.4 16.2 36.9 13.7 3.1IRE 11 Grave 8 Adult F MN M3 sin 2.2 4.3 �13.7 16.7 42.9 14.5 3.5IRE 50 Grave 8 Adult F MN Mandible 1.0 2.1 �14.7 16.0 35.4 13.0 3.2IRE 22 Grave 8 Adult F MN Cranium 0.4 0.6 �14.9 15.4 35.6 12.8 3.2IRE 34 Grave 9 Adult F MN M1 2.1 4.9 �14.7 16.4 40.4 15.3 3.1IRE 36 Grave 9 Adult F MN M3 2.3 5.1 �14.9 16.2 40.8 15.3 3.1IRE 35 Grave 9 Adult F MN P2 2.0 4.4 �14.8 16.9 40.8 15.3 3.1IRE 37 Grave 9 Adult F MN Cranium 2.8 5.8 �14.6 16.1 41.9 15.7 3.1
(continued on next page)
G. Eriksson, K. Lidén / Journal of Anthropological Archaeology xxx (2012) xxx–xxx 11
Please cite this article in press as: Eriksson, G., Lidén, K. Dietary life histories in Stone Age Northern Europe. J. Anthropol. Archaeol. (2012), doi:10.1016/j.jaa.2012.01.002

Appendix (continued)
Lab code Individual Age (sex) Date Element Collagen(mg)
Collagen(%)
d13C (‰) d15N (‰) % C % N C/N
KorsnäsKOR 49 Subject 7 Adult MN M2 0.8 1.4 �15.2 15.6 38.3 13.6 3.3KOR 47 Subject 7 Adult MN Mandible 1.6 2.2 �16.2 15.8 39.9 14.5 3.2KOR 67 Subject 13 Adult MN M2 2.5 3.9 �13.1 15.5 39.7 14.9 3.1KOR 68 Subject 13 Adult MN M1 1.4 2.5 �13.7 15.4 40.2 14.9 3.1KOR 69 Subject 13 Adult MN Mandible 1.8 2.4 �13.8 15.7 41.2 15.3 3.1KOR 73 Subject 14 Child MN dm1 0.6 1.7 �15.4 16.6 32.5 12.1 3.1KOR 74 Subject 14 Child MN dc 0.3 1.3 �16.5 15.8 36.0 12.0 3.5KOR 72 Subject 14 Child MN dm2 0.7 1.7 �16.1 15.9 38.1 13.0 3.4KOR 71 Subject 14 Child MN M1 1.1 1.8 �15.2 15.6 40.4 14.7 3.2KOR 70 Subject 14 Child MN Mandible 2.3 3.2 �15.2 16.2 41.7 15.4 3.2
SelgasLAT 05 Grave 2 Adult F MN M1/M2 3.6 5.9 �21.3 10.5 40.9 15.1 3.2LAT 04 Grave 2 Adult F MN Fibula 1.8 1.2 �21.5 10.1 39.0 14.5 3.1
Skateholm ISKA 83 Grave 7 Adult M Meso M1 4.0 2.6 �18.6 13.9 39.5 14.5 3.2SKA 05 Grave 7 Adult M Meso C1 0.8 1.2 �19.2 13.6 35.8 12.6 3.3SKA 84 Grave 7 Adult M Meso M2 4.7 3.2 �18.2 13.9 41.1 15.0 3.2SKA 88 Grave 24 Adult F Meso M2 0.7 1.0 �19.0 13.7 34.5 11.9 3.4SKA 87 Grave 24 Adult F Meso Cranium 5.4 2.2 �19.6 13.9 39.4 13.9 3.3
SvembSVE 20 Subject B Adult LN M1 0.5 1.1 �21.2 8.8 30.7 11.0 3.2SVE 21 Subject B Adult LN M2 0.4 0.9 �21.4 7.8 28.9 9.7 3.5SVE 19 Subject B Adult LN M3 0.6 1.4 �21.1 8.1 30.7 10.7 3.4SVE 23 Subject C Adult LN M1 0.9 1.8 �21.1 7.7 35.1 12.8 3.2SVE 22 Subject C Adult LN M3 0.7 1.6 �20.3 7.5 33.1 12.1 3.2SVE 05 Subject E Adult LN M1 1.8 4.2 �20.7 11.0 39.4 14.0 3.3SVE 06 Subject E Adult LN M2 1.2 2.5 �20.3 11.5 35.1 12.8 3.2SVE 07 Subject E Adult LN M3 1.4 3.6 �20.7 11.8 37.9 13.7 3.2
VedbækVED 48 Grave 5 Adult M Meso M2 0.6 0.6 �14.4 16.4 37.7 12.8 3.4VED 49 Grave 5 Adult M Meso M3 0.4 0.5 �14.5 15.8 36.9 12.7 3.4VED 04 Grave 5 Adult M Meso Femur 1.5 1.2 �13.5 16.4 35.9 12.9 3.2VED 13 Grave 6/15 Adult F Meso M1 1.0 1.1 �17.4 16.5 39.6 14.0 3.3VED 14 Grave 6/15 Adult F Meso M2 0.7 1.4 �15.3 15.5 40.3 13.6 3.5VED 24 Grave 8A Adult F Meso P1/P2 0.6 1.5 �13.9 15.6 38.9 14.0 3.3VED 25 Grave 8A Adult F Meso Cranium 1.0 1.1 �14.0 15.3 40.7 14.8 3.2VED 52 Grave 14 Adult M Meso P1/P2 4.0 5.6 �15.5 11.9 40.6 15.4 3.1VED 05 Grave 14 Adult M Meso Femur 1.7 1.3 �13.6 16.5 36.1 12.9 3.3VED 23 Grave 19A Adult F Meso I1/I2 0.3 0.9 �14.6 14.1 36.0 12.9 3.3VED 22 Grave 19A Adult F Meso M3 1.0 1.9 �14.4 13.8 40.5 14.9 3.2VED 21 Grave 19A Adult F Meso Mandible 0.3 0.4 �14.7 13.3 38.4 13.5 3.3VED 18 Grave 19B Infant Meso dm2 germ 2.2 2.4 �14.5 18.1 42.6 15.2 3.3VED 26 Grave 19B Infant Meso Cranium 2.0 1.6 �14.4 16.9 42.0 15.3 3.2
VisbyVIS 24 Grave 3B Adult M MN M1 1.5 2.8 �15.4 15.6 41.3 13.7 3.5VIS 25 Grave 3B Adult M MN M2 1.2 1.8 �15.0 15.9 40.2 13.4 3.5VIS 26 Grave 3B Adult M MN M3 1.4 2.9 �14.7 15.1 42.4 14.2 3.5VIS 04 Grave 5 Adult M MN I1 2.4 5.4 �14.9 16.1 41.2 15.0 3.2VIS 05 Grave 5 Adult M MN M2 1.0 2.1 �14.9 15.8 37.0 13.2 3.3VIS 06 Grave 5 Adult M MN M3 0.8 1.5 �15.4 15.3 36.3 13.0 3.3VIS 35 Grave 13 Adult M MN M1 0.8 1.2 �14.9 15.9 31.1 11.6 3.1VIS 37 Grave 13 Adult M MN M3 0.7 1.5 �14.5 16.0 31.6 11.9 3.1VIS 64 Grave 13 Adult M MN Cranium 0.6 0.9 �15.1 15.9 35.1 12.9 3.2VIS 07 Grave 14 Adult F MN M1 1.0 2.1 �14.3 16.6 37.3 13.8 3.2VIS 08 Grave 14 Adult F MN M2 0.9 1.7 �13.9 16.5 33.1 11.9 3.2VIS 09 Grave 14 Adult F MN M3 0.6 1.1 �15.3 16.8 35.3 11.8 3.5VIS 62 Grave 14 Adult F MN Cranium 0.8 1.4 �14.8 16.8 35.7 13.2 3.2
12 G. Eriksson, K. Lidén / Journal of Anthropological Archaeology xxx (2012) xxx–xxx
Please cite this article in press as: Eriksson, G., Lidén, K. Dietary life histories in Stone Age Northern Europe. J. Anthropol. Archaeol. (2012), doi:10.1016/j.jaa.2012.01.002

Appendix (continued)
Lab code Individual Age (sex) Date Element Collagen(mg)
Collagen(%)
d13C (‰) d15N (‰) % C % N C/N
VIS 10 Grave 18 Adult M MN M1 0.4 0.8 �15.2 15.8 30.9 11.2 3.2VIS 11 Grave 18 Adult M MN P2 0.4 0.7 �14.4 16.4 30.0 10.9 3.2VIS 12 Grave 18 Adult M MN M3 0.5 0.9 �14.7 16.8 29.7 10.6 3.2VIS 65 Grave 18 Adult M MN Cranium 1.4 1.9 �15.2 16.5 39.7 14.0 3.3VIS 27 Grave 19 Adult M MN I1 1.1 2.9 �15.1 16.3 37.5 14.1 3.1VIS 28 Grave 19 Adult M MN C1 (root) 2.6 6.2 �15.1 15.9 39.8 14.9 3.1VIS 66 Grave 19 Adult M MN Cranium 0.6 0.9 �15.7 15.3 32.6 12.2 3.1VIS 13 Grave 22 Adult F MN M1 0.7 1.7 �16.2 15.3 32.1 11.2 3.3VIS 14 Grave 22 Adult F MN M2 2.0 3.9 �15.5 15.7 26.7 10.0 3.1VIS 54 Grave 23 Adult M? MN M1 0.3 0.7 �16.4 14.7 22.5 9.1 2.9VIS 56 Grave 23 Adult M? MN M2 0.2 0.4 �15.9 15.6 30.8 11.6 3.1VIS 68 Grave 23 Adult M? MN Cranium 1.3 2.2 �16.1 15.9 42.0 14.2 3.4VIS 31 Grave 27 Adult M MN M3 1.8 4.5 �14.9 16.0 41.7 14.2 3.4VIS 69 Grave 27 Adult M MN Cranium 0.8 1.3 �15.3 15.8 38.2 12.6 3.5VIS 51 Grave 28 Adult M? MN M1 2.7 5.1 �16.1 13.0 40.7 14.6 3.3VIS 52 Grave 28 Adult M? MN M3 1.7 3.7 �14.9 16.3 42.5 14.5 3.4VIS 70 Grave 28 Adult M? MN Cranium 2.7 4.9 �14.4 16.3 42.2 14.5 3.4VIS 38 Grave 31 Child MN di1 0.8 1.6 �15.1 17.6 30.1 11.2 3.1VIS 41 Grave 31 Child MN M1 germ 1.2 2.8 �16.2 14.2 39.8 12.9 3.6VIS 42 Grave 31 Child MN Cranium 1.7 2.9 �15.5 17.1 42.1 14.0 3.5VIS 21 Grave 33 Adult M MN P2 1.3 1.9 �14.1 15.9 39.4 13.3 3.5VIS 72 Grave 33 Adult M MN Cranium 1.1 1.9 �15.4 15.7 37.6 12.6 3.5VIS 50 Grave 2/24 Adult F MN M2 2.8 4.4 �15.4 16.2 39.2 14.5 3.2VIS 43 Grave 2/24 Adult F MN Cranium 0.9 1.8 �15.7 15.7 33.6 12.6 3.1VIS 48 Grave 19/37 Adult M MN M1 1.8 3.6 �13.6 16.1 40.5 15.1 3.1VIS 47 Grave 19/37 Adult M MN P2 0.8 1.2 �14.0 16.1 28.1 11.4 2.9VIS 49 Grave 19/37 Adult M MN M3 2.2 4.2 �13.8 15.9 39.7 15.1 3.1VIS 74 Grave 19/37 Adult M MN Cranium 5.4 8.9 �14.3 16.7 44.6 15.3 3.4VIS 44 Grave ‘‘not 27’’ Adult MN M1 1.0 1.8 �13.6 16.7 37.5 14.0 3.1VIS 45 Grave ‘‘not 27’’ Adult MN M2 0.6 1.2 �14.4 15.9 33.5 12.2 3.2VIS 73 Grave ‘‘not 27’’ Adult MN Tibia 0.9 1.6 �14.3 16.0 42.2 14.1 3.5
VästerbjersVÄS 036 Grave 2 Adult M MN M1 2.1 5.2 �14.6 15.7 42.7 14.3 3.5VÄS 025 Grave 2 Adult M MN Cranium 1.5 2.2 �14.8 15.5 39.7 14.2 3.3VÄS 067 Grave 4 Adult F MN M1 1.0 2.1 �15.6 14.7 33.9 12.1 3.3VÄS 066 Grave 4 Adult F MN Cranium 1.1 1.6 �15.5 15.2 36.1 12.8 3.3VÄS 051 Grave 6 Adult F MN M1 3.5 5.1 �16.0 14.8 39.7 14.3 3.2VÄS 053 Grave 6 Adult F MN M3 2.6 4.9 �15.5 16.2 40.7 14.9 3.2VÄS 052 Grave 6 Adult F MN P2 2.1 5.2 �15.3 16.1 38.2 14.0 3.2VÄS 062 Grave 6 Adult F MN Cranium 3.5 3.4 �15.7 15.6 40.8 14.9 3.2VÄS 058 Grave 20 Adult F MN M1 1.6 3.6 �14.8 15.2 38.7 14.3 3.2VÄS 059 Grave 20 Adult F MN P2 2.0 4.6 �14.3 15.2 38.7 14.2 3.2VÄS 005 Grave 20 Adult F MN Cranium 2.9 3.9 �14.6 15.1 40.2 15.2 3.1VÄS 008 Grave 24 Adult F MN M1 1.5 2.2 �15.4 15.1 34.5 13.4 3.0VÄS 006 Grave 24 Adult F MN M2 1.9 2.9 �14.4 15.6 40.3 15.2 3.1VÄS 007 Grave 24 Adult F MN M3 2.1 4.0 �14.5 16.3 40.5 15.4 3.1VÄS 009 Grave 24 Adult F MN Cranium 4.1 5.5 �15.3 15.6 38.4 15.1 3.0VÄS 039 Grave 31 Adult M MN M1 2.5 6.4 �14.7 15.3 43.4 14.8 3.4VÄS 034 Grave 31 Adult M MN M2 3.1 5.5 �14.4 15.6 44.2 15.1 3.4VÄS 035 Grave 31 Adult M MN M3 2.8 6.1 �14.5 15.7 43.7 15.2 3.4VÄS 010 Grave 31 Adult M MN Cranium 1.0 1.1 �14.6 15.6 36.8 13.4 3.2VÄS 047 Grave 63 Adult M MN M1 1.0 1.6 �15.5 15.6 32.4 11.4 3.3VÄS 046 Grave 63 Adult M MN M3 0.9 2.4 �15.1 16.2 31.6 11.3 3.3VÄS 014 Grave 63 Adult M MN P2 1.0 1.8 �15.0 16.3 35.3 13.1 3.1VÄS 016 Grave 63 Adult M MN Cranium 0.9 1.0 �15.4 16.5 36.5 13.6 3.1VÄS 040 Grave 66:2 Adult M MN M1 3.4 5.7 �15.2 14.9 39.3 13.9 3.3VÄS 041 Grave 66:2 Adult M MN M2 2.2 4.7 �14.5 15.5 42.4 14.4 3.4VÄS 042 Grave 66:2 Adult M MN M3 2.3 5.4 �14.4 15.1 43.3 14.7 3.4VÄS 018 Grave 66:2 Adult M MN Cranium 1.3 2.1 �15.2 15.8 36.9 13.8 3.1
(continued on next page)
G. Eriksson, K. Lidén / Journal of Anthropological Archaeology xxx (2012) xxx–xxx 13
Please cite this article in press as: Eriksson, G., Lidén, K. Dietary life histories in Stone Age Northern Europe. J. Anthropol. Archaeol. (2012), doi:10.1016/j.jaa.2012.01.002

Appendix (continued)
Lab code Individual Age (sex) Date Element Collagen(mg)
Collagen(%)
d13C (‰) d15N (‰) % C % N C/N
VÄS 081 Grave 67:1a Adult F MN M1 2.6 3.8 �14.9 16.3 41.0 15.1 3.2VÄS 082 Grave 67:1a Adult F MN M2 2.4 4.7 �14.9 16.8 41.1 15.1 3.2VÄS 054 Grave 67:2b Child MN dm1 1.9 5.2 �14.3 17.3 38.8 14.0 3.2VÄS 056 Grave 67:2b Child MN M1 2.8 5.2 �14.0 14.8 40.6 14.8 3.2VÄS 057 Grave 67:2b Child MN P2 germ 2.3 5.0 �13.7 14.4 39.2 14.3 3.2VÄS 045 Grave 80 Adult F MN M3 1.8 4.2 �14.7 15.9 38.8 14.0 3.2VÄS 021 Grave 80 Adult F MN Cranium 1.8 2.5 �14.7 15.8 38.9 14.5 3.1VÄS 151 Grave 82 Child MN di1 0.4 1.2 �14.6 16.7 31.1 10.9 3.3VÄS 152 Grave 82 Child MN dm1 0.6 1.3 �13.8 17.2 29.7 10.3 3.4VÄS 153 Grave 82 Child MN dm2 0.7 1.4 �14.2 15.7 32.6 11.6 3.3VÄS 154 Grave 82 Child MN M1 germ 2.9 4.7 �13.4 16.6 40.1 14.9 3.1VÄS 150 Grave 82 Child MN Cranium 5.0 3.1 �14.2 17.1 44.2 16.0 3.2VÄS 030 Grave 82 Adult MN M1 2.6 4.8 �14.3 15.6 44.4 15.3 3.4VÄS 031 Grave 82 Adult MN M2 3.0 5.8 �14.0 16.8 43.9 15.2 3.4VÄS 032 Grave 82 Adult MN M3 2.3 5.0 �14.5 15.7 43.4 15.2 3.3VÄS 061 Grave 82 Adult MN Cranium 1.3 2.8 �14.5 16.4 35.8 12.9 3.2VÄS 147 ‘‘Finding-place’’ 87 Infant MN Femur 4.1 5.2 �15.3 15.2 42.8 15.6 3.2VÄS 146 ‘‘Finding-place’’ 87 Infant MN Cranium 3.2 2.8 �15.4 16.0 42.9 15.4 3.3VÄS 029 Grave 88 Adult F MN M2 2.2 4.7 �15.8 15.2 43.4 15.0 3.4VÄS 023 Grave 88 Adult F MN Cranium 1.8 2.9 �14.4 15.1 41.0 15.3 3.1VÄS 078 Grave 92 Adult F MN M1 2.3 5.1 �14.4 15.4 40.1 14.8 3.2VÄS 077 Grave 92 Adult F MN P1 2.3 5.6 �14.3 15.6 40.1 14.9 3.1VÄS 079 Grave 92 Adult F MN Cranium 1.5 1.7 �15.8 14.9 38.6 14.2 3.2VÄS 071 Grave 93 Adult M MN M1 2.8 5.3 �15.2 14.3 40.8 15.1 3.2VÄS 070 Grave 93 Adult M MN M2 3.0 6.7 �15.4 14.4 40.5 14.9 3.2VÄS 069 Grave 93 Adult M MN M3 2.5 4.6 �15.2 14.8 40.3 14.9 3.2VÄS 072 Grave 93 Adult M MN Cranium 2.1 3.7 �15.8 14.9 40.2 14.5 3.2
VästerbysVHA 04 Grave 1, sk I Adult M MN I1/I2 2.5 4.6 �14.9 13.7 43.1 14.7 3.4VHA 05 Grave 1, sk I Adult M MN M2 2.1 4.1 �14.8 14.2 43.6 14.8 3.4VHA 06 Grave 1, sk I Adult M MN M3 2.5 5.0 �14.7 14.6 43.0 14.5 3.5VHA 01 Grave 1, sk II Adult F MN M1 1.2 2.6 �16.4 14.4 38.8 13.0 3.5VHA 02 Grave 1, sk II Adult F MN M2 1.7 3.7 �16.8 13.4 42.1 14.4 3.4VHA 03 Grave 1, sk II Adult F MN M3 2.2 4.6 �14.9 15.9 41.7 14.1 3.4
ZvejniekiZVE 05 Grave 5 Child Meso di1/di2 0.8 4.8 �22.9 12.8 37.6 12.3 3.6ZVE 03 Grave 5 Child Meso dm2 2.2 2.9 �22.5 13.1 39.6 13.7 3.4ZVE 15 Grave 158 Adult M EN? I1/I2 2.0 5.0 �24.3 14.0 37.7 13.2 3.3ZVE 34 Grave 158 Adult M EN? Hyoid bone 1.4 1.5 �23.6 12.2 40.0 14.8 3.2ZVE 65 Grave 165 Adult M MN M1 2.5 2.9 �22.0 13.5 41.2 13.3 3.6ZVE 66 Grave 165 Adult M MN M2 2.1 2.5 �20.9 12.6 45.6 15.0 3.5ZVE 67 Grave 165 Adult M MN M3 2.4 4.4 �20.6 13.4 41.0 14.0 3.4ZVE 41 Grave 165 Adult M MN Cranium 2.2 1.3 �18.8 12.0 29.2 10.1 3.4ZVE 17 Grave 179 Adult M EN Pelvis 2.0 1.7 �22.6 10.5 37.9 14.1 3.1ZVE 25 Grave 179 Adult M EN Cranium 1.5 0.8 �23.8 12.0 36.7 13.0 3.3ZVE 06 Grave 189 Infant EN Femur 3.3 2.3 �23.4 12.5 40.1 13.9 3.4ZVE 35 Grave 189 Infant EN Cranium 2.2 1.1 �21.4 11.4 38.6 14.3 3.1
14 G. Eriksson, K. Lidén / Journal of Anthropological Archaeology xxx (2012) xxx–xxx
Supplementary material
Supplementary data associated with this article can be found, inthe online version, at doi:10.1016/j.jaa.2012.01.002.
References
Albrethsen, S.E., Brinch Petersen, E., 1976. Excavation of a mesolithic cemetery atVedbæk, Denmark. Acta Archaeologica 41 (1), 1–28.
Eriksson, G., 2004. Part-time farmers or hard-core sealers? Västerbjers studied bymeans of stable isotope analysis. Journal of Anthropological Archaeology 23,135–162.
Please cite this article in press as: Eriksson, G., Lidén, K. Dietary life histories ij.jaa.2012.01.002
Eriksson, G., 2006. Stable isotope analysis of human and faunal remains fromZvejnieki. In: Larsson, L., Zagorska, I. (Eds.), Back to the Origin: New Research inthe Mesolithic–Neolithic Zvejnieki Cemetery and Environment. Northern Latvia.Almqvist & Wiksell International, Lund, pp. 183–215.
Eriksson, G., 2007. Immigrant, returnee or commuter? In: Hårdh, B., Jennbert, K.,Olausson, D. (Eds.), On the Road: Studies in Honour of Lars Larsson, ActaArchaeologica Lundensia. Series in 4o, vol. 26. Almqvist & Wiksell International,Lund, pp. 188–192.
Eriksson, G., Lidén, K., 2003. Skateholm revisited: new stable isotope evidence onhumans. In: Eriksson, G. (Ed.), Norm and Difference. Stone Age Dietary Practicein the Baltic Region, Paper VI. Archaeological Research Laboratory, StockholmUniversity, Stockholm.
Eriksson, G., Lõugas, L., Zagorska, I., 2003. Stone Age hunter–fisher–gatherers atZvejnieki, northern Latvia: Radiocarbon, stable isotope and archaeozoologydata. Before Farming (www.waspjournals.com) 2003/1(2), 1–26.
n Stone Age Northern Europe. J. Anthropol. Archaeol. (2012), doi:10.1016/

G. Eriksson, K. Lidén / Journal of Anthropological Archaeology xxx (2012) xxx–xxx 15
Eriksson, G., Linderholm, A., Fornander, E., Kanstrup, M., Schoultz, P., Olofsson, H.,Lidén, K., 2008. Same island, different diet: cultural evolution of food practice onÖland, Sweden, from the Mesolithic to the Roman Period. Journal ofAnthropological Archaeology 27, 520–543.
Fornander, E., Eriksson, G., Lidén, K., 2008. Wild at heart: approaching pitted wareidentity, economy and cosmology through stable isotopes in skeletal materialfrom the Neolithic site Korsnäs in Eastern Central Sweden. Journal ofAnthropological Archaeology 27, 281–297.
Hillson, S., 1996. Dental Anthropology. Cambridge University Press, Cambridge.Katzenberg, M.A., Harrison, R.G., 1997. What’s in a bone? Recent advances in
archaeological bone chemistry. Journal of Archaeological Research 5, 265–293.Larsson, L., 2003. The Mesolithic of Sweden in retrospective and progressive
perspectives. In: Larsson, L., Kindgren, H., Knutsson, K., Loeffler, D., Åkerlund, A.(Eds.), Mesolithic on the Move: Papers Presented at the Sixth InternationalConference on The Mesolithic in Europe, Stockholm 2000. Oxbow Books,Oxford, pp. xxii–xxxii.
Lidén, K., Eriksson, G., 2007. Walking on the wild side: On cultural diversity and thePitted Ware culture along the Swedish east coast during the Middle Neolithic.In: Larsson, M., Parker Pearson, M. (Eds.), From Stonehenge to the Baltic: Livingwith Cultural Diversity in the Third Millennium BC. BAR International Series1692, Oxford, pp. 1–11.
Lidén, K., Olsson, A., Eriksson, G., Angerbjörn, A., 2003. Nitrogen isotope analysis ofdeciduous teeth: a tool for tracing weaning patterns. In: Eriksson, G. (Ed.), Norm
Please cite this article in press as: Eriksson, G., Lidén, K. Dietary life histories ij.jaa.2012.01.002
and Difference. Stone Age Dietary Practice in the Baltic Region, Paper I.Archaeological Research Laboratory, Stockholm University, Stockholm.
Lidén, K., Eriksson, G., Nordqvist, B., Götherström, A., Bendixen, E., 2004. ‘‘The wetand the wild followed by the dry and the tame’’ – or did they occur at the sametime? Diet in Mesolithic–Neolithic southern Sweden. Antiquity 78, 23–33.
Lindahl, A., Gejvall, N.-G., 1950. Hällkistan vid Svemb i Ödeshögs socken. In:Cnattingius, B. (Ed.), Östergötlands och Linköpings stads museum meddelanden1948–1950. Östergötlands och Linköpings stads museum. Linköping, pp. 51–67.
Reid, D.J., Beynon, A.D., Ramirez Rozzi, F.V., 1998. Histological reconstruction ofdental development in four individuals from a medieval site in Picardie, France.Journal of Human Evolution 35, 463–477.
Roumelis, N., 2002. Hällkistan i Dragby – reflektioner på social stratifiering undersenneolitikum utifrån dietanalys. Graduate thesis. The Archaeological ResearchLaboratory, Stockholm University, Stockholm.
Schoeninger, M.J., Moore, K., 1992. Bone stable isotope studies in archaeology.Journal of World Prehistory 6, 247–296.
Sealy, J.C., 2001. Body tissue chemistry and palaeodiet. In: Brothwell, D.R., Pollard,M.A. (Eds.), Handbook of Archaeological Sciences. John Wiley & Sons,Chichester, pp. 269–279.
Sealy, J., Armstrong, R., Schrire, C., 1995. Beyond lifetime averages: analysis ofdifferent calcified tissues from archaeological human skeletons. Antiquity 69,290–300.
n Stone Age Northern Europe. J. Anthropol. Archaeol. (2012), doi:10.1016/