Embed Size (px)
Citation preview
Dietary protein requirement for fingerling Channapunctatus (Bloch), based on growth, feed conversion,protein retention and biochemical composition
Seemab Zehra • Mukhtar A. Khan
Received: 4 December 2010 / Accepted: 8 August 2011 / Published online: 31 August 2011� Springer Science+Business Media B.V. 2011
Abstract An 8-week feeding trial was conducted in a flow-through system (1–1.5
L min-1) at 27�C to determine dietary protein requirement for Channa punctatus finger-
lings (4.58 ± 0.29 g) by feeding six isocaloric diets (18.39 kJ g-1, gross energy). Diets
containing graded levels of protein (300, 350, 400, 450, 500 and 550 g kg-1) were fed to
triplicate groups of fish to apparent satiation at 09:00 and 16:00 h. Maximum absolute
weight gain (AWG; 8.11 g fish-1), specific growth rate (SGR; 1.82%) and best feed
conversion ratio (FCR; 1.48) were recorded in fish fed diet containing 450 g kg-1 protein,
whereas protein efficiency ratio (PER; 1.52), protein retention efficiency (PRE; 25%),
energy retention efficiency (ERE; 78%) and RNA/DNA ratio (3.01) were maximum for the
group fed dietary protein at 400 g kg-1. Second-degree polynomial regression analysis of
AWG, SGR and FCR data against varying levels of dietary protein yielded optimum
dietary protein requirement of fingerling between 462.24 and 476.72 g kg-1, whereas the
regression analysis of PER, PRE, ERE and RNA/DNA ratio data showed a lower protein
requirement of 438.28–444.43 g kg-1 of the diet. Considering the PER, PRE, ERE and
RNA/DNA ratio as more reliable indicators, this protein requirement is recommended for
developing quality protein commercial feeds for C. punctatus fingerlings.
Keywords Growth � Protein requirement � RNA/DNA ratio � Channa punctatus
Introduction
Formulation of nutritionally balanced feed is important for successful aquaculture (Schulz
et al. 2007). Feed accounts for about 60% of the operational cost, largely due to the
incorporation of high percentage of protein needed for tissue growth, maintenance and
reproduction. There is an optimum requirement of dietary protein to supply adequate
amino acids for maximizing growth. Increase in dietary protein has often been associated
S. Zehra � M. A. Khan (&)Department of Zoology, Fish Nutrition Research Laboratory, Aligarh Muslim University,Aligarh 202 002, Indiae-mail: [email protected]
123
Aquacult Int (2012) 20:383–395DOI 10.1007/s10499-011-9470-8
with higher growth rate in many species. However, there is a protein level beyond which
further growth is not supported and may even decrease (Alam et al. 2008; Siddiqui and
Khan 2009). If too much protein is supplied in the diet, only part of it is used to make new
protein, and the remainder will be converted into energy, which results in increased feed
cost and increased ammonia nitrogen excretion. Therefore, from both economical and
environmental perspective, it is important that inclusion of the dietary protein should be
optimized (Siddiqui and Khan 2009). The utilization and levels of inclusion of protein in
feeds for carnivorous fish have been addressed by many authors (Alam et al. 2008;
Siddiqui and Khan 2009; Zhang et al. 2010; Kumar et al. 2010; Akpinar et al. 2011).
The RNA/DNA ratio reflects the nutritional condition of the fish (Park et al. 2008). It is
a reliable biochemical indicator of protein synthesis and thus growth (Mustafa 1977;
Bulow 1987; Abidi and Khan 2009). For this reason, in this study, changes in RNA/DNA
ratio in response to varying levels of dietary protein intake were determined.
Channa punctatus, commonly known as murrel, is an important, highly priced
(Rs 180 kg-1) freshwater food fish species. It is found to be distributed throughout the
Southeast Asian countries and is a natural inhabitant of stagnant muddy pond waters,
paddy fields, weedy derelict swamps, beels, canals and reservoirs (Chondor 1999). Its air-
breathing characteristics and general hardiness allow it to be cultured in areas that are not
suitable for the culture of Indian major carp and other carp species. It has great market
demand due to its good taste and high nutritional value. It is recommended in diet during
convalescence and, therefore, is a good candidate for intensive aquaculture (Marimuthu
et al. 2009). Yaakob and Ali (1992) also noted the importance of murrels for hastening the
healing of wounds and internal injuries due to the presence of certain fatty acids such as
prostaglandin and thromboxane. Hence, this species is gaining attention as a cultured
freshwater fish for medicinal purposes in the Asian market. Generally, semimoist feeds
containing 45% dietary protein are used by the farmer for this fish (Abdel-Hameid et al.
2011). The fish are often cultured in grow-out ponds at densities of 40–80 fish/m2 with
annual yields ranging from 7 to 156 tonnes ha-1 (Wee 1982). Although it is very popular
and highly demanded fish in India, the production of this fish is not organized due to the
lack of nutritionally balanced feed. Moreover, a steady decline in the wild population of
the species is also observed mainly due to overexploitation as well as loss and degradation
of natural breeding and feeding grounds. As such, IUCN has listed this species of murrels
in the low-risk near threatened category. Although little information on some aspects of
nutrition and culture of C. punctatus is available (Bhuiyan et al. 2006; Marimuthu et al.
2009; Jindal et al. 2010; Saikia and Das 2010; Abdel-Hameid et al. 2011), no information
is available on dietary protein requirement in relation to growth, RNA/DNA ratio and
protein retention of this fish. The present study was, therefore, aimed at determining the
dietary protein requirement for developing quality protein feeds to maximize growth, feed
conversion and protein retention for C. punctatus fingerlings.
Materials and methods
Preparation of experimental diets
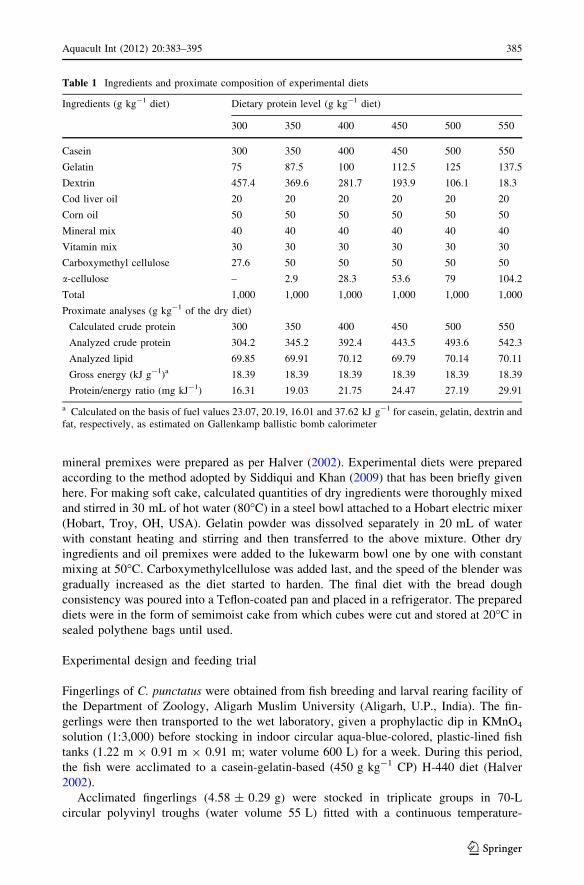
Six isoenergetic (18.39 kJ g-1, gross energy) casein-gelatin-based diets with different
levels of protein (300, 350, 400, 450, 500 and 550 g kg-1 of the diet) were prepared (Table 1).
A combination of corn oil and cod liver oil (5:2) was used as a source for lipid in the test
diets to provide the proper balance of n-3 and n-6 fatty acids (Halver 2002). Vitamin and
384 Aquacult Int (2012) 20:383–395
123
mineral premixes were prepared as per Halver (2002). Experimental diets were prepared
according to the method adopted by Siddiqui and Khan (2009) that has been briefly given
here. For making soft cake, calculated quantities of dry ingredients were thoroughly mixed
and stirred in 30 mL of hot water (80�C) in a steel bowl attached to a Hobart electric mixer
(Hobart, Troy, OH, USA). Gelatin powder was dissolved separately in 20 mL of water
with constant heating and stirring and then transferred to the above mixture. Other dry
ingredients and oil premixes were added to the lukewarm bowl one by one with constant
mixing at 50�C. Carboxymethylcellulose was added last, and the speed of the blender was
gradually increased as the diet started to harden. The final diet with the bread dough
consistency was poured into a Teflon-coated pan and placed in a refrigerator. The prepared
diets were in the form of semimoist cake from which cubes were cut and stored at 20�C in
sealed polythene bags until used.
Experimental design and feeding trial
Fingerlings of C. punctatus were obtained from fish breeding and larval rearing facility of
the Department of Zoology, Aligarh Muslim University (Aligarh, U.P., India). The fin-
gerlings were then transported to the wet laboratory, given a prophylactic dip in KMnO4
solution (1:3,000) before stocking in indoor circular aqua-blue-colored, plastic-lined fish
tanks (1.22 m 9 0.91 m 9 0.91 m; water volume 600 L) for a week. During this period,
the fish were acclimated to a casein-gelatin-based (450 g kg-1 CP) H-440 diet (Halver
2002).
Acclimated fingerlings (4.58 ± 0.29 g) were stocked in triplicate groups in 70-L
circular polyvinyl troughs (water volume 55 L) fitted with a continuous temperature-
Table 1 Ingredients and proximate composition of experimental diets
Ingredients (g kg-1 diet) Dietary protein level (g kg-1 diet)
300 350 400 450 500 550
Casein 300 350 400 450 500 550
Gelatin 75 87.5 100 112.5 125 137.5
Dextrin 457.4 369.6 281.7 193.9 106.1 18.3
Cod liver oil 20 20 20 20 20 20
Corn oil 50 50 50 50 50 50
Mineral mix 40 40 40 40 40 40
Vitamin mix 30 30 30 30 30 30
Carboxymethyl cellulose 27.6 50 50 50 50 50
a-cellulose – 2.9 28.3 53.6 79 104.2
Total 1,000 1,000 1,000 1,000 1,000 1,000
Proximate analyses (g kg-1 of the dry diet)
Calculated crude protein 300 350 400 450 500 550
Analyzed crude protein 304.2 345.2 392.4 443.5 493.6 542.3
Analyzed lipid 69.85 69.91 70.12 69.79 70.14 70.11
Gross energy (kJ g-1)a 18.39 18.39 18.39 18.39 18.39 18.39
Protein/energy ratio (mg kJ-1) 16.31 19.03 21.75 24.47 27.19 29.91
a Calculated on the basis of fuel values 23.07, 20.19, 16.01 and 37.62 kJ g-1 for casein, gelatin, dextrin andfat, respectively, as estimated on Gallenkamp ballistic bomb calorimeter
Aquacult Int (2012) 20:383–395 385
123
controlled water flow-through (1–1.5 L min-1) system at the rate of 15 fish per trough for
each dietary treatment level. Fish were fed test diets in the form of soft cake to apparent
satiation twice daily at 09:00 and 16:00 h. The total weight and number of the fish were
determined every week. Feeding was stopped at the sampling day. The feeding trial lasted
for 8 weeks. The fish were anaesthetized with 0.01% aqueous solution of tricaine methane
sulfonate (MS-222) before sampling. The effectiveness of the MS-222 dose was found to
be similar to be that reported by Mahajan and Agrawal (1979). Fecal matter was siphoned
before every feeding. Water quality parameters including water temperature, dissolved
oxygen, free carbon dioxide, pH, salinity and total alkalinity were monitored daily during
the feeding trial and were recorded following standard methods (APHA 1992). The
average water temperature, dissolved oxygen, free carbon dioxide, pH, salinity and total
alkalinity based on daily measurements were 26.5–27.3�C, 6.8–7.5, 5.8–9.3 mg L-1,
7.2–7.6, 0.21–0.24 ppt and 65.4–81.4 mg L-1, respectively.
Chemical analyses
Proximate composition of the experimental diets and initial and final carcass were deter-
mined using standard methods (AOAC 1995) for dry matter (oven drying at 105 ± 1�C for
22 h.), crude protein (Kjeltec TecatorTM
Technology 2300, Hoegenas, Sweden), crude fat
(solvent extraction with petroleum ether B.P 40–60�C for 2–4 h using Socs Plus, SCS 4,
Pelican equipments, Chennai, India) and ash (oven incineration at 650�C for 2 h using
muffle furnace, S.M. Scientific Instrument (p) ltd. Jindal Company, Delhi, India 2–4 h).
Gross energy was determined on a Gallenkamp Ballistic Bomb Calorimeter-CBB 330
010L (Gallenkamp, Loughbrough, UK). Six subsamples from a pooled sample of 20 fishes
were analyzed for initial body composition. At the end of the experiment, 10 fish from each
replicate of dietary treatments were pooled separately and six subsamples were analyzed
for final body composition.
Determination of RNA and DNA
RNA and DNA were determined by the method of Schneider (1957). Muscle samples
(100 mg mL-1, w/v) were homogenized for 5 min in 5% trichloroacetic acid (TCA) at
90�C and then centrifuged at 5,000 rpm for 20 min. For the estimation of RNA, 2.0 mL of
distilled water and 3.0 mL of orcinol reagent were added in 1.0 mL of supernatant. The
reaction mixture was kept in boiling water bath for 20 min. The greenish-blue color thus
developed was read at 660 nm in a spectrophotometer (Genesis 10-UV, Thermo Spec-
tronic, Madison, USA). For DNA determination, 1.0 mL of distilled water and 4.0 mL of
freshly prepared diphenylamine reagent were added to 1.0 mL of the supernatant. The
reaction mixture was kept on a boiling water bath for 10 min. The blue color developed
was measured at 600 nm. Standard curves for RNA and DNA were drawn using different
concentrations of yeast RNA and calf thymus DNA, respectively. The values were
expressed as lg 100 mg-1 fish muscle tissue on dry basis.
Statistical analyses
At the end of the experiment, the following parameters were determined:
Absolute weight gain (AWG, g fish-1) = Final body weight-Initial body weight
Protein efficiency ratio (PER) = Wet weight gain (g)/Protein fed (g)
386 Aquacult Int (2012) 20:383–395
123

Specific growth rate (SGR, %) = In final body weight-In initial body weight/No.
of days 9 100
Feed conversion ratio (FCR) = Dry feed fed (g)/Wet weight gain (g)
Protein retention efficiency (PRE, %) = Protein gain/Protein intake 9 100
Energy retention efficiency (ERE, %) = Energy gain/Energy intake 9 100
Survival rate (SR, %) = Final number of fish/Initial number of fish 9 100
All growth data were subjected to one-way analysis of variance (Snedecor and Cochran
1968; Sokal and Rohlf 1981). Differences among treatment means were determined by
Duncan’s multiple range test at a P \ 0.05 level of significance (Duncan 1955). All the
growth parameters were subjected to a second-degree polynomial regression
(Y = aX2?bX?c) analysis as described by Zeitoun et al. (1976). Data were analyzed
statistically using Origin (version 6.1; Origin Software, San Clemente, CA) and Matlab
(version 7.1; MATLAB Software, Natick, MA).
Results and discussion
Growth performance
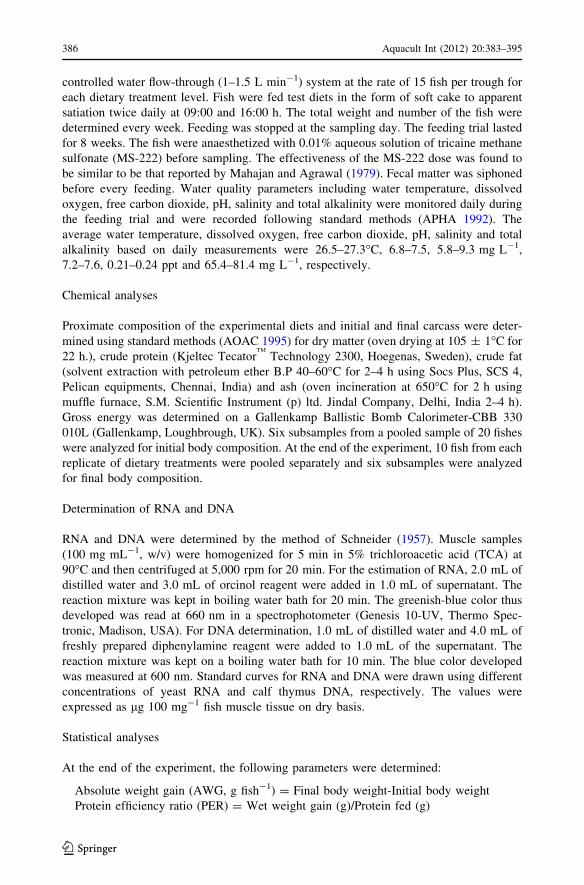
Growth performance of C. punctatus fingerlings in response to varying levels of dietary
protein is depicted in Table 2. The AWG, SGR and FCR improved significantly (P \ 0.05)
as dietary protein level increased from 300 to 450 g kg-1 of the diet. Maximum AWG
(8.11 g fish-1), SGR (1.82%) and best FCR (1.48) were obtained for the group fed dietary
protein at 450 g kg-1. Inclusion of dietary protein above this level (500 g kg-1) did not
produce any additional gain in weight or improvement in FCR. Moreover, a significant fall
in these parameters was recorded in fish fed dietary protein above 500 g kg-1. However, in
contrast to this, PER, PRE and ERE (Table 2) were maximum in the group fed dietary
protein at 400 g kg-1 (Table 2). No further improvement in these parameters was noted for
the groups fed dietary protein at 450 g kg-1. However, PER, PRE and ERE declined
significantly (P \ 0.05) with further increase in dietary protein levels at 500 and
550 g kg-1. The poorest AWG (4.38 g fish-1), SGR (1.21%), PER (1.02), PRE (13%),
ERE (35%) and FCR (3.27) were recorded in fish fed diet containing 300 g kg-1 protein.
Survival was not significantly affected by the varying levels of dietary protein and found to
range between 94 and 96% (Table 2).
Body composition
Data on body composition in response to varying levels of dietary protein are summarized in
Table 2 which indicates that body composition was significantly influenced (P \ 0.05) by the
protein levels in the diet. Body protein content increased significantly (P \ 0.05) with the
increased inclusion of dietary protein up to 400 g kg-1 and remained almost unchanged in
fish fed higher protein levels. Linear (P \ 0.05) increase in body fat was noticed with the
increase in dietary protein, whereas moisture content decreased significantly in contrast to the
body fat content. However, ash content was not significantly affected by the treatment levels.
RNA/DNA ratio
Nucleic acid indices were significantly influenced (P \ 0.05) by the levels of dietary
protein. Muscle DNA concentration was found to decrease significantly with the increase
Aquacult Int (2012) 20:383–395 387
123
Ta
ble
2G
row
th,
feed
con
ver
sio
n,
nu
trie
nt
rete
nti
on
and
bio
chem
ical
com
po
siti
on
of
fin
ger
lin
gC
.p
un
cta
tus
fed
die
tsw
ith
var
yin
gle
vel
so
fp
rote
in
Die
tary
pro
tein
lev
el(g
kg
-1
die
t)
Init
ial
30
03
50
40
04
50
50
05
50
Av
erag
ein
itia
lw
eig
ht
(g)
–4
.52
±0
.05
a4
.53
±0
.03
a4
.58
±0
.06
a4
.58
±0
.02
a4
.49
±0
.04
a4
.51
±0
.03
a
Av
erag
efi
nal
wei
ght
(g)
–8
.90
±0
.07
f1
0.3
7±
0.1
2e
12
.35
±0
.09
b1
2.6
9±
0.1
1a
12
.12
±0
.13
c1
1.5
3±
0.1
4d
Ab
solu
tew
eig
ht
gai
n(g
fish
-1)
–4
.38
±0
.02
f5
.84
±0
.04
e7
.77
±0
.08
b8
.11
±0
.06
a7
.63
±0
.03
c7
.02
±0
.02
d
Sp
ecifi
cg
row
thra
te(%
)–
1.2
1±
0.0
4e
1.4
8±
0.0
6d
1.7
7±
0.0
2b
1.8
2±
0.0
5a
1.7
7±
0.0
3b
1.6
8±
0.0
4c
Fee
dco
nv
ersi
on
rati
o–
3.2
7±
0.0
6a
2.1
2±
0.0
2b
1.6
5±
0.0
3c
1.4
8±
0.0
2e
1.4
9±
0.0
1e
1.5
8±
0.0
2d
Pro
tein
effi
cien
cyra
tio
–1
.02
±0
.02
d1
.35
±0
.03
b1
.52
±0
.02
a1
.50
±0
.02
a1
.34
±0
.01
b1
.20
±0
.01
c
Pro
tein
rete
nti
on
effi
cien
cy(%
)–
13.0
1±
0.2
1f
20
.03
±0
.17
d2
5.1
4±
0.2
7a
24
.11
±0
.19
b2
1.0
4±
0.2
3c
18
.03
±0
.21
e
Ener
gy
rete
nti
on
effi
cien
cy(%
)–
34.9
9±
0.3
5d
59
.03
±0
.41
c7
8.1
5±
0.6
1a
77
.13
±0
.64
a6
6.0
5±
0.5
7b
57
.91
±0
.51
c
Su
rviv
al(%
)–
94
±0
.86
a9
6±
0.9
1a
94
±0
.84
a9
6±
0.8
7a
95
±0
.81
a9
6±
0.9
3a
Mo
istu
re(%
)7
6.7
1±
0.4
17
6.8
4±
0.5
1a
75
.53
±0
.47
b7
4.4
8±
0.4
9c
73
.09
±0
.45
d7
2.1
5±
0.4
4e
71
.26
±0
.46
f
Pro
tein
(%)
12
.53
±0
.18
12
.68
±0
.07
d1
3.7
4±
0.1
7c
15
.17
±0
.27
a1
4.9
1±
0.1
5ab
14
.66
±0
.19
b1
4.5
7±
0.1
8b
Fat
(%)
3.6
8±
0.0
83
.41
±0
.04
e3
.92
±0
.06
d4
.57
±0
.03
c4
.83
±0
.07
c5
.62
±0
.05
b5
.98
±0
.04
a
Ash
(%)
3.2
1±
0.0
43
.19
±0
.02
a3
.23
±0
.06
a3
.21
±0
.02
a3
.25
±0
.02
a3
.24
±0
.01
a3
.22
±0
.03
a
RN
A(l
g1
00
mg
-1
dry
wei
ght
bas
is)
–7
84
±4
.02
d8
56
±4
.16
d9
87
±4
.1a
97
2±
3.1
2a
95
2±
3.8
b9
15
±4
.3c
DN
A(l
g1
00
mg
-1
dry
wei
gh
tb
asis
)–
46
8±
2.1
4a
39
5±
2.6
b3
28
±3
.5d
32
6±
2.6
2d
36
5±
2.8
3c
39
2±
3.5
b
RN
A/D
NA
rati
o–
1.6
8±
0.0
2e
2.1
7±
0.0
3d
3.0
1±
0.0
4a
2.9
8±
0.0
5a
2.6
1±
0.0
2b
2.3
3±
0.0
2c
Mea
nval
ues
of
3re
pli
cate
s±S
EM
;M
ean
val
ues
shar
ing
the
sam
esu
per
scri
pts
inth
esa
me
row
are
insi
gnifi
can
tly
dif
fere
nt
(P[
0.0
5)
388 Aquacult Int (2012) 20:383–395
123
in dietary protein up to 400 g kg-1 and remained almost insignificantly different for the
group fed dietary protein at 450 g kg-1 and then increased in 500 and 550 g kg-1 treat-
ments (Table 2). The muscle RNA concentration and RNA/DNA ratio were found to
increase significantly (P \ 0.05) in fish fed dietary protein up to 400 g kg-1. No signifi-
cant improvement (P [ 0.05) was found in muscle RNA concentration and RNA/DNA
ratio in fish fed 450 g protein kg-1 diet. A significant fall in muscle RNA concentration
and RNA/DNA ratio was recorded for the groups fed at surplus levels of dietary protein
(500–550 g kg-1).
To obtain more precise information on dietary protein requirement for the C. punctatusfingerlings, the growth parameters and RNA/DNA ratio were subjected to second-degree
polynomial regression analysis. Second-degree polynomial regression analysis of AWG
(Y) to dietary protein levels (X) yielded maximum AWG at a dietary protein level of
462.24 g kg-1. The relationship being;
Y ¼ �0:000143X2 þ 0:1322X � 22:55 R2 ¼ 0:970� �
The SGR% data (Y) when regressed against the dietary protein levels (X) yielded the
highest SGR% at a dietary protein level of 466.33 g kg-1. The relationship being;
Y ¼ �0:00002257X2 þ 0:02105X � 3:08486 R2 ¼ 0:983� �
When FCR data (Y) were regressed against dietary protein levels (X), best FCR was
obtained at a dietary protein level of 476.72 g kg-1. The relationship being;
Y ¼ 0:000058X2 � 0:0553X þ 14:54 R2 ¼ 0:973� �
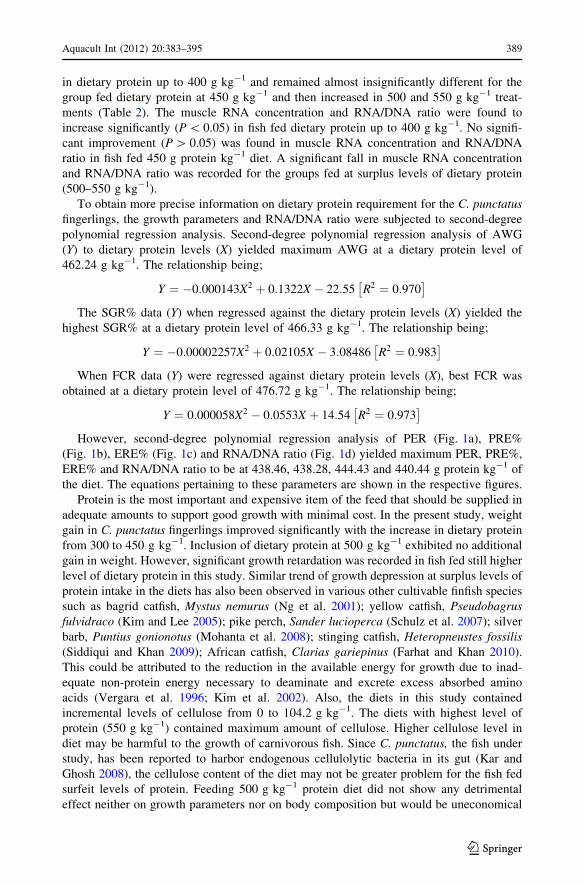
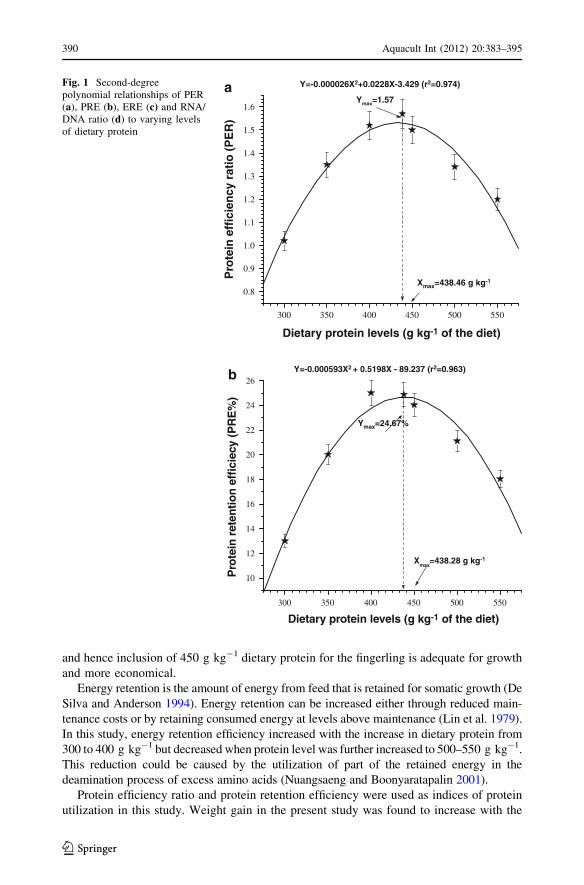
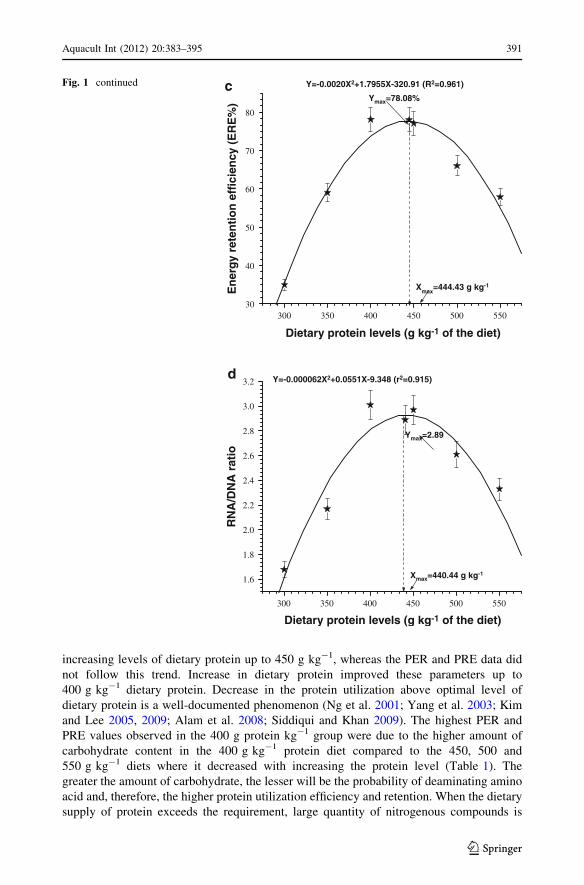
However, second-degree polynomial regression analysis of PER (Fig. 1a), PRE%
(Fig. 1b), ERE% (Fig. 1c) and RNA/DNA ratio (Fig. 1d) yielded maximum PER, PRE%,
ERE% and RNA/DNA ratio to be at 438.46, 438.28, 444.43 and 440.44 g protein kg-1 of
the diet. The equations pertaining to these parameters are shown in the respective figures.
Protein is the most important and expensive item of the feed that should be supplied in
adequate amounts to support good growth with minimal cost. In the present study, weight
gain in C. punctatus fingerlings improved significantly with the increase in dietary protein
from 300 to 450 g kg-1. Inclusion of dietary protein at 500 g kg-1 exhibited no additional
gain in weight. However, significant growth retardation was recorded in fish fed still higher
level of dietary protein in this study. Similar trend of growth depression at surplus levels of
protein intake in the diets has also been observed in various other cultivable finfish species
such as bagrid catfish, Mystus nemurus (Ng et al. 2001); yellow catfish, Pseudobagrusfulvidraco (Kim and Lee 2005); pike perch, Sander lucioperca (Schulz et al. 2007); silver
barb, Puntius gonionotus (Mohanta et al. 2008); stinging catfish, Heteropneustes fossilis(Siddiqui and Khan 2009); African catfish, Clarias gariepinus (Farhat and Khan 2010).
This could be attributed to the reduction in the available energy for growth due to inad-
equate non-protein energy necessary to deaminate and excrete excess absorbed amino
acids (Vergara et al. 1996; Kim et al. 2002). Also, the diets in this study contained
incremental levels of cellulose from 0 to 104.2 g kg-1. The diets with highest level of
protein (550 g kg-1) contained maximum amount of cellulose. Higher cellulose level in
diet may be harmful to the growth of carnivorous fish. Since C. punctatus, the fish under
study, has been reported to harbor endogenous cellulolytic bacteria in its gut (Kar and
Ghosh 2008), the cellulose content of the diet may not be greater problem for the fish fed
surfeit levels of protein. Feeding 500 g kg-1 protein diet did not show any detrimental
effect neither on growth parameters nor on body composition but would be uneconomical
Aquacult Int (2012) 20:383–395 389
123
and hence inclusion of 450 g kg-1 dietary protein for the fingerling is adequate for growth
and more economical.
Energy retention is the amount of energy from feed that is retained for somatic growth (De
Silva and Anderson 1994). Energy retention can be increased either through reduced main-
tenance costs or by retaining consumed energy at levels above maintenance (Lin et al. 1979).
In this study, energy retention efficiency increased with the increase in dietary protein from
300 to 400 g kg-1 but decreased when protein level was further increased to 500–550 g kg-1.
This reduction could be caused by the utilization of part of the retained energy in the
deamination process of excess amino acids (Nuangsaeng and Boonyaratapalin 2001).
Protein efficiency ratio and protein retention efficiency were used as indices of protein
utilization in this study. Weight gain in the present study was found to increase with the
300 350 400 450 500 550
0.8
0.9
1.0
1.1
1.2
1.3
1.4
1.5
1.6
aYmax=1.57
Xmax=438.46 g kg-1
Y=-0.000026X2+0.0228X-3.429 (r2=0.974)
Pro
tein
eff
icie
ncy
rat
io (
PE
R)
Dietary protein levels (g kg-1 of the diet)
300 350 400 450 500 550
10
12
14
16
18
20
22
24
26
Pro
tein
ret
enti
on
eff
icie
cy (
PR
E%
)
Dietary protein levels (g kg-1 of the diet)
Xmax
=438.28 g kg-1
Y=-0.000593X2 + 0.5198X - 89.237 (r2=0.963)
Ymax=24.67%
b
Fig. 1 Second-degreepolynomial relationships of PER(a), PRE (b), ERE (c) and RNA/DNA ratio (d) to varying levelsof dietary protein
390 Aquacult Int (2012) 20:383–395
123
increasing levels of dietary protein up to 450 g kg-1, whereas the PER and PRE data did
not follow this trend. Increase in dietary protein improved these parameters up to
400 g kg-1 dietary protein. Decrease in the protein utilization above optimal level of
dietary protein is a well-documented phenomenon (Ng et al. 2001; Yang et al. 2003; Kim
and Lee 2005, 2009; Alam et al. 2008; Siddiqui and Khan 2009). The highest PER and
PRE values observed in the 400 g protein kg-1 group were due to the higher amount of
carbohydrate content in the 400 g kg-1 protein diet compared to the 450, 500 and
550 g kg-1 diets where it decreased with increasing the protein level (Table 1). The
greater the amount of carbohydrate, the lesser will be the probability of deaminating amino
acid and, therefore, the higher protein utilization efficiency and retention. When the dietary
supply of protein exceeds the requirement, large quantity of nitrogenous compounds is
300 350 400 450 500 55030
40
50
60
70
80
En
erg
y re
ten
tio
n e
ffic
ien
cy (
ER
E%
)
Dietary protein levels (g kg-1 of the diet)
Ymax=78.08%
Xmax
=444.43 g kg-1
Y=-0.0020X2+1.7955X-320.91 (R2=0.961)
300 350 400 450 500 550
1.6
1.8
2.0
2.2
2.4
2.6
2.8
3.0
3.2
RN
A/D
NA
rat
io
Dietary protein levels (g kg-1 of the diet)
Xmax=440.44 g kg-1
Y=-0.000062X2+0.0551X-9.348 (r2=0.915)
Ymax=2.89
c
d
Fig. 1 continued
Aquacult Int (2012) 20:383–395 391
123
used for gluconeogenesis resulting to an increased catabolism of dietary protein for energy
purposes (Fagbenro and Akegbejo-Samsons 2000). Since the diets were formulated to be
isocaloric, the quantity of dextrin as energy source decreased with the increase in protein in
the diet (Table 1). Diet containing 400 g protein kg-1 and 18.39 kJ g-1 energy with a
protein/energy ratio of 21.75 mg kJ-1 satisfied the protein and energy requirements for
C. punctatus fingerlings and resulting in maximum PER and PRE.
Based on the second-degree polynomial regression analysis of protein efficiency ratio,
protein retention, energy retention and RNA/DNA ratio, the dietary protein requirement for
the fingerlings was found to range between 438.28 and 444.43 g kg-1 of the diet which is
higher than the requirement reported for other carnivorous fish species like Indian catfish,
H. fossilis 400–430 g kg-1 (Siddiqui and Khan 2009), Malaysian catfish, M. nemurus420 g kg-1 (Khan et al. 1993) but lower than the requirement for striped murrel, C. striatus550 g kg-1 (Kumar et al. 2010) and comparable to the requirement reported for bagrid
catfish M. nemurus 440 g kg-1 (Ng et al. 2001) and African catfish, C. gariepinus430–460 g kg-1 (Farhat and Khan 2010). The differences among the dietary protein
requirements may be due to the differences in fish sizes and species (Luo et al. 2004),
experimental conditions (Kim and Lee 2009), diet formulations, methodology and
assessment criteria (Yuan et al. 2010).
Body composition traits mainly the protein and lipid contents are of particular interest in
nutritional studies due to their association with product quality. Therefore, they serve as
important indicators for the requirement of an essential nutrient under question. From a
metabolic point of view, data suggest that feeding dietary protein above optimum level
(400 g kg-1) could not be used for body protein synthesis or tissue building. Body protein
content of the fish tended to increase significantly with the increased inclusion of dietary
protein up to 400 g kg-1 beyond which it remained almost unchanged indicating that
higher levels of dietary protein yielded no particular benefit in improving the carcass
quality of the fish. Additionally, fish fed higher levels of dietary protein (500 and
550 g kg-1) exhibited significantly higher body fat content which has also affected the
carcass quality as increase in body fat is not desirable. The high body fat observed in diets
containing protein above the optimum level is probably caused by the deamination of the
excess protein, thus the remaining carbon skeletons are used to produce fat. Similar trend
was also recorded in yellow puffer, Takifugu obscyrus (Bai et al. 1999), black Sea Bass,
Centropristis striata (Alam et al. 2008), and Indian catfish, H. fossilis (Siddiqui and Khan
2009). From these data on body composition, we further concluded that diet containing
400 g kg-1 protein is optimum for improving the growth performance, carcass quality and
maximizing the protein retention in fingerling C. punctatus.
The highest RNA concentration and RNA/DNA ratio at 400 g kg-1 dietary protein
indicate that the fish were able to synthesize more RNA than other treatments. Mohanta
et al. (2008) reported similar trend for silver barb, P. gonionotus, up to 300 g kg-1 protein.
The decrease in RNA concentration and RNA/DNA ratio in fish fed dietary protein at 500
and 550 g kg-1 points to the fact that there are limits for the amount of dietary protein
intake that fish can convert to its body material (Love 1980). In this study, a significant
reduction in DNA concentration of fish muscles was also noticed with the increase in
dietary protein up to 400 g kg-1. Further increase in dietary protein (450 g kg-1) did not
show significant differences in the DNA concentration. However, further inclusion of
dietary protein at 500 and 550 g kg-1 showed slight increment in DNA concentration.
Since DNA carries the genetic material in each cell and is present in the nucleus in fixed
quantities (Love 1980), it is considered an index of cell numbers contributing to unit
weight of tissue. In fish losing weight, the size of cells decreases and thus number of cells
392 Aquacult Int (2012) 20:383–395
123
contributing to unit weight of tissue increases, enhancing the number of nuclei and con-
tributing to increased DNA content. In a weight-gaining fish, on the other hand, the DNA
content becomes diluted with larger volume of cells per unit weight (Khan and Jafri 1991).
Similar microscopic observations related to increase in cell size were also observed in fish
under study.
Based on the second-degree polynomial regression analysis of PER, PRE, ERE
and RNA/DNA ratio data, it appears that the optimum dietary protein requirement for
C. punctatus fingerlings is 438.28–444.43 g kg-1 with a protein/energy ratio of
23.83–24.17 mg kJ-1. Results of this study would be useful in developing protein-bal-
anced cost-effective commercial feeds for the intensive culture of C. punctatus fingerlings.
Channa punctatus is very popular and highly demanded fish in most of the tropical
countries including India. Information on most of its essential nutrient requirements are not
available which is a bottleneck in developing nutritionally balanced feeds for its intensive
culture. Therefore, further studies are required to generate data on nutrient requirements of
this fish, so that nutritionally balanced feeds could be developed to commercialize the
production of C. punctatus.
Acknowledgments The authors are grateful to the Chairman, Department of Zoology, Aligarh MuslimUniversity, Aligarh, India, for providing necessary laboratory facilities and also to Prof. John E. Halver forsupporting the Fish Nutrition Research Programme at this laboratory. We also gratefully acknowledge thefinancial assistance of University Grant Commissions awarded to one of us (Seemab Zehra) and generousfunding received under DST-FIST Programme, New Delhi, in the priority area of Fish Nutrition.
References
Abdel-Hameid NA, Abidi SF, Khan MA (2011) Dietary vitamin E requirement for maximizing the growth,conversion efficiency, biochemical composition and haematological status of fingerling Channapunctatus. Aquac Res doi:10.1111/j.1365-2109.2011.02819.x
Abidi SF, Khan MA (2009) Dietary arginine requirement of fingerling Indian major carp, Labeo rohita(Hamilton) based on growth, nutrient retention efficiencies, RNA/DNA ratio and body composition.J Appl Ichthyol 25:707–714
Akpinar Z, Sevgili H, Ozgen T, Demir A, Emre Y (2011) Dietary protein requirement of juvenile shi drum,Umbrina cirrosa (L). Aquac Nutr. doi:10.1111/j.1365-2109.2011.02845.x
Alam MS, Watanabe WO, Carroll PM (2008) Dietary protein requirements of Juvenile Black Sea Bass,Centropristis striata. J World Aquac Soc 39:656–663
AOAC (1995) Official methods of analysis of the association of official analytical chemists. In: Cunniff P(ed) Association of official analytical chemists, 16th edn. Arlington
APHA (1992) Standard methods for the examination of water and waste water, 18th edn. American PublicHealth Association, Washington, DC
Bai SC, Wang XJ, Cho ES (1999) Optimum dietary protein level for maximum growth of juvenile yellowpuffers. Fish Sci 65:380–383
Bhuiyan AS, Afroz S, Zaman T (2006) Food and feeding habit of the juvenile and adult snake head, Channapunctatus (Bloch). Life Earth Sci 1:53–54
Bulow FJ (1987) RNA-DNA ratio as indicators of growth in fish: a review. In: Summerfelt RC, Hall GE(eds) The age and growth of fish. Iowa State University Press, Ames, pp 45–64
Chondor SL (1999) Biology of finfish and shellfish. SCSC Publishers, HowrahDe Silva SS, Anderson TA (1994) Fish nutrition in aquaculture. Chapman and Hall, New York, p 319Duncan DB (1955) Multiple range and multiple ‘F’ tests. Biometrics 11:1–42Fagbenro O, Akegbejo-Samsons Y (2000) Optimum protein requirements of diets formulated for economic
growth of Heterotis niloticus (Cuvier 1829). J Fish Technol 2:20–29Farhat, Khan MA (2010) Effects of varying dietary protein levels on growth, feed conversion, nutrient
retention efficiencies and biochemical composition of fry African catfish, Clarias gariepinus (Burc-hell). J Appl Aquac (Accepted)
Halver JE (2002) The vitamins. In: Halver JE, Hardy RW (eds) Fish nutrition, 3rd edn. Academic Press, SanDiego, pp 61–141
Aquacult Int (2012) 20:383–395 393
123
Jindal M, Yadava NK, Jain KL, Gupta RK (2010) Effect of two dietary protein levels on body weight andcomposition in Channa punctatus (Bloch) fingerlings. Turkish J Fish Aquat Sci 10:203–208
Kar N, Ghosh K (2008) Enzyme producing bacteria in the gastrointestinal tracts of Labeo rohita (Hamilton)and Channa punctatus (Bloch). Turkish J Fish Aquat Sci 8:115–120
Khan MA, Jafri AK (1991) Protein and nucleic acid concentrations in muscle of the catfish Clariasbatrachus at different dietary protein levels. Asian Fish Sci 4:75–84
Khan MS, Ang KJ, Ambak MA, Saad CR (1993) Optimum dietary protein requirement of a Malaysianfreshwater catfish, Mystus nemurus. Aquaculture 112:227–235
Kim LO, Lee SM (2005) Effects of dietary protein and lipid levels on growth and body composition ofbagrid catfish, Pseudobagrus fulvidraco. Aquaculture 243:323–329
Kim SS, Lee KJ (2009) Dietary protein requirement of juvenile tiger puffer, (Takifugu rubripes). Aqua-culture 287:219–222
Kim KW, Wang XJ, Bai SC (2002) Optimum dietary protein level for maximum growth of juvenile oliveflounder, Paralichthys olivaceus (Temminck et Schlegel). Aquac Res 33:673–679
Kumar D, Marimuthu K, Haniffa MA, Sethuramalingam TA (2010) Optimum dietary protein requirement ofstriped murrel Channa striatus fry. Malays J Sci 29:52–61
Lin PY, Romsos DR, Vander Tuig JG, Leveille GA (1979) Maintenance energy requirements, energyretention and heat production of young obese (ob/ob) and lean mice fed a high-fat or a high-carbo-hydrate diet1. J Nutr 109:1143–1153
Love RM (1980) The chemical biology of fishes, vol II. Academic Press, LondonLuo Z, Liu YJ, Mai KS, Tian LX, Liu DH, Tan XY (2004) Optimal dietary protein requirement of grouper
Epinephelus coioides juveniles fed isoenergetic diets in floating net cages. Aquac Nutr 10:247–252Mahajan CL, Agrawal NK (1979) Vitamin C deficiency in Channa punctatus Bloch. J Fish Biol 15:613–622Marimuthu K, Arokiaraj AJ, Haniffa MA (2009) Effect of diet quality on seed production of the spotted
snakehead Channa punctatus (Bloch). Int J Sustain Agric 1:6–9Mohanta KN, Mohanty SN, Jena JK, Sahu NP (2008) Protein requirement of silver barb, Puntius gonionotus
fingerlings. Aquac Nutr 14:143–152Mustafa S (1977) Influence of maturation on the concentrations of RNA and DNA in the flesh of the Catfish
Clarias batrachus. Trans Am Fish Soc 106:449–451Ng WK, Soon SC, Hashim R (2001) The dietary protein requirement of a bagrid catfish, Mystus nemurus
(Cuvier and Valenciennes), determined using semi purified diets of varying protein level. Aquac Nutr7:45–51
Nuangsaeng B, Boonyaratapalin M (2001) Protein requirement of juvenile soft-shelled turtle Trionyx sin-ensis Wiegmann. Aquac Res 32:106–111
Park SU, Lim HK, Han HS (2008) Changes in RNA/DNA ratio and growth of slime flounder, Microstomusachne, larvae until metamorphosis. J Appl Ichthyol 24:50–54
Saikia AK, Das DN (2010) Survival and growth of Channa punctatus (Bloch) under controlled condition incemented cistern. Sibcoltejo 5:78–81
Schneider WC (1957) Determination of nucleic acids in tissue by pantose analysis. In: Calowick SP, KaplonNO (eds) Methods of enzymology. Academic press, New York, p 680
Schulz C, Huber M, Ogunji J, Rennert B (2007) Effects of varying dietary protein to lipid ratios on growthperformance and body composition of juvenile pike perch (Sander lucioperca). Aquac Nutr 13:1–8
Siddiqui TQ, Khan MA (2009) Effects of dietary protein levels on growth, feed utilization, protein retentionefficiency and body composition of young Heteropneustes fossilis (Bloch). Fish Physiol Biochem35:479–488
Snedecor GW, Cochran WG (1968) Statistical methods, 6th edn. Iowa State University Press, AmesSokal RR, Rohlf FJ (1981) Biometry. W.H. Freeman and Company, New YorkVergara JM, Fernandez-Palacios H, Robaina L, Jauncey K, Higuera M, Izquierdo M (1996) The effects of
varying dietary protein level on the growth, feed efficiency, protein utilization and body composition ofgilthead sea bream fry. Fish Sci 62:620–623
Wee KL (1982) The biology and culture of snakeheads. In: Muir JF, Roberts RJ (eds) Recent advances inaquaculture. Westview Press, Boulder, pp 180–211
Yaakob WAA, Ali AB (1992) Simple method for backyard production of snake head (Channa striata Bloch)fry. Naga 15:22–23
Yang SD, Lin TS, Liou CH, Peng HK (2003) Influence of dietary protein level on growth performance,carcass composition and liver lipid classes of juvenile Spinibarbus hollandi (Oshima). Aquac Res34:661–666
Yuan YC, Gong SY, Luo Z, Yang HJ, Zhang GB, Chu ZJ (2010) Effects of dietary protein to energy ratioson growth and body composition of juvenile Chinese sucker, Myxocyprinus asiaticus. Aquac Nutr16:205–212
394 Aquacult Int (2012) 20:383–395
123
Zeitoun IH, Ullrey DE, Magee WT, Gill JL, Bergen WG (1976) Quantifying nutrient requirements of fish.J Fish Res Board Can 33:167–172
Zhang J, Zhou F, Wang LL, Shao QJ, Xu A, Xu JZ (2010) Dietary protein requirement of juvenile black seabream, Sparus macrocephalus. J World Aquac Soc 41:151–164
Aquacult Int (2012) 20:383–395 395
123


![a n ultu s r i e e r h s nrou Fisheries and Aquaculture …...past by different workers [21-25], but no information related to the dietary protein requirement for the fingerling stage](https://img.pdfslide.net/doc/110x75/5e55c4e9d479d93fa1383423/a-n-ultu-s-r-i-e-e-r-h-s-nrou-fisheries-and-aquaculture-past-by-different-workers.jpg)