Embed Size (px)
Citation preview

Dietary Strategies to Reduce Nutrient Excretion from Cattle
Dr. Tim L. Stanton
Extension Feedlot Specialist
Dept. of Animal Sciences, CSU


Nutrient requirements
• NRC, 1984 1996– Give guidelines based on published research
• Levels of nutrients needed beyond guidelines

How do we manage nitrogen?

Nitrogen
• Protein requirements
• Impact of lowering dietary N

• Assumes all proteins are equal
• Important point: protein is nitrogen
• %N * 6.25, protein is ~16% N
• Does not account for bacterial needs
• It is the system that is used by the cattle feeding industry
Protein Requirements
Crude Protein system

NH3 + Carbon = Microbial Protein (BCP)
Feed proteinurea, corn protein
MP
DIPDIPUIP
RUMEN
SMALL INTESTINE
Metabolizable Protein system
BCP BCP
Protein Requirements (continued)
Click on the video to the right to play it

• DIP * TDN * microbe efficiency = BCP
• (degradable N and energy)
• Efficiency dependent on rumen pH, ~8 to 8.5 (optimal pH)
•Typical rumen pH is 5-6
• BCP*.64 to determine protein at S.I.
• UIP * .80 to estimate protein at S.I.
• BCP + UIP = MP (TAKE HOME MESSAGE)
Protein Requirements (continued)
Metabolizable Protein system

Protein Level
• How much urea (DIP) is being fed? 0.8-1.4% of DM usually about 1.0%
• How much escape protein (UIP)?– No consistent response to supplementing high
grain diets with escape protein, once DIP requirements are met
• Total CP varies from 12.5-13.5% in finishing diets
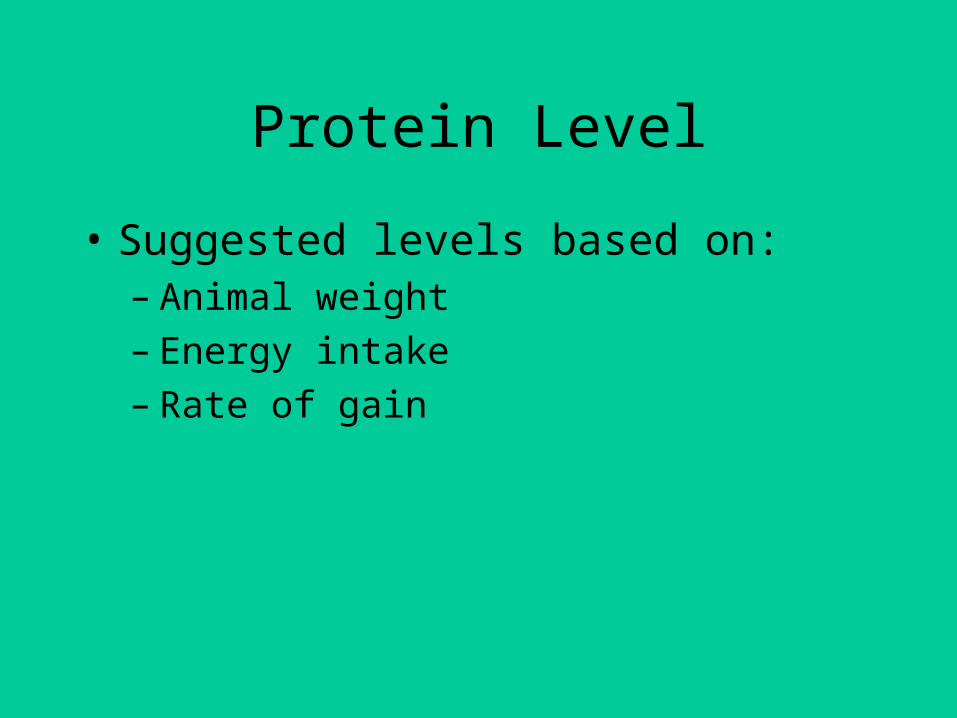
Protein Level
• Suggested levels based on:– Animal weight– Energy intake– Rate of gain

• All excess protein above requirements has no value.
• Excess protein is absorbed in the small intestine.
– Protein is deaminated in the liver (broken down).
– Urea is subsequently excreted in urine at the kidney.
Protein requirements
Theory for lowering protein

• Urea is rapidly converted to ammonia following deposition. Therefore,
– Feeding less protein leads to less urea excretion.
– Lower urea excretion should decrease ammonia.
Protein requirements (continued)

300
400
500
600
700
800
600 750 900 1050 1200Body Weight, lb
g/d MP reqt.
DIP reqt.
UIP reqt.
Predicted requirement over feeding period
Protein requirements (continued)

300
400
500
600
700
800
600 750 900 1050 1200Body Weight, lb
g/d MP reqt.
DIP reqt.
UIP reqt.
Requirement compared to industry average diets
Protein requirements (continued)

300
400
500
600
700
800
600 750 900 1050 1200Body Weight, lb
g/d MP reqt.
DIP reqt.
UIP reqt.
Change the diet to match these requirements, i.e. PHASE FEED
Protein requirements (continued)

Initial wt., lb 694 697 605 608
Final wt., lb 1242 1256 1264 1258
DM Intake, lb·d-1 25.2a 24.5b 20.3 20.7
ADG, lb·d-1 3.98 4.07 3.45 3.40
Feed efficiency .158a .166b .170a .164b
ITEM Con Phase Con Phase
yearlings calves
Performance Impacts
Source: Erickson and Klopfenstein, 2001

72.8 lbintake
7.9 lbanimal
64.9 lbexcreted
16.7 lb (26%)manure
2.1 lb (3%)runoff
Average diet N, 13.5% CPSummer-Yearlings
46.0 lb (71%)volatilized
N Mass Balance
Source: Erickson and Klopfenstein, 2001
Feedlot pen
Click on the video to the right to play it

PHASE-FEDSummer-Yearlings
N Mass Balance (continued)
Feedlot pen
59.4 lbintake
7.9 lbanimal
51.5 lbexcreted
18.7 lb (36%)manure
1.5 lb (3%)runoff
31.3 lb (61%)volatilized
Source: Erickson and Klopfenstein, 2001

N Mass Balance (continued)
59.4 lbintake
7.9 lbanimal
51.5 lbexcreted
18.7 lb (36%)manure
1.5 lb (3%)runoff
31.3 lb (61%)volatilized
REDUCED19 %
REDUCED32.5 %
Source: Erickson and Klopfenstein, 2001
Feedlot penPHASE-FEDSummer-Yearlings
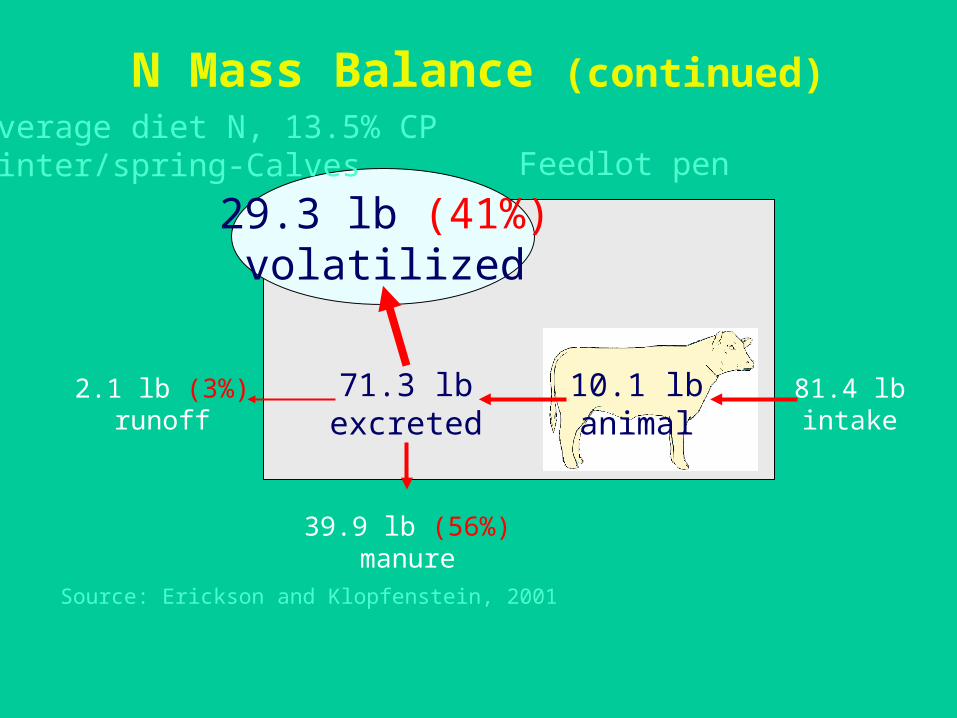
81.4 lbintake
10.1 lbanimal
71.3 lbexcreted
39.9 lb (56%)manure
2.1 lb (3%)runoff
29.3 lb (41%)volatilized
Average diet N, 13.5% CPWinter/spring-Calves
N Mass Balance (continued)
Source: Erickson and Klopfenstein, 2001
Feedlot pen
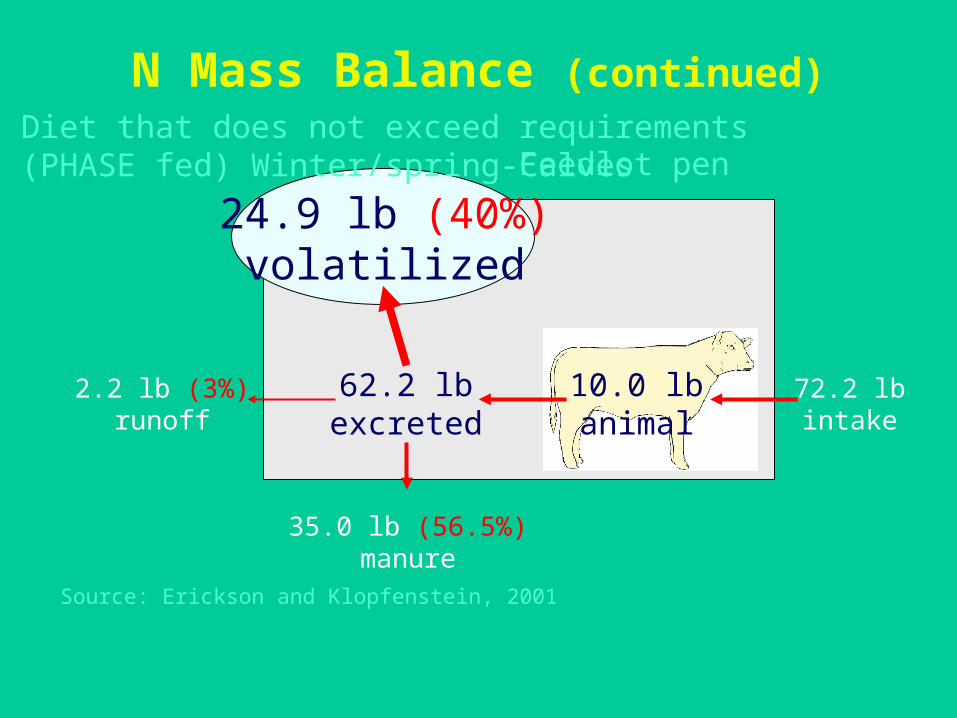
72.2 lbintake
10.0 lbanimal
62.2 lbexcreted
35.0 lb (56.5%)manure
2.2 lb (3%)runoff
24.9 lb (40%)volatilized
N Mass Balance (continued)
Source: Erickson and Klopfenstein, 2001
Feedlot penDiet that does not exceed requirements (PHASE fed) Winter/spring-Calves

72.2 lbintake
10.0 lbanimal
62.2 lbexcreted
35.0 lb (56.5%)manure
2.2 lb (3%)runoff
24.9 lb (40%)volatilized
N Mass Balance (continued)
REDUCED15 %
REDUCED12.5 %
REDUCED11.3 %
Source: Erickson and Klopfenstein, 2001
Feedlot penDiet that does not exceed requirements (PHASE fed) Winter/spring-Calves

• Overfeeding protein increases N losses
• Nutrition:
– may decrease N inputs by 10 to 20%
– reduces N excretion by 12 to 21%
– reduces N volatilization by 15 to 33%
N Balance Summary

• Volatilization is dependent on time of year
• Summer – 60% to 70% of N excreted
• Winter/spring – 40% of N excreted
• Based on annual occupancy, lose 50% of N excreted
N balance Summary(continued)

Phosphorus
• P metabolism
• P requirements
• Impact of lowering dietary P

Rumen
Diet P15-45 g/d
Saliva P~30-40 g/d
Serum (~1 g)
IntestineFecal P
Source: Wadsworth and Cohen, 1976
700-lb steer example
Meat & Organs~450 g P
Bone ~2000 g P
P metabolism
Click on the video to the right to play it

P intake
Ex.
AD
G
x
x
xx
x
x
x
xx
x xxx x
x
x
x
x
NRC predicts requirements from .22 to .32% of diet DM
P Requirements
0
0.1
0.2
0.3
0.4
0.5
0.6
0.7
85% corn 85% corn +supplement
byproduct byproduct +supplement
% d
iet
P (
DM
-ba
sis
)
supplementbyproductcornroughage
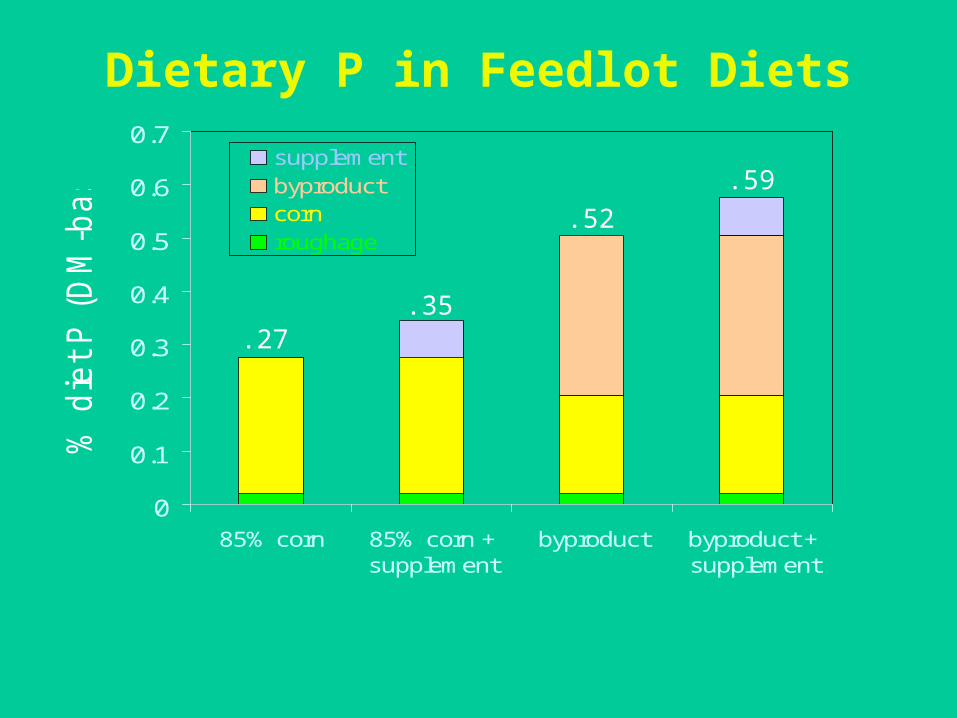
.27.35
.52
.59
Dietary P in Feedlot Diets

feed % of diet DM % P
Dry-rolled corn 34.5 .27
Brewers grits 22.5 .08
Corn bran 22.5 .10
Ground cobs 7.5 .04
Molasses 5.0 .08
Animal fat 3.0 ----
Supplement 5.0Note: NaH2PO4 provided in supplement at increments of .05% P
Base diet = .14% P, and .19, .24, .29, .34
P Requirementsyearlings
Source: Erickson et al., 1999

0
1
2
3
4
5
6
10 15 20 25 30 35 40P intake, g/d
AD
G, l
b/d
NRCrecommendation
IndustryAverage
P Requirements (continued)yearlings
Source: Erickson et al., 1999
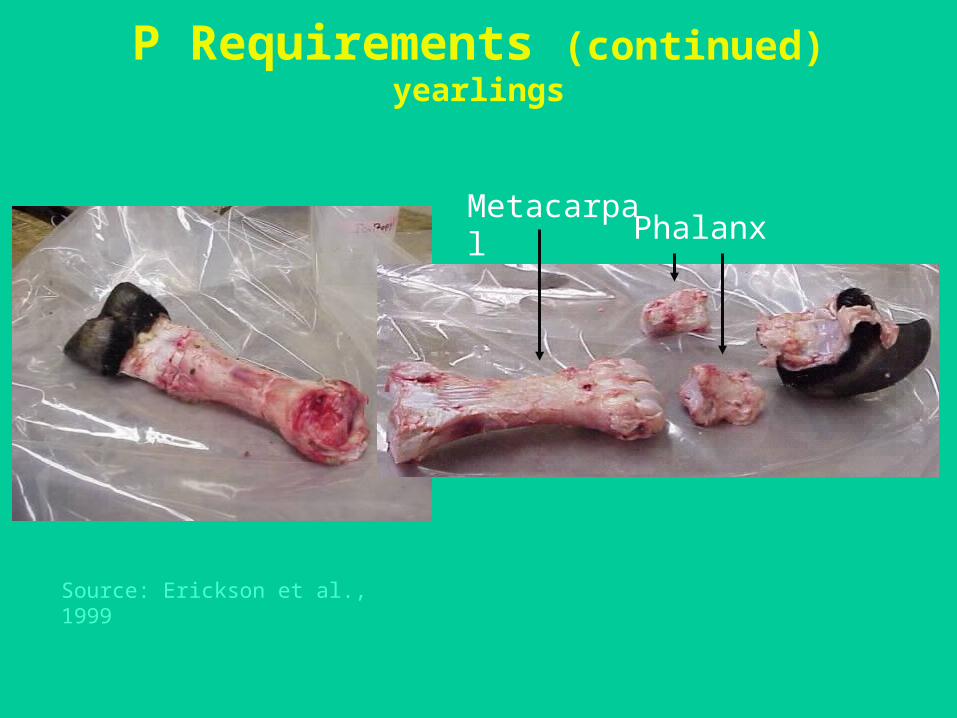
PhalanxMetacarpal
Source: Erickson et al., 1999
P Requirements (continued)yearlings

P Requirements (continued)calves
feed % of diet DM % P
High-moisture corn 33.5 .32
Brewers grits 30.0 .08
Corn bran 20.0 .08
Cottonseed hulls 7.5 .11
Animal fat 3.0 ----
Supplement 6.0 .09Note: NaH2PO4 provided as top-dress supplement at increments of .06% P
Base diet = .16% P, and .22, .28, .34, .40
Source: Erickson et al., 1999

0
1
2
3
4
5
6
7
8
10 15 20 25 30 35 40P intake, g/d
Par
amet
er i
n l
bs
ADG
F:G
P Requirements (continued)calves
NRCrecommendation
IndustryAverage
Source: Erickson et al., 1999

0
1
2
3
4
5
6
7
8
9
.16 .22 .28 .34 .40% P (diet DM)
Plasma P, mg/dLAverage d56-204
P Requirements (continued)calves
Source: Erickson et al., 2001

0
10
20
30
40
14.2 20.2 23.4 31.7 35.50
urinary P
fecal P
P intake, g/d
Tot
al P
exc
rete
d, g
/d
9.711.6
17.9
24.3
34.1
P Requirements (continued)calves
Source: Erickson et al., 2001

• Cannot determine P requirements, too low
– Bones, blood, performance
• Does the requirement matter?
• NRC recommendations for feedlot cattle are too high
• Industry has markedly overfed (relative to requirement)
– Progress has been made
• Implications: $ & environment
P Requirementssummary

Consequence of Lowering Diet P

Feedlot pen
7.2 lbintake
1.9 lbanimal
5.3 lbexcreted
Summer-Yearlings
12.8 lbintake
1.9 lbanimal
10.9 lbexcreted
.35 % P diet
.24 % P diet
REDUCED44 %
P Mass Balance (continued)
Source: Erickson et al., 2000

9.9 lbintake
2.4 lbanimal
7.5 lbexcreted
Winter/spring-Calves
15.0 lbintake
2.5 lbanimal
12.5 lbexcreted
P Mass Balance (continued)
Source: Erickson et al., 2000
REDUCED33 %
.40 % P diet
.26 % P diet
Feedlot pen

P Balance Conclusions• Overfeeding P leads to elevated
manure P
• Nutrition may:
– Decrease P inputs by 33 to 45%
– Reduce P excretion by 40 to 50%
– Directly reduce acres needed
Other Possibilities
• Phytase
• Low phytate corn
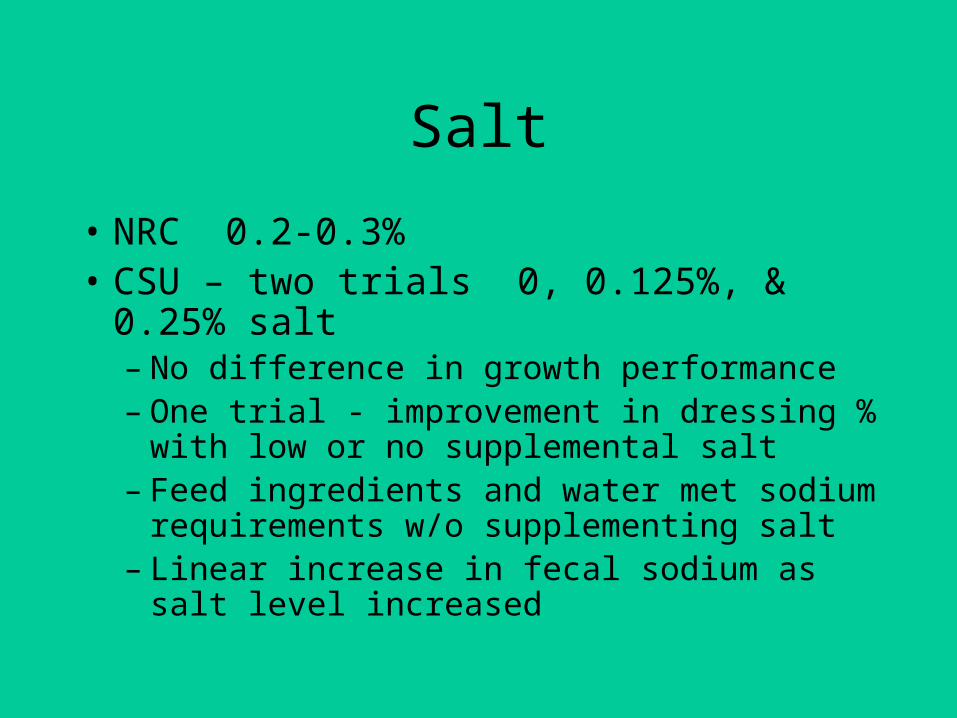
Salt
• NRC 0.2-0.3%• CSU – two trials 0, 0.125%, & 0.25% salt
– No difference in growth performance– One trial - improvement in dressing % with low
or no supplemental salt– Feed ingredients and water met sodium
requirements w/o supplementing salt– Linear increase in fecal sodium as salt level
increased

Potassium
• Contributes to soil salinity when manure is applied to farm ground
• NRC 0.5-0.7%
• CSU study 0.4, 0.6, 0.8% K with no supplemental salt– No difference in growth performance– Improvement in quality grade with lower K

Summary • Nutrition can have major impact on N and
P excretion for feedlot cattle
– Utilizing MP system may lower N excretion
– Decreased urinary N excretion does decrease N volatilization losses
– Volatilization is a concern

• Fine-tuning requirements on the MP system is needed
• Eventually, metabolizable amino acids will be useful similar to ideal protein concept in monogastrics
• Supplementation of P is unnecessary
• Difficult to reduce P level below corn baseline