Embed Size (px)
Citation preview
Dietary Support of Extended-Duration Bed Rest Studies
AM Inniss1, BL Rice2, SM Smith3
1General Clinical Research Center University of Texas Medical Branch at Galveston Galveston, TX 77555
2Enterprise Advisory Services, Inc. Houston, TX 77058
3Human Adaptation and Countermeasures Office NASA Lyndon B. Johnson Space Center Houston, TX 77058
Running head: Dietary Support
Word count for abstract: 188
Word count for narrative text: 3798
Number of references: 5
Number of tables: 1
Number of figures: 1
Sources of support: This project was supported by the National Aeronautics and Space
Administration Flight Analogs / Bed Rest Research Project.
Keywords: nutrition; food support; menu planning; bed rest
https://ntrs.nasa.gov/search.jsp?R=20060018323 2018-07-06T22:22:05+00:00Z
ABSTRACT
Dietary control and nutrient intake are critical aspects of any metabolic study, but this is especially
true in the case of bed rest studies. We sought to define nutrient requirements, develop menus,
and implement them in a series of three long-duration bed rest studies. With regard to energy
intake, the goal was to maintain subject body weight to within 3% of their body weight on day 3
of bed rest (after fluid shift had occurred). For other nutrients, intakes were based on the NASA
space flight nutritional requirements (with some adaptations based on the ground-based model
used here). A secondary goal was to develop menus with foods similar to those expected to be
approved for space flight (however, this was relaxed to attain desired nutrient intakes). This
paper also describes the role of the research dietitian as part of the multi-disciplinary team and the
importance of the metabolic kitchen staff. It also provides insight into some of the dietary
challenges that arise during extended-duration bed rest studies. Regardless of the overall
objective of the study, nutrition must be carefully planned, implemented, and monitored for results
to be uncompromised.
INTRODUCTION
Bed rest is an analog for simulating the effects of weightlessness on physiological systems (5).
Nutrition and dietary support are critical for bed rest studies, and problems or issues can greatly
affect even the best-designed study. Subject selection and retention may be adversely affected by
the type and quantity of food. The fact that energy expenditure decreases during bed rest, and
thus maintenance of body mass requires reduction of food intake, must be taken into account
when controlling intake of specific nutrients. Although this is usually easy to accommodate, it can
affect a researcher’s ability to achieve constant total intake and a constant percent of the diet for
the nutrient. Preventing subject boredom with menu cycles can also prove to be a difficult task.
ROLE OF THE RESEARCH DIETITIAN AND SUPPORT STAFF
The research dietitian is a valuable member of the research team and contributes to the
success of the study. Before the study starts, the dietitian works with the investigator team(s) to
ensure that all dietary restrictions are met, develops the menus to meet the nutrient requirements,
purchases and manages food items for the metabolic kitchen, and works with the subject-
screening team to address and resolve any dietary issues, such as subject food allergies or
intolerances. Once the study starts, the dietitian interacts daily with the research subjects to
discuss dietary issues, monitors subjects’ weight, and ensures that subjects maintain maximum
dietary compliance. This continuous interaction fosters a sense of rapport with the subjects and
may be psychologically beneficial to them, and thus promote their continued participation in the
study. The dietitian also works closely with the nursing staff to communicate in a timely fashion
any issues that may involve the medical care of the subjects.
The research dietitian is also responsible for overseeing the metabolic kitchen staff in the
preparation of the meals, tracking caloric and nutrient intake for each subject via the nutrition
database, and performing analysis of nutrient intake data.
The metabolic kitchen staff is responsible for preparing the meals, encouraging 100%
compliance with the consumption of all meals, and ensuring that the subjects eat according to
schedule.
METHODS
Eleven healthy subjects (8 men, 3 women) participated in the project, which was conducted in
three studies (designated Study 1, 2, and 3). The subjects’ mean age (± SD) was 34.8 ± 9.3 y.
Average height of the study group was 169 ± 10 cm, and average weight was 73.6 ± 15.5 kg.
Subjects had to successfully pass various physical and psychiatric examinations to be included in
the study. As required by the NASA Bed Rest Standardization Protocol, subjects were excluded
from the study if they did not meet the minimum testing requirements recently had sub-standard
nutritional status, had gastro-esophageal reflux disease, had a history of diabetes, or took
medication that would interfere with the interpretation of results. All subjects were given written
and verbal explanation of testing and bed rest protocols, and signed documentation indicating
their understanding and consent. All protocols were reviewed and approved by the National
Aeronautics and Space Administration (NASA) Johnson Space Center and the University of
Texas Medical Branch at Galveston (UTMB) Institutional Review Boards. Bed rest was
conducted under medically supervised conditions at the General Clinical Research Center at
UTMB in Galveston, TX.
The ambulatory phase allowed subjects to become acclimated to the research environment and
to the research diet. During the bed rest phase of the study, subjects were placed at a 6° head-
down tilt. They were allowed to either elevate themselves on one elbow or turn over on their
stomachs to consume meals; otherwise they were restricted to the head-down position.
Nutrient Requirements
The study diet was designed to approximate the diet consumed by space shuttle astronauts
and consisted of standard foods. At baseline, its composition was 55% carbohydrates, 30% fat,
and 15% protein. Dietary constraints included no caffeine, cocoa, chocolate, tea, or herbal
beverages. Caloric requirements were individualized for each subject. The Harris-Benedict
Equation (1) for calculation of resting energy expenditure was used to estimate caloric intake:
Men: (kcal/d) = 66.47 + (13.75 x weight (kg)) + (5.00 x height (cm)) – (6.76 x age)
Women: (kcal/d) = 655.10 + (9.56 x weight (kg)) + (1.85 x height (cm)) – (4.68 x age)
Activity factors of 1.6 and 1.3 were used for ambulatory and bed rest phases, respectively. These
were based on data from previous bed rest studies. The primary goal of dietary support was for
subjects to maintain pre-bed rest body weight. To this end, caloric intake was adjusted as
necessary to maintain body weight, which was recorded daily using a bed scale. Subjects were
weighed each morning before they had breakfast. Dietary intervention to prevent weight loss
occurred if a subject’s body weight deviated by 3 or more percent from their weight on bed rest
day 3, when the initial fluid shift and any diuresis resulting from postural change should have been
completed. Caloric intake was manipulated by increasing carbohydrates and fat while keeping
protein constant.
The target intake of nutrients (Table I) was based on the NASA space flight nutritional
requirements, with some adaptations based on the ground-based model used here to make a set of
Flight Analogs / Bed Rest Research Project nutrient intake requirements (NASA bed rest
requirements). Calcium and phosphorus intake were targeted to be about 1400 mg/d. Sodium
was targeted to be 2 mmol/kg⋅d–1 and potassium, 1.2 mmol/kg⋅d–1. Target fluid intake was 28.5
ml/kg body weight. Filtered water was provided for drinking and used in food preparation. For
other nutrients, average intake was considered acceptable if it met 100-125% of NASA bed rest
requirements, with daily intake not less than 80% of the requirement.
All diets were composed, and actual dietary intakes were determined, using the Nutrition Data
System for Research (NDS-R) software, version 5.0_35, May, 2003, developed by the Nutrition
Coordinating Center, University of Minnesota, Minneapolis, MN (4).
Menu Development
A secondary goal of dietary support was to develop menus with foods similar to those
expected to be approved for space flight. However, constraints on food for space flight
sometimes conflicted with another secondary goal of providing subjects with a product that was
acceptable in variety, flavor, visual and aromatic appeal, texture, form, and shape, while at the
same time achieving an acceptable nutrient value range. The amount of fresh foods is quite
limited on a long-duration mission. Meat, fish, and poultry were provided to the bed rest subjects
and prepared in various ways throughout the menu cycle, and a variety of fruits and vegetables
were used. There was a shift from using frozen fruits in Studies 1 and 2 to using fresh fruits in
Study 3. A greater variety of fresh fruit was also added to the menu for Study 3. This single
change greatly improved the overall taste and visual appeal of the breakfast menus. The
availability of fresh fruit throughout the year was an important consideration when designing the
menu. The vegetables used during the studies were usually frozen because of the stability of
frozen vegetables and their availability at any time of year.
Nutrient content was another important factor in the selection of food items and recipes.
Certain drinks were chosen that were fortified with vitamins A, C, and E. Other juices, such as
orange juice, were chosen because they were fortified with calcium and vitamin D. Other food
items were selected because they were fortified with folic acid and vitamin D. Several ready-to-
eat and heat-and-serve food items were incorporated into the menus. These quick and easy food
items provided balance on days when extensive food preparation was required for other items.
Several recipes for mixed dishes were chosen, as they incorporated more foods, such as fish and
dairy products, that are high in calcium and vitamin D.
The sodium content of the food items was another important factor in composing menus and
developing recipes. Many of the pre-packaged food items include some form of sodium as a
preservative. Care was therefore taken to limit the amount of salt added to menu items. In
addition, minor changes were made to reduce the amount of sodium added throughout the
studies. In Studies 1 and 2, regular salt was used. In an attempt to achieve an acceptable sodium
intake range for Study 3, low-sodium salt was used in all recipes. Similarly, unsalted butter was
used instead of salted butter.
The subject population was also a major consideration in the planning of the menus. The
menus were devised to reflect the diversity of cultures and ethnicities in the subject population.
Subjects had a variety of taste preferences and food aversions, and care was taken to create a
menu cycle that would represent this diversity and accommodate all subjects. The meals were
designed to provide as much color and contrast as possible to make each dish look attractive to
the subjects. The menus included desserts such as cookies, pies, and ice cream.
Careful menu planning ensured that a particular food item was not served more than once in
the same day. The menus were placed in order by meal and by day. This allowed the dietitian to
see the layout of the menu cycle and to ensure that the same types of foods were not served at the
same meal on consecutive days. After the menu cycle was set, the nutrient analysis was done to
ensure that the nutrient requirements were met.
A 7-d menu cycle was implemented for the 60-d Study 1. For Studies 2 and 3 (90-d studies),
a 10-d menu cycle was provided to coincide with the greater number of bed rest days and ensure
that subjects did not receive the same meal on the same day of each week.
The menus were altered to accommodate certain study protocols. Tests that influenced the
menus included the oral glucose tolerance test, the glucose breath test, and the cardiovascular
test. Subjects were to avoid any gas-producing foods the night before they took the glucose
breath test. To ensure that the overall carbohydrate intake remained stable, 50 g of carbohydrate
was eliminated from the diet on the days that the dextrose was given. Similarly, the oral glucose
tolerance test required 75 g of glucose to be removed from the diet. Because both tests rarely fell
on the same menu cycle day, two additional variations of the original 10-d menu cycle were
created that reflected the changes in carbohydrate. This resulted in a total of three 10-d menu
cycles per subject. The cardiovascular test required subjects to consume a light meal of
predominantly complex carbohydrates before they participated in the test.
Subject Screening Process
Subject candidates were provided with sample menus before they met with the dietitian. They
were instructed to identify foods to which they had allergies and foods that they absolutely could
not tolerate throughout the study, by placing a check mark next to those foods on the menus.
Once the preference forms were completed, the information was forwarded to the dietitian
and reviewed. On the day of subject screening at the Flight Analogs Research Center at UTMB,
the dietitian visited each subject candidate to discuss food preferences and to get a better
understanding of why certain foods were eliminated. During this time, it was discussed at length
that the menus were standardized, but minor allowances would be made to accommodate subjects
with adverse reactions to certain foods. Subjects were informed that all meals would be prepared
in the metabolic kitchen, that they were expected to eat 100% of all meals, that no other food
items were allowed in the rooms, and that visitors were not allowed to enter subjects’ rooms with
food. Any questions or concerns that the subject candidate had at this time were addressed. The
dietary preference forms were then signed by the subject and the dietitian upon agreement that the
subject understood the dietary expectations. This dietary screening process was also discussed in
an orientation session entitled “A Day in the Life”. This session introduced prospective subjects
to the unit and allowed them to meet the nursing and dietary staff and ask questions about their
stay on the unit. This orientation session was included in the consent process and was conducted
by the nursing staff.
Kitchen Activity and Meal Serving Schedules
Menus prepared using NDS-R were converted into menu sheets using Microsoft Excel.
The sheets were updated daily to reflect dietary changes and then were forwarded to the dietary
staff. The updated sheets were placed in the appropriate subject’s binder. Each menu sheet was
labeled with the subject’s name , date, bed rest day, the meals that were being prepared for the
day, and the gram amount of each food item. Any discrepancies in the amount of foods
consumed by each subject were recorded at the end of each meal. All foods were weighed to ±
0.1 g using Mettler Toledo scales.
All subjects received the same meal each day, except for minor variations that reflected each
subject’s food preferences, or study protocol constraints as described earlier. Food portion sizes
were different for different subjects because of different estimated caloric intake requirements. To
ensure that each subject received the correct amount of each food item, each tray was labeled
with the subject’s name and dated. The date on the tray was the day that the meal was to be
consumed. Food items were prepared one day in advance, and a portion was weighed out for
each subject and placed in a separate container until the time for meal preparation. In order for
each food item to be correctly identified and placed on the correct tray before the tray was served,
each container was labeled with the name of the subject and the gram amount of the food item.
Foods to be served hot were prepared a day in advance, pre-portioned, and heated before they
were served. To ensure accuracy of measurements the weights of certain food items were
randomly checked throughout the day.
The timing of meal service varied from day to day according to testing schedules. Schedules
were checked a day in advance and noted on the diet board. The diet board was a bulletin board
in the metabolic kitchen where daily sheets for each subject were posted that contained the date,
the subject’s name and ID number, the subject’s room number, and the time each meal would be
served. On the day of testing, the meal schedule was checked again. In many cases, meal times
changed because tests were running behind schedule or a test had to be postponed or canceled.
The number of meals served for each study reflected the number of bed rest days for that
study. A total of 2,847 meals were served for all three studies: 756 meals for Study 1; 1,368
meals for Study 2; and 723 meals for Study 3.
RESULTS
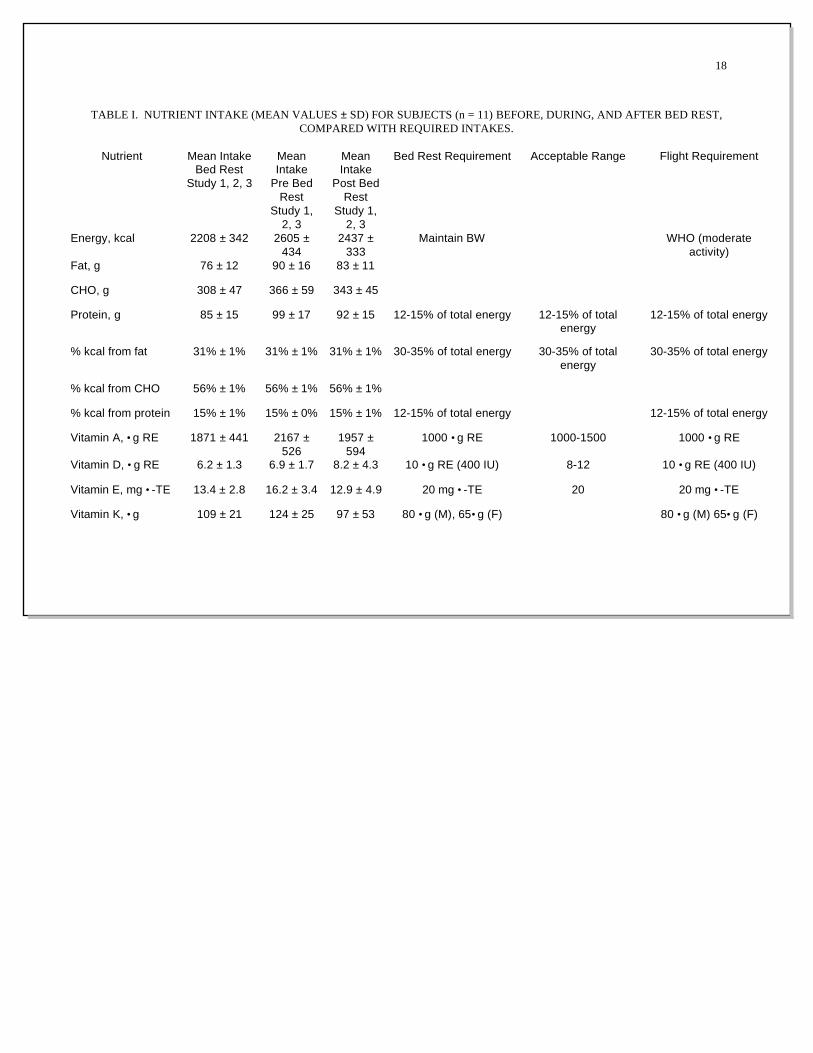
Nutrient intakes for ambulatory and bed rest phases are shown in Table I. The mean (± SD)
intake for subjects at bed rest was 2208 ± 342 calories, with carbohydrates composing 56%,
protein 15%, and fat 31% of the total (on average). Of the fat-soluble vitamins, the intake of
vitamins D and E was below required values for both ambulatory and bed rest states.
Menu Palatability
The dietitian visited subjects frequently to address dietary issues and to elicit feedback about
the quality of the meals. Subjects were asked which food items were the most and least
acceptable and were asked to provide additional comments about their experiences to the dietary
staff. Most of the subjects said the research diet was explained clearly to them and the overall
appearance of the meal trays was good. Several subjects thought the portion sizes were either too
large or too small. The subjects gave varied responses about the taste and acceptability of the
food.
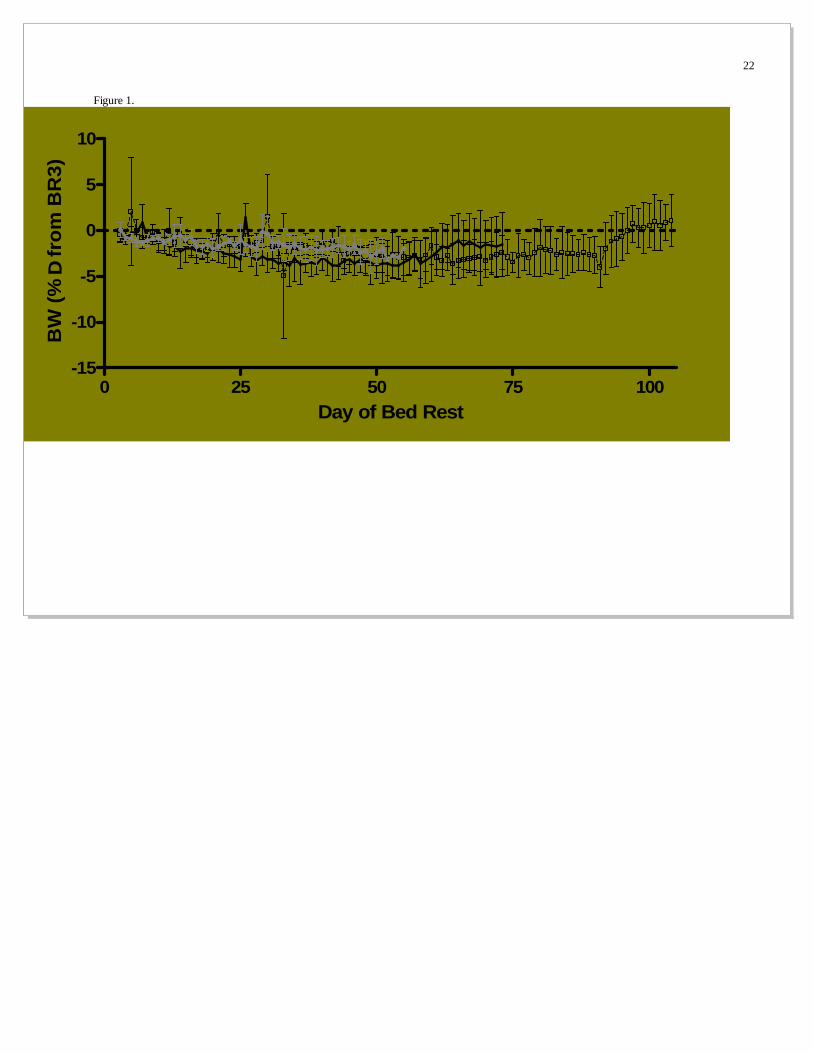
Body Weight
Sporadic spiking in subjects’ weights was noted. It was concluded that the spikes were a
result of measurement error, because several times spikes occurred for different subjects on the
same day. If an unusual weight was noted before a subject consumed breakfast, the subject was
re-weighed and the new weight recorded. If the subject had already consumed breakfast, the
recorded weight remained. Figure 1 shows the percent weight change throughout the study,
relative to bed rest day 3.
The greatest weight loss observed was –4.0 kg. This weight loss was due in part to the
subject not being able to consume 100% of meals because of medical issues throughout the study.
The subject was encouraged to consume as much of each meal as possible, and the amount of
food consumed during each episode of low consumption was documented. The greatest weight
gain observed was +2.3 kg. This occurred during the post-bed rest phase, when subjects were
once again provided with the ambulatory diet. This diet provided about 370 more calories per
day than the bed rest diet. The subject who gained 2.3 kg may have been more sensitive to the
consumption of an increased number of calories than the other subjects and thus had a greater
weight gain. In all, 8 out of 11 subjects experienced weight loss ranging from –0.2 kg to –4.0 kg.
The remaining three subjects each had a weight gain of +0.2 kg to +2.3 kg.
DISCUSSION
Dietary challenges during bed rest studies included weight loss, menu fatigue, food allergies
and intolerances, subjects not eating 100% of meals, and meeting the NASA bed rest
requirements.
Weight Loss
During the bed rest phase of the studies, weight loss was observed in 8 out of 11 subjects.
Dietary intervention was provided when a subject’s weight changed by 3% of day 3 of bed rest.
Calories were manipulated by increasing the amounts of carbohydrates and fats and keeping
protein constant. Because many food items contained multiple energy sources, vitamins, and
minerals, caloric manipulation of the diet became extremely challenging and time-consuming.
Menu Fatigue
A 7-d menu cycle was used for Study 1. The length of the bed rest phase for this study was
60 d. This allowed the subjects to predict which day of the week a certain menu would be served.
When the length of the bed rest phase was extended to 90 d in subsequent studies, it was decided
to add 3 additional menu days to provide less predictability. The menu cycle for Studies 2 and 3
was therefore increased to 10 d.
Food Allergies and Intolerances
During the screening process, subjects were asked to identify any foods to which they might
be allergic. They were also asked if they were lactose intolerant. Subjects usually indicated that
they were not allergic to, or were uncertain if they were allergic to food items listed. Thus, no
food allergies were usually documented and the menus were devised with no consideration of
them. As the study progressed, however, questions arose about whether a subject was allergic to
a particular food or to some ingredient in a food. Once an allergy or sensitivity was verified by a
physician, the food item was replaced with something comparable in calories and nutrients.
Subjects Not Eating 100% of Meals
During the study, a subject would sometimes notify the dietitian that he or she did not care for
a particular meal or food item. A general trend was noted that subjects who did not particularly
care for a food item at the beginning of the study would develop a food aversion at the middle or
toward the end of the study. The dietitian would remind the subject of the importance of eating
all meals. At times, the subject would refuse to eat 100% of the particular food item or would
strategically spread the food item over the plate as an indication that they had eaten all of it. In all
cases, if the food item could be weighed, the leftover amounts were recorded. If the dietitian
considered the amount to be significant, the food item would be portioned out and included with
the next meal. If at the end of the day a subject had not consumed 100% of a meal, it was
documented as a protocol deviation.
Meeting NASA Bed Rest Requirements
As the subjects transitioned from the ambulatory state to bed rest, their caloric requirements
decreased. The decreased caloric intake had a direct effect on the micronutrient content of the
diet. It was also evident that the smaller the size and body weight of the subject, the more
challenging it was to meet the NASA bed rest requirements for vitamins and minerals when
calories were further restricted. Having a larger body size and weight increased the likelihood
that a subject’s vitamin and mineral intakes would be within the required guidelines. The challenge
of meeting these dietary guidelines was compounded further when changes were made in the diet
to accommodate subjects’ preferences, food allergies, or other medical conditions.
Some researchers (2, 3) have thought it essential to order same-lot food items to eliminate
concerns about changes in nutrient intake and food availability throughout the duration of long-
term or crossover design studies. This is scientifically ideal, but it can greatly increase the budget
for the experiment.
Achieving the NASA bed rest requirements for vitamin D and calcium was a challenge
throughout the study. Calcium is found in a greater variety of foods than is vitamin D, and the
major dietary sources of both are fortified foods. Great care was taken to include foods that were
fortified with vitamin D or calcium, or both. Despite the addition of these foods, in most
instances, vitamin D intake was still lower than the NASA bed rest requirements.
A related issue concerns the use of multivitamins during bed rest studies. In Study 1,
multivitamins were provided to the subjects on orders from the attending physician. This is often
done for these types of studies where diet and nutrition are not part of the primary hypothesis, the
logic being that the supplement “ensures optimal vitamin status.” We chose not to continue this
policy in Studies 2 and 3, and to strive for the diet to meet nutrient requirements, much as is done
with the space food system. Although it may be possible to meet the vitamin D requirements in
bed rest, the difficulties in accomplishing this goal highlight the general question of what is more
important: should priority be given to the presentation, variety, and palatability of the meals, or to
achieving the NASA bed rest requirements for the various nutrients? Is it possible to satisfy both
requirements? This will continue to be a challenge in future studies.
As has been described in this paper, diet and nutrition are critical elements of bed rest studies.
There are many facets to these, and a great deal of attention must be paid to the details. Although
many options are available to choose from, having standardized, controlled dietary conditions is
critical for experiment success.
ACKNOWLEDGMENTS
This project arose from efforts of the NASA Bed Rest Project Team, led by Jan Meck. Her
appreciation of the importance of nutrition and dietary support in these types of studies was
critical to our success. We thank the subjects for their time and willingness to participate in these
difficult long-duration studies. We thank the staff of the UTMB GCRC for their assistance in the
support of these studies. We also thank the NASA Johnson Space Center Nutritional
Biochemistry Laboratory for their efforts in support of compilation of the data reported herein.
We also thank Jane Krauhs for editing the manuscript.
REFERENCES
1. Harris JA, Benedict FG. A biometric study of basal metabolism in man. Washington, DC: Carnegie Institute of Washington; 1919. Report No.: Publ. 279.
2. LeBlanc AD, Schneider VS, Evans HJ, Engelbretson DA, Krebs JM. Bone mineral loss and recovery after 17 weeks of bed rest. J Bone Miner Res 1990;5:843-50.
3. LeBlanc AD, Schneider VS, Evans HJ, Pientok C, Rowe R, Spector E. Regional changes in muscle mass following 17 weeks of bed rest. J Appl Physiol 1992;73(3):2172-8.
4. Schakel SF, Sievert YA, Buzzard IM. Sources of data for developing and maintaining a nutrient database. J Am Diet Assoc 1988;88:1268-71.
5. Smith SM, Uchakin PN, Tobin BW. Space flight nutrition research: platforms and analogs. Nutrition 2002;18:926-9.
18
TABLE I. NUTRIENT INTAKE (MEAN VALUES ± SD) FOR SUBJECTS (n = 11) BEFORE, DURING, AND AFTER BED REST, COMPARED WITH REQUIRED INTAKES.
Nutrient Mean Intake Bed Rest
Study 1, 2, 3
Mean Intake
Pre Bed Rest
Study 1, 2, 3
Mean Intake
Post Bed Rest
Study 1, 2, 3
Bed Rest Requirement Acceptable Range Flight Requirement
Energy, kcal 2208 ± 342 2605 ± 434
2437 ± 333
Maintain BW WHO (moderate activity)
Fat, g 76 ± 12 90 ± 16 83 ± 11
CHO, g 308 ± 47 366 ± 59 343 ± 45
Protein, g 85 ± 15 99 ± 17 92 ± 15 12-15% of total energy 12-15% of total energy
12-15% of total energy
% kcal from fat 31% ± 1% 31% ± 1% 31% ± 1% 30-35% of total energy 30-35% of total energy
30-35% of total energy
% kcal from CHO 56% ± 1% 56% ± 1% 56% ± 1%
% kcal from protein 15% ± 1% 15% ± 0% 15% ± 1% 12-15% of total energy 12-15% of total energy
Vitamin A, •g RE 1871 ± 441 2167 ± 526
1957 ± 594
1000 •g RE 1000-1500 1000 •g RE
Vitamin D, •g RE 6.2 ± 1.3 6.9 ± 1.7 8.2 ± 4.3 10 •g RE (400 IU) 8-12 10 •g RE (400 IU)
Vitamin E, mg •-TE 13.4 ± 2.8 16.2 ± 3.4 12.9 ± 4.9 20 mg •-TE 20 20 mg •-TE
Vitamin K, •g 109 ± 21 124 ± 25 97 ± 53 80 •g (M), 65•g (F) 80 •g (M) 65•g (F)
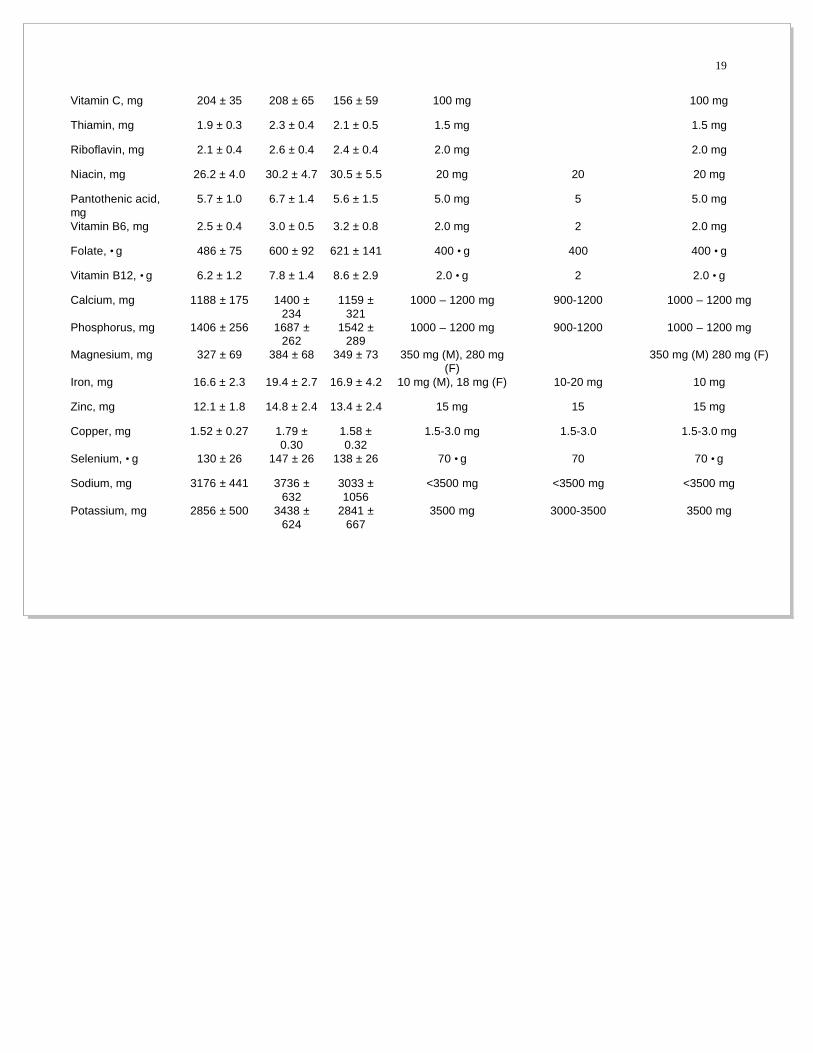
19
Vitamin C, mg 204 ± 35 208 ± 65 156 ± 59 100 mg 100 mg
Thiamin, mg 1.9 ± 0.3 2.3 ± 0.4 2.1 ± 0.5 1.5 mg 1.5 mg
Riboflavin, mg 2.1 ± 0.4 2.6 ± 0.4 2.4 ± 0.4 2.0 mg 2.0 mg
Niacin, mg 26.2 ± 4.0 30.2 ± 4.7 30.5 ± 5.5 20 mg 20 20 mg
Pantothenic acid, mg
5.7 ± 1.0 6.7 ± 1.4 5.6 ± 1.5 5.0 mg 5 5.0 mg
Vitamin B6, mg 2.5 ± 0.4 3.0 ± 0.5 3.2 ± 0.8 2.0 mg 2 2.0 mg
Folate, •g 486 ± 75 600 ± 92 621 ± 141 400 •g 400 400 •g
Vitamin B12, •g 6.2 ± 1.2 7.8 ± 1.4 8.6 ± 2.9 2.0 •g 2 2.0 •g
Calcium, mg 1188 ± 175 1400 ± 234
1159 ± 321
1000 – 1200 mg 900-1200 1000 – 1200 mg
Phosphorus, mg 1406 ± 256 1687 ± 262
1542 ± 289
1000 – 1200 mg 900-1200 1000 – 1200 mg
Magnesium, mg 327 ± 69 384 ± 68 349 ± 73 350 mg (M), 280 mg (F)
350 mg (M) 280 mg (F)
Iron, mg 16.6 ± 2.3 19.4 ± 2.7 16.9 ± 4.2 10 mg (M), 18 mg (F) 10-20 mg 10 mg
Zinc, mg 12.1 ± 1.8 14.8 ± 2.4 13.4 ± 2.4 15 mg 15 15 mg
Copper, mg 1.52 ± 0.27 1.79 ± 0.30
1.58 ± 0.32
1.5-3.0 mg 1.5-3.0 1.5-3.0 mg
Selenium, •g 130 ± 26 147 ± 26 138 ± 26 70 •g 70 70 •g
Sodium, mg 3176 ± 441 3736 ± 632
3033 ± 1056
<3500 mg <3500 mg <3500 mg
Potassium, mg 2856 ± 500 3438 ± 624
2841 ± 667
3500 mg 3000-3500 3500 mg

20
Fluid, mL 3903 ± 598 4179 ± 818
3880 ± 698
28.5 mL per kg 2L-4L 1.0-1.5 mL per kcal
Fiber, g 21.6 ± 4.7 25.1 ± 4.5 23.1 ± 5.3 10-25 g 10-25 g 10-25 g
Manganese, mg 4.3 ± 0.7 4.9 ± 0.7 5.0 ± 0.9 2.0-5.0 mg 2.0-5.0 mg
BW = body weight; CHO = carbohydrate; RE = retinol equivalent; TE = tocopherol equivalent; M = males; F = females.

FIGURE LEGENDS
Figure 1. Percent change in body weight of subjects (mean ± SD) in three bed rest studies compared with day 3 of bed rest.
22
Figure 1.
0 25 50 75 100-15
-10
-5
0
5
10
Day of Bed Rest
BW
(%∆
from
BR
3)

23
FIGURES
Figure 1.