Embed Size (px)
Citation preview

DIF Analysis
Galina Larina
28-31 of March, 2012University of Ostrava

DIF analysis Definitions• Item impact
– “significant group difference on an item, e.g., when one group has a higher proportion of examinees answering an item correctly than another group ”
– Due to the true group differences in proficiency or due to item bias
• Differential Item Functioning (DIF)– “It occurs when test-takers having identical levels on the
latent trait that the test was designed to measure but belonging to different groups, have different probabilities of endorsing (or answering correctly) a particular item”
– Examinees in different groups are matched on the proficiency
If an item is found to be poor-fitting in the whole data
set or within any group of test-takers, it should be remove from subsequent DIF analysis

DIF analysisEffectless of fit statistics
Winsteps Conquest
Infit Outfit Infit Outfit
Mean 1.00 1.00 1.00 1.00
Maximum 1.06 1.13 1.06 1.10
Minimum 0.94 0.91 0.93 0.91
Item 25 1.03 1.00 1.03 1.01
Infit and outfit mean square errors for simulated 50-item test in which item 25 has DIF

DIF analysisTypes of DIF
Uniform DIF Non-uniform DIF
Non-uniform mixed DIF

DIF analysis Statistical methods for evaluating DIF
• CTT methods– Conditional p-value difference– Delta plot– Standardization
• Chi-square methods–Mantel-Haenszel– etc.
• IRT methods

DIF analysis Mantel-Haenszel method
Base group
Focal group

DIF analysis Mantel-Haenszel method
Average factor by which the likelihood that a base group member gets the item correct exceeds the corresponding likelihood for comparable focal group members
For statistically significant DIF on an item, Prob. < 0.05
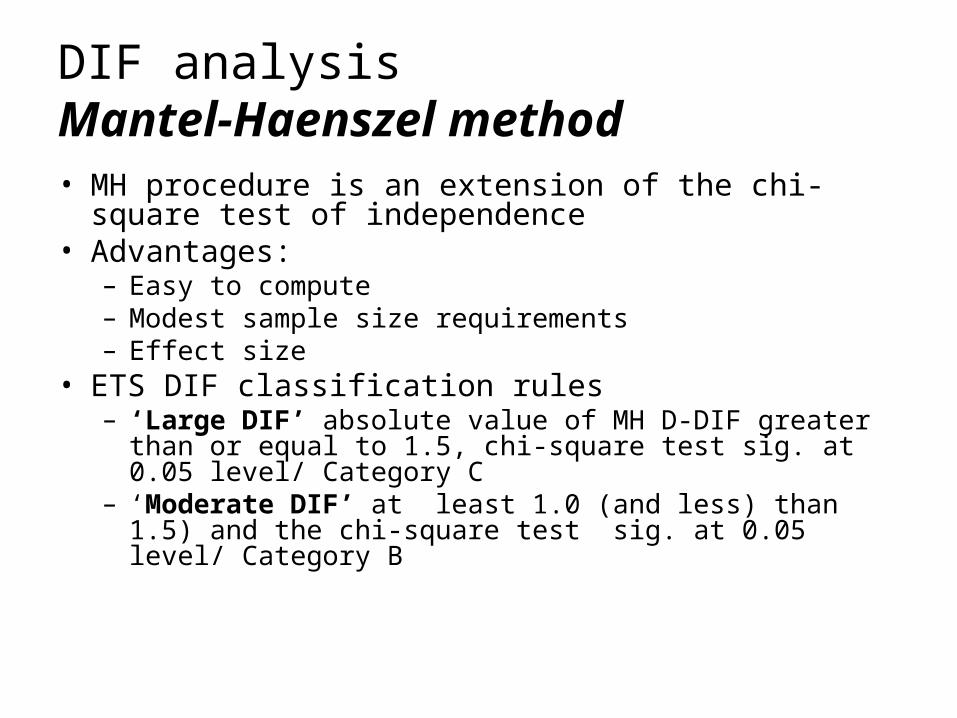
DIF analysis Mantel-Haenszel method• MH procedure is an extension of the chi-square
test of independence• Advantages:
– Easy to compute– Modest sample size requirements– Effect size
• ETS DIF classification rules– ‘Large DIF’ absolute value of MH D-DIF greater than
or equal to 1.5, chi-square test sig. at 0.05 level/ Category C
– ‘Moderate DIF’ at least 1.0 (and less) than 1.5) and the chi-square test sig. at 0.05 level/ Category B

DIF analysis Rasch approaches• Separate calibration t-test first proposed by Wright and
Stone
Where di1 is the difficulty of item I in calibration 1, di2 is the
difficulty of item i in calibration 2 based on groups 2, s2i1 is the
standard error of estimate for di1, and s2i2 is the standard error of
estimate for di2
• Winsteps applies the above formula in DIF analysis
2/122 )s+(s
dd=t
i2i1
i2i1

DIF analysis IRT approaches
• The between fit approach is based on a single calibration that contains at least two subpopulations of interest.
where J is a number of subpopulations, N is a number of person in each populations, xni is the score for person n responding to item i, and pni is the probability of person n responding correctly to item i given the overall estimates for the ability of the person and the difficulty of the item
J
j=jN
jnni
jN
jnni
jN
jnni
i
w
px
=(UB)1
2
2

DIF analysis Winsteps
DIF label start in person label column 20
DIF label start in person label with a width 1
Column 20 with width 1

DIF analysis Winsteps
Press OK
Press Entry Number

DIF analysis Winsteps
Pairwise comparison
This should be at least 0.5 logits for DIF to be noticeable
For statistically significant DIF on an item, Prob. < 0.05
For statistically significant DIF on an item, t > |2|

DIF analysis Winsteps
Item 1

DIF analysis Winsteps
Item 1

DIF analysis Winsteps. Plots
Press OK

DIF analysis Winsteps. Plots. Item 1