Embed Size (px)
Citation preview
Differences in occupational earnings by sex 3
Copyright © International Labour Organization 1998
International Labour Review, Vol. 137 (1998), No. 1
Differences in occupational earningsby sex
Derek ROBINSON *
The question of whether gender bias is a cause of differences in pay isimportant, persistent and still unresolved.1 A critical element in examin-
ing that question is the precise measurement of pay differentials, which in turnrequires specification of components determined by differences in education,experience and occupation, inter alia. This article reviews some of the majorresearch findings concerning the female/male wage gap, looking first at ques-tions addressed in attempting to measure wage gaps and some methodologicalissues. It then introduces some analyses of the female/male occupational wagegap based on data from the ILO’s 1996 October Earnings Inquiry (OEI).2 Inorder to approach an understanding of possible discrimination the categoriesare first discussed, then empirical findings given for two major groupings ofoccupations — in medicine and in public service, banking and insurance. Somesuggestions as to national trends and international differences are offered, anda final section concludes.
Considerations in measuring gaps in earningsSome common questions are taken up in examinations of differential earn-
ings by sex. One is whether there are differences in the average pay of menand women, and if so to what extent. All studies show that though in somesituations women may earn more than men in certain narrowly-defined occu-pations, overall there is a general gap between the average pay of men andwomen in broad occupational or multi-occupational groupings, with womenearning on average less than men. Evidence of the existence of such an overall
* Institute of Economics and Statistics, University of Oxford.1Some relevant studies are Blau and Beller (1988); Cain (1986); England (1992); Fields
and Wolff (1991); Groshen (1991); Macpherson and Hirsch (1995); Moulton (1986); O’Neill(1985); Sorenson (1989), (1990).
2 See ILO: Statistics on occupational wages and hours of work and food prices: OctoberInquiry results, 1994 and 1995. Special supplement to the Bulletin of Labour Statistics, Geneva,1996. This publication lists 159 occupations, but occupation 139 (government executive offi-cial) provides data for (a) central government, (b) regional or provincial government, and (c)local government, making a total of 161 occupations. Some of the occupations are differentiatedby sector or sub-sector of industry.
International Labour Review4
average gap does not of course indicate whether or not gender-based discrimi-nation underlies that difference. It is possible that men and women in eachoccupation are paid exactly the same wage but, as pay differs according tooccupation, if the distribution of men and women across occupations variesthere will be a difference in the overall average pay of men and women. It iswell established that as a result of variations in the occupational distributionof men and women, there is an “overcrowding” of women in certain occu-pations and under-representation of women in others.3
The next questions then are the extent of the difference, its causes and thedegree to which it is constant or changing. Various definitional problems im-mediately arise in this connection. Is the comparison between men and womendoing exactly the same work in the same place or, at the other extreme, be-tween all male and all female workers across the whole economy?
The simplest question to address is whether men and women performingthe same work in the same place or establishment are paid the same or not. Yetin practice, even this is difficult to answer comprehensively, as to do so reallyrequires detailed information on every worker in every establishment. And,though equal pay legislation largely prevents this obvious form of discrimi-nation, such legislation does not require every woman in an establishment tobe paid exactly the same as every man doing the same work in that establish-ment. Salary scales stipulating a range of pay for a job can satisfy legal re-quirements regarding equal pay despite differences in the pay actually receivedby men and women, provided that the reasons for these differences are notgender related. For example, equal pay legislation is not infringed by salaryscales which have automatic increments based on length of service, althoughthese may result in differences in the pay of men and women doing the samejob in the same establishment.
Pay systemsCertain practices or elements in a payment system may have a wage-
differentiating effect for men and women. For example, performance-relatedelements in pay may permit gender discrimination in their award or size. How-ever, some studies have shown that women do better under incentive schemesbased on results rather than on subjective evaluation (e.g. Gunderson, 1975)— a possible indicator of discrimination in pay systems without them.
Some allowances may automatically be paid to men, inflating their meas-ured earnings: for example, in the case of both spouses employed by the civilservice, payment of a child allowance may be made only to the man. Or thepayment basis may lead to differences in earnings: if men work longer hourson average than women, men’s average weekly or monthly earnings will be
3 For a good introduction to some problems of measurement of women’s wage disadvan-tage see Gonzalez and Watts (1995). A recent analysis of crowding of women in certain occupa-tions and the effects of this on their pay is Grimshaw and Rubery (1998). Anker (1997) providesa recent survey of occupational segregation.
Differences in occupational earnings by sex 5
higher even if they are paid the same hourly rate. Men’s average hourly earn-ings are also usually higher than women’s, but to a lesser extent, as any over-time premium is spread over all the hours worked. Men may also have higheraverage hourly wages because of the greater proportion of women workingpart time — work which is typically paid at lower hourly rates.
Methodological questions � main approaches
Currently there is little evidence of significant differences in wages for menand women in the same narrowly-defined occupations in the same establishment.Because of difficulties involved in analysing men’s and women’s pay for perform-ing the same tasks, most studies compare the average pay of a group of men and agroup of women. Two very different methods of analysis are used in practice.
The first method consists simply of comparing the average or the medianearnings of male and female full-time employees. There are obvious weak-nesses in this relatively crude aggregate approach. It ignores any differencesin productivity as it does not seek to compare the pay of men and womendoing the same or similar work. Because this approach generally comparesearnings of all workers in specified labour markets (national, sectoral, etc.) itmay well not compare the earnings of men and women in the same broadoccupations. Since the proportions of the male and female labour forces obvi-ously vary from one occupational group to another, as already mentioned, theneven where men and women are paid exactly the same wage within each occu-pation there will be differences between the average wage of men and womenand, most probably, in their median wages, too.
The second method seeks to explain the differences by adjusting the datato take account of features which might explain differing productivity or mar-ginal product of men and women by including in regression analysis measur-able work-related characteristics which can be tested to see whether the re-turns to them are different for men and for women. This does not change themeasured wage gap but can provide explanations for the size of the gap or forchanges in it over time. Thus, years of education can be expected to affectproductivity and, so, value of marginal product (Mincer and Polachek, 1974;Mincer and Ofek, 1982; Hill and O’Neill, 1992); so can years of work experi-ence (Mincer and Polachek, 1974; Lofstrom and Gustafsson, 1991).
Other analyses test whether men and women with the same presumedproductivity-influencing characteristics receive the same pay. One such char-acteristic is education measured by years of schooling. Others may be years ofexperience (both within a given establishment and in employment generally)and marital status. Some studies consider these variables to be indicators ofrelative productivity. But this is not necessarily the case: they may be indica-tors of possible or potential productivity, and it does not follow that all indi-viduals use their potential productivity to the same extent. Some studies showthat women may choose not to use their full productive potential, becauseof placing greater importance on other aspects of employment, such as con-venient hours, or a need to change jobs when their spouses have to move.
International Labour Review6
Researchers in this area who seek to include the personal characteristicsof male and female employees in their analysis adopt a different approachfrom that of researchers seeking merely to examine the relative wage disad-vantage of women without differentiation of productivity-influencing charac-teristics. Because of differences in men’s and women’s average pay resultingfrom the varying rate of reward for the possession of measurable productivity-influencing characteristics, the overall male/female wage gap will be influ-enced by the general level of wage differentials or the wage structure in anindividual country (Blau and Kahn, 1996). The prevailing level of wage in-equality within occupations involving different skills is very important in ex-plaining the overall female wage gap.
Occupational pay differentials by sex are present in every economy, al-though their size and on occasion their direction, for pairs of occupations,change. Comparing groups of men and women of different occupational com-positions will therefore reveal differences in average earnings which are causedby differences in the structure of employment and the size of occupationaldifferentials, and not only by differences in pay for men and women in thesame occupation.
Structural changes in the economy can also affect the wages of both menand women, leading to changes in the measured male/female wage gap(Borooah and Lee, 1988). Changes in technology and production methods canvariously affect demand for skills, thus modifying occupational pay differen-tials. Changes in world trade can affect some industries adversely and occu-pations in those industries may suffer a relative wage decline compared withthe same occupations which are expanding elsewhere. While those changesare only a relatively minor contributing factor, blue-collar workers in tradi-tional heavy industries and in consumer-goods industries in a number of in-dustrialized market economies have experienced declining demand for theirlabour with a consequential reduction in their pay relative to blue-collar work-ers in other occupations or in the same occupations in other industries.
Equal pay for work of equal valueIn a number of countries legislation now requires equal pay for women
performing work of equal value or of comparable worth to that performed bymen in the same establishment. The aim is to prevent management, or tradeunions and management acting together in collective bargaining, from dis-criminating against women in female-dominated jobs by fixing lower relativewage levels for them, whether or not some form of job evaluation exercise hasalready been carried out. In effect, comparable worth analyses are checksagainst gender bias in the determination of the internal wage structure, eventhough these internal wage structures may themselves have been based onsome form of job analysis and evaluation.
The comparisons are confined to the same establishment, as establish-ments may have different pay levels for every occupation for any of a numberof legitimate reasons, perhaps because they are in a different product market
Differences in occupational earnings by sex 7
with greater opportunities for excessive or supra-normal profits and so canafford to pay higher wages, sharing the rents from market imperfections withthe labour force. It would therefore be inappropriate to compel a company inone product market to pay women wages which include the rent-sharing ofmen in a company in another product market. Similarly, wage levels may dif-fer from one local labour market to another because of variations in laboursupply and demand. Again, it would be inappropriate to compel an establish-ment to pay higher wages to women in jobs similar to those of men in differentlocalities if the reason for the wage difference was the location in anotherlabour market, for in those circumstances men in the two localities would prob-ably also be paid different wage levels.
It is necessarily a matter of judgment whether two jobs are of comparableworth or require the same skills and abilities. An element of subjective orvalue judgment will always be involved and on occasion the application ofcomparable worth analysis means imposing one set of values for the compo-nents of different jobs dissimilar to the values adopted by the persons who setthe original pay levels. Nevertheless, it has been known for some time thattechniques of comparability can be devised which minimize the subjectiveelements of comparability and produce results which command wide accept-ance (see, e.g., Aldrich and Buchele, 1986; Blau, 1977; Ehrenberg and Smith,1987). Yet, legislative provisions generally seek to cover only cases of possi-ble discrimination against one sex in pay levels in relation to the content andrequirements of their jobs compared with those of the other sex rather thanestablishing internal pay equalities for jobs of comparable worth per se. Thismay be because of the belief that if there is no gender-based discrimination or(in some cases) no discrimination based on race, religion or ethnic origin, theState should not seek to become involved in relative pay determination.
Economic theory would conclude that in the absence of any market im-perfections or demand-side discrimination, the pay gap between men andwomen with the same value of marginal product in the same location would bezero. Even in this highly restrictive case, however, a comparison of male andfemale pay may not be sufficient to establish the existence of discrimination.There can be real differences in the value of marginal products of men andwomen doing the same work: this has long been recognized as typically truefor jobs which require physical strength. The presence of an occupational wagegap can therefore only be regarded as a first indication that wage discrimina-tion may be being practised against women.
Effects of job segregation on payIt has been established that female-dominated jobs or occupations pay
relatively lower wages than male-dominated ones, so that both men and womenin an occupation are paid less the greater the proportion of women employedin that occupation. This crowding effect is more marked for men than for women(Bergmann, 1974; O’Neill, 1985; Blau and Beller, 1988; Sorensen, 1990;Killingsworth, 1990; Groschen, 1991). Some of the effects of job segregation
International Labour Review8
which can influence women’s average pay relative to men’s should not bepresent in a study of the average pay of men and women in a narrowly-definedoccupation, unless there are distributional differences between men and womenin the various product or local labour markets. Average pay for both men andwomen in one occupation might be lower relative to average pay in occu-pations with a larger proportion of male workers, but within each occupationthe crowding hypothesis should have no impact on the relative pay of men andwomen within that occupation. Discrimination theory seeks to explain whether,and if so why, employers choose not to employ women in certain jobs wherethey could have the same value of marginal product as men and presumably atwages lower than those men are currently paid, despite the probable concomi-tant increase in effective or acceptable labour supply and reduction in wagesof both men and women.
If there is discrimination in hiring into certain occupations, the determi-nation of a wage gap will depend on the coverage chosen for the comparisonof male and female pay. If a narrow occupational basis is selected, there maybe no apparent wage gap. If there is occupational crowding, the choice of abroader group coverage might well identify a wage gap but, the result of crowd-ing into certain occupations resulting in lower wages there for both men andwomen, that would reflect discrimination in hiring rather than wage discrimi-nation as such.
Such a discussion is not just an academic exercise. If appropriate re-medial policies are to be developed, it clearly matters whether the discrimina-tion is practised in the wages paid to people doing the same work in the sametightly-defined occupations, or whether it is practised at the point of entry intocertain occupations or jobs. The existence of a wage gap when a broadercoverage of occupations is used might therefore indicate that either wage orhiring discrimination exists, or both.
Legislation to ensure equal opportunity may lead to reductions in the wagegap if it enables more women to be admitted into occupations previously domi-nated by men and thus, typically, paying higher wages. This tendency isstrengthened if legislation requires affirmative action or positive discrimi-nation in favour of women.
Value of narrow occupational categoriesfor detecting gender bias
It is clear that the larger the occupational coverage of the group of work-ers, the greater the possibility that the measured relationship will be mislead-ing given the greater variety included. Even if men and women in the sameestablishment are paid exactly the same wage, differences in their average paywill emerge if the two sets of workers are employed in different proportions indifferent establishments. The narrower the occupational coverage of the com-parison, the more likely it is that any genuine underlying difference in the payof men and women will be displayed and the smaller the possibility that dis-tortions will appear as a result of including workers who, despite their ident-
Differences in occupational earnings by sex 9
ical occupational title, have different jobs, levels of productivity or humancapital endowments (e.g. labourer, salesperson). Of course, it is quite possiblethat men and women with different levels of human capital, ability and/oreducation are influenced by the presence of discrimination, or by some otherfactor entirely, in their choice of or entry into that narrowly-defined occupa-tion. However, there is some evidence that differences in the occupational dis-tribution of men and women are a more important cause of the pay gap whennarrower rather than broader occupational groupings are used (Treiman andHartmann, 1985). The effects of women being crowded into lower-paid jobscan be diluted if broader groupings are used for the purposes of comparisonsince women in higher-paying jobs will thus be included. Much also dependson the particular occupations that are grouped together and the female per-centage wage gap in each of them. Female percentages, or wage gaps of broadergroupings, are in effect no more than weighted averages of the female percent-ages of all the narrower occupational groupings included in the larger aggre-gate, so there will be some occupations with larger and some with smallerfemale percentages than that for the overall average.
There are difficulties in matching job requirements with occupationaltitles and job classifications. Classical economic theory removes these diffi-culties, or ignores them, by assuming homogeneous labour for a given occu-pational title. In reality — a reality recognized by more recent economic rea-soning as embodied in the efficiency wage hypothesis — labour is not homo-geneous but heterogeneous, even as regards each individual worker and theeffort-inputs supplied by an individual worker at different times and in differ-ent circumstances, in response notably to the relative wage paid comparedwith that which he/she believes might be paid in another job. It is also possiblethat the same nominal occupation has different job requirements with differ-ent effort-inputs depending on the industry or sub-sector of economic activity.Thus the breadth of industrial coverage of the classification for wage surveyscan affect the average pay of men and women even when the analysis appearsto be confined to narrowly-defined occupations.4
This difficulty is also raised by Gunderson (1989) in a literature survey.He found, inter alia, that factors originating outside the labour market, such asdifferences in household responsibilities, type of education, or career inter-ruptions, are important component causes of the overall wage gap. Differ-ences in occupational distribution account for a substantial part of that gap.Pay differences within narrower occupations, however, at least in some estab-lishments do not lead to large differences in average male and female wages.Differences between establishments account for a substantial part of the fe-male wage gap. The productivity-adjusted wage gap is smaller in the publicthan in the private sector, and is smaller in the private sector the more competi-tive the product market. The longer the length of employment of women withinan establishment, the smaller the wage gap.
4 This can be inferred from the analyses by Malkiel and Malkiel (1973), who used publi-cations as a measure of productivity for a study on one (unnamed) profession.
International Labour Review10
Approaches to measuring occupational earningsby sex
The occupational definitions used in the ILO’s October Earnings Inquiry(OEI) 5 make it possible to study the specific questions of whether there is awage gap between men and women in the same occupation, the direction andsize of the gap, and whether it is changing.That is what is addressed here.
Three main measurements of payPay scales or job rates
Basically, this approach measures the amount of pay that males and fe-males in a given job or post are entitled to receive, rather than the averageamount of pay actually received by groups of male and female workers. Inmany types of employment, particularly in the public sector or in non-manualoccupations, individual workers are classified in a job grade to which a payscale is applied. The scale usually consists of a basic pay range which may besupplemented by various types of allowances or additions based on specifiedfactors such as location of work, type of work, changes in the cost of living,qualifications, number of dependent children, age, or years of service. The lasttwo factors are often transcribed into specified incremental steps so that pro-gression from the minimum to the maximum rate on the scale occurs auto-matically according to predetermined conditions; however, there has recentlybeen a tendency to introduce a discretionary element into the award of suchpredetermined increments, based perhaps on some form of personal or meritassessment.
It is now rare for gender-based differences to appear in the pay scalesapplicable to men and women in the same job, post or grade in either thepublic or the private sector. Although the OEI provides details of some scaleminima and maxima, particularly for public service occupations, these havenot been used in this study as they are always the same for both sexes.
However, if the basis for the analysis changes from posts, jobs or gradesto individuals in those posts, jobs or grades, gender-based differences mayemerge. For example, if all members of a specified grade are paid on the samepay scale consisting of a given minimum salary with annual increments basedon length of service up to a specified maximum salary applicable to all, it ispossible for female workers in that grade to have a lower (or higher) averagesalary than the male workers in that grade. In the conditions specified, this
5 The occupational classification helps to separate occupations in different sectors of in-dustry. While there may well be some differences in the actual definitions of occupation appliedin various countries, each individual country uses the same occupational definitions for menand women. For that reason international comparisons are difficult. Because the OEI providesno details of the number of men and women employed in each occupation, it is not possible torecalculate weighted average pay for different groupings; nor is there any information aboutdiscrimination at the point of entry.
Differences in occupational earnings by sex 11
would mean that on average women had fewer (or more) years of service inthat grade than men did.
Differences in the average pay of men and women should not necessarilybe regarded as gender-based pay discrimination, as each individual remainingin that grade will receive the same rate of pay irrespective of sex. The extent ofthe difference in average pay for men and women could be attributable to thedistribution of men and women across the various incremental steps in thescale and to the difference in pay between each step. But payment systemrules may include conditions which in practice militate against women reach-ing the higher levels within that single scale. This could happen if on averagewomen have a lower retirement age than men and if all workers entered thegrade and salary scale at an age which, combined with the total possible numberof increments, meant that women reached their normal retirement age beforethey attained the maximum on the salary scale. Alternatively, women mayhave had fewer opportunities to progress up a pay scale with a large number ofincrements because of breaks in their working careers as a result of familyresponsibilities. If no such discriminatory conditions apply, differences in av-erage female and male pay from a single salary scale with increments basedonly on seniority within the grade would be determined by seniority distribu-tional differences between men and women.
Variations in average male/female pay arising from seniority distribu-tional differences could still suggest the presence of gender-based discrimi-nation in the grade. However, they might be due to the fact that more womenthan men had recently been recruited, which would be consistent with positivehiring practices in favour of women. It could also be consistent with positivediscrimination favouring women’s promotion to the next highest grade, if thegrade in question is one from which members of the higher grade are recruited.If the grade is one to which members are recruited from lower grades withinthe same establishment, a higher proportion of women with lower senioritythan men could be consistent with positive discrimination favouring women’spromotion from the lower grade.
If, however, the salary scale or job rate contains discretionary elements,such as merit pay or performance awards, or elements which may themselvesbe gender based or gender influenced, e.g. payment of rent or housing allow-ances according to rules differentiating between men and women, then differ-ences in average payment could indicate gender-based discrimination. If therewere differences in the distribution of men and women by seniority in thegrade and elements of gender-based difference in payments, it would be nec-essary to obtain detailed information both about the distribution of men andwomen by seniority and location in the incremental salary scale as well as thedistribution and size of gender-based pay elements.
Average wage or salary ratesThe OEI defines average wage or salary rates as the rates paid for normal
time of work, comprising: basic wages and salaries, cost-of-living allowances andother guaranteed and regularly paid allowances. The following should be excluded:
International Labour Review12
overtime payments, bonuses and gratuities, family allowances, other socialsecurity payments made by the employer directly to employees and ex gratiapayments in kind supplementary to normal wage and salary rates (ILO, 1996).
This definition is similar to that just discussed if the average salary scalepayment considered is based on actual pay received rather than on entitle-ments. Similar differences in average pay thus defined can then emerge if nopay is received for time not worked because of lateness, absenteeism or sick-ness and if there are differences between men and women in the average timenot worked for these reasons.
However, in many countries employment conditions, especially in thepublic service, may allow full pay during sickness; or there is little (if any)absenteeism and lateness is overlooked; or, because of severe worsening ofreal pay, pay system controls and the enforcement of rules regarding attend-ance and timekeeping degenerates so far that no sanctions are taken or evenofficial records kept. In those cases, even where there are differences in timelost by men and women there is no difference in the average salary or wagesthey actually receive other than for reasons of occupational distribution.6 Pri-vate sector employment conditions may be different, with less advantageoussick pay provisions and a more rigorous enforcement of timekeeping, so thatdifferences may emerge in average wages and salaries for men and womeneven when there are no seniority distributional effects.
The OEI gives details of normal hours of work, which are defined asthose set out in regulations, laws or collective agreements (see also ILO, 1997).These are the number of hours that should be worked by full-time workersbefore overtime premium is paid. Where there is a significant number of part-time workers (disproportionately female), converting average weekly ormonthly wages into hourly wages by dividing by the number of normal hourswill understate average female hourly wages and thus overstate the femaledisadvantage. Similar types of distortion may occur when average weekly ormonthly wages of men and women are compared, as those for women mayreflect a lower number of average normal hours worked. The data provided bythe OEI do not allow the necessary adjustments to be made. However, somecountries (e.g. Costa Rica, Estonia, Finland, Lithuania, Republic of Moldovaand the United Kingdom) report the average number of normal (non-overtimepremium) hours actually worked, not the number of normal hours set out incollective agreements. In such cases, there are no problems in converting aver-age weekly wages into average hourly wages, even if there are proportionatelymore part-time women workers. And a few countries report average or pre-vailing hourly wages for some, if not all, occupations. Average actual hourlywages are obviously the best measure of wages as they take into account anydifferences in hours worked and can be used to estimate equivalent weekly ormonthly wages by using normal hours as set out in collective agreements.
6 There are various studies of declining managerial performance in public service em-ployment in developing countries where public service pay has suffered severe reduction in realterms and where even the drastically reduced real pay has not been paid for several months. Agood recent collection of studies is in Colclough (1997).
Differences in occupational earnings by sex 13
Average earnings
The OEI defines earnings as the remuneration in cash and kind paidto employees, as a rule at regular intervals, for time worked or work done,together with remuneration for time not worked, such as for annual vacation,other paid leave or holidays, and including those elements of earnings whichare usually received regularly, before any deductions are made by the em-ployer in respect of taxes, contributions of employees to social security andpension schemes, life insurance premiums, union dues and any other obliga-tions of employees (ILO, 1996, p. 3). Excluded are employers’ contributionsto social security and pension schemes and any benefits received by employ-ees from these schemes. Also excluded are severance and termination pay,irregular bonuses such as year-end and other one-time bonuses which accrueover a period longer than a pay period.
It is clear that overtime payments, comprising elements of average wagesor salary as well as the premium itself, should be included, as these are pay-ments for time worked or work done. Differences in average earnings for malesand females on the same salary scale can arise from differences in averagehours worked and possibly from differences in the average overtime premiumper hour worked.
Average female pay as a percentageof average male pay
The OEI provides details of average male and female pay for some occu-pations in some countries. This enables one to calculate the female percentage— average female pay as a percentage of average male pay for the same occu-pation. In this section, comparisons of male and female pay are analysed fortwo important and contrasting occupational groupings – medical occupations,and public service, banking and finance.
Medical occupationsThe results of comparing male and female pay in six medical occu-
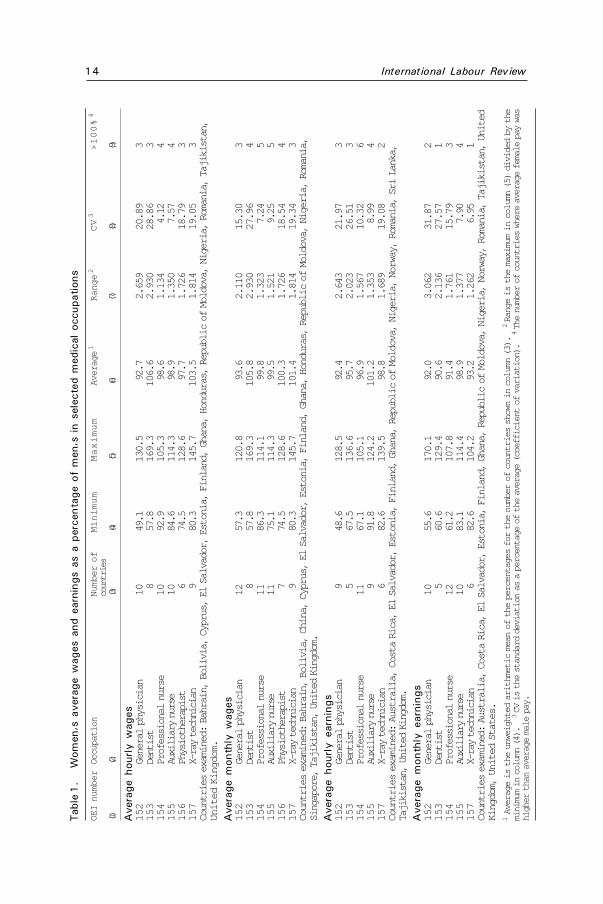
pations in a number of countries based on details from the 1996 October Earn-ings Inquiry are summarized in table 1. Four different measures of pay areshown; changes in the female percentages among them arise from differencesin the countries covered as well as smallish differences due to modifications inthe measurement of pay. Some countries provide appropriate information forcertain occupations only. Column (3) shows the number of countries included,column (4) the lowest or minimum female percentage, column (5) the highest,and column (6) the unweighted average of the female percentages for the coun-tries covered.
The table also shows in column (7) the range of the female percentages,which is the maximum country percentage as a ratio of the lowest female per-centage for that occupation. The coefficient of variation (CV) in column (8) isa measure of the differences in the female percentages in all the countries
International Labour Review14Tab
le 1
.W
omen
�s a
vera
ge w
ages
and
ear
ning
s as
a p
erce
ntag
e of
men
�s i
n se
lect
ed m
edic
al o
ccup
atio
ns
OE
I num
ber
Occ
upat
ion
Num
ber o
fM
inim
um
Ma
xim
um
Ave
rage
1R
ange
2C
V3
>1
00
%4
coun
tries
(1)(2
)(3
)(4
)(5
)(6
)(7
)(8
)(9
)
Ave
rage
hou
rly
wag
es15
2G
ener
al
phys
ician
1049
.113
0.5
92.7
2.65
920
.89
315
3D
entis
t8
57.8
169.
310
6.6
2.93
028
.86
315
4Pro
fess
ional
nurs
e10
92.9
105.
398
.61.
134
4.12
415
5Au
xiliar
y nu
rse10
84.6
114.
398
.91.
350
7.57
415
6Ph
ysiot
hera
pist
674
.512
8.6
97.7
1.72
618
.79
315
7X-
ray
tech
nician
980
.314
5.7
103.
51.
814
19.0
53
Cou
ntrie
s ex
amine
d:
Bah
rain,
Boli
via,
Cyp
rus,
El
Salv
ador
, Esto
nia,
Finla
nd,
Gha
na,
Hon
dura
s, R
epub
lic
of
Mold
ova,
N
igeria
, R
oman
ia,
Tajik
istan
,U
nite
d Kin
gdom
.
Ave
rage
mon
thly
wag
es15
2G
ener
al
phys
ician
1257
.312
0.8
93.6
2.11
015
.30
315
3D
entis
t8
57.8
169.
310
5.8
2.93
027
.96
415
4Pro
fess
ional
nurs
e11
86.3
114.
199
.81.
323
7.24
515
5Au
xiliar
y nu
rse11
75.1
114.
399
.51.
521
9.25
515
6Ph
ysiot
hera
pist
774
.512
8.6
100.
31.
726
18.5
44
157
X-ra
y tech
nician
980
.314
5.7
101.
41.
814
19.3
43
Cou
ntrie
s ex
amined
: Bah
rain,
Bolivi
a,
China
, C
ypru
s,
El
Salva
dor,
Eston
ia,
Finlan
d,
Gha
na,
Hon
dura
s,
Rep
ublic
of
M
oldo
va,
Niger
ia,
Rom
ania,
Sing
apor
e,
Tajikist
an,
Unit
ed
King
dom
.
Ave
rage
hou
rly
earn
ings
152
Gen
eral
phys
ician
948
.612
8.5
92.4
2.64
321
.97
315
3D
entis
t5
67.5
136.
695
.72.
023
26.5
13
154
Pro
fess
ional
nurs
e11
67.1
105.
196
.91.
567
10.3
26
155
Auxiliar
y nu
rse9
91.8
124.
210
1.2
1.35
38.99
415
7X-
ray
tech
nician
682
.613
9.5
98.8
1.68
919
.08
2C
ount
ries
exam
ined
: Aus
tralia
, C
osta
R
ica,
El
Salva
dor,
Eston
ia,
Finlan
d,
Gha
na,
Rep
ublic
of
M
oldo
va,
Niger
ia,
Nor
way
, R
oman
ia,
Sri
Lank
a,Ta
jikist
an,
Unit
ed
King
dom
.
Ave
rage
mon
thly
ear
ning
s15
2G
ener
al
phys
ician
1055
.617
0.1
92.0
3.06
231
.87
215
3D
entis
t5
60.6
129.
490
.62.
136
27.5
71
154
Pro
fess
ional
nurs
e12
61.2
107.
891
.41.
761
15.7
93
155
Auxiliar
y nu
rse10
83.1
114.
498
.91.
377
7.90
415
7X-
ray
tech
nician
682
.610
4.2
93.2
1.26
26.95
1C
ount
ries
exam
ined
: Aus
tralia
, C
osta
R
ica,
El
Salva
dor,
Eston
ia,
Finlan
d,
Gha
na,
Rep
ublic
of
M
oldo
va,
Niger
ia,
Nor
way
, R
oman
ia,
Tajik
istan
, U
nite
dK
ingd
om,
Uni
ted
Sta
tes.
1 A
vera
ge
is th
e un
wei
ghte
d ar
ithm
etic
mea
n of
th
e pe
rcen
tage
s fo
r th
e nu
mbe
r of
co
untrie
s sh
own
in
colu
mn
(3).
2R
ange
is
the
max
imum
in
colu
mn
(5)
divid
ed
by t
hem
inim
um i
n co
lum
n (4
).3
CV is
th
e stan
dard
de
viatio
n as
a p
erce
ntag
e of
th
e av
erag
e (c
oeffic
ient
of
va
riatio
n).
4Th
e nu
mbe
r of
co
untrie
s w
here
av
erag
e fe
male
pay
was
high
er
than
av
erag
e m
ale
pay.
Differences in occupational earnings by sex 15
included in the analysis.7 The larger the CV the more the various nationalfemale percentages for that occupation differ. For example, comparing aver-age hourly wages for general physicians and dentists, the CV for physicians(20.89) is lower than that for dentists (28.86), showing that the female per-centages for physicians are grouped more closely together and there is rela-tively less difference between them than between those for dentists. The rangefor physicians is also smaller than for dentists, showing that the differencebetween the two extreme female percentages for dentists is greater than thatfor physicians. The occupation with the largest range need not necessarilyhave the largest CV, as the range compares only the two extreme female per-centages while the CV takes them all into account. For example, the range foraverage monthly wages of X-ray technicians is 1.814 and that of general phy-sicians 2.110, yet X-ray technicians have a larger CV (19.34) than physicians(15.30).
Finally, column (9) shows the number of countries where the female per-centage is larger than 100, i.e. where average female wages are higher thanaverage male wages.
Results from applying the different measures
Overall, as regards average hourly wages, although the unweighted fe-male average as a percentage of male average hourly wages for physicians forthe ten countries concerned is 93 per cent, there is a wide range of averagepercentages for average hourly wages. There are three countries where theaverage hourly wages of female physicians are higher than those of male phy-sicians, yet female physicians in Nigeria receive less than half the averagehourly wages of male physicians. In Bolivia, women’s average hourly wagesare 30 per cent higher than men’s. There is very little difference in the femalepercentage for professional nurses in the ten countries, and the range and CVare quite small, as they are for auxiliary nurses. For both of these occupations,women have higher average wages than men in four of the ten countries, andthe range of female percentages is so small that it is clear men and women areon the same salary scale in each country.
The two occupations where the unweighted average is larger than 100 aredentists (107 per cent), for whom only three out of eight countries have femalepercentages greater than 100, and X-ray technicians (104 per cent), for whomthree out of nine countries have female percentages greater than 100.
There is perhaps slightly greater diversity in the female percentages foraverage monthly wages. Physicians and dentists are the exception where boththe range and the CV are lower, with the CV very slightly lower for physiothera-pists. With physicians the lowest figure, again for Nigeria, is higher than forhourly wages, as the fact that women physicians have longer normal hours ofwork (56) compared with men (48) has no effect in reducing women’s percent-
7 The coefficient of variation is the standard deviation as a percentage of the unweightedmean of the observations. So CV = 100(SD)/mean. It is therefore a measure of the variation inthe average female percentage of the different countries included.
International Labour Review16
age for monthly wages but does for hourly wages. Similarly, the women’s per-centage excess over average male monthly wages in Bolivia is reduced to 21 percent, as the effect of men’s average normal hours of work (just over 44) com-pared with women’s (41) is removed. The unweighted average for dentists andX-ray technicians continues to be larger than 100 although slightly lower thanfor average hourly wages, and that for physiotherapists rises to just over 100.
For both professional and auxiliary nurses the ranges and CV for averagemonthly wages are slightly larger than for average hourly wages and in fiveout of eleven countries women have higher average monthly wages.
With physiotherapists and X-ray technicians the range is the same forboth hourly and monthly wages, with the CV falling very slightly for physi-otherapists in monthly wages and rising a little for X-ray technicians.
There are rather more female percentages in excess of 100 if averagemonthly as opposed to hourly wages are used, but some of these changes maybe due to differences between the countries included.
The variation between countries is much the same for average hourlyearnings, with the spread of female percentages being a little greater for aver-age hourly earnings for professional and auxiliary nurses. There is a notice-able increase in the CV for professional nurses and the number of countrieswith female percentages greater than 100 rises to six out of eleven, comparedwith four out of ten for hourly wages. The only instance of a female percent-age exceeding 100 for either measure of earnings is for auxiliary nurses’ aver-age hourly earnings.
With average monthly earnings the spread for physicians is much largerthan for monthly wages, with the CV doubling. In Costa Rica the very highfemale percentage for average monthly earnings (170 per cent) is due in partto the fact that women physicians work an average of 60 hours a week com-pared with a male average of only 45 hours. The excess for average hourlyearnings was only 29 per cent. For dentists, however, though the range is con-siderably reduced, the CV falls only a little, indicating that while there hasbeen a marked reduction in the highest female percentage and a small rise inthe minimum, the others have widened; in only one country is the female per-centage for monthly earnings larger than 100.
The female percentages for average monthly earnings are more variedthan for average hourly earnings for physicians, dentists and professional nurses.They are a little less dispersed for auxiliary nurses and considerably less dif-ferentiated for X-ray technicians, where the CV is less than half that for hourlyearnings. The unweighted average female percentage is, however, less than100 for both average hourly and monthly earnings and, on the whole, womendo less well than men in average monthly earnings. This may well be becausemen work longer hours and so presumably receive more overtime pay whichhas a greater effect on monthly than on hourly earnings.
In general, the results for medical occupations are not surprising. Whilethe overall female percentage for the two nursing occupations for wages andthe associated occupations of physiotherapists and X-ray technicians are slightlybelow 100, the overall difference is very small and totally compatible with
Differences in occupational earnings by sex 17
men and women being on a common salary scale with the difference attribut-able to seniority differences. The size of the minimum and maximum femalepercentage is also compatible with a not excessively broad common salaryscale.
With physicians, the overall average female percentage is consistent withcommon salary scales but the low minimum percentages in Nigeria raise somequestion as to whether male and female physicians there are even on the samesalary scale. Even so, in three countries average female wages are higher thanaverage male wages. With dentists, the overall female average percentage ofboth hourly and monthly wages is greater than 100.
Women dentists, professional nurses and X-ray technicians do less wellwhen hourly earnings are measured and even less well with monthly earnings.For all occupations there are fewer countries with female percentages greaterthan 100 for monthly earnings.
Inter-country variation
With both physicians and dentists the wide range and CVs indicate thatthere is considerable variation between the different countries and that the useof a single overall average female percentage of male pay would be mislead-ing. Using slightly different data, for example, the United Kingdom data for1996 rather than for 1995, similar results are found by using the standarderror of the mean (sem) as a percentage of the mean or overall average femalepercentage.8 The sem is a measure of how far the overall average female per-centage obtained from a sample is a good estimate of the overall average fe-male percentage of the whole population of all countries. It estimates the reli-ability of the sample overall average female percentage by taking into accountthe variation of the different countries’ female percentages and the number ofcountries included, i.e. the size of the sample. Expressing the sem as a per-centage of the overall average female percentage obtained from the differentcountries covered by the OEI data gives another measure of how far the fe-male percentage varies from country to country for a given occupation and fordifferent measures of pay. The smaller the sem percentage, the more closelythe countries’ individual female percentages bunch together.
To avoid complications and possibly misleading results from very smallsamples, most analysis was limited to occupations and pay measures for whichthere were at least ten countries. Three medical occupations satisfied this cri-terion: general physicians, professional nurses and auxiliary nurses. Generalphysicians have relatively large sem percentages, compared with both profes-sional and auxiliary nurses. The smallest of all is for average hourly wages forprofessional nurses, with a sem percentage of 1.372. With the exception ofmonthly wages and earnings for auxiliary nurses, the sem percentages for av-erage earnings are always larger than the corresponding figures for average
8 The standard error of the mean is calculated as a one-sample t-test which is then ex-pressed as a percentage of the unweighted mean of the different countries’ female percentages.
International Labour Review18
wages. Auxiliary nurses have the lowest sem percentages for both hourly andmonthly earnings of any of the three medical occupations.
For the two nursing occupations there is much less variation betweencountries, with the exception of average monthly earnings for professionalnurses. The situation is similar for auxiliary nurses. There is relatively smallvariation between countries, the average of the female percentages is close to100 and is 101.2 per cent for average hourly earnings. Somewhat unusually,average monthly earnings are less dispersed than average hourly earnings.
Average hourly wages for female physiotherapists are higher than formales in three of the six countries examined although the unweighted averageof all the percentages is only 98 per cent. For monthly wages, the female per-centages in four of the seven countries are higher than 100 and the average is100.3 per cent. Even so, the female percentages range from three-quarters ofmale wages to more than a quarter as high again.
Female X-ray technicians have higher average wages than male for bothhourly and monthly wages, although in only three of the nine countries dowomen have higher average wages than men. Fewer countries provide infor-mation about average earnings but women tend to do a little worse on earningsthan on wages.
It is clear that differences in the occupational pay of men and womenvary according to the measure of pay adopted. In some cases it may be reason-able to conclude that differences in average monthly wages of men and womenin the same occupation reflect differences in the average seniority or place onan incremental salary scale of men and women. Comparisons of the pay ofmen and women using average monthly earnings reveal the largest dispersionamong countries but cover up significant differences in hours worked. Wherewomen work fewer hours than men involuntarily, and fewer hours explain thegap in earnings, one may infer that women are particularly disadvantaged, andit suggests greater gender-based discrimination than do the other measures.
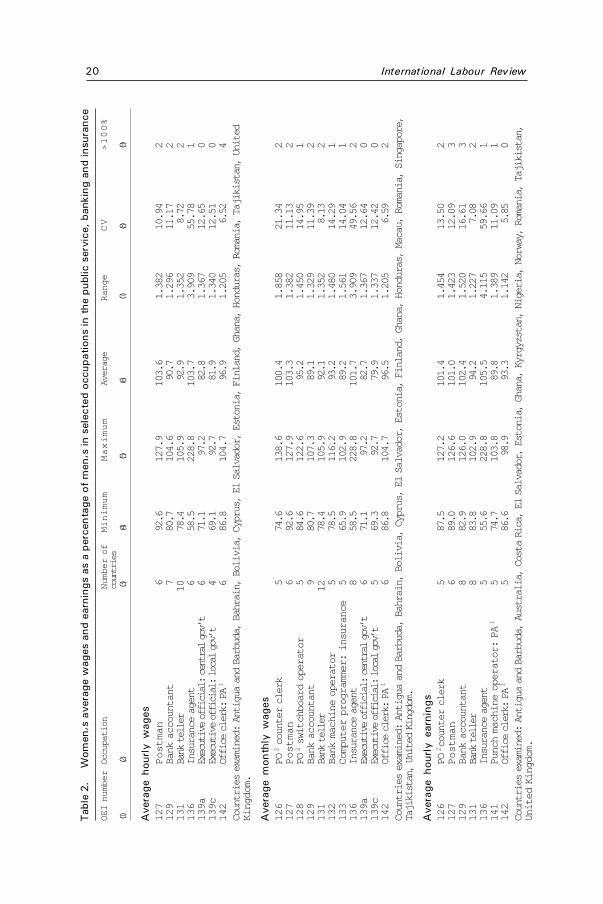
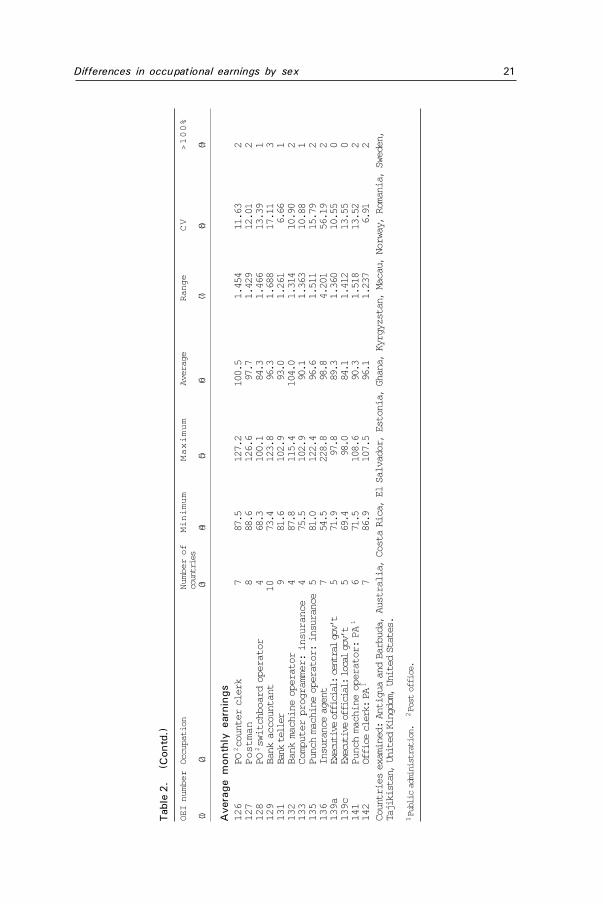
Public service, banking and insuranceSimilar information for certain occupations in public services (e.g. postal
services or public administration (PA)) and in insurance and banking is shownin table 2.
The variation for both PA office clerks and bank tellers is usually quitesmall for both range and CV. The obvious interpretation is that in most, if notall, countries there is a single incremental salary scale for these occupationsand differences in men’s and women’s pay reflect seniority and possibly somelocation payments. The average monthly wage of female PA office clerks inGhana is 87 per cent that of males. If a single salary scale applies for Ghanaianmale and female office clerks and the scale maximum is more than 15 per centhigher than the minimum, it is possible but not necessarily established that allthis difference is due to seniority. The largest difference in favour of women isin Finland where female office clerks earn average hourly and monthly wages5 per cent higher than those of men. If the pay arrangements for this occupa-
Differences in occupational earnings by sex 19
tion include all salary increments, it is possible that this difference in favour ofwomen simply reflects higher average seniority of female PA office clerks.
While the overall female percentages for both hourly and monthly wagesare less than 100 for bank tellers and in only two countries is the female per-centage larger than 100, the range of the individual female percentages is quiteconsistent with common salary scales that at the extreme have a spread of 28per cent between scale minimum and maximum. Both the range and CV aresmall for bank tellers on all measurements of pay. Though different banks mayhave a common salary scale for tellers in some countries, this is not the caseeverywhere. Interestingly, the overall female percentage for average earningsfor bank tellers is a little higher than for average wages, and the CVs are lower.This is also the case with the sem percentage for average monthly earningswhich is lower than that for both average hourly and monthly wages and al-though only nine countries provide details of average monthly earnings fortellers, the figure has been used for comparative purposes and ought to bereasonably acceptable. Bank teller is not an obviously “female” occupation,yet women do better on average earnings than on average wages. The variationof the female percentages for both average hourly and monthly earnings forbank accountants is somewhat higher than for tellers; this could be because adifferent salary scale applies in each bank in each country for this occupation,or because different categories of accountants with varying levels of qualifica-tions and/or experience are subsumed under a single occupational heading.The sem percentage for bank accountants’ average monthly earnings is morethan twice as large as that for tellers.
The variation for postmen9 and central government executive officialstends to be a little higher, but again could be within the range of the occupa-tion’s salary scale, as could the differences for post office counter clerks andtelephone switchboard operators. Overall, postwomen have higher averagehourly and monthly wages and higher hourly earnings than postmen, and fe-male post office counter clerks have higher overall pay than men on all threemeasures of pay available, but in only two countries.
Somewhat surprisingly, perhaps, in no country do women executive offi-cials in either central or local government have higher average pay than men.Men and women working for central government should be on the same salaryscale and, in a number of countries, those working for local government, too.
The largest differences concern insurance agents, for which two obviousexplanations are possible. First, that this occupation is paid substantial propor-tions of total remuneration on a commission or piecework basis. Second, thatdifferent insurance companies have their own payment scales and systems sothere is no common salary scale. For both hourly and monthly wages, femaleinsurance agents have a higher average overall percentage than males, eventhough in only one country for hourly wages and in two for monthly wages dowomen actually earn higher average wages than men. The overall average is
9 The occupation is still listed as “postman” although women are employed in some coun-tries.
International Labour Review20Tab
le 2
.W
omen
�s a
vera
ge w
ages
and
ear
ning
s as
a p
erce
ntag
e of
men
�s in
sel
ecte
d oc
cupa
tion
s in
the
pub
lic s
ervi
ce, ba
nkin
g an
d in
sura
nce
OE
I num
ber
Occ
upat
ion
Num
ber o
fM
inim
um
Ma
xim
um
Ave
rage
Ran
geC
V>
10
0%
coun
tries
(1)(2
)(3
)(4
)(5
)(6
)(7
)(8
)(9
)
Ave
rage
hou
rly
wag
es12
7P
ost
man
692
.612
7.9
103.
61.
382
10.9
42
129
Ban
k acc
ount
ant
780
.710
4.6
90.7
1.29
611
.17
213
1Ba
nk tel
ler10
78.4
105.
992
.91.
352
8.72
213
6In
sura
nce
agen
t
658
.522
8.8
103.
73.
909
55.7
81
139a
Exec
utive
off
icial:
centr
al go
v’t
671
.197
.282
.81.
367
12.6
50
139c
Exec
utive
off
icial:
local
gov’t
4
69.1
92.7
81.9
1.34
012
.51
014
2O
ffice
clerk
: PA
1 6
86.8
104.
796
.91.
205
6.52
4C
ount
ries
exam
ined
: Ant
igua
an
d Bar
buda
, Bah
rain,
Bolivi
a,
Cyp
rus,
El
Salva
dor,
Eston
ia,
Finlan
d,
Gha
na,
Hon
dura
s,
Rom
ania,
Tajik
istan
, U
nite
dK
ingd
om.
Ave
rage
mon
thly
wag
es12
6P
O2
coun
ter
clerk
574
.613
8.6
100.
41.
858
21.3
42
127
Post
man
692
.612
7.9
103.
31.
382
11.1
32
128
PO
2 sw
itchb
oard
oper
ator
584
.612
2.6
95.2
1.45
014
.95
112
9B
ank a
ccou
ntan
t9
80.7
107.
389
.11.
329
11.3
92
131
Bank
tel
ler12
78.4
105.
992
.11.
352
8.13
213
2B
ank m
achi
ne op
erat
or5
78.5
116.
293
.21.
480
14.2
91
133
Com
pute
r pro
gram
mer
: insu
ranc
e5
65.9
102.
989
.21.
561
14.0
41
136
Insu
ranc
e ag
ent
858
.522
8.8
101.
73.
909
49.5
62
139a
Exec
utive
off
icial:
centr
al go
v’t6
71.1
97.2
82.7
1.36
712
.64
013
9cEx
ecutive
off
icial:
local
gov’t
569
.392
.779
.91.
337
12.4
20
142
Offic
e cle
rk:
PA 1
686
.810
4.7
96.5
1.20
56.59
2C
ount
ries
exam
ined
: Ant
igua
an
d Bar
buda
, Bah
rain,
Bolivi
a,
Cyp
rus,
El
Salva
dor,
Eston
ia,
Finlan
d,
Gha
na,
Hon
dura
s,
Mac
au,
Rom
ania,
Singa
pore
,Ta
jikist
an,
Unit
ed
King
dom
.
Ave
rage
hou
rly
earn
ings
126
PO
2 co
unte
r cle
rk5
87.5
127.
210
1.4
1.45
413
.50
212
7P
ost
man
689
.012
6.6
101.
01.
423
12.0
93
129
Ban
k acc
ount
ant
882
.912
6.0
102.
41.
520
16.6
13
131
Bank
tel
ler8
83.8
102.
994
.21.
227
7.08
213
6In
sura
nce
agen
t5
55.6
228.
810
5.5
4.11
559
.66
114
1P
unch
mac
hine
oper
ator
: PA
15
74.7
103.
889
.81.
389
11.0
91
142
Offic
e cle
rk:
PA
15
86.6
98.9
93.3
1.14
25.85
0C
ount
ries
exam
ined
: Ant
igua
an
d Bar
buda
, Aus
tralia
, C
osta
R
ica,
El
Salva
dor,
Eston
ia,
Gha
na,
Kyr
gyzs
tan,
N
iger
ia,
Nor
way
, R
oman
ia,
Tajik
istan
,U
nite
d Kin
gdom
.
Differences in occupational earnings by sex 21
Tab
le 2
.(C
ontd
.)
OE
I num
ber
Occ
upat
ion
Num
ber o
fM
inim
um
Ma
xim
um
Ave
rage
Ran
geC
V>
10
0%
coun
tries
(1)(2
)(3
)(4
)(5
)(6
)(7
)(8
)(9
)
Ave
rage
mon
thly
ear
ning
s12
6P
O2 co
unte
r cle
rk7
87.5
127.
210
0.5
1.45
411
.63
212
7P
ost
man
888
.612
6.6
97.7
1.42
912
.01
212
8P
O2 sw
itchb
oard
oper
ator
468
.310
0.1
84.3
1.46
613
.39
112
9B
ank a
ccou
ntan
t10
73.4
123.
896
.31.
688
17.1
13
131
Bank
tel
ler9
81.6
102.
993
.01.
261
6.66
113
2B
ank m
achi
ne op
erat
or4
87.8
115.
410
4.0
1.31
410
.90
213
3C
ompu
ter p
rogr
amm
er: in
sura
nce
475
.510
2.9
90.1
1.36
310
.88
113
5P
unch
m
achi
ne
oper
ator
: in
sura
nce
581
.012
2.4
96.6
1.51
115
.79
213
6In
sura
nce
agen
t7
54.5
228.
898
.84.
201
56.1
92
139a
Exec
utive
off
icial:
centr
al go
v’t5
71.9
97.8
89.3
1.36
010
.55
013
9cEx
ecutive
off
icial:
local
gov’t
569
.498
.084
.11.
412
13.5
50
141
Pun
ch m
achi
ne op
erat
or: P
A1
671
.510
8.6
90.3
1.51
813
.52
214
2O
ffice
clerk
: PA
17
86.9
107.
596
.11.
237
6.91
2C
ount
ries
exam
ined
: A
ntig
ua
and
Bar
buda
, A
ustra
lia,
Cos
ta
Rica
, E
l S
alva
dor,
Est
onia
, G
hana
, K
yrgy
zsta
n,
Mac
au,
Nor
way
, R
oman
ia,
Sw
eden
,Ta
jikist
an,
Unit
ed
King
dom
, U
nited
Sta
tes.
1Pu
blic
adm
inistr
ation
.2Po
st office.
International Labour Review22
pulled up by the very high figure for female insurance agents in Tajikistan,where they are paid 229 per cent of men’s wages.
For most of these occupations, especially in the public service, the differ-ences in average male and female pay could result from differences in senior-ity within a common salary scale. If this is the explanation, the question thenarises of why in so many cases women have lower average pay than men, asone would expect to find rather similar numbers of female percentages aboveand below 100. Short of examining all individuals in each country, a possibleanswer is that women often have lower average seniority in a given occupa-tion/grade because they have, on average, shorter periods of continuous em-ployment at any particular date as a result of career breaks for child-bearing orchild-rearing. But it may not be a result of a difference in seniority. In thebanking and insurance occupations, it is also possible that different employersapply different salary scales and that the male/female pay differential reflectsstructural differences in the composition of employment. However it is alsopossible that, despite a common salary scale in public service employment,pay includes certain other elements which favour men over women.
Suggestions of relative pay gaps across andwithin countriesInternational comparisons
Studies of the overall female wage gap have established that differencesbetween countries are often a function of the general wage structure. For ex-ample, if occupational differentials in the United States had been the same asin other countries, the overall female wage gap there would have been reducedto the same size as existed in Sweden and Australia, countries with small wagegaps (Blau and Kahn, 1996). In fact, the constancy of the male/female wagegap in the United States from the end of the Second World War up to 1975 waslargely due to the failure of women to increase their skills relative to men’s.The rise in women’s labour force participation led to more women with com-paratively low levels of education and work experience entering the labourmarket, thus diluting the women’s average skill levels compared with men’s(O’Neill, 1985; Smith and Ward, 1989; Goldin, 1989; O’Neill and Polachek,1993). From 1976 the gap declined by an average of 1 per cent a year. About athird of the convergence is explained by measurable work-related characteris-tics (education and work experience) and the remainder by a relative increasein women’s returns to experience, by declining wages in blue-collar work andby other factors.
Complications arising from the overall wage structure and wage inequal-ities are avoided if a narrowly-defined occupation is examined, as the questionof whether it involves high or low skills should not affect the relative pay of menand women. In a number of countries, some female-dominated occupations showvery similar female percentages. Thus, both professional and auxiliary nurseshave small sem percentages compared with the overall female percentages; other
Differences in occupational earnings by sex 23
measures of dispersion such as range and CV are also small for the female per-centages in the various countries covered. However, the main reason for this isprobably a common salary scale for men and women in each country.
There are some marked differences in the distribution of female percent-ages of pay in different countries. In El Salvador the female percentages forboth average hourly and monthly earnings range from 28 per cent for salesper-sons (wholesale grocery trade) to 208 per cent for journalists, with a CV of38.63 for average hourly earnings in 20 occupations. Nigeria has a smallerrange for both average hourly and monthly earnings percentages but a largerCV. Again in Nigeria, four occupations have female percentages of less than50 per cent while two are in excess of 150 per cent for average monthly earn-ings, and sewing machine operators have a female percentage for average hourlyearnings of 239 per cent. The CVs for 24 occupations in Nigeria are large forall four measures of pay, ranging from 43.33 for average monthly wages to49.14 for average hourly wages. At the other end of the spectrum, Finland hasa CV for 53 occupations of 8.42 for average hourly wages and of 8.35 foraverage monthly wages, with a range of only 1.492. Norway with only 20occupations has a CV of 3.48 for average monthly earnings and a range ofonly 1.178; 17 of those 20 occupations have a female percentage of between90 and 100 per cent. Australia with 74 occupations has low CVs for averagehourly and weekly earnings but only a few occupations with a female percent-age greater than 100.
Broadly, the industrialized market economies have a narrower spread offemale percentages and relatively smaller CVs, although the overall averagefemale percentage is usually less than 100. Both Australia and the United Stateshave some low female percentages and neither the United Kingdom nor theUnited States has an occupation with a female percentage equal to 100. Formercentrally planned economies tend to have larger CVs and ranges, with somecountries (e.g. Estonia and Romania) having a number of occupations wherethe female percentage is quite low, below 80 per cent. The exception is theRepublic of Moldova which has an overall female percentage greater than 100for three of the pay measures, but quite large CVs and ranges.
Of the two African countries, Ghana has relatively low CVs and rangesthat are about the same as those of Australia and the United States, while Ni-geria has large CVs and ranges and seven or eight out of 24 occupations withfemale percentages less than 60 per cent and one or two greater than 150 percent.
Three Latin American countries have quite large CVs and ranges, withsome very low female percentages. The spread for El Salvador is exception-ally wide, whereas Honduras has a variation somewhere between those of in-dustrialized market economies and former centrally planned economies.
The Asian countries vary. Tajikistan has CVs and ranges as wide as thethree Latin American countries and somewhat larger than the former centrallyplanned economies in Europe. Cyprus and Singapore have CVs which are simi-lar to those of Estonia and Romania, but smaller ranges. China has a widerange and a largish CV.
International Labour Review24
The higher female percentage for sewing machine operators may resultfrom piecework payment systems with women being more skilled in this oc-cupation. Those for both teachers and office clerks are almost certainly theresult of longer seniority of women in these occupations.
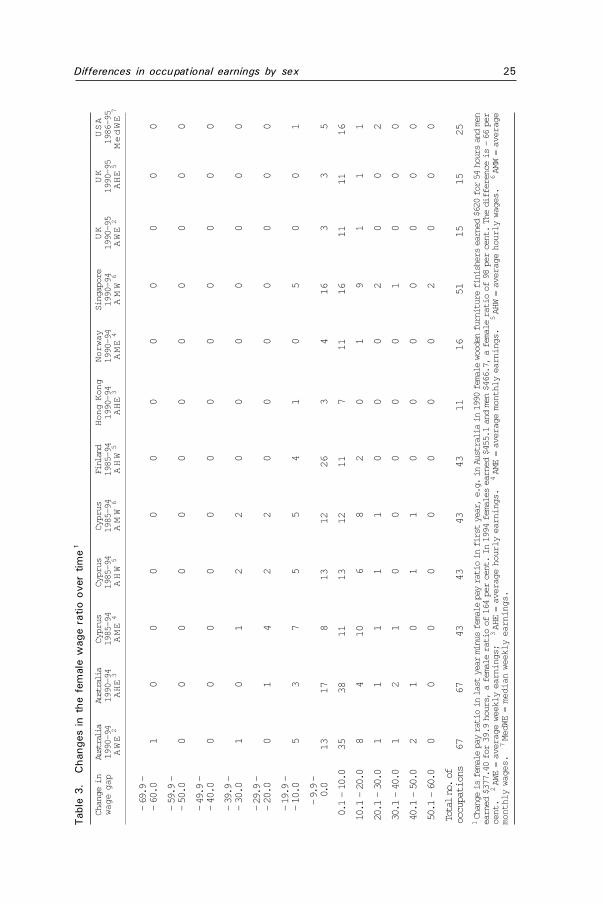
Time trendsFor a few countries details are available on a consistent basis and over a
number of years, so that it is possible to detect changes over time in femalepay as a percentage of male pay (see table 3).
Details of average hourly and weekly earnings for occupations in Aus-tralia were given for 1990 and 1994. The unweighted average of the femalepercentages increased only a little, from 85 to 88 per cent for average weeklyearnings, and from 88 to 90 per cent for average hourly earnings. There was atendency for average female earnings to move slightly closer to those of men;in some of the occupations showing the lowest female percentages in 1990these had moved up by 1994. There was also an increase in the number ofoccupations where women’s average earnings were higher than men’s.
Some occupations showed large changes in the female/male wage gap.Female wooden furniture finishers experienced a fall in the female pay ratiofor average weekly earnings from 164 per cent in 1990 to 98 per cent in 1994,which was almost entirely due to a reduction in the large amount of overtimeworked in 1990. The female ratio for average hourly wages fell by 27 percent-age points, from 121 to 94 per cent. The female pay ratio percentage for aver-age weekly earnings of thread and yarn spinners fell from 86 per cent in 1990to 54 per cent in 1994, mainly because in 1994 men worked an average of 54hours compared with only 40 hours for women. The ratio for average hourlyearnings fell only 16 percentage points from 89 to 73 per cent. The hourlywage percentage also fell.
The female ratio for average hourly wages for automobile mechanics rosefrom 62 per cent in 1990 to 108 per cent in 1994 and for plumbers from 66 to96 per cent while the female ratio for average weekly earnings for plumbersrose from 61 to 102 per cent. The ratio for air traffic controllers increased from83 to 111 per cent for average weekly earnings and from 81 to 114 per cent foraverage hourly earnings. Australia is somewhat unusual in that women havehigher average earnings than men in a number of occupations.
In Cyprus, over the period 1985-94 there was a decrease in the femalepercentage in about half of the 43 occupations examined, so that average fe-male pay as a proportion of male pay fell; there was an increase in about halfthe occupations examined. The female ratio for both hourly and monthly wagesof telephone operators fell from 131 per cent in 1985 to 94 per cent in 1994and for average monthly earnings from 115 to 94 per cent. The female per-centage for hourly and monthly wages of office clerks in electric light andpower fell from 86 per cent in 1985 to 54 per cent in 1994 and for averagemonthly earnings. Such a low female wage percentage as obtained in 1994 isseldom consistent with men and women being in the same occupational grade
Differences in occupational earnings by sex 25Tab
le 3
.C
hang
es in
the
fem
ale
wag
e ra
tio
over
tim
e1
Cha
nge i
nAu
stralia
Austr
aliaC
ypru
sC
ypru
sC
ypru
sFin
land
Hong K
ong
Norw
ay
Sin
gapo
reU
KU
KU
SA
wag
e ga
p19
90-9
419
90-9
419
85-9
419
85-9
419
85-9
419
85-9
419
90-9
419
90-9
419
90-9
419
90-9
519
90-9
519
86-9
5A
WE
2A
HE
3A
ME
4A
HW
5A
MW
6A
HW
5A
HE
3A
ME
4A
MW
6A
WE
2A
HE
5M
ed
WE7
–69
.9 -
–60
.01
00
00
00
00
00
0
–59
.9 -
–50
.00
00
00
00
00
00
0
–49
.9 -
–40
.00
00
00
00
00
00
0
–39
.9 -
–30
.01
01
22
00
00
00
0
–29
.9 -
–20
.00
14
22
00
00
00
0
–19
.9 -
–10
.05
37
55
41
05
00
1
–9.9
-
0.013
178
1312
263
416
33
5
00.1
- 10
.035
3811
1312
117
1116
1111
16
10.1
- 20
.08
410
68
20
19
11
1
20.1
- 30
.01
11
11
00
02
00
2
30.1
- 40
.01
21
00
00
01
00
0
40.1
- 50
.02
10
11
00
00
00
0
50.1
- 60
.00
00
00
00
02
00
0
Total
no.
ofoc
cupa
tions
6767
4343
4343
1116
5115
1525
1C
hang
e is
fem
ale
pay
ratio
in
last
year
m
inus
fem
ale
pay
ratio
in
first
year
, e.
g.
in Aus
tralia
in
1990
fem
ale
woo
den
furn
iture
fin
isher
s ea
rned
$6
20 f
or
54 h
ours
an
d m
enea
rned
$3
77.4
0 fo
r 39
.9
hour
s,
a fe
mal
e ra
tio
of
164
per
cent
. In
19
94 f
emal
es
earn
ed
$455
.1
and
men
$46
6.7,
a
fem
ale
ratio
of
98
per
ce
nt.
The
diffe
renc
e is
–66
per
cent
.2
AW
E =
ave
rage
wee
kly e
arni
ngs;
3A
HE
= ave
rage
hou
rly ear
ning
s.4
AM
E =
ave
rage
mon
thly
ear
ning
s.5
AH
W =
ave
rage
hou
rly w
ages
.6
AM
W =
ave
rage
mon
thly
wag
es.
7M
edW
E =
med
ian
wee
kly e
arni
ngs.
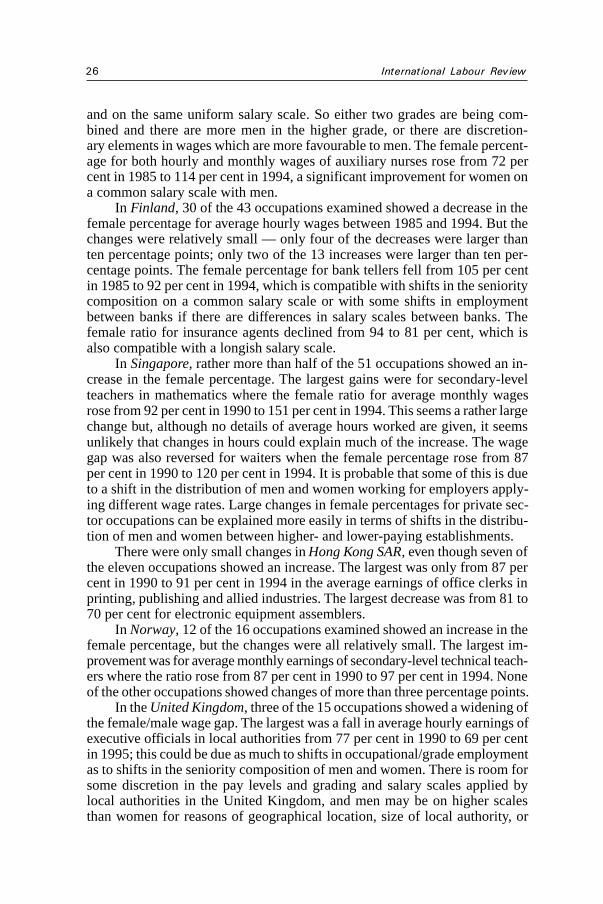
International Labour Review26
and on the same uniform salary scale. So either two grades are being com-bined and there are more men in the higher grade, or there are discretion-ary elements in wages which are more favourable to men. The female percent-age for both hourly and monthly wages of auxiliary nurses rose from 72 percent in 1985 to 114 per cent in 1994, a significant improvement for women ona common salary scale with men.
In Finland, 30 of the 43 occupations examined showed a decrease in thefemale percentage for average hourly wages between 1985 and 1994. But thechanges were relatively small — only four of the decreases were larger thanten percentage points; only two of the 13 increases were larger than ten per-centage points. The female percentage for bank tellers fell from 105 per centin 1985 to 92 per cent in 1994, which is compatible with shifts in the senioritycomposition on a common salary scale or with some shifts in employmentbetween banks if there are differences in salary scales between banks. Thefemale ratio for insurance agents declined from 94 to 81 per cent, which isalso compatible with a longish salary scale.
In Singapore, rather more than half of the 51 occupations showed an in-crease in the female percentage. The largest gains were for secondary-levelteachers in mathematics where the female ratio for average monthly wagesrose from 92 per cent in 1990 to 151 per cent in 1994. This seems a rather largechange but, although no details of average hours worked are given, it seemsunlikely that changes in hours could explain much of the increase. The wagegap was also reversed for waiters when the female percentage rose from 87per cent in 1990 to 120 per cent in 1994. It is probable that some of this is dueto a shift in the distribution of men and women working for employers apply-ing different wage rates. Large changes in female percentages for private sec-tor occupations can be explained more easily in terms of shifts in the distribu-tion of men and women between higher- and lower-paying establishments.
There were only small changes in Hong Kong SAR, even though seven ofthe eleven occupations showed an increase. The largest was only from 87 percent in 1990 to 91 per cent in 1994 in the average earnings of office clerks inprinting, publishing and allied industries. The largest decrease was from 81 to70 per cent for electronic equipment assemblers.
In Norway, 12 of the 16 occupations examined showed an increase in thefemale percentage, but the changes were all relatively small. The largest im-provement was for average monthly earnings of secondary-level technical teach-ers where the ratio rose from 87 per cent in 1990 to 97 per cent in 1994. Noneof the other occupations showed changes of more than three percentage points.
In the United Kingdom, three of the 15 occupations showed a widening ofthe female/male wage gap. The largest was a fall in average hourly earnings ofexecutive officials in local authorities from 77 per cent in 1990 to 69 per centin 1995; this could be due as much to shifts in occupational/grade employmentas to shifts in the seniority composition of men and women. There is room forsome discretion in the pay levels and grading and salary scales applied bylocal authorities in the United Kingdom, and men may be on higher scalesthan women for reasons of geographical location, size of local authority, or
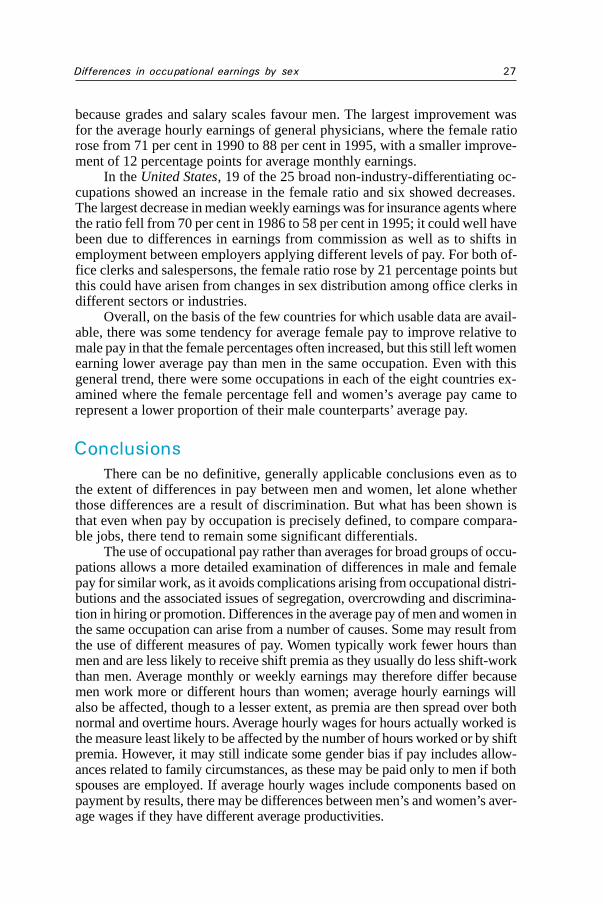
Differences in occupational earnings by sex 27
because grades and salary scales favour men. The largest improvement wasfor the average hourly earnings of general physicians, where the female ratiorose from 71 per cent in 1990 to 88 per cent in 1995, with a smaller improve-ment of 12 percentage points for average monthly earnings.
In the United States, 19 of the 25 broad non-industry-differentiating oc-cupations showed an increase in the female ratio and six showed decreases.The largest decrease in median weekly earnings was for insurance agents wherethe ratio fell from 70 per cent in 1986 to 58 per cent in 1995; it could well havebeen due to differences in earnings from commission as well as to shifts inemployment between employers applying different levels of pay. For both of-fice clerks and salespersons, the female ratio rose by 21 percentage points butthis could have arisen from changes in sex distribution among office clerks indifferent sectors or industries.
Overall, on the basis of the few countries for which usable data are avail-able, there was some tendency for average female pay to improve relative tomale pay in that the female percentages often increased, but this still left womenearning lower average pay than men in the same occupation. Even with thisgeneral trend, there were some occupations in each of the eight countries ex-amined where the female percentage fell and women’s average pay came torepresent a lower proportion of their male counterparts’ average pay.
ConclusionsThere can be no definitive, generally applicable conclusions even as to
the extent of differences in pay between men and women, let alone whetherthose differences are a result of discrimination. But what has been shown isthat even when pay by occupation is precisely defined, to compare compara-ble jobs, there tend to remain some significant differentials.
The use of occupational pay rather than averages for broad groups of occu-pations allows a more detailed examination of differences in male and femalepay for similar work, as it avoids complications arising from occupational distri-butions and the associated issues of segregation, overcrowding and discrimina-tion in hiring or promotion. Differences in the average pay of men and women inthe same occupation can arise from a number of causes. Some may result fromthe use of different measures of pay. Women typically work fewer hours thanmen and are less likely to receive shift premia as they usually do less shift-workthan men. Average monthly or weekly earnings may therefore differ becausemen work more or different hours than women; average hourly earnings willalso be affected, though to a lesser extent, as premia are then spread over bothnormal and overtime hours. Average hourly wages for hours actually worked isthe measure least likely to be affected by the number of hours worked or by shiftpremia. However, it may still indicate some gender bias if pay includes allow-ances related to family circumstances, as these may be paid only to men if bothspouses are employed. If average hourly wages include components based onpayment by results, there may be differences between men’s and women’s aver-age wages if they have different average productivities.
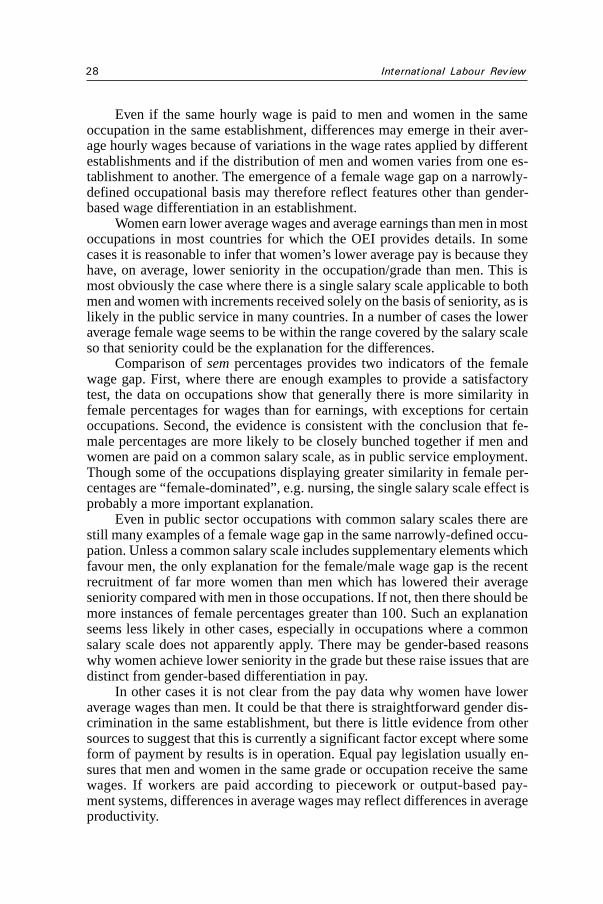
International Labour Review28
Even if the same hourly wage is paid to men and women in the sameoccupation in the same establishment, differences may emerge in their aver-age hourly wages because of variations in the wage rates applied by differentestablishments and if the distribution of men and women varies from one es-tablishment to another. The emergence of a female wage gap on a narrowly-defined occupational basis may therefore reflect features other than gender-based wage differentiation in an establishment.
Women earn lower average wages and average earnings than men in mostoccupations in most countries for which the OEI provides details. In somecases it is reasonable to infer that women’s lower average pay is because theyhave, on average, lower seniority in the occupation/grade than men. This ismost obviously the case where there is a single salary scale applicable to bothmen and women with increments received solely on the basis of seniority, as islikely in the public service in many countries. In a number of cases the loweraverage female wage seems to be within the range covered by the salary scaleso that seniority could be the explanation for the differences.
Comparison of sem percentages provides two indicators of the femalewage gap. First, where there are enough examples to provide a satisfactorytest, the data on occupations show that generally there is more similarity infemale percentages for wages than for earnings, with exceptions for certainoccupations. Second, the evidence is consistent with the conclusion that fe-male percentages are more likely to be closely bunched together if men andwomen are paid on a common salary scale, as in public service employment.Though some of the occupations displaying greater similarity in female per-centages are “female-dominated”, e.g. nursing, the single salary scale effect isprobably a more important explanation.
Even in public sector occupations with common salary scales there arestill many examples of a female wage gap in the same narrowly-defined occu-pation. Unless a common salary scale includes supplementary elements whichfavour men, the only explanation for the female/male wage gap is the recentrecruitment of far more women than men which has lowered their averageseniority compared with men in those occupations. If not, then there should bemore instances of female percentages greater than 100. Such an explanationseems less likely in other cases, especially in occupations where a commonsalary scale does not apparently apply. There may be gender-based reasonswhy women achieve lower seniority in the grade but these raise issues that aredistinct from gender-based differentiation in pay.
In other cases it is not clear from the pay data why women have loweraverage wages than men. It could be that there is straightforward gender dis-crimination in the same establishment, but there is little evidence from othersources to suggest that this is currently a significant factor except where someform of payment by results is in operation. Equal pay legislation usually en-sures that men and women in the same grade or occupation receive the samewages. If workers are paid according to piecework or output-based pay-ment systems, differences in average wages may reflect differences in averageproductivity.
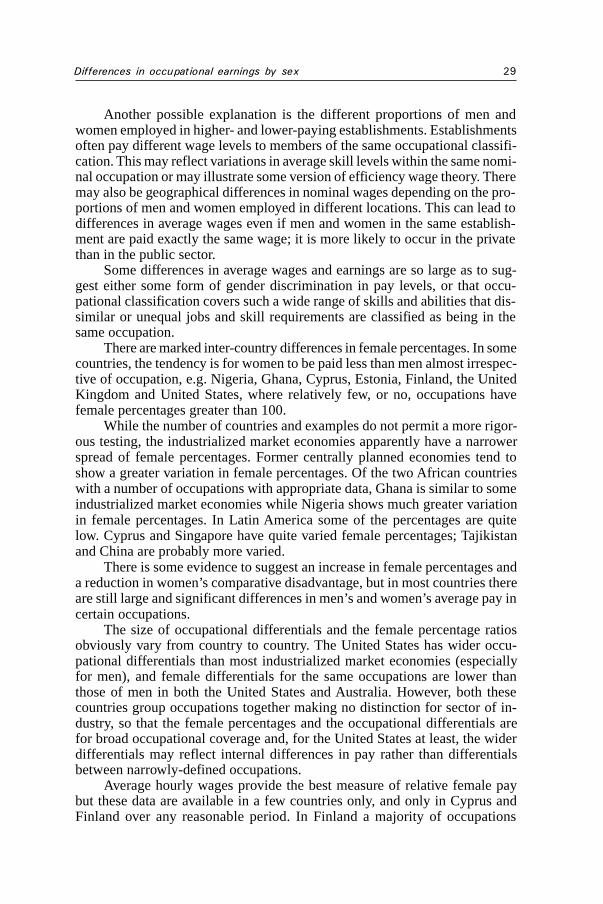
Differences in occupational earnings by sex 29
Another possible explanation is the different proportions of men andwomen employed in higher- and lower-paying establishments. Establishmentsoften pay different wage levels to members of the same occupational classifi-cation. This may reflect variations in average skill levels within the same nomi-nal occupation or may illustrate some version of efficiency wage theory. Theremay also be geographical differences in nominal wages depending on the pro-portions of men and women employed in different locations. This can lead todifferences in average wages even if men and women in the same establish-ment are paid exactly the same wage; it is more likely to occur in the privatethan in the public sector.
Some differences in average wages and earnings are so large as to sug-gest either some form of gender discrimination in pay levels, or that occu-pational classification covers such a wide range of skills and abilities that dis-similar or unequal jobs and skill requirements are classified as being in thesame occupation.
There are marked inter-country differences in female percentages. In somecountries, the tendency is for women to be paid less than men almost irrespec-tive of occupation, e.g. Nigeria, Ghana, Cyprus, Estonia, Finland, the UnitedKingdom and United States, where relatively few, or no, occupations havefemale percentages greater than 100.
While the number of countries and examples do not permit a more rigor-ous testing, the industrialized market economies apparently have a narrowerspread of female percentages. Former centrally planned economies tend toshow a greater variation in female percentages. Of the two African countrieswith a number of occupations with appropriate data, Ghana is similar to someindustrialized market economies while Nigeria shows much greater variationin female percentages. In Latin America some of the percentages are quitelow. Cyprus and Singapore have quite varied female percentages; Tajikistanand China are probably more varied.
There is some evidence to suggest an increase in female percentages anda reduction in women’s comparative disadvantage, but in most countries thereare still large and significant differences in men’s and women’s average pay incertain occupations.
The size of occupational differentials and the female percentage ratiosobviously vary from country to country. The United States has wider occu-pational differentials than most industrialized market economies (especiallyfor men), and female differentials for the same occupations are lower thanthose of men in both the United States and Australia. However, both thesecountries group occupations together making no distinction for sector of in-dustry, so that the female percentages and the occupational differentials arefor broad occupational coverage and, for the United States at least, the widerdifferentials may reflect internal differences in pay rather than differentialsbetween narrowly-defined occupations.
Average hourly wages provide the best measure of relative female paybut these data are available in a few countries only, and only in Cyprus andFinland over any reasonable period. In Finland a majority of occupations
International Labour Review30
(30 out of 43) had a fall in the female percentage over the period 1985-94, asdid a slight majority in Cyprus (22 out of 43). In many cases, taking the occu-pations as a whole, there are not, in fact, major differences in the female per-centages according to different measures of pay, but the percentages for anindividual occupation can vary according to the measure used.
The recent continuation or enlargement of female wage gaps in publicservice employment in some countries may arise from the spread of personalassessment as the basis for granting annual wage increases, since women tendto do less well under this sort of payment system. The continuation of femalewage gaps in occupations which are seen as entry grades into strong publicservice internal labour markets (e.g. office clerks) should give cause for someconcern, if the lower average female seniority within the grade is caused bywomen’s greater propensity to leave. If, however, it is caused by women’sgreater propensity to be promoted, this might be indicative of attempts to re-dress a past imbalance between men’s and women’s promotion opportunities.
What this article has shown is that there still are significant pay differ-ences between men and women workers even when considering very compa-rable categories. Women still tend to receive lower average pay than men inthe same occupation.
ReferencesAldrich, Mark; Buchele, Robert. 1986. The economics of comparable worth. Cambridge, MA,
Ballinger Pub. Co.Anker, Richard. 1997. “Theories of occupational segregation by sex”, in International Labour
Review (Geneva), Vol. 136, No. 3, pp. 315-339.Bergmann, B. 1974. “Occupational segregation, wages and profits when employers discriminate
by race or sex”, in Eastern Economic Journal (Smithfield, RI), Vol. 1, pp. 103-110.Blau, Francine D. 1977. Equal pay in the office. Lexington, MA, Heath.—.; Beller, Andrea H. 1988. “Trends in earnings differentials by gender: 1971-1981”, in Industrial
and Labor Relations Review (Ithaca, NY), Vol. 41, No. 4, pp. 513-529.—.; Kahn, Lawrence M. 1996. “Wage structure and gender earning differentials: An internatio-
nal comparison”, in Economica (Oxford), Vol. 63, No. 250 (supplement), pp. S29-S62.Borooah, V. K.; Lee, K. C. 1988. “The effects of changes in Britain’s industrial structure on
female relative pay and employment”, in Economic Journal (Oxford), 98, pp. 818-832.Cain, Glen G. 1986. “The economic analysis of labor market discrimination: A survey”, in
Orley Ashenfelter and Richard Layard (eds.): Handbook of labor economics. Vol. 1, Amster-dam, North Holland.
Colclough, Christopher (ed.). 1997. Public-sector pay and adjustment: Lessons from fivecountries. London, Routledge.
Ehrenberg, Ronald G.; Smith, Robert S. 1987. “Comparable worth in the public sector”, inDavid Wise (ed.): Public sector payrolls. Chicago, IL, University of Chicago Press.
England, Paula. 1992. Comparable worth: Theories and evidence. New York, Aldine de Gruyter.Fields, Judith; Wolff, Edward N. 1991. “The decline of sex segregation and the wage gap, 1970-
80”, in Journal of Human Resources (Madison, WI), Vol. 26, No. 4, pp. 608-622.Goldin, Claudia. 1989. “Life-cycle labour force participation of married women: Historical
evidence and implications”, in Journal of Labor Economics (Chicago, IL), Vol. 7, No. 1,pp. 20-47.
Gonzalez, Pablo; Watts, Martin J. 1995. Measuring gender wage differentials and job segregation.IDP Women Working Paper No. 24. Geneva, ILO.
Differences in occupational earnings by sex 31
Grimshaw, Damian; Rubery, Jill. 1998. The concentration of women’s employment and relativeoccupational pay: A statistical framework for comparative analysis. Labour Market andSocial Policy Occasional Papers No. 26, OECD/GD(97)186. Paris, OECD.
Groshen, Erica L. 1991. “The structure of the female/male wage differential: Is it who you are,what you do, or where you work?”, in Journal of Human Resources (Madison, WI),Vol. 26, Summer, pp. 457-472.
Gunderson, Morley. 1989. “Male-female wage differentials and policy response”, in Journal ofEconomic Literature (Nashville, TN), Vol. 27 (March), pp. 46-72.
—. 1975. “Male-female wage differentials and the impact of equal pay legislation”, in Review ofEconomics and Statistics (Cambridge, MA), Vol. 57, No. 4, pp. 462-469.
Hill, M. Anne; O’Neill, June E. 1992. “Intercohort change in women’s labor market status”, inR. G. Ehrenberg (ed.): Research in labor economics, Vol. 13. Greenwich, CT, Jai Pr.
ILO. 1997. “Part-time work: Solution or trap?”, in International Labour Review (Geneva),Vol. 136, No. 4, pp. 559-581.
—. 1996. Statistics on occupational wages and hours of work and on food prices: OctoberInquiry results, 1994 and 1995. Special supplement to the Bulletin of Labour Statistics.Geneva.
Killingsworth, Mark R. 1990. The economics of comparable worth. Kalamazoo, MI, W. E. UpjohnInstitute for Employment Research.
Lofstrom, Asa; Gustafsson, Siv. 1991. “Policy changes and women’s wages in Sweden”, inInternational Review of Comparative Public Policy (Greenwich, CT), Vol. 3, pp. 313-330.
Macpherson, David A.; Hirsch, Barry T. 1995. “Wages and gender composition: Why do women’sjobs pay less?”, in Journal of Labor Economics (Chicago, IL), Vol. 13, No. 3, pp. 426-471.
Malkiel, Burton G.; Malkiel, Judith A. 1973. “Male-female pay differentials in professionalemployment”, in American Economic Review (Nashville, TN), Vol. 63, No. 4, pp. 693-705.
Mincer, Jacob; Ofek, Haim. 1982. “Interrupted work careers: Depreciation and restoration ofhuman capital”, in Journal of Human Resources (Madison, WI), Vol. 17, No. 1, pp. 3-24.
—.; Polachek, Solomon. 1974. “Family investments in human capital: Earnings of women”, inJournal of Political Economy (Chicago, IL), Vol. 82, No. 2, Part II, pp. S76-S108.
Moulton, Brent R. 1986. “Human capital accumulation and trends in male-female wage gap inthe United States, 1956-83”, in Eastern Economic Journal (Smithfield, RI), Vol. 12,No. 3, pp. 265-271.
O’Neill, June. 1985. “The trend in the male-female wage gap in the United States”, in Journal ofLabor Economics (Chicago, IL), Vol. 3, No. 1, Part 2, pp. S91-S116.
—.; Polachek, Solomon. 1993. “Why the gender gap in wages narrowed in the 1980s”, in Jour-nal of Labor Economics (Chicago, IL), Vol. 11, No. 1, Part 1, pp. 205-228.
Smith, James P.; Ward, Michael P. 1989. “Women in the labor market and in the family”, inJournal of Economic Perspectives (Nashville, TN), Vol. 3, No. 1, pp. 9-23.
Sorensen, Elaine. 1990. “The crowding hypothesis and comparable worth issue”, in Journal ofHuman Resources (Madison, WI), Vol. 25, No. 1, pp. 55-89.
—. 1989. “Measuring the pay disparity between typically female occupations and other jobs: Abivariate selectivity approach”, in Industrial and Labor Relations Review (Ithaca, NY),Vol. 42, No. 4, pp. 624-639.
Treiman, Donald; Hartmann, Heidi (eds.). 1981. Women, work and wages: Equal pay for jobs ofequal value. Washington, DC, National Academy Press.
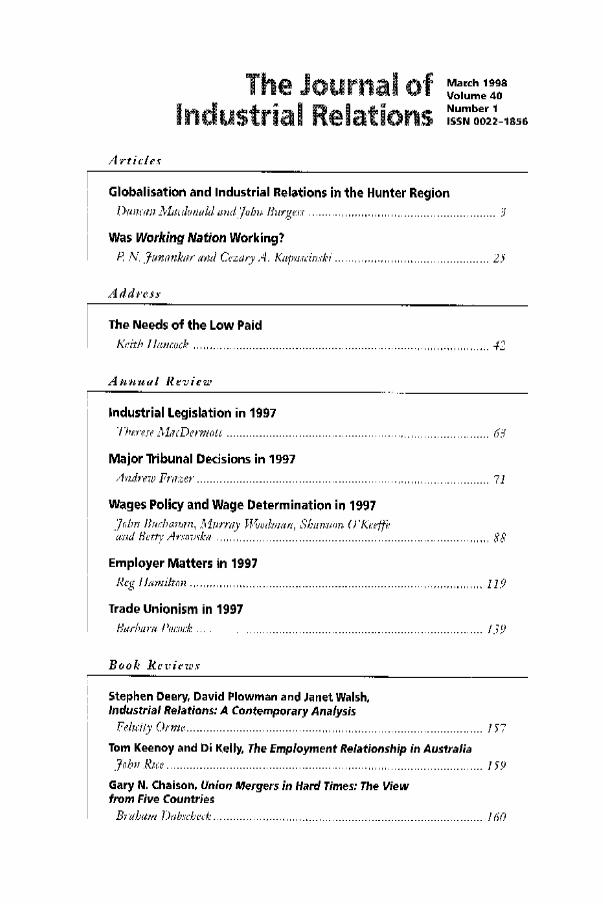
International Labour Review32