Embed Size (px)
Citation preview
MICROSCOPY RESEARCH AND TECHNIQUE 25:68-77 (1993)
Differences of Size and Shape of Active and Inactive X-Chromosome Domains in -Human Amniotic Fluid Cell Nuclei A. BISCHOFF, J. ALBERS, I. KHARBOUSH, E. STELZER, T. CREMER, AND C. CREMER Institute of Applied Physics (A.B., C.C.), Institute of Human Genetics and Anthropology (J.A., I.K., T.C.), and Interdisciplinary Centre for Scientific Computing (IWR) (C.C.), University of Heidelberg and European Molecular Biology Laboratory (EMBL) (E.S.) , D-6900 Heidelberg, Federal Republic of Germany
KEY WORDS
ABSTRACT It is a widely held belief that the inactive X-chromosome (Xi) in female cell nuclei is strongly condensed as compared to the largely decondensed active X-chromosome (Xa). We have reconsidered this problem and painted X-chromosome domains in nuclei of subconfluent, female and male human amniotic fluid cell cultures (46,XX and 46,XY) by chromosomal in situ suppres- sion (CISS) hybridization with biotinylated human X-chromosome specific library DNA. FITC- conjugated avidin was used for probe detection and nuclei were counterstained with propidium iodide (PI). The shape of these nuclei resembling flat ellipsoids or elliptical cylinders makes them suitable for both two-dimensional (2D) and three-dimensional (3D) analyses. 2D analyses of Xi- and Xa-domains were performed in 34 female cell nuclei by outlining of the painted domains using a camera lucida. Identification of the sex chromatin body in DAPI-stained nuclei prior to CISS- hybridization was confirmed by its colocalization with one of the two painted X-domains. In 31 of the 34 nuclei the area Axi for the inactive X-domain was smaller than the area A,, for the active domain (mean ratio Ax,/Ax, = 1.9 * 0.8 SD, range 1.0-4.3). The signed rank test showed a highly significant (P < .0001) difference both between A,, and Axi and between the ratios r(Xa) and r(Xi), calculated by dividing the maximum length L of each X-domain by its maximum width W. In most nuclei (26134) we found r(Xa)>r(Xi) demonstrating a generally more elongated structure of Xa. For 3D analysis a confocal scanning laser fluorescence microscope (CSLFM) was used. Ten to 20 light optical sections (PI-image, FITC-image) were registered with equal spacings (approx. 0.4 pm). A thresholding procedure was applied to determine the PI-labeled nuclear and FITC-labeled X-do- main areas in each section. Estimated slice volumes were used to compute total nuclear and X-domain volumes. In a series of 35 female nuclei most domains extended from the top to the bottom nuclear sections. The larger of the two X-chromosome domains comprised (3.7 t 1.7 S.D.)% of the nuclear volume. A mean ratio of 1.2 k 0.2 SD (range 1.1-2.3) was found for the volumes of the larger and the smaller X-domains in these female nuclei. In a series of 27 male amniotic fluid cell nuclei the relative X-chromosome domain volume comprised (4.0 t 2.6 S.D.)%. These findings indicate that differences in the 3D expansion of active and inactive X-chromosome domains are less pronounced than previously thought. A current model suggests that chromosome domains consist of a compact core surrounded by loosely coiled outer chromatin fiber loops. The latter fraction may be considerably larger in Xa- as compared to Xi-domains. We suggest that the interactive outlining procedure used in the 2D analyses included the loosely structured domain periphery more accu- rately, while the threshold algorithm applied to light optical sections delineated the more compact core of the domains, leading to smaller and more similar volume estimates of Xa and Xi. Present limitations of nuclear and chromosome domain volume measurements using confocal laser scan- ning microscopy are discussed.
INTRODUCTION
TO date Our knowledge of the actual three-dimen- sional shape and volume of individual chromosomes in the interphase nucleus has been very limited. It has been widelv assumed that euchromatic Darts of each
Female cell nuclei, Xa, CISS, Confocal microscopy
o 1993 Wiley-Liss, Inc.
throughout a major part or even the entire cell nucleus with attachment sites at opposite parts of the nuclear envelope (Comings, 1968; Vogel and Schroeder, 1974).
chromosome become interphase
decondensed when the is being formed' Some authors pro- Received May 17, 1992; accepted in revised form June 2, 1992.
Address reprint requests to C. Cremer, Institute of Applied Physics, Univ. of posed that its constituting chromatin fiber is extended Heidelberg, Albert-Uberle-StraRe 3-5, D-6900 Heidelberg, FRG.
0 1993 WILEY-LISS. INC

Xi- AND Xa-DOMAINS IN FEMALE CELL NUCLEI 69
In contrast, already at the end of the last century cy- tologists such as Carl Rabl and Theodor Boveri hypoth- esized that individual chromosomes in the interphase nucleus would form distinct territories, so-called chro- mosome domains (for review, see Cremer, 1985). This old hypothesis has been confirmed experimentally in recent years. First, laser-UV-microbeam studies were applied to follow microirradiated chromatin in living Chinese hamster cells cultured in vitro throughout the cell cycle. Microirradiated chromatin was detected ei- ther by autoradiography (following incorporation of 3H-thymidine during unscheduled DNA synthesis) (Zorn et al., 1979; Cremer et al., 1982) or by indirect immunofluorescence with antibodies specific for UV- irradiated DNA (Cremer et al., 1984; Hens et al., 1983). These experiments demonstrated that chromatin mi- croirradiated at any small part of the interphase nu- cleus was composed of a few chromosome segments only. Conversely, chromosomes microirradiated during metaphase and anaphase were recognized as distinct domains in the resulting daughter nuclei. Second, chro- mosomal in situ hybridization (“chromosome paint- ing”) has made possible the direct visualization of chro- mosome domains both in mammalian and plant cell nuclei (Cremer et al., 1988; Leitch et al., 1991; Lichter et al., 1988; Manuelidis, 1985; Pinkel e t al., 1986,1988; Schardin et al., 1985). To date the existence of chromo- some domains has been established in human somatic cell nuclei for all chromosome types using chromosome specific DNA libraries as probes.
Attempts to investigate the shape and volume of in- dividual chromosome domains or defined chromosomal subregions in more detail have been very limited so far (Geiger et al., 1991; Lichter et al., 1988; Popp et al., 1990; van Dekken et al., 1989). In this study we have attempted size and shape measurements of painted X-chromosome domains in cell nuclei of normal diploid, female, and male amniotic fluid cell cultures applying conventional fluorescence microscopy, confocal scan- ning laser fluorescence microscopy (CSLFM) (Braken- hoff et al., 1979, 1985; Cremer and Cremer, 1978; Stelzer et al., 1985, 1986; for review, see Shotton, 1989), and image analysis. Amniotic fluid cell nuclei resemble flat ellipsoids or flat cylinders with an ellip- tic base. Their flatness and large two-dimensional ex- tension makes them particularly suitable to compare two-dimensional (2D) and three-dimensional (3D) im- age analyses procedures. It has been suggested that both the condensation state and shape of individual X-chromosome domains might be correlated with their overall genetic activity (for review, see Gartler et al., 1992). During early development in each female so- matic cell one of the two X-chromosomes becomes ge- netically largely inactivated (Xi), while the other re- mains genetically active (Xa) (Lyon, 1961; for review see Gartler et al., 1992). Xi can be identified in the cell nucleus as a compact structure, known as the sex chro- matin body (Barr and Bertram, 1949; Dyer et al., 1989). It has often been implicated that the sex chro- matin body seen in the light microscope represents the whole Xi, although it may comprise only a part of it (Gartler et al., 1992; Ohno and Hauschka, 1960; Ther- man and Patau, 1974; Therman et al., 1976; Walker et
al., 1991). A widely held view assumes that Xa is largely decondensed as compared to the strongly con- densed Xi.
MATERIALS AND METHODS Cell Culture and Fixation
Human amniotic fluid cell cultures with normal male and female karyotypes (46,XX and 46,XY) were established after diagnostic amniocentesis (Dept. of Obstetrics and Gynecology, University of Heidelberg) and kindly provided by Dr. H.D. Hager (Popp et al., 1990). Slides containing subconfluent cultures (pas- sage 1-3) were fixed with 4% paraformaldehyde in PBS (140 mM NaC1, 2.7 mM KC1, 5 mM MgCl,, 1.5 mM KH,PO,, 6.5 mM Na2HP0,; adjusted to pH 7.0) for 5 min. Cells were washed in PBS, 5 min, permeabilized with Triton X-lOO/Saponin in PBS (0.1% each; 2 x 5 m i d , and washed in 0.1 M Tris-HC1 (pH 7.21, 5 min. Slides were stored in PBS with sodiumazide (0.04%) a t 4°C until use.
Sex Chromatin Body Identification In some experiments, the visualization of the genet-
ically inactive X-chromosome was achieved prior to in situ hybridization by staining with 4’,6-diamidino-2- phenyl indole (DAPI) (Dyer et al., 1989). Staining for 5-10 min at a concentration of 3.8 mM in PBS yielded a sex chromatin body in >70% of female amniotic fluid cell nuclei observed with a Zeiss Fluorescence micro- scope I11 equipped for epifluorescence. Nuclei in which a single DAPI-stained sex chromatin body was clearly distinguishable were photographed using Agfachrome 1000 RS films and their coordinates were documented for further evaluation after CISS-hybridization (see be- low). DNA Probe, Probe Labeling, and Preparation of
the Hybridization Mixture The human X chromosome plasmid library pBSX
was obtained as a gift from Dr. Joe Gray, University of California, San Francisco (Collins et al., 1991). Library DNA was prepared and labeled with Bio-ll-dUTP (Sigma, St. Louis, MO, Cat. No. B-7645) by nick trans- lation using the BRL nick translation kit (Bethesda Research Laboratories, Bethesda, MD; Cat. No. 8160SB). The biotinylated probe (1 pg per slide) was ethanol precipitated together with 10 pg human ge- nomic DNA and 20 pg salmon testis DNA. The vac- uum-dried pellet was dissolved in 5 pl deionized for- mamide and 5 p1 mastermix containing 10% dextran sulfate (Pharmacia, Uppsala, Sweden; Cat. No.17- 0340-01) in 2 x SSC (0.3 M sodium chloride, 0.03 M sodium citrate, pH 7.0).
Pretreatment of Cells and Chromosomal In Situ Suppression (CISS) Hybridization
At any time of the pretreatment and CISS-hybrid- ization procedure (Lichter et al., 1988, with modifica- tions described below) drying of the cells was carefully avoided. Cells were digested with 0.1% pepsin (Sigma, Cat. No. P-6887) in aqua bidest adjusted to pH 2.0 a t 37°C for 5 to 10 min until visual inspection indicated that most of the cytoplasm was removed. After two

70 A. BISCHOFF ET AL.
Fig. 1. a: Two female amniotic fluid cell nuclei stained with DAPI prior to CISS hybridization. b: The same nuclei after painting of the X-chromosome domains. Arrows indicate the colocalization of one domain with the predetermined sex chromatin body.
brief washings, once in aqua bidest and once in PBS, postfixation was performed in 1% formaldehyde in PBS at 4°C for 20 min. After two additional brief washings the chromosomal DNA was denatured in 70% forma- mide, 2 x SSC at 75°C for 3 min. For probe denatur- ation, the hybridization mixture (see above) was heated a t 75°C for 5 min. Preannealing of labeled and unlabeled repetitive sequences was performed at 37°C for 30 min. Preannealed hybridization mixture (10 pl) was applied to the slides after carefully draining excess fluid (without letting them dry). Slides were covered with a 18 x 18 mm coverslip and incubated in a moist chamber a t 37°C for a t least 16 hr. Thereafter slides were washed in 50% formamide, 2 x SSC (3 x 5 min, 45"C), and 0.1 x SSC (3 x 5 min, 60°C). Blocking was performed for 20 min a t 37°C in 4 x SSC containing 0.2% Tween 20 and 1% bovine serum albumin fraction V (Serva, Heidelberg, FRG, Cat. No. 11930). All sub- sequent incubations (37°C) with FITC-conjugated avi-
din and antibodies, respectively, and washes (45°C) were carried out with 4 x SSC/O.l% Tween 20. Detec- tion of the biotinylated probe was achieved by incuba- tion (45 min) with avidin conjugated to fluorescein isothiocyanate (FITC) (diluted 1:200) (Vector Labora- tories, Cat. N0.A-2011). For signal amplification the slides were incubated (45 min) with biotin-conjugated goat anti-avidin antibodies (diluted 1:200) (Vector Lab- oratories; Cat. No. BA-0300) followed by another incu- bation in FITC-labeled avidin for 30 min. Slides were counterstained with DAPI (200 ngiml) and propidium iodide (1 pg/ml) for 5 min at room temperature and mounted in fluorescence antifading buffer (Johnson and Araujo, 1981).
2D Evaluation of Chromosome Domains After CISS-hybridization female nuclei with defined
Barr bodies (see above) were relocalized and again pho- tographed. Using a camera lucida attached to a Zeiss

Xi- AND Xa-DOMAINS IN FEMALE CELL NUCLEI 71
TABLE 1. Two-dimensional analysis of female human amniotic f luid cell nuclei (n = 34) with painted X-domains
Mean value f SD Range A,, nuclear area (a.u.)' 328 t 136 113-657 A,,,,, area of the active X-domain (a.u.I2 21.9 ? 8.0 10-45 A,,,,, area of the inactive X-domain (a.u.j' 11.1 ? 5.0 6-28 A,,,,IA, (a1 7.4 t 3.0' A&AN (%I 4.0 f 1.7l 1.0-9.5 r(2D) = A,,,,IA,,,, 1.9 ? 0.8 1.0-4.3 L,,,,, maximum length of X, (a.u.j 7.9 f 1.8 4.5-12.0 W,,,,, maximum width of X, (a.u.1 4.3 ? 1.2 2.0-7.8 L,,,,, maximum length of X, (a.u.j 5.3 -c 1.2 3.6-8.4 W,,,,, maximum width of X, (a.u.) 3.7 ? 0.8 3.0-6.2 r(Xa) = L,x,,mix,, 1.9 ? 0.6l 1.4-4.2 r(Xi) = Lo,,MT,xi, 1.4 f 0.4l 1.0-2.3 L,, maximum length of the nucleus (a.u.1 WN, maximum width of the nucleus (a.u.)
'Ao,, and A,,,,, as well as r(Xa) and r(Xi) are significantly different (P < ,0001) according to the signed rank test for related measurements (same nucleus).
2.4-15.2
29.2 f 7 17.2-44.4 18.0 f 3.8 10.4-26.0
Fluorescence microscope I11 both X-domains were en- circled by a smoothly fitting curve. The edge of the domain was defined arbitrarily in a way which in- cluded the more diffusely painted domain periphery as completely as possible. Enlarged drawings were digi- tized using a digital graphic tablet (VIDS IV image analysis system (A1 TEKTRON Mefisysteme GmbH, Meerbusch, F.R.G.) and further evaluated in an IBM- compatible personal computer. For each nucleus, the total nuclear area AN, the areas of the active (Xa), and the inactive (Xi) X-chromosomes, the maximum lengths L and the maximum widths W of both Xa and Xi were determined in arbitrary units a.u. and (a.u.)', respectively. One a.u. was calculated to correspond to about one pm.
3D Recording of Chromosome Domains 3D microscopy was performed using a confocal scan-
ning laser fluorescence microscope (CSLFM) equipped with an argon ion laser described in detail elsewhere (Stelzer et al., 1986). The microscope objective used was a Zeiss planapochromat 100 x 11.3, corrected for infin- ity. The lateral resolution was determined by Ray- leigh's criterion s,, = 0.25 pm. The optimum discrim- ination along the z-axis was estimated as S, = 0.5 pm. For the recording of the FITC-stained X-chromosome domains in PI-stained nuclei both dyes were excited at 488 nm. The fluorescence emissions (maximum at 590 nm for PI and a t 530 nm for FITC) were separated by appropriate filters and dichroic mirrors and registered simultaneously by two photomultipliers followed by two separate amplification systems. For each recorded nucleus amplification gains were individually set for a medium nuclear section in a way that a similar bright- ness was achieved for both the PI- and FITC-fluoresc- ing areas. Digitization was performed with an accuracy of 8 bits on a DATA translation DT 2861 frame grab- ber. To obtain a better signal-to-noise ratio, each line was scanned 16 times and averaged. For each optical section two fluorescence images of 512 x 512 pixels each were registered. The distance between two adja- cent sections was approximately 0.4 pm. For each cell, one stack comprising between 12 and 18 sections was obtained for the entire nucleus (PI-fluorescence) and a
second stack for the X-chromosome domains (FITC-f lu- orescence). The time needed to complete all sections for a given nucleus was approximately 10 min. The data were transferred to an IBM compatible personal com- puter and stored on an optical disk (Sony MO Disk Unit NWP-559). For each nucleus 6-10 MBytes of data were recorded.
3D-Image Analysis Volume estimates of both the X-chromosome do-
mains and the cell nuclei were accomplished using dig- ital image analysis on an IBM compatible personal computer with an Intel 80386 microprocessor and a 25 MHz clock. Programmes were written in Turbo C + + for representation, filtering, segmentation, counting, and surveying of the PI-fluorescence and FITC-f luores- cence images. For each nucleus a segmentation thresh- old THO used for all sections was determined interac- tively in the following way. The same low pass filter (Rosenfeld and Kak, 1982) was applied to the PI-fluo- rescence and FITC-fluorescence images of a medium nuclear section. Thereafter the images were segmented using an arbitrarily chosen threshold TH; the thresh- olded images were added to the low pass filter images and inspected for the similarity of the respective nu- clear and domain areas. The threshold TH was modi- fied until (for THO) the greatest similarity was ob- served. THO was then used for all optical sections of the nucleus. In each optical section, areas of contiguous pixels with gray values smaller than a defined thresh- old THO were determined separately for both the PI- and FITC-f luorescence images. Pixels were considered contiguous if they had contact on a t least one side or one corner. For automatic counting of the thresholded areas, the image matrix was scanned column by col- umn until the first pixel fulfilling the threshold condi- tion appeared. Starting from this position, all contigu- ous pixels having gray levels smaller than or equal to THO were evaluated. To identify irregular shaped ar- eas as contiguous, the search-routine scanned the im- age column by column and line by line both forward and backward. To avoid a false or double recognition of pixels each identified pixel was marked at its first rec- ognition. When no more new areas were found, the

72 A. BISCHOFF ET AL.
X a a m / nuclear area I6
..................................................................................................................... I a 14-
..................................
............................
................................. ........................................
2 4 6 8 10 12 14 16 I 8 20 22 24 26 28 30 32 34 identification numher of nucleus
"1 9 b I I 1
2 4 6 8 10 12 I4 16 18 20 22 24 26 28 30 32 34 identification number of nucleus
r 2 D (Xa / X i )
i n "I 8 I 3 2 4 I - I 1 301 ...................
"I.
identification number of nuclerls
Fig. 2. Relative domain areas of Xa and Xi (Ao,)AN (%) and A,,,,iA, (%I; compare Table 1) in 34 female amniotic fluld cell nuclei. Ordinates: (a) relative domain areas of Xa; (b) relative domain areas of XI; ( c ) ratios r(2D) = A,,,,IA,,,,. Abscissa: identification number of evaluated nucleus.
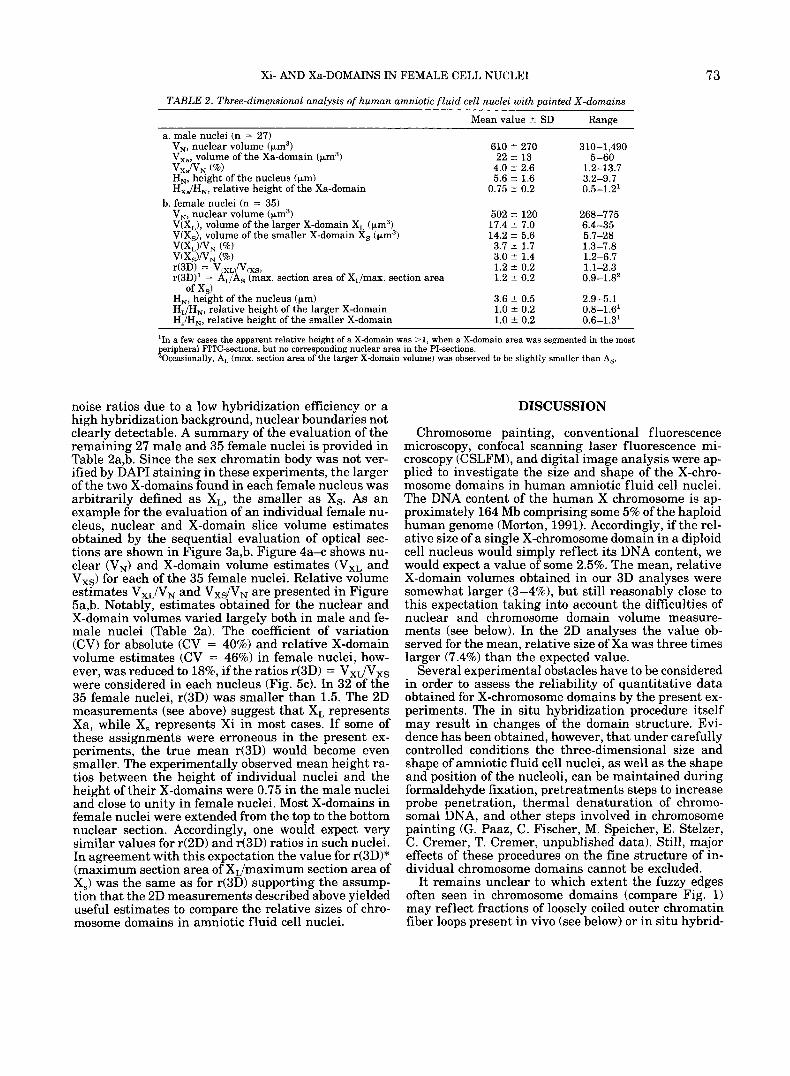
search-routine listed the areas in number of pixels. The sum of the contiguous pixels was used to calculate the size of each segmented area. Using the magnification factors known from the instrumental set up, these area figures were converted into pm2. For each optical sec- tion slice volumes were estimated for the correspond- ing nuclear and X-domain sections by multiplication of the segmented areas with the distance between two subsequent optical sections. Finally, the nuclear vol- umes VN and the volumes V(xL) and V(xs) of the larger and the smaller X-chromosome domains (in female nu- clei), as well as V,, (in male nuclei) were obtained by summing up the "slice volumes." From the individual values, the mean ? standard deviation (SD) was cal- culated.
RESULTS Colocalization of DAPI-Stained Sex Chromatin
Bodies and Painted Xi-Domains Figure l a shows DAPI images of two typical female
amniotic fluid cell nuclei with clearly visible sex chro- matin bodies identified prior to CISS-hybridization. Figure l b presents the corresponding painted X-chro- mosome domains. In both nuclei, the core of the appar- ently smaller domain colocalizes with the sex chroma- tin body (arrows) and thus defines Xi. Colocalization of the sex chromatin body with one of the two painted X-domains was observed in all nuclei (n = 34) micro- photographed prior to CISS-hybridization thus con- firming the reliability of the sex chromatin body iden- tification in DAPI-stained nuclei. Notably, the edge of the DAPI-stained sex chromatin body often appeared more distinct as compared to the more fuzzy edge of the painted Xi-domain surrounding the sex chromatin body like a small halo in image overlays (not shown).
2D Measurements of Xi and Xa Domains Xa-domains generally appeared more extended,
more variable in shape and more inhomogeneously painted than Xi-domains. A summary of 2D measure- ments obtained for 34 nuclei with predetermined sex chromatin bodies is provided in Table 1. Ratio mea- surements r(Xa) and r(Xi), dividing the maximum length L by the width W of the Xa- and Xi-domains, showed a highly significant (P < .0001) difference in the shape of these domains (Table 1). In most nuclei (26/34) we found r(Xa) > r(Xi) indicating a more elon- gated structure of the Xa-domain. Figure 2 shows the relative areas of Xa (A(X,)/AN (%)) (Fig. 2a) and Xi (Aoi,/AN (%I) (Fig. 2b), as well as the respective ratios r(2D) = A,,,,/Aoi) (Fig. 2c) for each evaluated nucleus. In 31 of the 34 nuclei the size of Xa was larger than the size of Xi with a mean ratio of 1.9 ? 0.8 SD (range 1.0 to 4.3).
3D Measurements of X-Domain Volumes Fifty female and 50 male amniotic fluid cell nuclei
with painted X-chromosome domains were serially sec- tioned using the CSLFM. Fifteen female and 23 male nuclei were excluded from further evaluation for one or several of the following reasons, including apparently incomplete hybridizations, unacceptably low signal-to-
Xi- AND Xa-DOMAINS IN FEMALE CELL NUCLEI 73
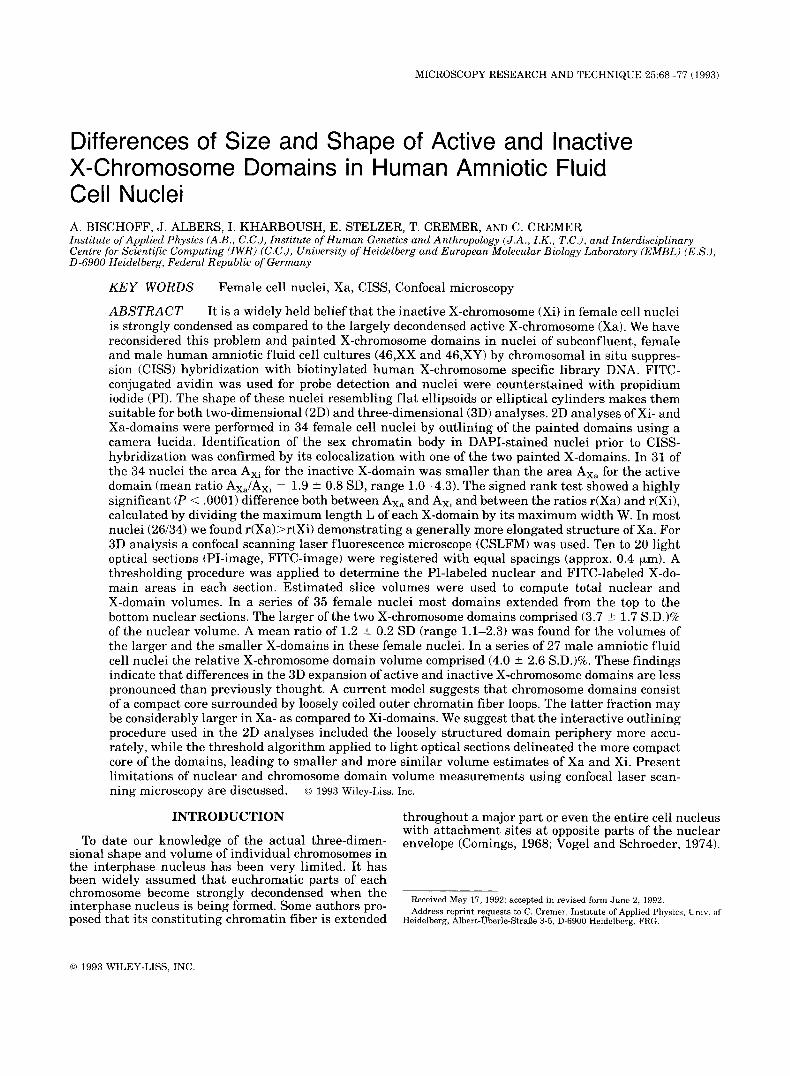
TABLE 2. Three-dimensional analysis of human amniotic fluid cell nuclei with nainted X-domains ~ ~ ~~~
Mean value ? SD Range a. male nuclei (n = 27)
V , nuclear volume (pm3) 610 5 270 310-1,490
VxaNN (9'00) 4.0 ? 2.6 1.2-13.7 H,, height of the nucleus (km) 5.6 2 1.6 3.2-9.7 Hx,/H,, relative height of the Xa-domain 0.75 ? 0.2 0.5-1.2l
V,, nuclear volume (km3) 502 f 120 268-775 V(X,), volume of the larger X-domain X, (pm3) 17.4 5 7.0 6.4-35 V(Xs), volume of the smaller X-domain X, (pm3) 14.2 5 5.6 5.7-28 V(X,)NN (%) 3.7 ? 1.7 1.3-7.8 V(XS)" (%) 3.0 t 1.4 1.2-6.7 r(3D) = Vo,P,xs , 1.2 t 0.2 1.1-2.3 r(3D)l = AL/As (max. section area of X,/max. section area
H,, height of the nucleus (pm) 3.6 t 0.5 2.9-5.1 HJH,, relative height of the larger X-domain HJH,, relative height of the smaller X-domain
Vz,, volume of the Xa-domain (km3) 22 t 13 5-60
b. female nuclei (n = 35)
1.2 t 0.2 0.9-1.8' of X,)
1.0 t 0.2 0.8-1.6l 1.0 f 0.2 0.6-1.3l
'In a few cases the apparent relative height of a X-domain was >1, when a X-domain area was segmented in the most
%wasionally, A ( m a . section area of the larger X-domain volume) was observed to be slightly smaller than A,. eripheral FITC-sections, but no corresponding nuclear area in the PI-sections.
noise ratios due to a low hybridization efficiency or a high hybridization background, nuclear boundaries not clearly detectable. A summary of the evaluation of the remaining 27 male and 35 female nuclei is provided in Table 2a,b. Since the sex chromatin body was not ver- ified by DAPI staining in these experiments, the larger of the two X-domains found in each female nucleus was arbitrarily defined as XL, the smaller as Xs. As an example for the evaluation of an individual female nu- cleus, nuclear and X-domain slice volume estimates obtained by the sequential evaluation of optical sec- tions are shown in Figure 3a,b. Figure 4a-c shows nu- clear (V,) and X-domain volume estimates (VxL and Vxs) for each of the 35 female nuclei. Relative volume estimates VXLNN and VxsNN are presented in Figure 5a,b. Notably, estimates obtained for the nuclear and X-domain volumes varied largely both in male and fe- male nuclei (Table 2a). The coefficient of variation (CV) for absolute (CV = 40%) and relative X-domain volume estimates (CV = 46%) in female nuclei, how- ever, was reduced to ls%, if the ratios r(3D) = VxLNxs were considered in each nucleus (Fig. 5c). In 32 of the 35 female nuclei, r(3D) was smaller than 1.5. The 2D measurements (see above) suggest that XL represents Xa, while X, represents Xi in most cases. If some of these assignments were erroneous in the present ex- periments, the true mean r(3D) would become even smaller. The experimentally observed mean height ra- tios between the height of individual nuclei and the height of their X-domains were 0.75 in the male nuclei and close to unity in female nuclei. Most X-domains in female nuclei were extended from the top to the bottom nuclear section. Accordingly, one would expect very similar values for r(2D) and r(3D) ratios in such nuclei. In agreement with this expectation the value for r(3D)" (maximum section area of XL/maximum section area of X,) was the same as for r(3D) supporting the assump- tion that the 2D measurements described above yielded useful estimates to compare the relative sizes of chro- mosome domains in amniotic fluid cell nuclei.
DISCUSSION
Chromosome painting, conventional fluorescence microscopy, confocal scanning laser fluorescence mi- croscopy (CSLFM), and digital image analysis were ap- plied to investigate the size and shape of the X-chro- mosome domains in human amniotic fluid cell nuclei. The DNA content of the human X chromosome is ap- proximately 164 Mb comprising some 5% of the haploid human genome (Morton, 1991). Accordingly, if the rel- ative size of a single X-chromosome domain in a diploid cell nucleus would simply reflect its DNA content, we would expect a value of some 2.5%. The mean, relative X-domain volumes obtained in our 3D analyses were somewhat larger (3-4%), but still reasonably close to this expectation taking into account the difficulties of nuclear and chromosome domain volume measure- ments (see below). In the 2D analyses the value ob- served for the mean, relative size of Xa was three times larger (7.4%) than the expected value.
Several experimental obstacles have to be considered in order to assess the reliability of quantitative data obtained for X-chromosome domains by the present ex- periments. The in situ hybridization procedure itself may result in changes of the domain structure. Evi- dence has been obtained, however, that under carefully controlled conditions the three-dimensional size and shape of amniotic fluid cell nuclei, as well as the shape and position of the nucleoli, can be maintained during formaldehyde fixation, pretreatments steps to increase probe penetration, thermal denaturation of chromo- somal DNA, and other steps involved in chromosome painting (G. Paaz, C. Fischer, M. Speicher, E. Stelzer, C. Cremer, T. Cremer, unpublished data). Still, major effects of these procedures on the fine structure of in- dividual chromosome domains cannot be excluded.
It remains unclear to which extent the fuzzy edges often seen in chromosome domains (compare Fig. 1) may reflect fractions of loosely coiled outer chromatin fiber loops present in vivo (see below) or in situ hybrid-

74
I b ............................................................................................ ” ... ̂
A. BISCHOFF ET AL.
.....................................................................................................................
25
2 0
1 5
1 0
il 5
0 0
2 :I 4 5 6 7 B 9 1 0 1 1 1 2 optical section number
optical section nnniher
!sQ X I , Xs
Fig. 3. Variation of slice volumes with the section number in a typical female amniotic fluid cell nucleus (14 light optical sections). a: Nuclear slice volumes (PI-staining). The total volume estimate was 492 km3. b: X-domain slice volumes (FITC-staining). Total volumes of 13.7 and 12.2 Fm:’, respectively, were estimated for the larger (X,) and smaller domain (Xs).
ization artifacts. These fractions may be considerably larger in Xa- than in Xi-domains and may have es- caped our notice in light optical domain sections. If so, the threshold algorithm applied to these sections delin- eated rather the more compact core of the Xa- and Xi- domains (leading to smaller and more similar volume estimates), while the interactive outlining procedure used in the 2D analysis included the surrounding do- main specific DNA-halo more appropriately. An inde-
nuclear wlume ( pm3) ( 46, XX ) 600
la A
35
30
25
20
15
LO
5
0
identification number of nucleus
volume of X L ( pm 3 )
2 4 6 A 10 I2 14 16 I f l 20 22 24 26 26 30 32 34 identifiation number of nucleus
3 volume of xs ( pm )
25 ....................... , ............................... --I
2 4 6 A LO 12 14 16 1fl 20 22 24 26 28 30 32 34 identification number of nucleus
Fig. 4. Nuclear and X-domain volume estimates (Fm? in 35 fe- male nuclei (compare Table 2b). Ordinates: (a) total nuclear volume (VNk (b) volume of the larger X-domain X,; (c ) volume of the smaller X-domain X,. Abscissa: identification number of evaluated nucleus.

Xi- AND Xa-DOMAINS IN FEMALE CELL NUCLEI 75
" la B
.......... .. ....................... 6 '1 Lw - "_"" I
2 4 6 8 10 I 2 14 I6 18 20 22 24 26 28 30 32 34 identification number of nucleus
X volume / nuclear volume
.......................................
2 4 6 8 I D 12 14 I6 I 8 20 22 24 26 28 30 32 34 identifiation number of nucleus
2.5
2.0
1.5
1 .o
0.5
0.0
I C
2 4 6 8 10 I 2 I4 I6 I 8 20 22 24 26 28 30 32 34 identification number of nucleus
Fig. 5. Relative X-domain volumes (% of total nuclear volume) and X-domain volume ratios in 35 female amniotic fluid cell nuclei (compare Table 2b). Ordinates: (a) Relative volume of the larger X-do- main (V,,,,N, (%)); (b) relative volume of the smaller X-domain (V,,,,N, (%)I; (c) ratio r(3D) of the X,-domain volume divided by the X,-domain volume in the same nucleus. Abscissa: identification num- ber of evaluated nucleus.
pendent reexamination of the CSLFM data set ob- tained for female nuclei by another investigator indicated an intersubjective variability of THO of a few per cent only. Accordingly, differences in segmented domain sizes obtained by the two investigators were in the same order (B. Rinke, C. Cremer, unpublished re- sults). To compare the results of outlining and thresh- olding evaluation procedures more accurately studies have to be performed in the same set of nuclei. In ad- dition, chromosome painting protocols need to be fur- ther improved for a better definition of chromosome domain boundaries.
Absolute volume measurements critically depend on z-axis resolution and the accurate determination of the true distances between subsequent light optical sec- tions. Recently, Visser et al. (1992) have pointed out that the focal position of the laser beam in the z-axis does not simply reflect the respective, vertical move- ment of the object stage, but is moved over a smaller distance depending on the refractive index conditions. This effect could lead to an overestimate of both chro- mosome domain and nuclear volumes. Chromatic and spherical aberrations of the lenses, pinhole configura- tion, registration of PI- and FITC-fluorescence emis- sions by two detector and amplification systems are factors which contribute to the large coefficients of variation (CV) observed for both the absolute and the relative chromosome domain volumes. In spite of these difficulties it can be argued that in each individual nucleus resulting errors of volume measurement for each of two chromosome domains were positively cor- related. This may explain the decrease in the CV of the r(3D) measurements for Xa- and Xi-domains compared to the CVs of absolute and relative domain volume es- timates.
Both 2D and 3D ratio measurements consistently in- dicate that the difference in size of the two X-domains was less than twofold in most nuclei. These data argue against a widely held belief that the Xi-domain should be much smaller than the Xa-domain. For comparison, measurements of chromosome 1 domain areas in fe- male amniotic fluid cell nuclei (n = 48) yielded a mean ratio of 1.5 k 0.5 SD (larger domain area observed in each nucleus divided by the smaller domain area) (J. Schmidt and T. Cremer, unpublished data). As com- pared to the relative domain sizes of autosomes, addi- tional variability in the relative sizes of Xa- and Xi- domains can be expected in non-synchronized cultures due to the different replication timing of the active and inactive X-chromosome (Grumbach et al., 1963; Taylor, 1960). The fraction of S-phase nuclei was not deter- mined in the subconfluent cultures used for the 2D and 3D analyses. Assuming that the active X-chromosome in G1 and G2 nuclei would be roughly two times larger than the inactive X-chromosome, we would expect a difference up to four times in S-phase nuclei at a time when the Xa-domain is already largely replicated, while the Xi-domain is not. Interestingly, the largest ratio r(2D) observed in the present experiments was 4.3. For further tests it is possible to perform chromo- some painting in cultures pulse-labeled with bromode- oxyuridine (BrdU) and to discriminate between S-phase and non-S-phase nuclei with painted X-do- mains.
76 A. BISCHOFF ET AL.
A recent model of the three-dimensional structure of the Xi-domain has been based on high-voltage electron microscopy of the sex chromatin body (SCB) (Gartler et al., 1992). According to this model “the condensed SCB appears to be formed of two “arms,” one shorter than the other, which are juxtaposed so that the telomeres are in close association. The arms consist of loops that are in turn composed of strands. The dense chromatin is surrounded by less compact loops that appear to de- fine the nuclear space of the SCB. Consistent with these findings, Dyer et al. (1985) have described a “rib- bon” of nick-translatable chromatin in situ a t the pe- riphery of the sex chromatin body. Fluorescence in situ hybridization with Xptel- and Xqtel human specific DNA probes to hybrid cell lines containing active or inactive human X-chromosomes showed the telomeres of Xi-domains placed closely together in the interphase nucleus, while the mean distance observed between the telomers of Xa-domains was tenfold larger (Walker et al., 1991). The significant difference in the shape of Xa- and Xi-domains in human amniotic fluid cell nuclei observed in our present study is consistent with the above findings.
Krystosek and Puck (1990) have proposed a concept of “genome exposure.” According to this concept active genes should be localized preferentially at the nuclear periphery, while inactive genes are internally seques- tered. Experimental tests of this and other possible models of a three-dimensional, cell type specific ge- nome organization can now be envisaged depending on the availability of appropriate probe sets, as well as improvements of fluorescence in situ hybridization and quantitative CSLFM measurements.
ACKNOWLEDGMENTS We thank Dr. Joe W. Gray for providing the human
X-chromosome plasmid library, B. Rinke and R. Scharschmidt for contributions to the evaluation of the CSLFM data, and C. Fischer for advice in statistics. This work was supported by the Deutsche Forschungs- gemeinschaft (Cr 59114-1).
REFERENCES Barr, M.L., and Bertram, E.G. (1949) A morphological distinction
hetween neurones of the male and female and the behavior of the ~.~ .~~~ ~~~
nucleolar satellites during accelerated nucleoprotein synthesis. Na- ture, 163:676-677.
Brakenhoff, G.J., Blom, P.: and Barends, P. (1979) Confocal scanning light microscopy with high aperture immersion lenses. J. Microsc., 117:219-232.
Brakenhoff, G.J., van der Voort, H.T.M., van Spronsen, E.A., Linne- mans, W.A.M., and Nanninga, N. (1985) Three-dimensional chro- matin distribution in neuroblastoma nuclei shown by confocal scan- ning laser microscopy. Nature, 317:748-749.
Collins, C., Kuo, W.L., Segraves, R., Pinkel, D., Fuscoe, J., and Gray, J. W. (1991) Construction and characterization of plasmid libraries enriched in sequences from single human chromosomes. Genomics, 11:997-1006.
Comings, D.E. (1968) The rationale for an ordered arrangement of chromatin in the interphase nucleus. Am. J . Hum. Genet., 20:550- 560.
Cremer, T. (1985) Von der Zellenlehre zur Chromosomentheorie. Naturwissenschaftliche Erkenntnis und Theorienwechsel in der friihen Zell- und Vererbungsforschung. Springer-Verlag, Berlin, p. 384.
Cremer, C., and Cremer, T. (1978) Considerations on a laser-scan-
ning-microscope with high resolution and depth of field. Microsc. Acta, 81:31-44.
Cremer, T., Cremer, C., Baumann, H., Luedtke, E.-K., Sperling, K., Teuber, V., and Zorn, C. (1982) Rabl’s model ofthe interphase chro- mosome arrangement tested in Chinese hamster cells by premature chromosome condensation and laser-UV-microbeam experiments. Hum. Genet., 60:46-56.
Cremer, T., Baumann, H., Nakanishi, K., and Cremer, C. (1984) Cor- relation between interphase and metaphase chromosome arrange- ments as studied by laser-uv-microbeam experiments. In: Chromo- somes Today, 8. M.D. Bennet, A. Cropp, and U. Wolf, eds. Allan and Unwin, London, pp. 203-212.
Cremer, T., Lichter, P., Borden, J., Ward, D.C., and Manuelidis, L. (1988) Detection of chromosome aberrations in metaphase and in- terphase tumor cells by in situ hybridization using chromosome specific library probes. Hum. Genet., 80:235-246.
Dyer, K.A., Riley, D., and Gartler, S.M. (1985) Analysis of inactive X chromosome structure by in situ nick translation. Chromosoma, 92:209-213.
Dyer, K.A., Canfield, T.K., and Gartler, S.M. (1989) Molecular cyto- logical differentiation of active from inactive X domains in inter- phase: implications for X chromosome inactivation. Cytogenet. Cell. Genet., 50:116-120.
Gartler, S.M., Dyer K.A., and Goldman M.A. (1992) Mammalian X chromosome inactivation. In: Molecular Genetic Medicine Vol. 11. Academic Press, pp. 121-160.
Geiger, B., Komitowski, D., Jauch, A, Hausmann, M., and Cremer, C. (1991) Optical sectioning and 3d-image reconstruction to determine the volume of specific chromosome regions in human interphase cell nuclei. Optik, 86:113-119.
Grumbach, M.M., Morishima, A,, Taylor, J.H. (1963) Human sex chro- mosome abnormalities in relation to DNA replication and hetero- chromatization. Proc. Natl. Acad. Sci. U.S.A., 49:581-589.
Hens, L., Baumann, M., Cremer, T., Sutter, A,, Cornelis, J.J., and Cremer, C. (1983) Immunocytochemical localization of chromatin regions UV-microirradiated in S phase or anaphase. Exp. Cell Res., 149:257-269.
Johnson, G.D., and Araujo, G.M. (1981) A simple method of reducing the fading of immunofluorescence during microscopy. J. Immunol. Methods, 43:349-350.
Krystosek, A., and Puck, T.T. (1990) The spatial distribution of ex- posed nuclear DNA in normal, cancer and reverse-transformed cells. Proc. Natl. Acad. Sci. U.S.A., 87:6560-6564.
Leitch, A.R., Mosgoller, W., Schwarzacher, T., Bennett, M.D., and Heslop-Harrison, J.S. (1990) Genomic in situ hybridization to sec- tioned nuclei shows chromosome domains in grass hybrids. J. Cell Sci., 95335-341.
Lichter, P., Cremer, T., Borden, J., Manuelidis, L., and Ward, D.C. (1988) Delineation of individual human chromosomes in metaphase and interphase cells by in situ hybridization using recombinant DNA libraries. Hum. Genet., 80:224-234.
Lyon, M.F. (1961) Gene action in the X-chromosome of the mouse (Mus musculus L.). Nature, 190:372-373.
Manuelidis, L. (19851 Individual chromosome domains revealed by in situ hybridization. Hum. Genet., 71:288-293.
Morton, N.E. (1991) Parameters of the human genome. Proc. Natl. Acad. Sci. U.S.A., 88:7474-7476.
Ohno, S., and Hauschka, T.S. (1960) Allocycly of the X chromosome in tumors and normal tissues. Cancer Res., 20x541-545.
Pinkel, D., Straume, T., and Gray, J.W. (1986) Cytogenetic analysis using quantitative, high-sensitivity, fluorescence hybridization. Proc. Natl. Acad. Sci. U.S.A., 83:2934-2938.
Pinkel, D., Landegent, J . , Collings, C., Fuscoe, J., Segraves, R., Lucas, J., and Gray, J.W. (1988) Fluorescence in situ hybridization with human, chromosome-specific libraries: detection of trisomy 21 and translocations of chromosome 4. Proc. Natl. Acad. Sci. U.S.A., 85: 9138-9142.
Popp, S., Scholl, H.P., Loos, P., Jauch, A., Stelzer, E., Cremer, C., and Cremer, T. (1990) Distribution of chromosome 18 and X centric heterochromatin in the interphase nucleus of cultured human cells. Exp. Cell Res., 189:l-12.
Rosenfeld, A., and Kak, A.C. (1982) Digital Picture Processing. Aca- demic Press, Vols. 1 and 2.
Schardin, M., Cremer, T., Hager, H.D., and Lang, M. (1985) Specific staining of human chromosomes in Chinese hamster x man hvbrid cell lin& demonstrates interphase chromosome territories. Hum. Genet., 71:281-287.

Xi- AND Xa-DOMAINS IN FEMALE CELL NUCLEI 77
Shotton, D.M. (1989) Confocal scanning optical microscopy and its applications for biological specimens. J. Cell Sci., 94:175-206.
Stelzer, E.H.K., and Wijnaendts van Resandt, R.W. (1985) Applica- tions of fluorescence microscopy in three dimensiodmicrotomos- copy. SPIE, 60263-70.
Stelzer, E.H.K., Marsman, H.J.B., and Wijnaendts van Resandt, R.W. (1986) A setup for a confocal scanning laser interference micro- scope. Optik, 73:30-33.
Taylor, J.H. (1960) Asynchronous duplication of chromosomes in cul- tured cells of Chinese hamster. J . Biophys. Biochem. Cytol., 7:455- 464.
Therman, E., and Patau, K. (1974) Abnormal X chromosomes in man: origin, behaviour and effects. Humangenetik, 25: 1-16.
Therman, E., Sarto, G.E., Disteche, C., and Denniston, C. (1976) A possible active segment on the inactive human X-Chromosome. Chromosoma, 59:137-145.
van Dekken, H., Pinkel, D., Mullikin, J . , Trask, B., van den Engh, G., and Gray, J . (1989) Three-dimensional analysis of the organization of human chromosome domains in human-hamster hybrid inter- phase nuclei. J. Cell Sci., 94:299-306.
Visser, T.D., Oud, J.L., and Brakenhoff, G.J. (1992) Refractive index and axial distance measurements in 3-D microscopy. Optik, 90:17- 19.
Vogel, F., and Schroeder, T.M. (1974) The internal order of the inter- phase nucleus. Humangenetik, 25265-297.
Walker, C.L., Cargile, C.B., Floy, K.M., Delannoy, M. and Migeon, B.R. (1991) The Barr body is a looped X chromosome formed by telomere association. Proc. Natl. Acad. Sci. U.S.A., 88:6191-6195.
Zorn, C., Cremer, C., Cremer, T., and Zimmer, J. (1979) Unscheduled DNA synthesis after partial UV irradiation of the cell nucleus. Distribution in interphase and metaphase. Exp. Cell Res., 124: l l l - 119.