Embed Size (px)
Citation preview
Different Data from Different Labs: Lessons fromStudies of Gene–Environment InteractionDouglas Wahlsten,1 Pamela Metten,2 Tamara J. Phillips,2 Stephen L. Boehm II,2
Sue Burkhart-Kasch,2 Janet Dorow,2 Sharon Doerksen,1 Chris Downing,3
Jennifer Fogarty,3 Kristina Rodd-Henricks,3 Rene Hen,4 Carrie S. McKinnon,2
Catherine M. Merrill,2 Cedar Nolte,2 Melike Schalomon,1 Jason P. Schlumbohm,2
Jason R. Sibert,2 Charlotte D. Wenger,2 Bruce C. Dudek,3 John C. Crabbe2
1 Centre for Neuroscience and Department of Psychology, University of Alberta, Edmonton, AB T6G2E9, Canada
2 Portland Alcohol Research Center, Department of Veterans Affairs Medical Center and Departmentof Behavioral Neuroscience, Oregon Health & Science University, Portland, Oregon 97201
3 Department of Psychology, State University of New York at Albany, Albany, New York 12222
4 Center for Neurobiology and Behavior, 722 West 168th Street, New York, New York 10032
ABSTRACT: It is sometimes supposed that stan-dardizing tests of mouse behavior will ensure similar re-sults in different laboratories. We evaluated this supposi-tion by conducting behavioral tests with identicalapparatus and test protocols in independent laboratories.Eight genetic groups of mice, including equal numbers ofmales and females, were either bred locally or shippedfrom the supplier and then tested on six behaviors simul-taneously in three laboratories (Albany, NY; Edmonton,AB; Portland, OR). The behaviors included locomotor ac-tivity in a small box, the elevated plus maze, acceleratingrotarod, visible platform water escape, cocaine activationof locomotor activity, and ethanol preference in a two-bottle test. A preliminary report of this study presented aconventional analysis of conventional measures that re-vealed strong effects of both genotype and laboratory aswell as noteworthy interactions between genotype and lab-oratory. We now report a more detailed analysis of addi-tional measures and view the data for each test in differentways. Whether mice were shipped from a supplier or bredlocally had negligible effects for almost every measure inthe six tests, and sex differences were also absent or verysmall for most behaviors, whereas genetic effects werealmost always large. For locomotor activity, cocaine acti-vation, and elevated plus maze, the analysis demonstratedthe strong dependence of genetic differences in behavior onthe laboratory giving the tests. For ethanol preference and
water escape learning, on the other hand, the three labsobtained essentially the same results for key indicators ofbehavior. Thus, it is clear that the strong dependence ofresults on the specific laboratory is itself dependent on thetask in question. Our results suggest that there may beadvantages of test standardization, but laboratory environ-ments probably can never be made sufficiently similar toguarantee identical results on a wide range of tests in awide range of labs. Interpretations of our results by col-leagues in neuroscience as well as the mass media arereviewed. Pessimistic views, prevalent in the media butrelatively uncommon among neuroscientists, of mouse be-havioral tests as being highly unreliable are contradictedby our data. Despite the presence of noteworthy interac-tions between genotype and lab environment, most of thelarger differences between inbred strains were replicatedacross the three labs. Strain differences of moderate effectssize, on the other hand, often differed markedly amonglabs, especially those involving three 129-derived strains.Implications for behavioral screening of targeted and in-duced mutations in mice are discussed. © 2003 Wiley Period-
icals, Inc. J Neurobiol 54: 283–311, 2003
Keywords: inbred strain; mouse; knockout; serotonin 1Breceptor; elevated plus maze; anxiety; locomotor activ-ity; cocaine; accelerating rotarod; water escape learn-ing; ethanol preference; gene–environment interaction;test reliability
Correspondence to: D. Wahlsten ([email protected]).Contract grant sponsors: the Natural Sciences and Engineering
Research Council of Canada, the Office of Behavioral and SocialScience Research at NIH, the National Institute on Alcoholism andAlcohol Abuse and the National Institute of Drug Abuse at NIH,and the Department of Veterans Affairs.
© 2003 Wiley Periodicals, Inc.Published online in Wiley InterScience (www.interscience.wiley.com).DOI 10.1002/neu.10173
283
INTRODUCTION
Many behaviors of great importance to society andpublic health are influenced substantially by genes,and, furthermore, are genetically complex (Wahlsten,1999). These behaviors include abusive patterns ofself-administration of alcohol and other drugs(Crabbe, 2002) as well as other psychiatric disorderssuch as depression, impulsivity, and schizophrenia(Moldin and Gottesman, 1997; Phillips et al., 2002).Behavior is a property of a whole organism and func-tions at the level of the individual. Genes code forproteins and function at the molecular level. A genedoes not code for a single behavioral phenotype in thewhole organism, or even for a component of a behav-ioral phenotype or specific psychologic process.Rather, most genes have multiple phenotypic effects(pleiotropy) and influence behavior via diverse phys-iologic and developmental pathways.
The unraveling of specific gene effects to under-stand influences on the integrated whole of an organ-ism’s behavior has been termed behavioral genomics(Plomin and Crabbe, 2000). Because the molecularactivities of many genes are regulated by features ofthe external environment or by behavior itself (Got-tlieb, 1998), it is expected that behavioral effects of amutation or genetic polymorphism will depend tosome extent on the animal’s environment (gene ! en-vironment interaction). The specific features of theenvironment that are most effective in modulatinggene activity will, of course, depend on the specificgene, and in most cases are presently unknown(Sokolowski and Wahlsten, 2001). Gene products arepart of an integrated metabolic system. Therefore, theeffects of polymorphism are also expected to dependon genotype at other loci (epistasis) and on the geneticbackground of the host strain (Gerlai, 2001).
Recent Interest in Mouse Phenotyping
The rapid growth of mammalian genetics has focusedon the mouse as a model organism having well-documented genetic homologies with humans (Moldinet al., 2001). Numerous targeted mutations in micehave been created to serve as models for hereditaryhuman diseases (Bolivar et al., 2000; Anagnostopou-los et al., 2001), and random mutagenesis is also nowbeing used to generate many new mutants. Tech-niques have been devised to map genes with relativelymodest effects on complex behaviors (quantitativetrait loci or QTLs), offering the promise that thespecific genes underlying complex traits can be iden-tified and serve as targets for innovative therapies.
The replicability of these mapping findings, as well asthe analysis of the more subtle effects of transgenicmanipulations such as gene knockouts, requires theuse of closely comparable behavioral tests in differentlaboratories. However, widely accepted, standard pro-cedures for testing mouse behaviors are not currentlyavailable (see Wurbel, 2000, 2002; Wahlsten, 2001;van der Staay and Steckler, 2002). Instead, behavioralassessment protocols tend to be unique to each labo-ratory testing mice.
The need for improved behavioral testing protocolsin the neuroscience community became the main topicdiscussed at a meeting convened by the MacArthurFoundation in 1995, “Animal models of psychiatricdiseases: To man from mouse.” Participants recog-nized that a rich diversity of behaviors expressed bymice make it an ideal model mammal for genetic andpharmacologic research on behavior. It was alsoagreed that there was an important need for stablebehavioral norms to aid comparison with geneticallyand pharmacologically altered animals. As studieswith targeted mutant mice proliferated, it becameclear that the behavioral “footprint” of the knockoutoften differed dramatically, depending upon whichgenetic background (strain) the mutant was placed(see, e.g., Bowers et al., 2000). Thus, normative dataon a wide range of standard mouse strains would helpto choose the most appropriate genetic backgroundstrains on which to place the next generation of tar-geted mutants (e.g., tissue-specific and conditionalknockouts).
Several scientific meetings in 1996 (e.g., an NIMHWorkshop on Behavioral Phenotypes of InbredStrains, a Society for Neuroscience short course“What’s Wrong with My Mouse?”; see Takahashi,1996) subsequently highlighted the growing interestin testing mouse behavior as well as the lack of acommon and convenient methodology. A review ofsome available tests (Crawley et al., 1997) docu-mented the need for careful standardization and thepaucity of systematic information available for morethan one or two standard inbred mouse strains. Twosubsequent meetings were convened by the Office ofBehavioral and Social Sciences Research of the NIH.The first of these resulted in partial funding for theexperiment discussed in this article. A second meetingof a much larger group discussed tasks in the generalbehavioral domains surrounding activity and anxiety.In 1999, The Jackson Laboratory convened a “StrainCharacteristics Database Summit” to discuss mousephenotyping. This group determined that a large-scale, multiyear effort to collect standard phenotypicinformation about certain inbred mouse strains was anarea that should be pursued. After identifying several
284 Wahlsten et al.
sources of funding, this has been instantiated as theMouse Phenome Project (Paigen and Eppig, 2000;http://www.jax.org/phenome).
Following these initial efforts, the NIH issued nu-merous Requests for Applications (RFAs) to stimulatephenotyping of genetically defined mice, including be-havioral phenotyping. Several institutes, led by NIMH,convened a meeting in 2000, which led to a reporturging funding for multiple studies (http://www.nih.gov/science/models/mouse/genomics/priority_setting_genomics.pdf). For the most part, the motivation forthis increased attention has been the recent NIH un-dertaking of large-scale mutagenesis projects (Moldinet al., 2001), all of which include behavioral screens.It is unfortunate that the systematic phenotyping cur-rently underway did not precede the mutagenesisscreens, but at least as the screens mature they cantake advantage of the phenotypic information as itdevelops.
Stability of Genetic Influences on MouseBehavior
With so many projects proceeding in parallel anddividing the labor by examining different arrays ofphenotypes, there appears to be a presumption in thefield that the site where a study is done is not a veryimportant factor, provided that the work is done withsufficient expertise. At the same time, failures toreplicate effects of certain genetic knockouts on be-havior in different laboratories has led to growingconcern about the replicability of genetic influenceson behavior across labs (Wahlsten, 2001). That suchconcerns are well grounded is shown by many studiesof inbred strains tested after rearing in different con-ditions within a laboratory (Henderson, 1970, 1976;Erlenmeyer-Kimling, 1972; Wahlsten and Gottlieb,1997).
We decided to address the question of reproduc-ibility of results in different labs systematically bystudying standard mouse strains that show character-istic patterns of behavior (Crawley et al., 1997; Craw-ley, 2000). To test the resilience of such genotypicinfluences, we tested mice of eight genotypes simul-taneously in three laboratories on a battery of sixsimple behaviors (Crabbe et al., 1999). We standard-ized apparatus, test protocols, and other environmen-tal variables to the best of our ability to minimizenongenetic sources of variability. We also askedwhether behavioral genetic differences would be af-fected by shipping the animals from a supplier versusbreeding them in house. The results were striking inseveral ways, and the initial report of the results(Crabbe et al., 1999) has been fairly widely cited and
discussed. The purpose of this article is to presentadditional primary data from the study, discuss inmore depth than previously possible the interpreta-tional nuances of those data, present some of ourthoughts about subsequent reactions to the article, andconsider the implications of available data for stan-dardization of laboratory testing.
The 1998 Study Revisited
The primary goal of the original study was to deter-mine whether different labs would obtain essentiallythe same results when testing the same strains of miceon the same behavioral tests. The alternative possibil-ity was that strain differences might be lab specific. Interms of statistical analysis (Wahlsten, 1990; Soko-lowski and Wahlsten, 2001), the question we askedwas best answered by the strain ! lab interaction termin an analysis of variance (ANOVA). If average testscores were generally higher in one lab than the othersbut the strain differences were nevertheless similar,this would amount to a lab environment main effect inthe ANOVA but it would not undermine conclusionsabout genetic effects. Lab differences in average testscores are interesting environmental effects that war-rant serious investigation, but they were not the focusof our experiment. Indeed, we deliberately sought tominimize environmental differences between ourthree labs.
We recognized from the outset that equating allrelevant variables across labs was futile, and we neverhoped to achieve such perfection. We were incapableof making even our three labs do things in exactly thesame way, and we were aware that the rest of themouse testing world would never agree to a singlestandard (Wahlsten, 2001). Instead, we sought to (a)equate the physical test apparatus and test protocols,and (b) minimize differences in the lab environmentswhere this could be done with little inconvenience inall three labs. Noteworthy differences remainedamong the lab environments in many respects, and wewanted to know whether these variables would have asubstantial impact on test results.
Every test of behavior involves a physical appara-tus with which the mouse interacts, and stimulusconditions that impinge on the apparatus as well as aspecific protocol of things that are to be done forevery animal that is tested on separate occasions.Collectively, these things may be referred to as thetest situation. The phenotype of an animal is then themeasured aspects of its behavior when observed in thespecific test situation. If two test situations are sub-stantially different, such as a small, square box in thedark and a large, round open field under bright lights,
Gene–Environment Interaction 285
activity in the two situations may be thought of as twodifferent phenotypes. No behavioral phenotype existsseparately from a test situation, because behavior is areaction to something. It is this reaction that we seekto measure.
The laboratory environment is then defined byexclusion as everything that impinges on the animaloutside and prior to the test situation. Thus, differentlighting conditions during a trial on the elevated plusmaze would constitute different test situations,whereas lighting in the colony room involves the labenvironment. Whenever one thing is defined as thecomplement of the other, there are always things atthe border of the two that cannot readily be assignedto a category. In our previous report (Crabbe et al.,1999), this intersection of categories was not ad-dressed. Instead, we regarded everything that was notequated as being part of the lab environment. Whenmatters are examined more closely, however, a zoneof ambiguity is seen. For this reason, we present ourmethods in greater detail.
METHODS
Mice
The same eight genetic groups of mice were assessed in allthree labs. Identity in most instances was guaranteed byprocuring highly inbred strains from the same source andshipping to the three labs on the same day. Some mice wereused to constitute breeding pairs, whereas others werehoused for later testing. The inbred strains A/J (A), BALB/cByJ (cBy), C57BL/6J (B6), and DBA/2J (D2) along withthe F1 hybrid B6D2F1/J were obtained from the JacksonLaboratory, Bar Harbor, ME, and the inbred strain 129/SvEvTac (129) was obtained from Taconic Farms, German-town, NY. B6D2F1/J mice were cross bred in each lab toobtain B6D2F2/J (F2) offspring for testing. To see whethera null mutant would respond similarly in different labora-tories, we included a strain in which the serotonin 1Breceptor gene had been deleted by homologous recombina-tion. The 5-HT1B "/" and #/# strains were obtained byeach lab from the colony of R. Hen at Columbia Universityin New York. These two strains comprised a mixture ofthree different 129 substrains, 129/SvPas, 129/SvEvTac,and 129/Sv-ter (Phillips et al., 1999) and were still segre-gating for genetic differences among the three 129 sub-strains (Simpson et al., 1997), but care was taken to ensurethat the three labs received animals with similar back-grounds. Thus, we are confident that the genetic variablewas effectively equated among the three labs.
The eight genotypes were chosen to span a wide range ofgenetic variation and include strains that were alreadyknown to differ substantially on several of the behavioraltests, such as locomotor activity (Thompson, 1953; South-
wick and Clark, 1968) and ethanol preference (McClearnand Rodgers, 1959; Fuller, 1964). It should be emphasizedthat we designed the study to make the strain main effect inour data analyses large, reasoning that an interaction withthe genetic variable would be easier to detect when strainsdiffer substantially within a lab. We also sought to minimizeenvironmental variation.
Shipping
Some labs have facilities to maintain their own breedingcolony, whereas many others purchase the mice and testthem not long after arriving at the lab. This environmentaldifference could exert a major influence on tests of anxiety,for example, but no systematic study of the topic had beenpublished. Thus, we compared mice that were bred in ourown colonies with those shipped directly from the supplier.Timing of shipping and mating was rigorously controlled toinsure all mice were close to the same age on the day whenbehavioral testing began. The breeding stock was shippedfrom all three suppliers to all three labs on December 2 or3, 1997, when mice were about 6 weeks of age, and theseanimals were then mated January 13, 1998, in all three labs.A second batch of mice from the suppliers was shippedMarch 15 to 17, 1998, at about 6 weeks of age, so that theywould be in the same age range as those bred in our owncolonies. Logistics of equating apparatus and protocols dic-tated that testing began 5 weeks after arrival of shippedmice. Because the period for acclimatizing to the lab envi-ronments was longer than occurs in many studies, ourexperiment is not a definitive examination of this issue.
The actual manner of shipping was not identical for allthree sites. For mice sent to Portland and Edmonton fromthe eastern United States, they of course went by air freight,but those for Albany traveled by truck. Shipping to Edm-onton always required a trip of 2 to 3 full days, versus 1 dayfor Albany. At the last minute when the second shipment inMarch was to occur, we learned that one supplier could notdeliver mice of one group (B6D2F2/J). Fortunately, surplusanimals had been bred in Edmonton and Portland. Edmon-ton then shipped B6D2F2/J mice to Albany. Edmonton alsoshipped mice to itself, flying them to the Toronto airport,where Dr. Barbara Bulman-Fleming of the University ofWaterloo received them and promptly sent them back toEdmonton on a separate waybill. Portland shipped mice ithad bred on a flight to Los Angeles, with instructions on thewaybill that they be returned to Portland, but for somereason they ended up sitting for 2 days at the Toledo, OH,airport before being returned to Portland. Thus, the shippingtreatment was not identical for all mice. We are confident,however, that the experiences of all mice in the shippedcondition were very different and more stressful than thelives of genetically identical mice bred in our colonies.
Breeding and Housing
Mice bred locally were treated in a very similar manner ineach lab. One female was housed with one male, and cages
286 Wahlsten et al.
were inspected daily for birth of a litter. Litters were notculled or handled prior to weaning, but cage bedding wasreplaced weekly without removing the nest. Weaning oc-curred within one day of 21 days of age, and mice were thenhoused with same-sex littermates. We generally did notretain or test any animal that was housed alone. Breedingmice were fed the high fat Purina 5020 chow, whereasweaned animals were maintained with free access to localtap water and Purina 5001 chow. In each case the supplierof the chow was the local Purina dealer, and there couldhave been local differences in the exact nutritional formu-lation (Tordoff et al., 1999). Mice were all housed in plasticshoebox cages with 1/4$ Bed-o-cob bedding obtained lo-cally. Cage tops had stainless steel bars, but in Portlandfilter tops were also used to comply with colony regulations.All mice were maintained on the same light–dark schedulewith colony lights on at 0600 and off at 1800. Lightinglevels in the colony rooms were not identical.
Mice shipped to the labs were housed four of the samesex per cage until shortly before testing began. They werekept in the same colony room as the weaned mice bredlocally, and all aspects of husbandry were the same, includ-ing caging, bedding, food, and water.
Testing
Mice were tested in two replications 1 week apart, so thatthe animals in the second replication were about 1 weekolder than the first replication and, for shipped mice, hadbeen in the lab an additional week. In Edmonton it wasnecessary to run an additional squad of only eight mice tofill certain groups where breeding had been slow. Behaviorsof these animals appeared to be similar to those in thesecond replication, and they were pooled with the secondreplication for the purpose of analysis.
One week before testing began, mice were housed twoper cage. The two mice in a cage were littermates if bredlocally but may not have been littermates in the shippedcondition. The order of the 32 cages on the rack for the firstweek of testing was determined by random numbers, and adifferent random order was used for the second replicationin each lab. Mice were always tested in the same order ondifferent days. The order of placement on the rack deter-mined the order of testing during a day, and the two cagemates were always tested at the same time. Strain identifi-cation information was removed at the start of the testingday, so that only the cage number was visible to the exper-imenter. Thus, mice of different strains, sexes, and shippingcondition were well mixed during the test day, and testingwas blind with respect to shipping condition. Testing was toa lesser extent blind with respect to strain. D2 mice have aunique coat color (dilute brown), while there were twoalbino strains (A, cBy), three black agouti (129 and the two5-HT1B groups), and one group with mixed coat colors (F2).B6 mice are black, but so were some of the F2 mice. Sexwas apparent.
Testing was done over a period of 11 days for onereplication. On Monday morning from 0830 to 0900 local
time, all mice for that replication were tail marked with ablack Sharpie pen (red Sharpie pen for black mice) and thenweighed to the nearest 0.1 g. The rack with all 32 cages waskept close to the testing room, and cages were brought to thevicinity of the apparatus shortly before the test for each pairof mice. The order of tests for the first week was (a)locomotor activity on Monday, (b) elevated plus maze onTuesday, (c) accelerating rotarod on Wednesday, (d) visibleplatform water escape on Thursday, and (e) locomotor ac-tivity after a cocaine injection on Friday. After a break fromtesting on Saturday, mice were given ethanol preferencetests the next week. After the completion of testing, micewere euthanized and their brains were removed for histo-logic analysis. Data on brain anatomy in relation to behaviorhave been published separately (Wahlsten et al., 2001).Analysis of those data demonstrated that absence of thecorpus callosum in the three 129-derived strains was unre-lated to individual differences in measures of behaviorreported here.
Apparatus
Locomotor Activity. The test chamber was a clear plasticbox 40 ! 40 ! 30-cm high with a plastic floor and remov-able lid. Animal movement was monitored by the AccuScan(formerly Omnitech) Digiscan system that used a grid ofphotocell beams 2 cm above floor level; another grid 6 cmabove floor level detected rearing (vertical movements).Each system consisted of four activity monitors in separatecubicles that allowed four mice to be tested at one time. TheAlbany and Portland labs already had this apparatus, andnew apparatus was generously provided on loan to Edmon-ton from Dr. R.H. Kant of AccuScan. Data collected bycomputer included distance traveled in each time period,number of horizontal movements, number of vertical move-ments, and time spent moving. The system also recorded thetime spent in the center 25 ! 25-cm zone. Each activitymonitor in Albany and Portland was enclosed in a smallcubicle with an exhaust fan, but the cubicles were somewhatdifferent and external light sources were different. Edmon-ton built new enclosures that were about the same dimen-sions as the other two labs and included an exhaust fan. Weopted to test mice in total darkness because that was the onething we could definitely make the same in all three labs.Thus, in the locomotor activity test, the recording system,the physical apparatus in contact with the mouse and light-ing were identical, but the surrounding cubicles themselveswere similar but not strictly the same. The same apparatuswas used for cocaine activation testing.
Elevated Plus Maze. Apparatus were constructed in theDepartment of Psychology shop in Edmonton, and twocopies were provided for each lab. The black plastic floor ofthe maze consisted of four arms 5-cm wide and 30-cm longthat met at a 5 ! 5-cm center zone, and the apparatus wasmounted on a clear plastic pedestal that placed the arms 50cm above the floor. Bedding was placed below the mazeshould the mice fall. The two enclosed arms had clear
Gene–Environment Interaction 287
plastic walls 15 cm high, whereas the open arms had a lowrim 5 mm high. The end of each arm and the wall itself wasrounded, and the walls on both enclosed and open armscould be removed for cleaning. Lights were procured inEdmonton and shipped to the other two labs. The lightconsisted of a 15-watt frosted tungsten bulb mounted in analuminum reflector and suspended 1.0 m above the arms ofthe maze to create a light intensity of about 100 Lux. Thetwo mazes in each lab were separated by a white partition sothat mice could not see each other during testing but theirbehaviors could be viewed by the same video camera. Wetried to make the general arrangement of the two mazes inthe test room similar, especially the distances of mazes fromwalls and objects, but the stimulus surroundings were notidentical. Behavior during plus maze testing was recordedon video tape in each lab, although cameras were different.
Accelerating Rotarod. Each lab received two new copies ofthe AccuRod apparatus on loan from AccuScan. Two rodswere run by one computer, but they were independent andcould be started and stopped at different times. The roditself was 11 cm long and 2.5 cm diameter, and it wassuspended 30 cm above a trough filled with bedding. Thefall of a mouse from the rod was detected by photocellsabout 1 cm above the bedding. If a mouse happened to missthe photocells, the trial could be ended by a pushbutton. Inan attempt to make the all-important rod surface identical,we glued a strip of 320 grit emery paper to the surface ofeach rod with rubber cement. In an extreme effort to ensureidentical surfaces, sandpaper from a single source in Port-land was sent to the other labs, much to the amusement ofoffice staff in Edmonton who had never seen four sheets ofsandpaper delivered by courier. In the end, this effort wasfor naught, and there was reason to believe the rod surfaceswere not identical in the three labs. The seam where edgesof the paper met turned out to be crucial because mice couldgain a toe hold on a seam that was not perfectly formed.Lighting was provided by the room fluorescent lights.
Water Escape Tank. Six identical, seamless polyethylenetanks were molded in Edmonton and two were shipped toeach of the other labs. The circular tank was 70-cm diameterand 30-cm deep, and it was filled with clear, fresh tap water25 cm deep at the start of the test day. Water was maintainedat 25 to 26°C. The rim of the tank was covered with a1.5-cm thick black rubber tube to make it clearly visible. Avisible platform was located at the center of each tank andconsisted of a 10-cm diameter metal mesh painted black andprotruding 5 mm above the surface, with a 6.4-cm diameterblack ball located 7 cm above the platform. Lighting wasprovided by the same light as used for the plus maze andwas about 100 Lux at the water surface. As for the plusmazes, the two water tanks were separated by a whitepartition and behavior was recorded by a video tape re-corder.
Ethanol Preference. During preference testing, mice werehoused singly and allowed free access to food, but the single
large water bottle was replaced by two 25-mL graduatedcylinders placed symmetrically in the cage top 4.5 cm fromthe two sides of the lid. Each cylinder had a size 14.5 rubberstopper with a stainless steel drinking spout that extendedabout 6 cm into the cage at an angle of about 30 degreesbelow horizontal. Cylinders, stoppers, and spouts werecleaned with a dilute bleach solution (0.03% sodium hypo-chlorite) prior to the start of testing. Ethanol solution was6% v/v of absolute ethanol in distilled water. Food wasfreely available and dispersed around and between the cyl-inders in the cage lid. Control cages (without mice) wereplaced on the racks to correct for spillage and evaporation.
Procedures
Locomotor Activity. The trial was 15 min long, and datawere recorded separately for three 5-min samples. Fourmice were tested at the same time, consisting of two cagesof two mice each. The home cage was brought close to theapparatus and the lid was removed. The first mouse wasgrasped by the tail and placed into the center of the boxfacing away from the experimenter. The plastic lid was puton the box, the cubicle was closed, and a button was pressedto start the trial for that mouse. The same procedure wasfollowed for the remaining three mice. Mice were removedand returned to their home cages, fecal boli were countedand removed, and excess urine was removed with a cleanpaper cloth. Finally, the inside surfaces of the chamber werewiped clean with 70% isopropyl alcohol and allowed to drybefore the start of the next batch of mice.
Elevated Plus Maze. The trial of 5-min duration was videotaped for later scoring of behaviors. Two mice from onecage were run at the same time. The first animal was pickedup from the cage by its tail and placed gently onto the centerof the maze facing the opposite open arm. Care was taken toperform this operation quickly but smoothly to avoid anyabrupt tug on the tail that would induce the mouse to dartinto the open arm. As soon as the tail was released, a stopwatch was started, and then the procedure was repeated forthe other mouse. The experimenter moved out of sightbehind a partition and observed the mice on a TV monitor.At the end of the trial, neither mouse was disturbed until the5 min had elapsed for both mice. The animals were returnedto their home cage, walls of the maze were removed, boliwere counted, and then the surfaces of the maze and thewalls were cleaned with 70% isopropyl alcohol. After thestudy was completed, data were scored from video tapes ateach site. Number of entries into each arm was scored onone pass through the tape, defining an arm entry as anoccasion when a mouse placed all four feet within the armafter having all four feet outside the arm. On a second passthrough the tape, time spent in each arm was recorded withstopwatches.
Accelerating Rotarod. Ten trials were given with an inter-trial interval of 30 s. Each mouse was placed onto the centerof the motionless rod and a button was pressed to start the
288 Wahlsten et al.
rotation after both mice were in position. Acceleration ratewas 80 rpm/min. The experimenter stepped back to a posi-tion about 1.2 m from the apparatus and watched the miceclosely. Time to fall from the rod was usually detected bythe photocells, but it was sometimes necessary for theexperimenter to record the latency by hand. After both micehad fallen, a stop watch was started for the intertrial inter-val. Mice remained in the bedding trough of the apparatusduring this period. The experimenter made notes on theanimals’ behavior at this time, making special mention ofoccasions when a mouse jumped rather than fell from therod or flattened itself on the rod by holding onto the surfaceand rotating passively with the rod rather than walking on it.
Water Escape Tank. Pretraining was given at the end of theday on Wednesday and consisted of three trials. The firstwas a 60-s period of swimming with no platform present.Next the mouse was placed onto the visible platform andallowed to remain there 15 s. Finally, the mouse was placedinto the water facing the platform and allowed to climb ontoit and remain there 15 s. The next day, eight training trialswere given with an intertrial interval of 30 s and a trialduration limit of 40 s. Two mice from one cage were run inclose succession in adjacent tanks. Each animal was kept ina separate holding cage with three paper towels on the floorduring training. The first animal was picked up by the tailand placed facing the wall of the tank at one of fourrandomly chosen compass positions (N, S, E, W). Eachblock of four trials included one instance of each position.As soon as the tail was released, the experimenter started astop watch and stepped back at least 1 m from the tank.When the mouse had climbed onto the platform with all fourfeet, the latency was recorded and the mouse was allowed toremain on the platform for 10 s before being returned to theholding cage. As soon as one animal had been returned to itsholding cage, a timer was started for the intertrial intervaland the trial for the other mouse was started. In an instancewhen one mouse required more than 30 s to escape, theintertrial interval for its cage mate was extended beyond30 s.
Cocaine Activation. Mice were weighed at the start of thesession on Friday. Cocaine hydrochloride in a dose of 20mg/kg was administered by intraperitoneal injection shortlybefore the 15-min trial in the activity box. The four mice inone squad were injected quickly in succession and then thetrial was conducted in the same way as the locomotoractivity test on Monday. The cocaine was obtained from adifferent source in each lab (Albany, National Institute ofDrug Abuse Clearing House; Edmonton, BDH lot #113428/2411 via Health Canada; Portland, Sigma lot #34H0200).
Ethanol Preference. On Sunday morning, mice werehoused individually in a clean cage and given two graduatedcylinders containing fresh tap water placed symmetrically;water levels were read from the tubes. On Monday at thesame time, water levels were again read without disturbingthe apparatus. On Tuesday, water levels were read and then
two clean cylinders were put in place, one containing freshtap water and the other containing 6% ethanol. For Tuesdayand Wednesday, the ethanol solution was on the left side ofthe cage for all mice. The tubes were not disturbed onWednesday when readings were taken. On Thursday, levelswere read and two clean bottles were put in place—one onthe left with fresh tap water, and one on the right with 6%ethanol. Readings were taken at the same time on Fridayand Saturday.
Data Analysis
Data from all tests at the three sites were collated andentered into a spreadsheet at Albany and then imported intoSPSS and saved as a SAV type of file that could be analyzedwith either SPSS or SYSTAT. Data were scrutinized forerrors and outliers using a variety of methods. The principaltechnique for the final analysis was factorial analysis ofvariance (ANOVA). Although the mice bred locally weretested in littermate pairs, litter membership of most of theshipped mice was not known. Consequently, the individualmouse, not the litter, was adopted as the unit of analysis.The original design called for four mice of each strain–sex–shipping condition to be tested at each lab for a total of 128mice per lab. This sample size was sufficient to detect amoderate strain ! lab interaction with power of 90%, andpower to detect moderate main effects was much higher(Cohen, 1988; Wahlsten, 1990). Because so many tests ofsignificance were done, we decided to adopt ! % .01 as thecriterion for significance, and we gave serious attention onlyto effects that met a more stringent criterion of ! % .001.Our simple procedure yielded conclusions that were verysimilar to those based on the more sophisticated significancecriterion adjustment recommended by Benjamini et al.(2001). Because the F-ratio in the ANOVA is so closelyrelated to the p-value for the test of significance, we choseto report p-values and an indicator of effect size. For effectswith greater than one degree of freedom in the numerator, aconvenient indicator is partial "2, an estimate of the pro-portion of variance attributable to the between-group effectwhen only that one effect is compared with variance withina group.
RESULTS
The design entailed 8 ! 3 ! 2 ! 2 % 96 independentgroups with four per cell for a total of 384 mice,whereas we obtained valid data for 378 or 379 miceon most measures. Every cell had at least one mouseat each site, and the shortage of mice, due to poorbreeding, was confined to the 5-HT1B "/" animals inEdmonton. Thus, the problem of unequal sample sizesin the ANOVA was negligible.
Gene–Environment Interaction 289
Significance and Effect Size
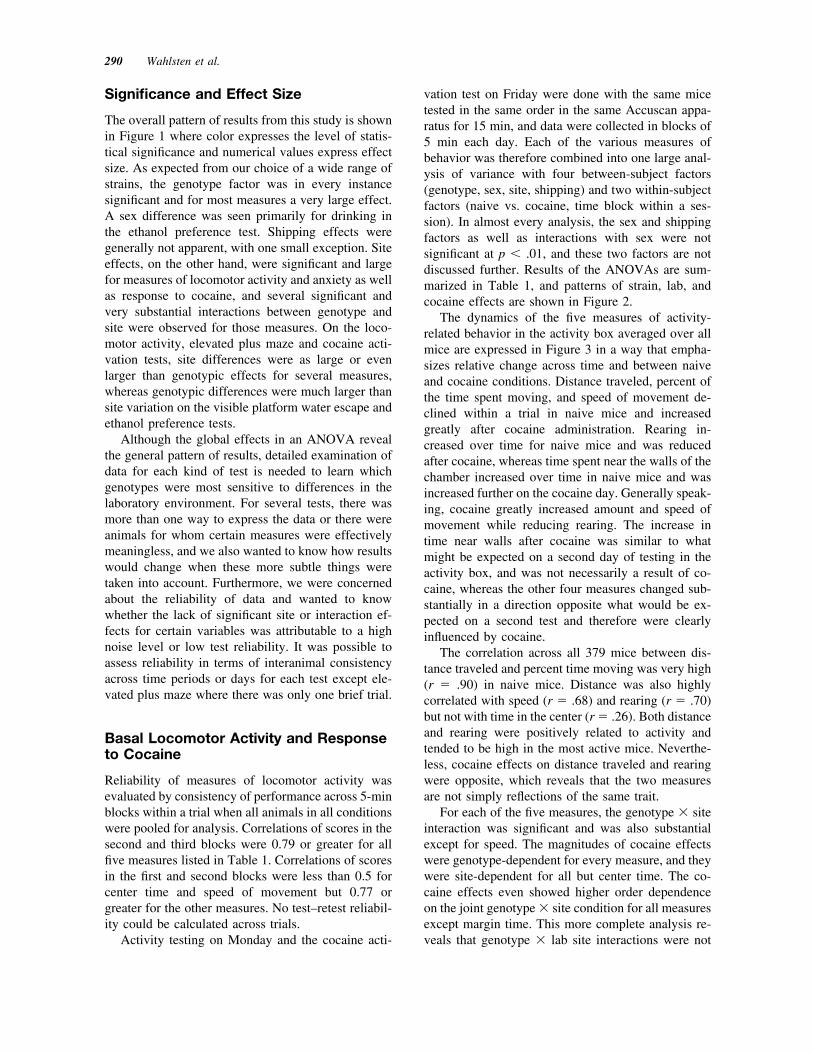
The overall pattern of results from this study is shownin Figure 1 where color expresses the level of statis-tical significance and numerical values express effectsize. As expected from our choice of a wide range ofstrains, the genotype factor was in every instancesignificant and for most measures a very large effect.A sex difference was seen primarily for drinking inthe ethanol preference test. Shipping effects weregenerally not apparent, with one small exception. Siteeffects, on the other hand, were significant and largefor measures of locomotor activity and anxiety as wellas response to cocaine, and several significant andvery substantial interactions between genotype andsite were observed for those measures. On the loco-motor activity, elevated plus maze and cocaine acti-vation tests, site differences were as large or evenlarger than genotypic effects for several measures,whereas genotypic differences were much larger thansite variation on the visible platform water escape andethanol preference tests.
Although the global effects in an ANOVA revealthe general pattern of results, detailed examination ofdata for each kind of test is needed to learn whichgenotypes were most sensitive to differences in thelaboratory environment. For several tests, there wasmore than one way to express the data or there wereanimals for whom certain measures were effectivelymeaningless, and we also wanted to know how resultswould change when these more subtle things weretaken into account. Furthermore, we were concernedabout the reliability of data and wanted to knowwhether the lack of significant site or interaction ef-fects for certain variables was attributable to a highnoise level or low test reliability. It was possible toassess reliability in terms of interanimal consistencyacross time periods or days for each test except ele-vated plus maze where there was only one brief trial.
Basal Locomotor Activity and Responseto Cocaine
Reliability of measures of locomotor activity wasevaluated by consistency of performance across 5-minblocks within a trial when all animals in all conditionswere pooled for analysis. Correlations of scores in thesecond and third blocks were 0.79 or greater for allfive measures listed in Table 1. Correlations of scoresin the first and second blocks were less than 0.5 forcenter time and speed of movement but 0.77 orgreater for the other measures. No test–retest reliabil-ity could be calculated across trials.
Activity testing on Monday and the cocaine acti-
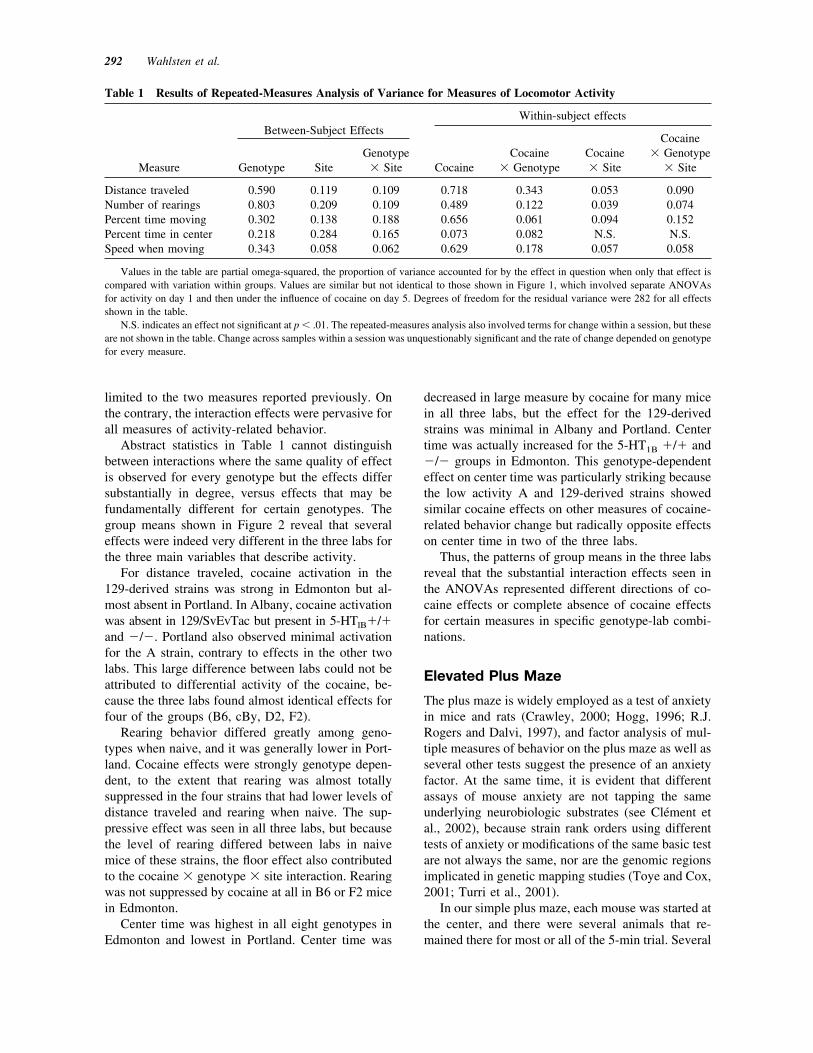
vation test on Friday were done with the same micetested in the same order in the same Accuscan appa-ratus for 15 min, and data were collected in blocks of5 min each day. Each of the various measures ofbehavior was therefore combined into one large anal-ysis of variance with four between-subject factors(genotype, sex, site, shipping) and two within-subjectfactors (naive vs. cocaine, time block within a ses-sion). In almost every analysis, the sex and shippingfactors as well as interactions with sex were notsignificant at p & .01, and these two factors are notdiscussed further. Results of the ANOVAs are sum-marized in Table 1, and patterns of strain, lab, andcocaine effects are shown in Figure 2.
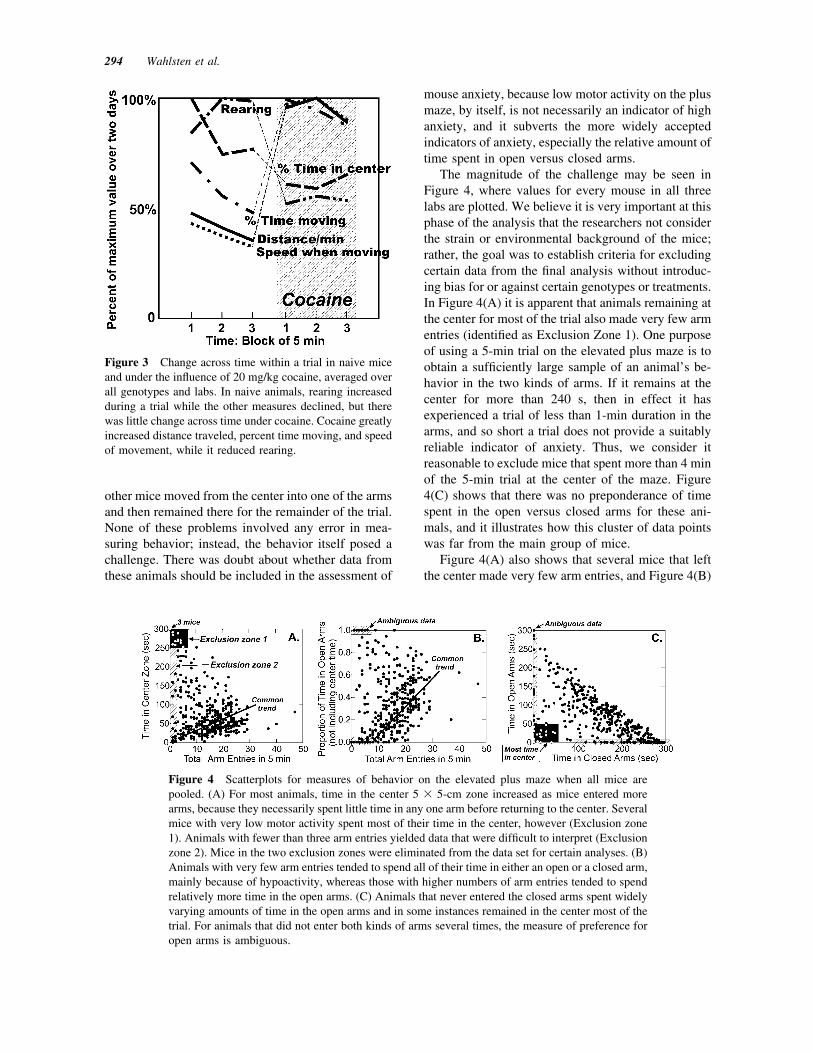
The dynamics of the five measures of activity-related behavior in the activity box averaged over allmice are expressed in Figure 3 in a way that empha-sizes relative change across time and between naiveand cocaine conditions. Distance traveled, percent ofthe time spent moving, and speed of movement de-clined within a trial in naive mice and increasedgreatly after cocaine administration. Rearing in-creased over time for naive mice and was reducedafter cocaine, whereas time spent near the walls of thechamber increased over time in naive mice and wasincreased further on the cocaine day. Generally speak-ing, cocaine greatly increased amount and speed ofmovement while reducing rearing. The increase intime near walls after cocaine was similar to whatmight be expected on a second day of testing in theactivity box, and was not necessarily a result of co-caine, whereas the other four measures changed sub-stantially in a direction opposite what would be ex-pected on a second test and therefore were clearlyinfluenced by cocaine.
The correlation across all 379 mice between dis-tance traveled and percent time moving was very high(r % .90) in naive mice. Distance was also highlycorrelated with speed (r % .68) and rearing (r % .70)but not with time in the center (r % .26). Both distanceand rearing were positively related to activity andtended to be high in the most active mice. Neverthe-less, cocaine effects on distance traveled and rearingwere opposite, which reveals that the two measuresare not simply reflections of the same trait.
For each of the five measures, the genotype ! siteinteraction was significant and was also substantialexcept for speed. The magnitudes of cocaine effectswere genotype-dependent for every measure, and theywere site-dependent for all but center time. The co-caine effects even showed higher order dependenceon the joint genotype ! site condition for all measuresexcept margin time. This more complete analysis re-veals that genotype ! lab site interactions were not
290 Wahlsten et al.
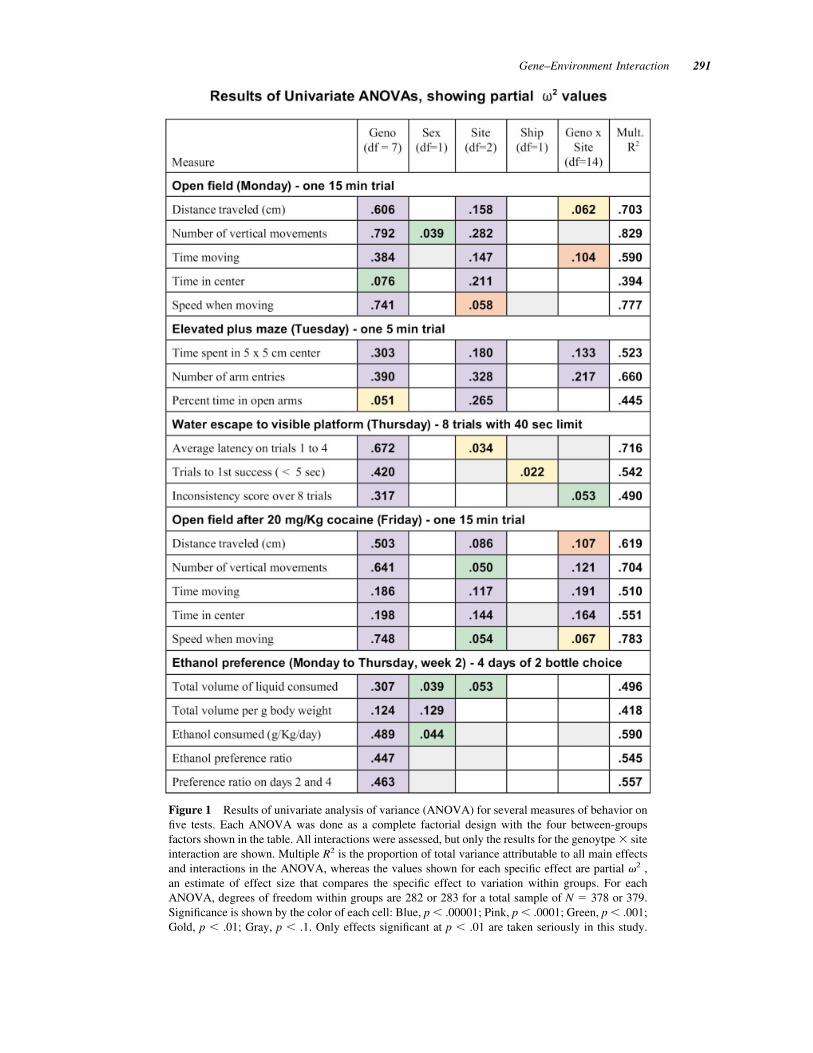
Figure 1 Results of univariate analysis of variance (ANOVA) for several measures of behavior onfive tests. Each ANOVA was done as a complete factorial design with the four between-groupsfactors shown in the table. All interactions were assessed, but only the results for the genoytpe ! siteinteraction are shown. Multiple R2 is the proportion of total variance attributable to all main effectsand interactions in the ANOVA, whereas the values shown for each specific effect are partial "2 ,an estimate of effect size that compares the specific effect to variation within groups. For eachANOVA, degrees of freedom within groups are 282 or 283 for a total sample of N % 378 or 379.Significance is shown by the color of each cell: Blue, p & .00001; Pink, p & .0001; Green, p & .001;Gold, p & .01; Gray, p & .1. Only effects significant at p & .01 are taken seriously in this study.
Gene–Environment Interaction 291
limited to the two measures reported previously. Onthe contrary, the interaction effects were pervasive forall measures of activity-related behavior.
Abstract statistics in Table 1 cannot distinguishbetween interactions where the same quality of effectis observed for every genotype but the effects differsubstantially in degree, versus effects that may befundamentally different for certain genotypes. Thegroup means shown in Figure 2 reveal that severaleffects were indeed very different in the three labs forthe three main variables that describe activity.
For distance traveled, cocaine activation in the129-derived strains was strong in Edmonton but al-most absent in Portland. In Albany, cocaine activationwas absent in 129/SvEvTac but present in 5-HTlB"/"and #/#. Portland also observed minimal activationfor the A strain, contrary to effects in the other twolabs. This large difference between labs could not beattributed to differential activity of the cocaine, be-cause the three labs found almost identical effects forfour of the groups (B6, cBy, D2, F2).
Rearing behavior differed greatly among geno-types when naive, and it was generally lower in Port-land. Cocaine effects were strongly genotype depen-dent, to the extent that rearing was almost totallysuppressed in the four strains that had lower levels ofdistance traveled and rearing when naive. The sup-pressive effect was seen in all three labs, but becausethe level of rearing differed between labs in naivemice of these strains, the floor effect also contributedto the cocaine ! genotype ! site interaction. Rearingwas not suppressed by cocaine at all in B6 or F2 micein Edmonton.
Center time was highest in all eight genotypes inEdmonton and lowest in Portland. Center time was
decreased in large measure by cocaine for many micein all three labs, but the effect for the 129-derivedstrains was minimal in Albany and Portland. Centertime was actually increased for the 5-HT1B "/" and#/# groups in Edmonton. This genotype-dependenteffect on center time was particularly striking becausethe low activity A and 129-derived strains showedsimilar cocaine effects on other measures of cocaine-related behavior change but radically opposite effectson center time in two of the three labs.
Thus, the patterns of group means in the three labsreveal that the substantial interaction effects seen inthe ANOVAs represented different directions of co-caine effects or complete absence of cocaine effectsfor certain measures in specific genotype-lab combi-nations.
Elevated Plus Maze
The plus maze is widely employed as a test of anxietyin mice and rats (Crawley, 2000; Hogg, 1996; R.J.Rogers and Dalvi, 1997), and factor analysis of mul-tiple measures of behavior on the plus maze as well asseveral other tests suggest the presence of an anxietyfactor. At the same time, it is evident that differentassays of mouse anxiety are not tapping the sameunderlying neurobiologic substrates (see Clement etal., 2002), because strain rank orders using differenttests of anxiety or modifications of the same basic testare not always the same, nor are the genomic regionsimplicated in genetic mapping studies (Toye and Cox,2001; Turri et al., 2001).
In our simple plus maze, each mouse was started atthe center, and there were several animals that re-mained there for most or all of the 5-min trial. Several
Table 1 Results of Repeated-Measures Analysis of Variance for Measures of Locomotor Activity
Measure
Between-Subject EffectsWithin-subject effects
Genotype SiteGenotype
! Site CocaineCocaine
! GenotypeCocaine! Site
Cocaine! Genotype
! Site
Distance traveled 0.590 0.119 0.109 0.718 0.343 0.053 0.090Number of rearings 0.803 0.209 0.109 0.489 0.122 0.039 0.074Percent time moving 0.302 0.138 0.188 0.656 0.061 0.094 0.152Percent time in center 0.218 0.284 0.165 0.073 0.082 N.S. N.S.Speed when moving 0.343 0.058 0.062 0.629 0.178 0.057 0.058
Values in the table are partial omega-squared, the proportion of variance accounted for by the effect in question when only that effect iscompared with variation within groups. Values are similar but not identical to those shown in Figure 1, which involved separate ANOVAsfor activity on day 1 and then under the influence of cocaine on day 5. Degrees of freedom for the residual variance were 282 for all effectsshown in the table.
N.S. indicates an effect not significant at p & .01. The repeated-measures analysis also involved terms for change within a session, but theseare not shown in the table. Change across samples within a session was unquestionably significant and the rate of change depended on genotypefor every measure.
292 Wahlsten et al.
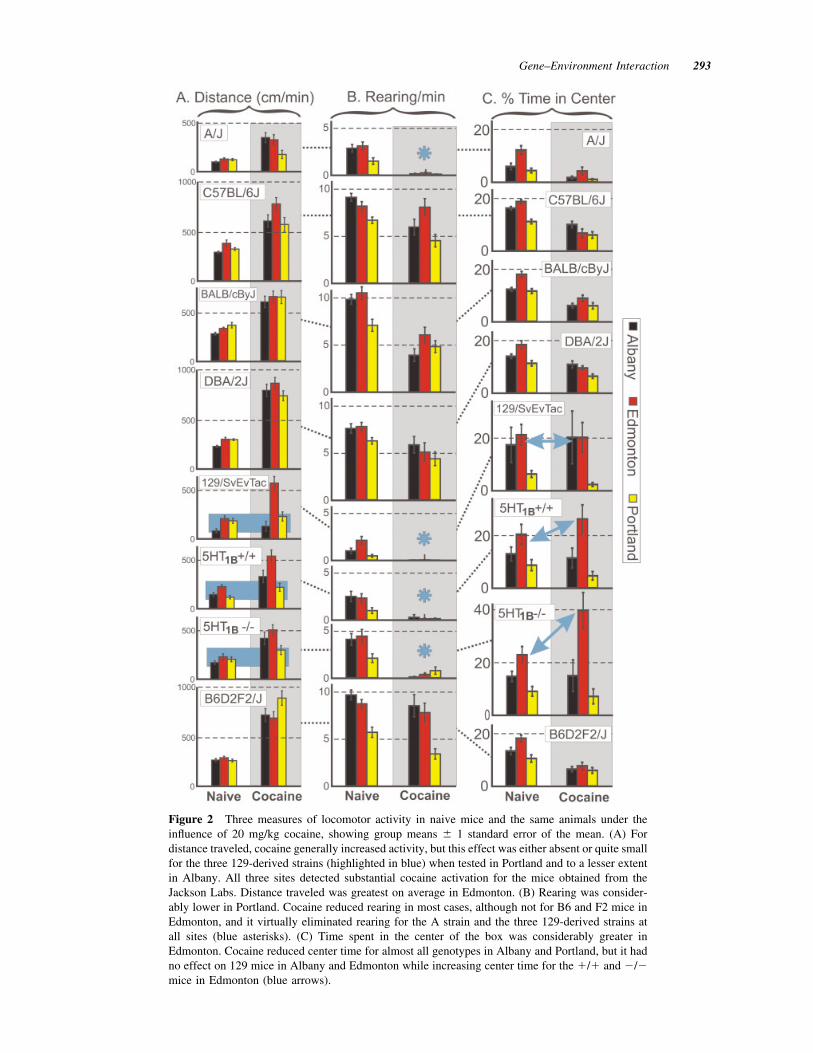
Figure 2 Three measures of locomotor activity in naive mice and the same animals under theinfluence of 20 mg/kg cocaine, showing group means ' 1 standard error of the mean. (A) Fordistance traveled, cocaine generally increased activity, but this effect was either absent or quite smallfor the three 129-derived strains (highlighted in blue) when tested in Portland and to a lesser extentin Albany. All three sites detected substantial cocaine activation for the mice obtained from theJackson Labs. Distance traveled was greatest on average in Edmonton. (B) Rearing was consider-ably lower in Portland. Cocaine reduced rearing in most cases, although not for B6 and F2 mice inEdmonton, and it virtually eliminated rearing for the A strain and the three 129-derived strains atall sites (blue asterisks). (C) Time spent in the center of the box was considerably greater inEdmonton. Cocaine reduced center time for almost all genotypes in Albany and Portland, but it hadno effect on 129 mice in Albany and Edmonton while increasing center time for the "/" and #/#mice in Edmonton (blue arrows).
Gene–Environment Interaction 293
other mice moved from the center into one of the armsand then remained there for the remainder of the trial.None of these problems involved any error in mea-suring behavior; instead, the behavior itself posed achallenge. There was doubt about whether data fromthese animals should be included in the assessment of
mouse anxiety, because low motor activity on the plusmaze, by itself, is not necessarily an indicator of highanxiety, and it subverts the more widely acceptedindicators of anxiety, especially the relative amount oftime spent in open versus closed arms.
The magnitude of the challenge may be seen inFigure 4, where values for every mouse in all threelabs are plotted. We believe it is very important at thisphase of the analysis that the researchers not considerthe strain or environmental background of the mice;rather, the goal was to establish criteria for excludingcertain data from the final analysis without introduc-ing bias for or against certain genotypes or treatments.In Figure 4(A) it is apparent that animals remaining atthe center for most of the trial also made very few armentries (identified as Exclusion Zone 1). One purposeof using a 5-min trial on the elevated plus maze is toobtain a sufficiently large sample of an animal’s be-havior in the two kinds of arms. If it remains at thecenter for more than 240 s, then in effect it hasexperienced a trial of less than 1-min duration in thearms, and so short a trial does not provide a suitablyreliable indicator of anxiety. Thus, we consider itreasonable to exclude mice that spent more than 4 minof the 5-min trial at the center of the maze. Figure4(C) shows that there was no preponderance of timespent in the open versus closed arms for these ani-mals, and it illustrates how this cluster of data pointswas far from the main group of mice.
Figure 4(A) also shows that several mice that leftthe center made very few arm entries, and Figure 4(B)
Figure 3 Change across time within a trial in naive miceand under the influence of 20 mg/kg cocaine, averaged overall genotypes and labs. In naive animals, rearing increasedduring a trial while the other measures declined, but therewas little change across time under cocaine. Cocaine greatlyincreased distance traveled, percent time moving, and speedof movement, while it reduced rearing.
Figure 4 Scatterplots for measures of behavior on the elevated plus maze when all mice arepooled. (A) For most animals, time in the center 5 ! 5-cm zone increased as mice entered morearms, because they necessarily spent little time in any one arm before returning to the center. Severalmice with very low motor activity spent most of their time in the center, however (Exclusion zone1). Animals with fewer than three arm entries yielded data that were difficult to interpret (Exclusionzone 2). Mice in the two exclusion zones were eliminated from the data set for certain analyses. (B)Animals with very few arm entries tended to spend all of their time in either an open or a closed arm,mainly because of hypoactivity, whereas those with higher numbers of arm entries tended to spendrelatively more time in the open arms. (C) Animals that never entered the closed arms spent widelyvarying amounts of time in the open arms and in some instances remained in the center most of thetrial. For animals that did not enter both kinds of arms several times, the measure of preference foropen arms is ambiguous.
294 Wahlsten et al.
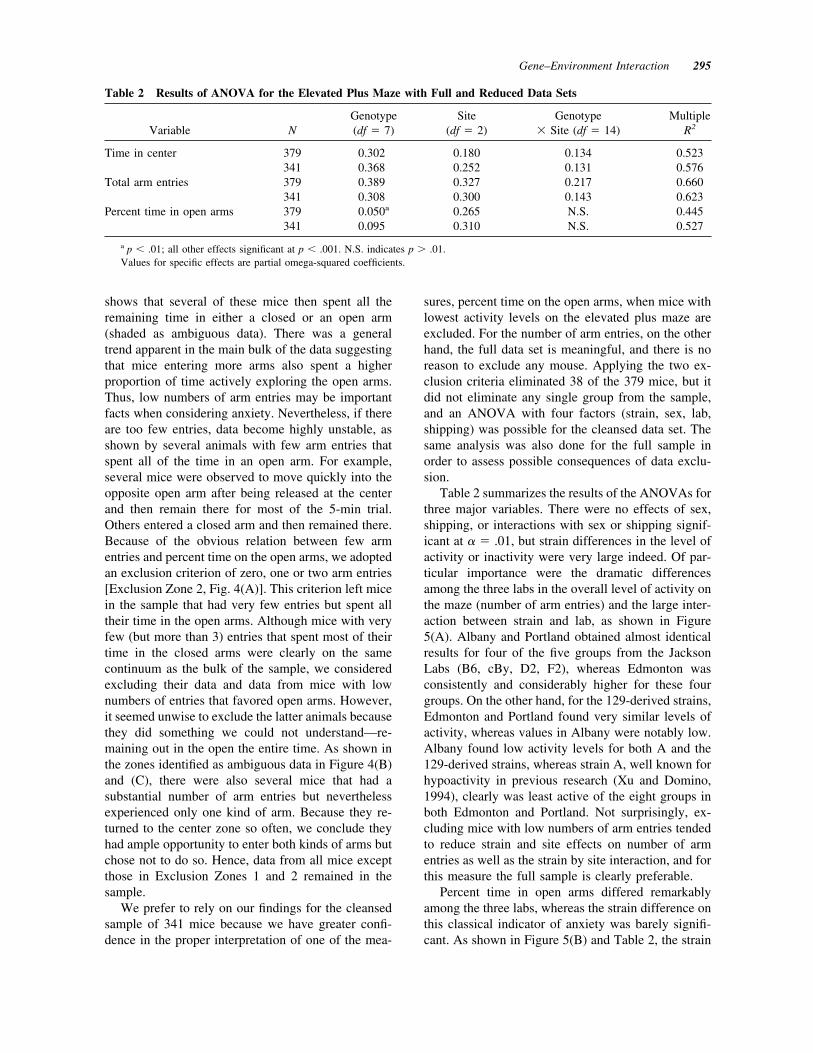
shows that several of these mice then spent all theremaining time in either a closed or an open arm(shaded as ambiguous data). There was a generaltrend apparent in the main bulk of the data suggestingthat mice entering more arms also spent a higherproportion of time actively exploring the open arms.Thus, low numbers of arm entries may be importantfacts when considering anxiety. Nevertheless, if thereare too few entries, data become highly unstable, asshown by several animals with few arm entries thatspent all of the time in an open arm. For example,several mice were observed to move quickly into theopposite open arm after being released at the centerand then remain there for most of the 5-min trial.Others entered a closed arm and then remained there.Because of the obvious relation between few armentries and percent time on the open arms, we adoptedan exclusion criterion of zero, one or two arm entries[Exclusion Zone 2, Fig. 4(A)]. This criterion left micein the sample that had very few entries but spent alltheir time in the open arms. Although mice with veryfew (but more than 3) entries that spent most of theirtime in the closed arms were clearly on the samecontinuum as the bulk of the sample, we consideredexcluding their data and data from mice with lownumbers of entries that favored open arms. However,it seemed unwise to exclude the latter animals becausethey did something we could not understand—re-maining out in the open the entire time. As shown inthe zones identified as ambiguous data in Figure 4(B)and (C), there were also several mice that had asubstantial number of arm entries but neverthelessexperienced only one kind of arm. Because they re-turned to the center zone so often, we conclude theyhad ample opportunity to enter both kinds of arms butchose not to do so. Hence, data from all mice exceptthose in Exclusion Zones 1 and 2 remained in thesample.
We prefer to rely on our findings for the cleansedsample of 341 mice because we have greater confi-dence in the proper interpretation of one of the mea-
sures, percent time on the open arms, when mice withlowest activity levels on the elevated plus maze areexcluded. For the number of arm entries, on the otherhand, the full data set is meaningful, and there is noreason to exclude any mouse. Applying the two ex-clusion criteria eliminated 38 of the 379 mice, but itdid not eliminate any single group from the sample,and an ANOVA with four factors (strain, sex, lab,shipping) was possible for the cleansed data set. Thesame analysis was also done for the full sample inorder to assess possible consequences of data exclu-sion.
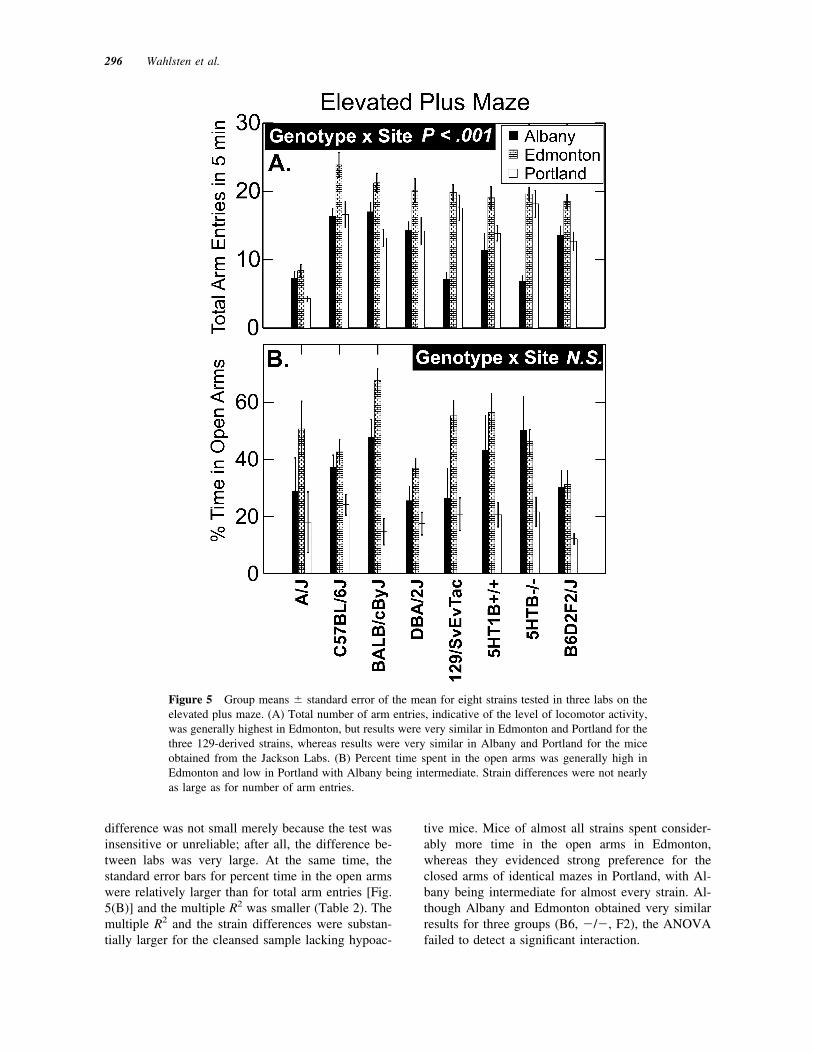
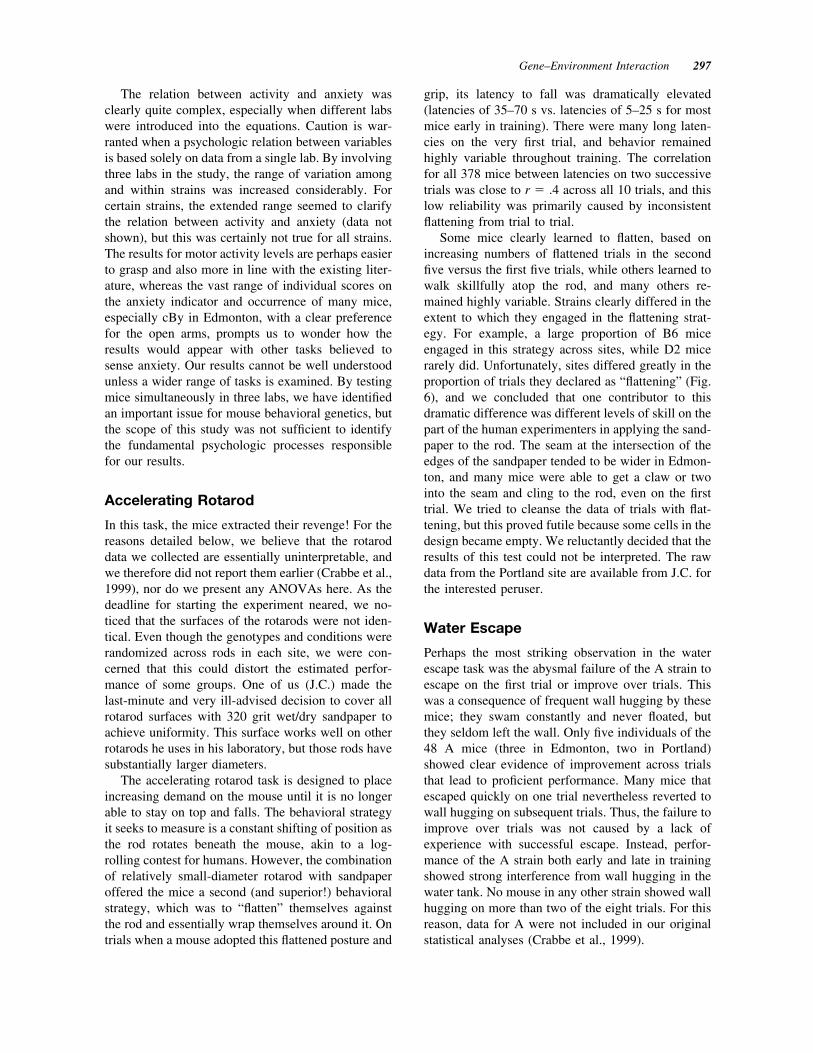
Table 2 summarizes the results of the ANOVAs forthree major variables. There were no effects of sex,shipping, or interactions with sex or shipping signif-icant at ! % .01, but strain differences in the level ofactivity or inactivity were very large indeed. Of par-ticular importance were the dramatic differencesamong the three labs in the overall level of activity onthe maze (number of arm entries) and the large inter-action between strain and lab, as shown in Figure5(A). Albany and Portland obtained almost identicalresults for four of the five groups from the JacksonLabs (B6, cBy, D2, F2), whereas Edmonton wasconsistently and considerably higher for these fourgroups. On the other hand, for the 129-derived strains,Edmonton and Portland found very similar levels ofactivity, whereas values in Albany were notably low.Albany found low activity levels for both A and the129-derived strains, whereas strain A, well known forhypoactivity in previous research (Xu and Domino,1994), clearly was least active of the eight groups inboth Edmonton and Portland. Not surprisingly, ex-cluding mice with low numbers of arm entries tendedto reduce strain and site effects on number of armentries as well as the strain by site interaction, and forthis measure the full sample is clearly preferable.
Percent time in open arms differed remarkablyamong the three labs, whereas the strain difference onthis classical indicator of anxiety was barely signifi-cant. As shown in Figure 5(B) and Table 2, the strain
Table 2 Results of ANOVA for the Elevated Plus Maze with Full and Reduced Data Sets
Variable NGenotype(df % 7)
Site(df % 2)
Genotype! Site (df % 14)
MultipleR2
Time in center 379 0.302 0.180 0.134 0.523341 0.368 0.252 0.131 0.576
Total arm entries 379 0.389 0.327 0.217 0.660341 0.308 0.300 0.143 0.623
Percent time in open arms 379 0.050a 0.265 N.S. 0.445341 0.095 0.310 N.S. 0.527
a p & .01; all other effects significant at p & .001. N.S. indicates p ( .01.Values for specific effects are partial omega-squared coefficients.
Gene–Environment Interaction 295
difference was not small merely because the test wasinsensitive or unreliable; after all, the difference be-tween labs was very large. At the same time, thestandard error bars for percent time in the open armswere relatively larger than for total arm entries [Fig.5(B)] and the multiple R2 was smaller (Table 2). Themultiple R2 and the strain differences were substan-tially larger for the cleansed sample lacking hypoac-
tive mice. Mice of almost all strains spent consider-ably more time in the open arms in Edmonton,whereas they evidenced strong preference for theclosed arms of identical mazes in Portland, with Al-bany being intermediate for almost every strain. Al-though Albany and Edmonton obtained very similarresults for three groups (B6, #/#, F2), the ANOVAfailed to detect a significant interaction.
Figure 5 Group means ' standard error of the mean for eight strains tested in three labs on theelevated plus maze. (A) Total number of arm entries, indicative of the level of locomotor activity,was generally highest in Edmonton, but results were very similar in Edmonton and Portland for thethree 129-derived strains, whereas results were very similar in Albany and Portland for the miceobtained from the Jackson Labs. (B) Percent time spent in the open arms was generally high inEdmonton and low in Portland with Albany being intermediate. Strain differences were not nearlyas large as for number of arm entries.
296 Wahlsten et al.
The relation between activity and anxiety wasclearly quite complex, especially when different labswere introduced into the equations. Caution is war-ranted when a psychologic relation between variablesis based solely on data from a single lab. By involvingthree labs in the study, the range of variation amongand within strains was increased considerably. Forcertain strains, the extended range seemed to clarifythe relation between activity and anxiety (data notshown), but this was certainly not true for all strains.The results for motor activity levels are perhaps easierto grasp and also more in line with the existing liter-ature, whereas the vast range of individual scores onthe anxiety indicator and occurrence of many mice,especially cBy in Edmonton, with a clear preferencefor the open arms, prompts us to wonder how theresults would appear with other tasks believed tosense anxiety. Our results cannot be well understoodunless a wider range of tasks is examined. By testingmice simultaneously in three labs, we have identifiedan important issue for mouse behavioral genetics, butthe scope of this study was not sufficient to identifythe fundamental psychologic processes responsiblefor our results.
Accelerating Rotarod
In this task, the mice extracted their revenge! For thereasons detailed below, we believe that the rotaroddata we collected are essentially uninterpretable, andwe therefore did not report them earlier (Crabbe et al.,1999), nor do we present any ANOVAs here. As thedeadline for starting the experiment neared, we no-ticed that the surfaces of the rotarods were not iden-tical. Even though the genotypes and conditions wererandomized across rods in each site, we were con-cerned that this could distort the estimated perfor-mance of some groups. One of us (J.C.) made thelast-minute and very ill-advised decision to cover allrotarod surfaces with 320 grit wet/dry sandpaper toachieve uniformity. This surface works well on otherrotarods he uses in his laboratory, but those rods havesubstantially larger diameters.
The accelerating rotarod task is designed to placeincreasing demand on the mouse until it is no longerable to stay on top and falls. The behavioral strategyit seeks to measure is a constant shifting of position asthe rod rotates beneath the mouse, akin to a log-rolling contest for humans. However, the combinationof relatively small-diameter rotarod with sandpaperoffered the mice a second (and superior!) behavioralstrategy, which was to “flatten” themselves againstthe rod and essentially wrap themselves around it. Ontrials when a mouse adopted this flattened posture and
grip, its latency to fall was dramatically elevated(latencies of 35–70 s vs. latencies of 5–25 s for mostmice early in training). There were many long laten-cies on the very first trial, and behavior remainedhighly variable throughout training. The correlationfor all 378 mice between latencies on two successivetrials was close to r % .4 across all 10 trials, and thislow reliability was primarily caused by inconsistentflattening from trial to trial.
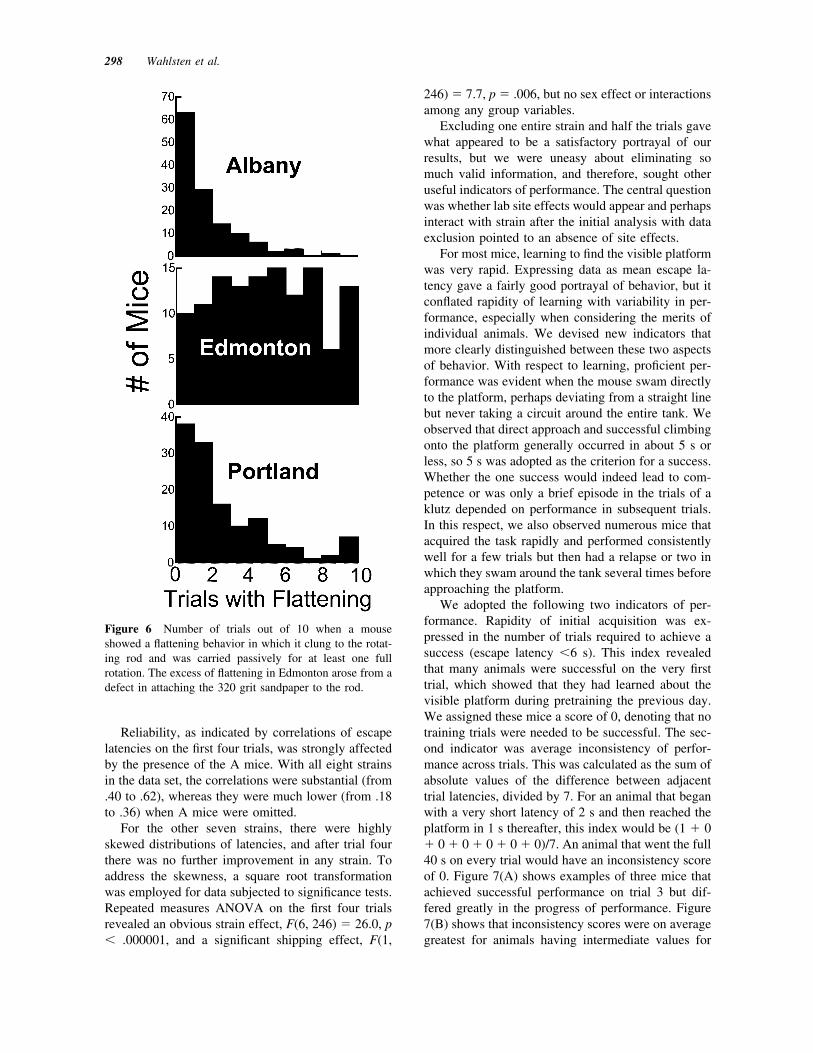
Some mice clearly learned to flatten, based onincreasing numbers of flattened trials in the secondfive versus the first five trials, while others learned towalk skillfully atop the rod, and many others re-mained highly variable. Strains clearly differed in theextent to which they engaged in the flattening strat-egy. For example, a large proportion of B6 miceengaged in this strategy across sites, while D2 micerarely did. Unfortunately, sites differed greatly in theproportion of trials they declared as “flattening” (Fig.6), and we concluded that one contributor to thisdramatic difference was different levels of skill on thepart of the human experimenters in applying the sand-paper to the rod. The seam at the intersection of theedges of the sandpaper tended to be wider in Edmon-ton, and many mice were able to get a claw or twointo the seam and cling to the rod, even on the firsttrial. We tried to cleanse the data of trials with flat-tening, but this proved futile because some cells in thedesign became empty. We reluctantly decided that theresults of this test could not be interpreted. The rawdata from the Portland site are available from J.C. forthe interested peruser.
Water Escape
Perhaps the most striking observation in the waterescape task was the abysmal failure of the A strain toescape on the first trial or improve over trials. Thiswas a consequence of frequent wall hugging by thesemice; they swam constantly and never floated, butthey seldom left the wall. Only five individuals of the48 A mice (three in Edmonton, two in Portland)showed clear evidence of improvement across trialsthat lead to proficient performance. Many mice thatescaped quickly on one trial nevertheless reverted towall hugging on subsequent trials. Thus, the failure toimprove over trials was not caused by a lack ofexperience with successful escape. Instead, perfor-mance of the A strain both early and late in trainingshowed strong interference from wall hugging in thewater tank. No mouse in any other strain showed wallhugging on more than two of the eight trials. For thisreason, data for A were not included in our originalstatistical analyses (Crabbe et al., 1999).
Gene–Environment Interaction 297
Reliability, as indicated by correlations of escapelatencies on the first four trials, was strongly affectedby the presence of the A mice. With all eight strainsin the data set, the correlations were substantial (from.40 to .62), whereas they were much lower (from .18to .36) when A mice were omitted.
For the other seven strains, there were highlyskewed distributions of latencies, and after trial fourthere was no further improvement in any strain. Toaddress the skewness, a square root transformationwas employed for data subjected to significance tests.Repeated measures ANOVA on the first four trialsrevealed an obvious strain effect, F(6, 246) % 26.0, p& .000001, and a significant shipping effect, F(1,
246) % 7.7, p % .006, but no sex effect or interactionsamong any group variables.
Excluding one entire strain and half the trials gavewhat appeared to be a satisfactory portrayal of ourresults, but we were uneasy about eliminating somuch valid information, and therefore, sought otheruseful indicators of performance. The central questionwas whether lab site effects would appear and perhapsinteract with strain after the initial analysis with dataexclusion pointed to an absence of site effects.
For most mice, learning to find the visible platformwas very rapid. Expressing data as mean escape la-tency gave a fairly good portrayal of behavior, but itconflated rapidity of learning with variability in per-formance, especially when considering the merits ofindividual animals. We devised new indicators thatmore clearly distinguished between these two aspectsof behavior. With respect to learning, proficient per-formance was evident when the mouse swam directlyto the platform, perhaps deviating from a straight linebut never taking a circuit around the entire tank. Weobserved that direct approach and successful climbingonto the platform generally occurred in about 5 s orless, so 5 s was adopted as the criterion for a success.Whether the one success would indeed lead to com-petence or was only a brief episode in the trials of aklutz depended on performance in subsequent trials.In this respect, we also observed numerous mice thatacquired the task rapidly and performed consistentlywell for a few trials but then had a relapse or two inwhich they swam around the tank several times beforeapproaching the platform.
We adopted the following two indicators of per-formance. Rapidity of initial acquisition was ex-pressed in the number of trials required to achieve asuccess (escape latency &6 s). This index revealedthat many animals were successful on the very firsttrial, which showed that they had learned about thevisible platform during pretraining the previous day.We assigned these mice a score of 0, denoting that notraining trials were needed to be successful. The sec-ond indicator was average inconsistency of perfor-mance across trials. This was calculated as the sum ofabsolute values of the difference between adjacenttrial latencies, divided by 7. For an animal that beganwith a very short latency of 2 s and then reached theplatform in 1 s thereafter, this index would be (1 " 0" 0 " 0 " 0 " 0 " 0)/7. An animal that went the full40 s on every trial would have an inconsistency scoreof 0. Figure 7(A) shows examples of three mice thatachieved successful performance on trial 3 but dif-fered greatly in the progress of performance. Figure7(B) shows that inconsistency scores were on averagegreatest for animals having intermediate values for
Figure 6 Number of trials out of 10 when a mouseshowed a flattening behavior in which it clung to the rotat-ing rod and was carried passively for at least one fullrotation. The excess of flattening in Edmonton arose from adefect in attaching the 320 grit sandpaper to the rod.
298 Wahlsten et al.
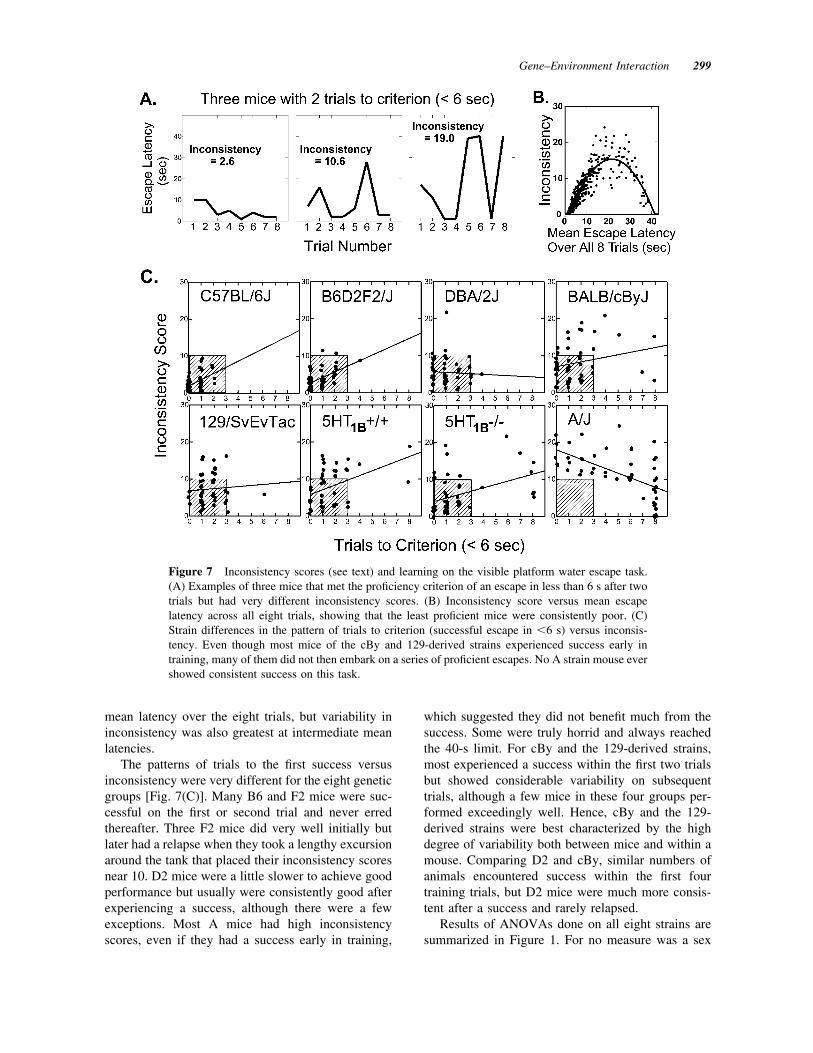
mean latency over the eight trials, but variability ininconsistency was also greatest at intermediate meanlatencies.
The patterns of trials to the first success versusinconsistency were very different for the eight geneticgroups [Fig. 7(C)]. Many B6 and F2 mice were suc-cessful on the first or second trial and never erredthereafter. Three F2 mice did very well initially butlater had a relapse when they took a lengthy excursionaround the tank that placed their inconsistency scoresnear 10. D2 mice were a little slower to achieve goodperformance but usually were consistently good afterexperiencing a success, although there were a fewexceptions. Most A mice had high inconsistencyscores, even if they had a success early in training,
which suggested they did not benefit much from thesuccess. Some were truly horrid and always reachedthe 40-s limit. For cBy and the 129-derived strains,most experienced a success within the first two trialsbut showed considerable variability on subsequenttrials, although a few mice in these four groups per-formed exceedingly well. Hence, cBy and the 129-derived strains were best characterized by the highdegree of variability both between mice and within amouse. Comparing D2 and cBy, similar numbers ofanimals encountered success within the first fourtraining trials, but D2 mice were much more consis-tent after a success and rarely relapsed.
Results of ANOVAs done on all eight strains aresummarized in Figure 1. For no measure was a sex
Figure 7 Inconsistency scores (see text) and learning on the visible platform water escape task.(A) Examples of three mice that met the proficiency criterion of an escape in less than 6 s after twotrials but had very different inconsistency scores. (B) Inconsistency score versus mean escapelatency across all eight trials, showing that the least proficient mice were consistently poor. (C)Strain differences in the pattern of trials to criterion (successful escape in &6 s) versus inconsis-tency. Even though most mice of the cBy and 129-derived strains experienced success early intraining, many of them did not then embark on a series of proficient escapes. No A strain mouse evershowed consistent success on this task.
Gene–Environment Interaction 299
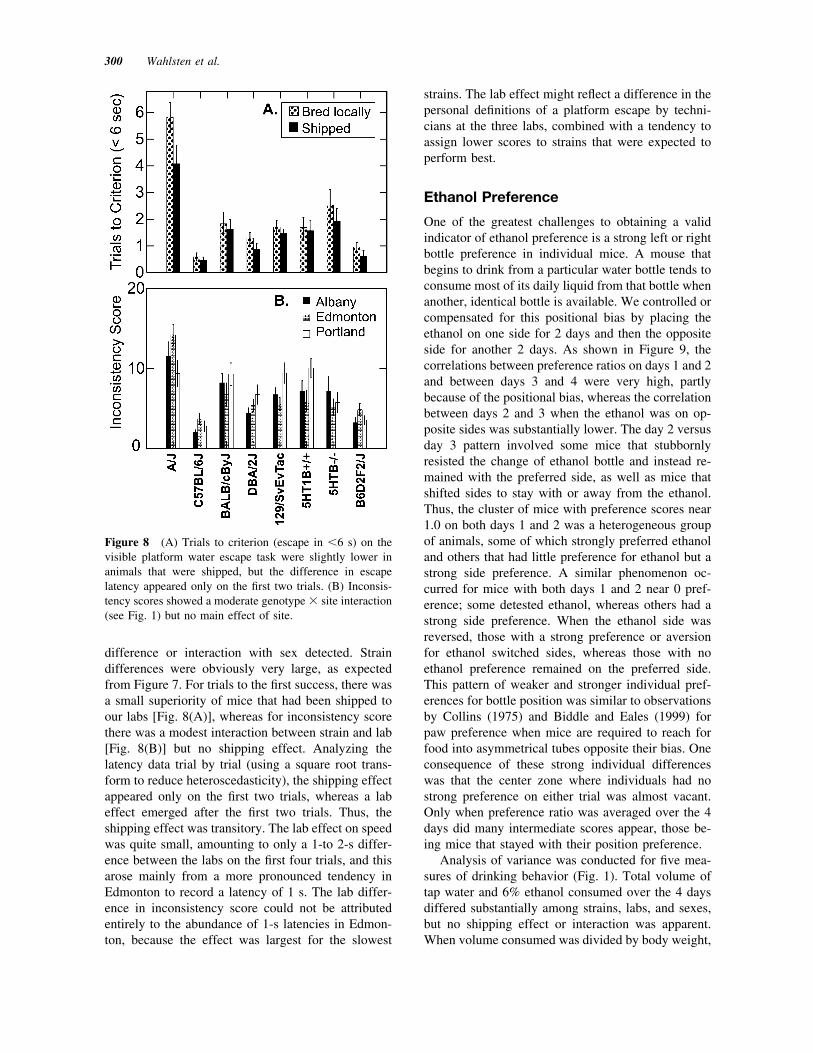
difference or interaction with sex detected. Straindifferences were obviously very large, as expectedfrom Figure 7. For trials to the first success, there wasa small superiority of mice that had been shipped toour labs [Fig. 8(A)], whereas for inconsistency scorethere was a modest interaction between strain and lab[Fig. 8(B)] but no shipping effect. Analyzing thelatency data trial by trial (using a square root trans-form to reduce heteroscedasticity), the shipping effectappeared only on the first two trials, whereas a labeffect emerged after the first two trials. Thus, theshipping effect was transitory. The lab effect on speedwas quite small, amounting to only a 1-to 2-s differ-ence between the labs on the first four trials, and thisarose mainly from a more pronounced tendency inEdmonton to record a latency of 1 s. The lab differ-ence in inconsistency score could not be attributedentirely to the abundance of 1-s latencies in Edmon-ton, because the effect was largest for the slowest
strains. The lab effect might reflect a difference in thepersonal definitions of a platform escape by techni-cians at the three labs, combined with a tendency toassign lower scores to strains that were expected toperform best.
Ethanol Preference
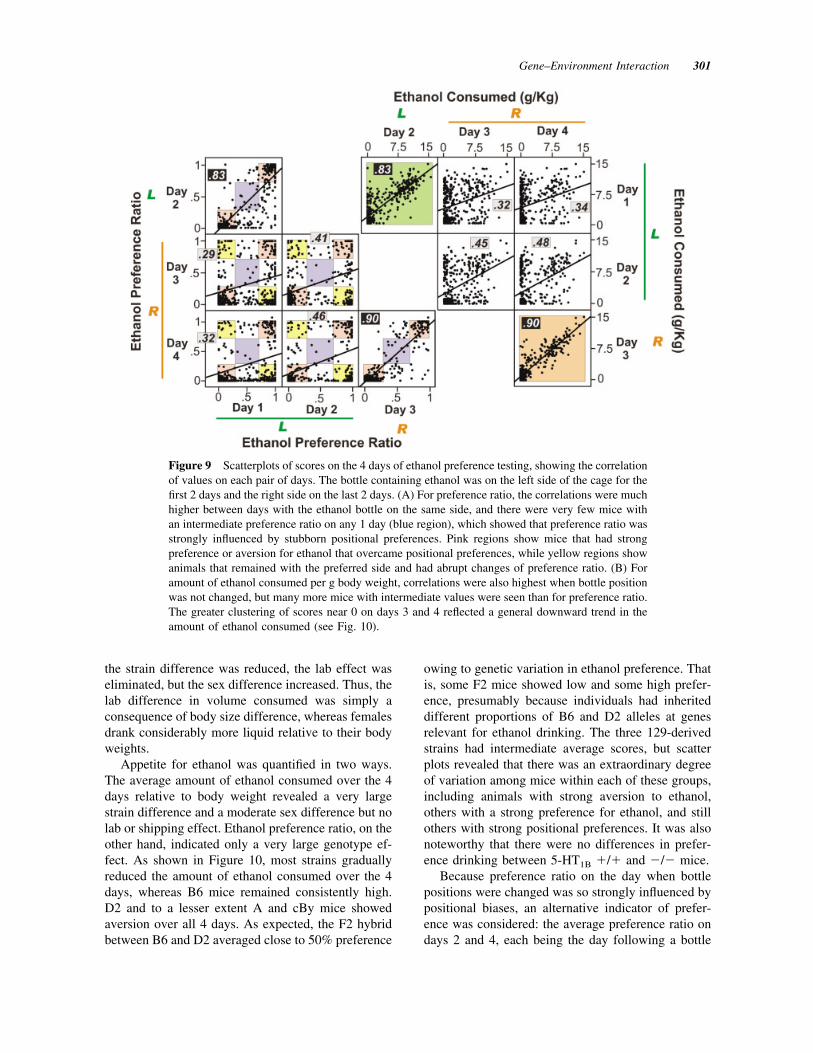
One of the greatest challenges to obtaining a validindicator of ethanol preference is a strong left or rightbottle preference in individual mice. A mouse thatbegins to drink from a particular water bottle tends toconsume most of its daily liquid from that bottle whenanother, identical bottle is available. We controlled orcompensated for this positional bias by placing theethanol on one side for 2 days and then the oppositeside for another 2 days. As shown in Figure 9, thecorrelations between preference ratios on days 1 and 2and between days 3 and 4 were very high, partlybecause of the positional bias, whereas the correlationbetween days 2 and 3 when the ethanol was on op-posite sides was substantially lower. The day 2 versusday 3 pattern involved some mice that stubbornlyresisted the change of ethanol bottle and instead re-mained with the preferred side, as well as mice thatshifted sides to stay with or away from the ethanol.Thus, the cluster of mice with preference scores near1.0 on both days 1 and 2 was a heterogeneous groupof animals, some of which strongly preferred ethanoland others that had little preference for ethanol but astrong side preference. A similar phenomenon oc-curred for mice with both days 1 and 2 near 0 pref-erence; some detested ethanol, whereas others had astrong side preference. When the ethanol side wasreversed, those with a strong preference or aversionfor ethanol switched sides, whereas those with noethanol preference remained on the preferred side.This pattern of weaker and stronger individual pref-erences for bottle position was similar to observationsby Collins (1975) and Biddle and Eales (1999) forpaw preference when mice are required to reach forfood into asymmetrical tubes opposite their bias. Oneconsequence of these strong individual differenceswas that the center zone where individuals had nostrong preference on either trial was almost vacant.Only when preference ratio was averaged over the 4days did many intermediate scores appear, those be-ing mice that stayed with their position preference.
Analysis of variance was conducted for five mea-sures of drinking behavior (Fig. 1). Total volume oftap water and 6% ethanol consumed over the 4 daysdiffered substantially among strains, labs, and sexes,but no shipping effect or interaction was apparent.When volume consumed was divided by body weight,
Figure 8 (A) Trials to criterion (escape in &6 s) on thevisible platform water escape task were slightly lower inanimals that were shipped, but the difference in escapelatency appeared only on the first two trials. (B) Inconsis-tency scores showed a moderate genotype ! site interaction(see Fig. 1) but no main effect of site.
300 Wahlsten et al.
the strain difference was reduced, the lab effect waseliminated, but the sex difference increased. Thus, thelab difference in volume consumed was simply aconsequence of body size difference, whereas femalesdrank considerably more liquid relative to their bodyweights.
Appetite for ethanol was quantified in two ways.The average amount of ethanol consumed over the 4days relative to body weight revealed a very largestrain difference and a moderate sex difference but nolab or shipping effect. Ethanol preference ratio, on theother hand, indicated only a very large genotype ef-fect. As shown in Figure 10, most strains graduallyreduced the amount of ethanol consumed over the 4days, whereas B6 mice remained consistently high.D2 and to a lesser extent A and cBy mice showedaversion over all 4 days. As expected, the F2 hybridbetween B6 and D2 averaged close to 50% preference
owing to genetic variation in ethanol preference. Thatis, some F2 mice showed low and some high prefer-ence, presumably because individuals had inheriteddifferent proportions of B6 and D2 alleles at genesrelevant for ethanol drinking. The three 129-derivedstrains had intermediate average scores, but scatterplots revealed that there was an extraordinary degreeof variation among mice within each of these groups,including animals with strong aversion to ethanol,others with a strong preference for ethanol, and stillothers with strong positional preferences. It was alsonoteworthy that there were no differences in prefer-ence drinking between 5-HT1B "/" and #/# mice.
Because preference ratio on the day when bottlepositions were changed was so strongly influenced bypositional biases, an alternative indicator of prefer-ence was considered: the average preference ratio ondays 2 and 4, each being the day following a bottle
Figure 9 Scatterplots of scores on the 4 days of ethanol preference testing, showing the correlationof values on each pair of days. The bottle containing ethanol was on the left side of the cage for thefirst 2 days and the right side on the last 2 days. (A) For preference ratio, the correlations were muchhigher between days with the ethanol bottle on the same side, and there were very few mice withan intermediate preference ratio on any 1 day (blue region), which showed that preference ratio wasstrongly influenced by stubborn positional preferences. Pink regions show mice that had strongpreference or aversion for ethanol that overcame positional preferences, while yellow regions showanimals that remained with the preferred side and had abrupt changes of preference ratio. (B) Foramount of ethanol consumed per g body weight, correlations were also highest when bottle positionwas not changed, but many more mice with intermediate values were seen than for preference ratio.The greater clustering of scores near 0 on days 3 and 4 reflected a general downward trend in theamount of ethanol consumed (see Fig. 10).
Gene–Environment Interaction 301
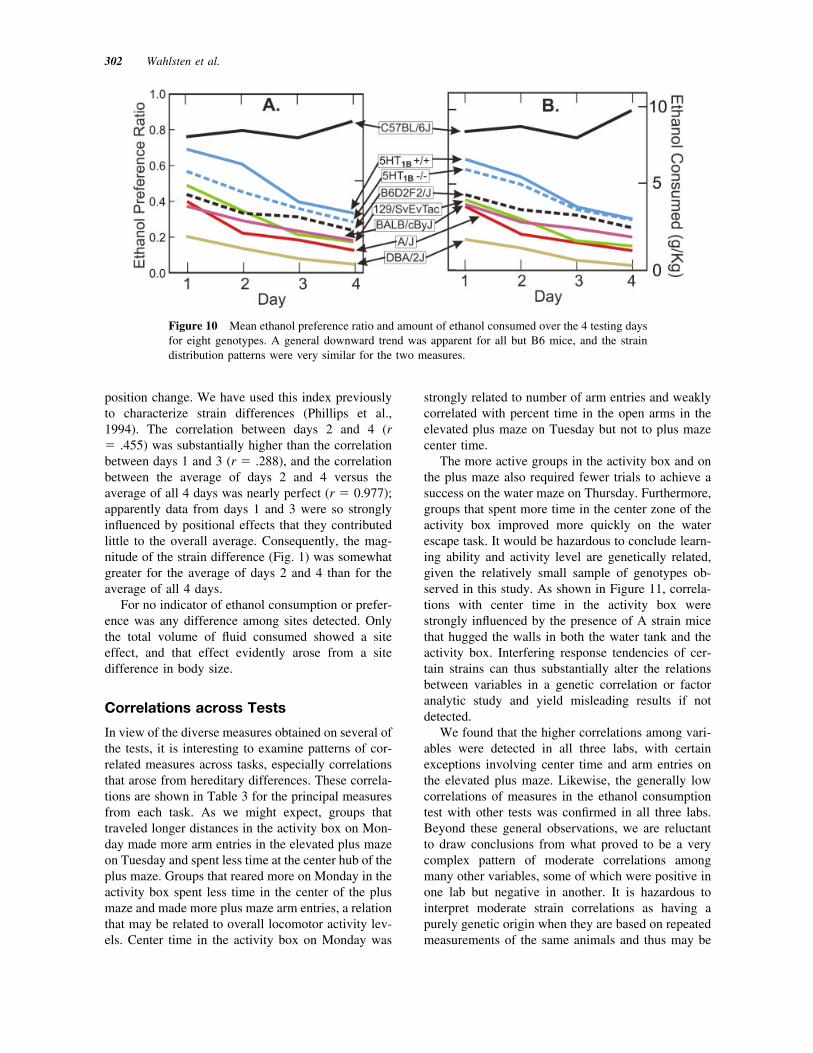
position change. We have used this index previouslyto characterize strain differences (Phillips et al.,1994). The correlation between days 2 and 4 (r% .455) was substantially higher than the correlationbetween days 1 and 3 (r % .288), and the correlationbetween the average of days 2 and 4 versus theaverage of all 4 days was nearly perfect (r % 0.977);apparently data from days 1 and 3 were so stronglyinfluenced by positional effects that they contributedlittle to the overall average. Consequently, the mag-nitude of the strain difference (Fig. 1) was somewhatgreater for the average of days 2 and 4 than for theaverage of all 4 days.
For no indicator of ethanol consumption or prefer-ence was any difference among sites detected. Onlythe total volume of fluid consumed showed a siteeffect, and that effect evidently arose from a sitedifference in body size.
Correlations across Tests
In view of the diverse measures obtained on several ofthe tests, it is interesting to examine patterns of cor-related measures across tasks, especially correlationsthat arose from hereditary differences. These correla-tions are shown in Table 3 for the principal measuresfrom each task. As we might expect, groups thattraveled longer distances in the activity box on Mon-day made more arm entries in the elevated plus mazeon Tuesday and spent less time at the center hub of theplus maze. Groups that reared more on Monday in theactivity box spent less time in the center of the plusmaze and made more plus maze arm entries, a relationthat may be related to overall locomotor activity lev-els. Center time in the activity box on Monday was
strongly related to number of arm entries and weaklycorrelated with percent time in the open arms in theelevated plus maze on Tuesday but not to plus mazecenter time.
The more active groups in the activity box and onthe plus maze also required fewer trials to achieve asuccess on the water maze on Thursday. Furthermore,groups that spent more time in the center zone of theactivity box improved more quickly on the waterescape task. It would be hazardous to conclude learn-ing ability and activity level are genetically related,given the relatively small sample of genotypes ob-served in this study. As shown in Figure 11, correla-tions with center time in the activity box werestrongly influenced by the presence of A strain micethat hugged the walls in both the water tank and theactivity box. Interfering response tendencies of cer-tain strains can thus substantially alter the relationsbetween variables in a genetic correlation or factoranalytic study and yield misleading results if notdetected.
We found that the higher correlations among vari-ables were detected in all three labs, with certainexceptions involving center time and arm entries onthe elevated plus maze. Likewise, the generally lowcorrelations of measures in the ethanol consumptiontest with other tests was confirmed in all three labs.Beyond these general observations, we are reluctantto draw conclusions from what proved to be a verycomplex pattern of moderate correlations amongmany other variables, some of which were positive inone lab but negative in another. It is hazardous tointerpret moderate strain correlations as having apurely genetic origin when they are based on repeatedmeasurements of the same animals and thus may be
Figure 10 Mean ethanol preference ratio and amount of ethanol consumed over the 4 testing daysfor eight genotypes. A general downward trend was apparent for all but B6 mice, and the straindistribution patterns were very similar for the two measures.
302 Wahlsten et al.
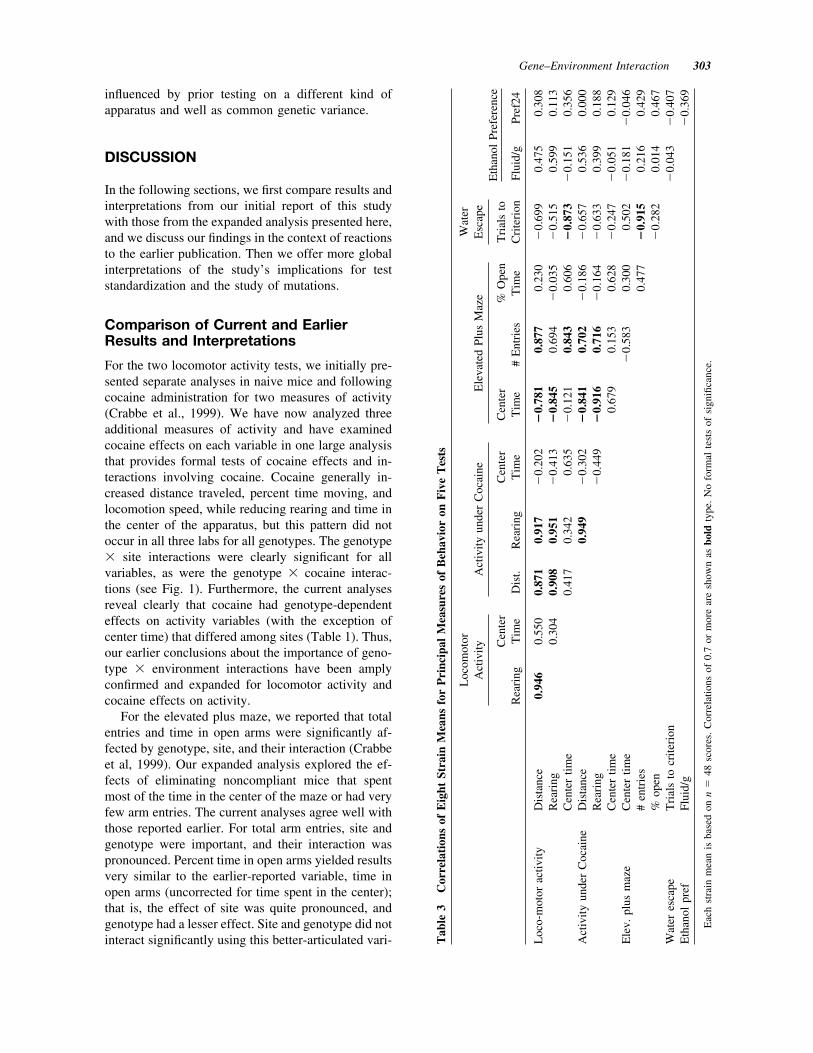
influenced by prior testing on a different kind ofapparatus and well as common genetic variance.
DISCUSSION
In the following sections, we first compare results andinterpretations from our initial report of this studywith those from the expanded analysis presented here,and we discuss our findings in the context of reactionsto the earlier publication. Then we offer more globalinterpretations of the study’s implications for teststandardization and the study of mutations.
Comparison of Current and EarlierResults and Interpretations
For the two locomotor activity tests, we initially pre-sented separate analyses in naive mice and followingcocaine administration for two measures of activity(Crabbe et al., 1999). We have now analyzed threeadditional measures of activity and have examinedcocaine effects on each variable in one large analysisthat provides formal tests of cocaine effects and in-teractions involving cocaine. Cocaine generally in-creased distance traveled, percent time moving, andlocomotion speed, while reducing rearing and time inthe center of the apparatus, but this pattern did notoccur in all three labs for all genotypes. The genotype! site interactions were clearly significant for allvariables, as were the genotype ! cocaine interac-tions (see Fig. 1). Furthermore, the current analysesreveal clearly that cocaine had genotype-dependenteffects on activity variables (with the exception ofcenter time) that differed among sites (Table 1). Thus,our earlier conclusions about the importance of geno-type ! environment interactions have been amplyconfirmed and expanded for locomotor activity andcocaine effects on activity.
For the elevated plus maze, we reported that totalentries and time in open arms were significantly af-fected by genotype, site, and their interaction (Crabbeet al, 1999). Our expanded analysis explored the ef-fects of eliminating noncompliant mice that spentmost of the time in the center of the maze or had veryfew arm entries. The current analyses agree well withthose reported earlier. For total arm entries, site andgenotype were important, and their interaction waspronounced. Percent time in open arms yielded resultsvery similar to the earlier-reported variable, time inopen arms (uncorrected for time spent in the center);that is, the effect of site was quite pronounced, andgenotype had a lesser effect. Site and genotype did notinteract significantly using this better-articulated vari- T
able
3C
orre
lati
ons
ofE
ight
Stra
inM
eans
for
Pri
ncip
alM
easu
res
ofB
ehav
ior
onF
ive
Tes
ts
Loc
omot
orA
ctiv
ityA
ctiv
ityun
der
Coc
aine
Ele
vate
dPl
usM
aze
Wat
erE
scap
eE
than
olPr
efer
ence
Rea
ring
Cen
ter
Tim
eD
ist.
Rea
ring
Cen
ter
Tim
eC
ente
rT
ime
#E
ntri
es%
Ope
nT
ime
Tri
als
toC
rite
rion
Flui
d/g
Pref
24
Loc
o-m
otor
activ
ityD
ista
nce
0.94
60.
550
0.87
10.
917
#0.
202
!0.
781
0.87
70.
230
#0.
699
0.47
50.
308
Rea
ring
0.30
40.
908
0.95
1#
0.41
3!
0.84
50.
694
#0.
035
#0.
515
0.59
90.
113
Cen
ter
time
0.41
70.
342
0.63
5#
0.12
10.
843
0.60
6!
0.87
3#
0.15
10.
356
Act
ivity
unde
rC
ocai
neD
ista
nce
0.94
9#
0.30
2!
0.84
10.
702
#0.
186
#0.
657
0.53
60.
000
Rea
ring
#0.
449
!0.
916
0.71
6#
0.16
4#
0.63
30.
399
0.18
8C
ente
rtim
e0.
679
0.15
30.
628
#0.
247
#0.
051
0.12
9E
lev.
plus
maz
eC
ente
rtim
e#
0.58
30.
300
0.50
2#
0.18
1#
0.04
6#
entr
ies
0.47
7!
0.91
50.
216
0.42
9%
open
#0.
282
0.01
40.
467
Wat
eres
cape
Tri
als
tocr
iteri
on#
0.04
3#
0.40
7E
than
olpr
efFl
uid/
g#
0.36
9
Eac
hst
rain
mea
nis
base
don
n%
48sc
ores
.Cor
rela
tions
of0.
7or
mor
ear
esh
own
asbo
ldty
pe.N
ofo
rmal
test
sof
sign
ifica
nce.
Gene–Environment Interaction 303
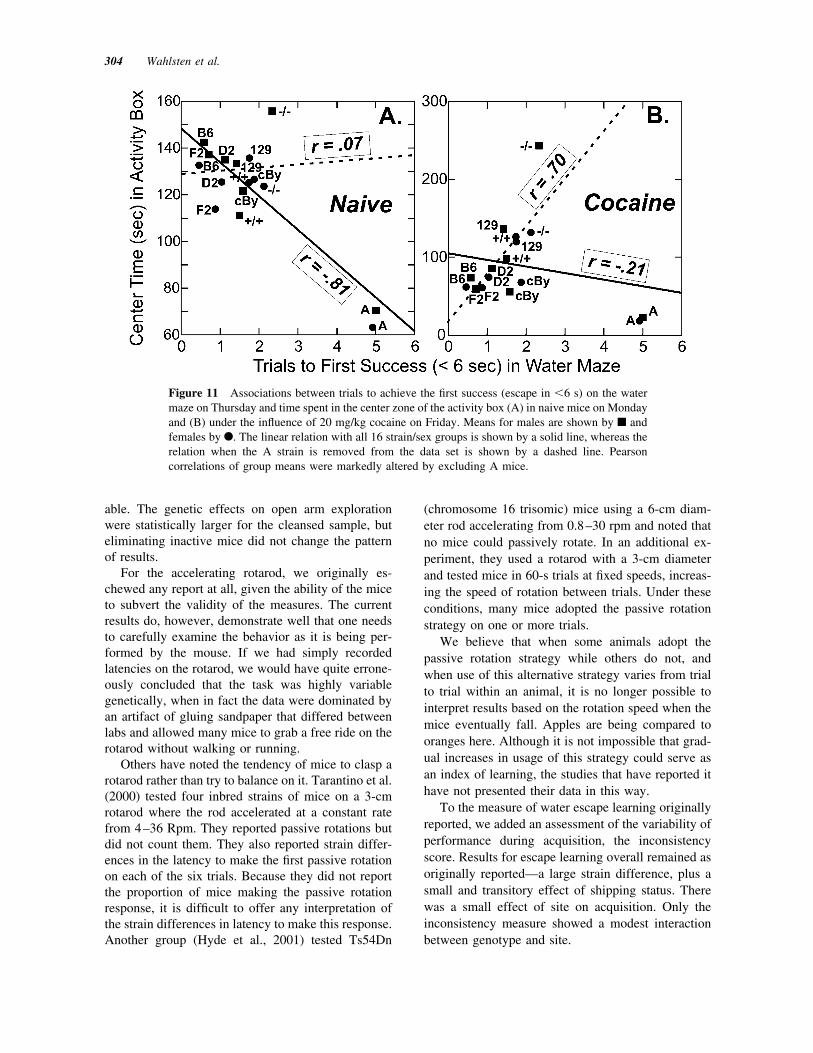
able. The genetic effects on open arm explorationwere statistically larger for the cleansed sample, buteliminating inactive mice did not change the patternof results.
For the accelerating rotarod, we originally es-chewed any report at all, given the ability of the miceto subvert the validity of the measures. The currentresults do, however, demonstrate well that one needsto carefully examine the behavior as it is being per-formed by the mouse. If we had simply recordedlatencies on the rotarod, we would have quite errone-ously concluded that the task was highly variablegenetically, when in fact the data were dominated byan artifact of gluing sandpaper that differed betweenlabs and allowed many mice to grab a free ride on therotarod without walking or running.
Others have noted the tendency of mice to clasp arotarod rather than try to balance on it. Tarantino et al.(2000) tested four inbred strains of mice on a 3-cmrotarod where the rod accelerated at a constant ratefrom 4–36 Rpm. They reported passive rotations butdid not count them. They also reported strain differ-ences in the latency to make the first passive rotationon each of the six trials. Because they did not reportthe proportion of mice making the passive rotationresponse, it is difficult to offer any interpretation ofthe strain differences in latency to make this response.Another group (Hyde et al., 2001) tested Ts54Dn
(chromosome 16 trisomic) mice using a 6-cm diam-eter rod accelerating from 0.8–30 rpm and noted thatno mice could passively rotate. In an additional ex-periment, they used a rotarod with a 3-cm diameterand tested mice in 60-s trials at fixed speeds, increas-ing the speed of rotation between trials. Under theseconditions, many mice adopted the passive rotationstrategy on one or more trials.
We believe that when some animals adopt thepassive rotation strategy while others do not, andwhen use of this alternative strategy varies from trialto trial within an animal, it is no longer possible tointerpret results based on the rotation speed when themice eventually fall. Apples are being compared tooranges here. Although it is not impossible that grad-ual increases in usage of this strategy could serve asan index of learning, the studies that have reported ithave not presented their data in this way.
To the measure of water escape learning originallyreported, we added an assessment of the variability ofperformance during acquisition, the inconsistencyscore. Results for escape learning overall remained asoriginally reported—a large strain difference, plus asmall and transitory effect of shipping status. Therewas a small effect of site on acquisition. Only theinconsistency measure showed a modest interactionbetween genotype and site.
Figure 11 Associations between trials to achieve the first success (escape in &6 s) on the watermaze on Thursday and time spent in the center zone of the activity box (A) in naive mice on Mondayand (B) under the influence of 20 mg/kg cocaine on Friday. Means for males are shown by ! andfemales by F. The linear relation with all 16 strain/sex groups is shown by a solid line, whereas therelation when the A strain is removed from the data set is shown by a dashed line. Pearsoncorrelations of group means were markedly altered by excluding A mice.
304 Wahlsten et al.
Generally speaking, when the lab effect is statisti-cally significant but numerically small, as occurredfor water escape learning over the first few trials,concerns about the exact definitions of behavior ateach lab are legitimate, especially when the technicianmust make a decision about when to stop the clock.This problem can best be addressed in the future withautomated, computer-based video tracking or photo-cell detection in each lab.
Finally, for ethanol preference drinking, we in-clude here reports of preference ratio and total fluidconsumption. We also report on a measure of prefer-ence we have used elsewhere to characterize geno-types that eliminates some of the bottle position bias(Phillips et al., 1994). Basically, we saw for the ad-ditional variables what we had earlier reported. Fe-males drink more than males, and the genotypes differdrastically. There were no site ! genotype interac-tions in either analysis for any alcohol variables. Fur-thermore, measures in the ethanol preference testsshowed low genotypic correlations with measures onother tests.
Analyses of genotype-specific effects cannot beextricated from the situation in which they are as-sessed. This fundamental conclusion from the earlierreport (Crabbe et al., 1999) remains appropriate, evenwhen the data collected are subjected to more exten-sive scrutiny. The additional variables we report herealso showed significant evidence for genotype ! siteinteraction. In many cases, those interactions weresubstantial, and in some cases, a given genotypiccomparison would have led to one conclusion in onelaboratory but an opposite conclusion in another.
In both the original report and after assessingadditional measures, effects of shipping conditionand sex were generally small and nonsignificant.Only the greater ethanol consumption by femalesstands as a noteworthy sex difference in our data.These results do not justify the study of only onesex in behavioral research, but they do suggest thatpower and sample size calculations used to plan astudy can often be done for the combined numberof male and female mice, provided equal numbersof each sex are employed. Exceptions to this ruleneed to be made for tests where sex differences areexpected or may be of central interest in the re-search. The general absence of noteworthy shippingeffects on commonly studied behaviors may pro-vide comfort to labs that use different approaches toobtaining mice, but our data cannot exclude thepossibility of shipping effects when mice are testedsoon after arrival in the lab.
Response to the Original Report
Reactions to the 1999 report in Science covered thespectrum of opinion from an indignant sigh that we allknew this already to hysterical outbursts that ourfindings invalidate the entire field of behavioral ge-netics. Most comments, of course, were more moder-ate and thoughtful. Some of the interpretations andmisinterpretations have been discussed well in a fea-ture article by a neuroscientist in The Sciences (Sapol-sky, 2000). Given our interpretation of the resultsrestated above, we were puzzled when discussingthese data publicly to find that many apparently inter-preted the results pessimistically to indicate that be-havioral tasks were intrinsically unreliable in mice,and that strain differences were unstable across envi-ronmental conditions. Thus, we were curious aboutwhat those who chose to cite the article would have tosay.
ISI Web of Science listed 133 papers (excludingbooks and book chapters) in December, 2001, thatcited Crabbe et al. (1999). The fairly widespreadcitation of this article is congruent with our personalexperience; we have been approached many timesabout the study by other neuroscientists as well asjournalists. The interpretation of the results dependedto some extent on the eye of the beholder. In anattempt to characterize the nature of the citations, weevaluated a selection of the 133 citing papers. Weexcluded seven that were authored by one of us.Using a random number table, we selected 25 papersof the remaining 126 for analysis. We eliminated sixpapers because the journal could not be located easilyin Portland. We eliminated three more papers becausethe author or the author(s) group was already repre-sented by a previous selection. These nine deletionswere replaced by nominations from the next ninerandom numbers.
Using professional judgment, tempered with astandard dose of ox-gored authoritis, one of us (J.C.)categorized the nature of the citation with one or moredescriptors, as accurate (i.e., sharing the authors’ bi-ases), inaccurate (by reason of a demonstrable, non-trivial error in the content of the citation), overlynegative (i.e., accurate, but stating the pessimisticinterpretation cited in the preceding paragraph), mis-leading (e.g., citing the article as evidence for anauthor-favored position not addressed by the article),or irrelevant (i.e., to the goal here: the typical irrele-vant citation merely cited the article as showing straindifferences in ethanol preference drinking). A finalcategory, bizarre, was reserved for one unparseablecitation. The citations were apportioned as follows: 15accurate, 3 overly negative, 3 inaccurate and mislead-
Gene–Environment Interaction 305
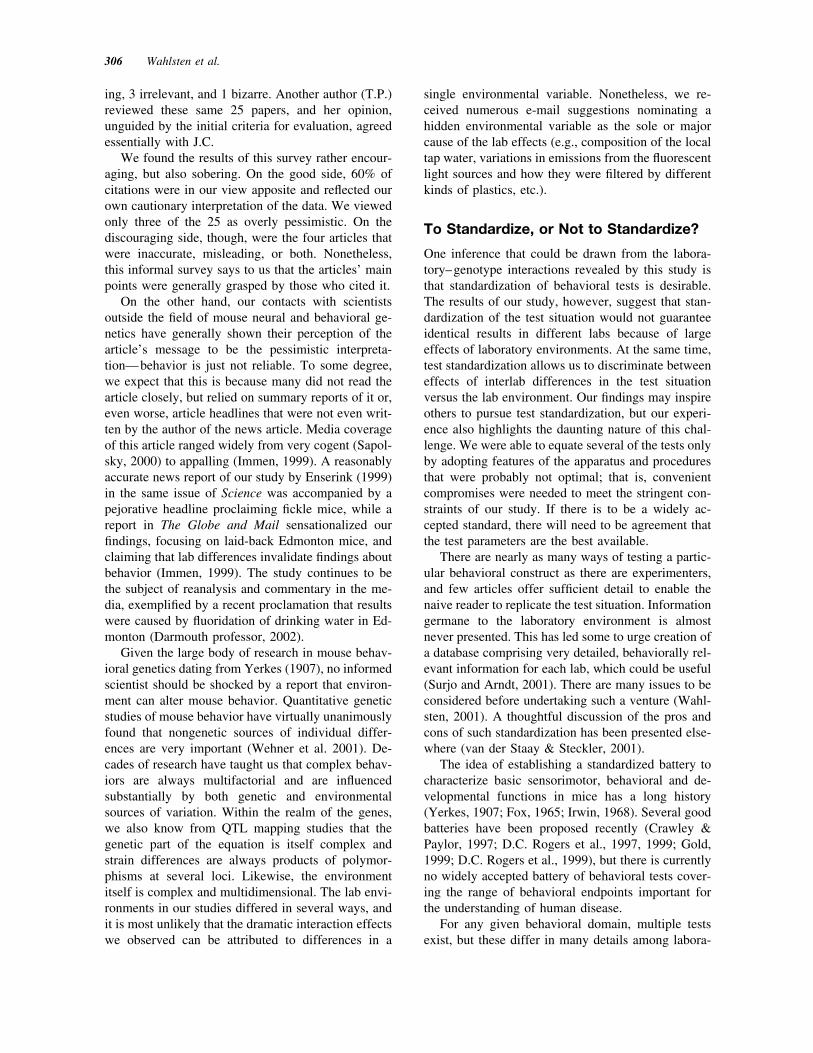
ing, 3 irrelevant, and 1 bizarre. Another author (T.P.)reviewed these same 25 papers, and her opinion,unguided by the initial criteria for evaluation, agreedessentially with J.C.
We found the results of this survey rather encour-aging, but also sobering. On the good side, 60% ofcitations were in our view apposite and reflected ourown cautionary interpretation of the data. We viewedonly three of the 25 as overly pessimistic. On thediscouraging side, though, were the four articles thatwere inaccurate, misleading, or both. Nonetheless,this informal survey says to us that the articles’ mainpoints were generally grasped by those who cited it.
On the other hand, our contacts with scientistsoutside the field of mouse neural and behavioral ge-netics have generally shown their perception of thearticle’s message to be the pessimistic interpreta-tion—behavior is just not reliable. To some degree,we expect that this is because many did not read thearticle closely, but relied on summary reports of it or,even worse, article headlines that were not even writ-ten by the author of the news article. Media coverageof this article ranged widely from very cogent (Sapol-sky, 2000) to appalling (Immen, 1999). A reasonablyaccurate news report of our study by Enserink (1999)in the same issue of Science was accompanied by apejorative headline proclaiming fickle mice, while areport in The Globe and Mail sensationalized ourfindings, focusing on laid-back Edmonton mice, andclaiming that lab differences invalidate findings aboutbehavior (Immen, 1999). The study continues to bethe subject of reanalysis and commentary in the me-dia, exemplified by a recent proclamation that resultswere caused by fluoridation of drinking water in Ed-monton (Darmouth professor, 2002).
Given the large body of research in mouse behav-ioral genetics dating from Yerkes (1907), no informedscientist should be shocked by a report that environ-ment can alter mouse behavior. Quantitative geneticstudies of mouse behavior have virtually unanimouslyfound that nongenetic sources of individual differ-ences are very important (Wehner et al. 2001). De-cades of research have taught us that complex behav-iors are always multifactorial and are influencedsubstantially by both genetic and environmentalsources of variation. Within the realm of the genes,we also know from QTL mapping studies that thegenetic part of the equation is itself complex andstrain differences are always products of polymor-phisms at several loci. Likewise, the environmentitself is complex and multidimensional. The lab envi-ronments in our studies differed in several ways, andit is most unlikely that the dramatic interaction effectswe observed can be attributed to differences in a
single environmental variable. Nonetheless, we re-ceived numerous e-mail suggestions nominating ahidden environmental variable as the sole or majorcause of the lab effects (e.g., composition of the localtap water, variations in emissions from the fluorescentlight sources and how they were filtered by differentkinds of plastics, etc.).
To Standardize, or Not to Standardize?
One inference that could be drawn from the labora-tory–genotype interactions revealed by this study isthat standardization of behavioral tests is desirable.The results of our study, however, suggest that stan-dardization of the test situation would not guaranteeidentical results in different labs because of largeeffects of laboratory environments. At the same time,test standardization allows us to discriminate betweeneffects of interlab differences in the test situationversus the lab environment. Our findings may inspireothers to pursue test standardization, but our experi-ence also highlights the daunting nature of this chal-lenge. We were able to equate several of the tests onlyby adopting features of the apparatus and proceduresthat were probably not optimal; that is, convenientcompromises were needed to meet the stringent con-straints of our study. If there is to be a widely ac-cepted standard, there will need to be agreement thatthe test parameters are the best available.
There are nearly as many ways of testing a partic-ular behavioral construct as there are experimenters,and few articles offer sufficient detail to enable thenaive reader to replicate the test situation. Informationgermane to the laboratory environment is almostnever presented. This has led some to urge creation ofa database comprising very detailed, behaviorally rel-evant information for each lab, which could be useful(Surjo and Arndt, 2001). There are many issues to beconsidered before undertaking such a venture (Wahl-sten, 2001). A thoughtful discussion of the pros andcons of such standardization has been presented else-where (van der Staay & Steckler, 2001).
The idea of establishing a standardized battery tocharacterize basic sensorimotor, behavioral and de-velopmental functions in mice has a long history(Yerkes, 1907; Fox, 1965; Irwin, 1968). Several goodbatteries have been proposed recently (Crawley &Paylor, 1997; D.C. Rogers et al., 1997, 1999; Gold,1999; D.C. Rogers et al., 1999), but there is currentlyno widely accepted battery of behavioral tests cover-ing the range of behavioral endpoints important forthe understanding of human disease.
For any given behavioral domain, multiple testsexist, but these differ in many details among labora-
306 Wahlsten et al.
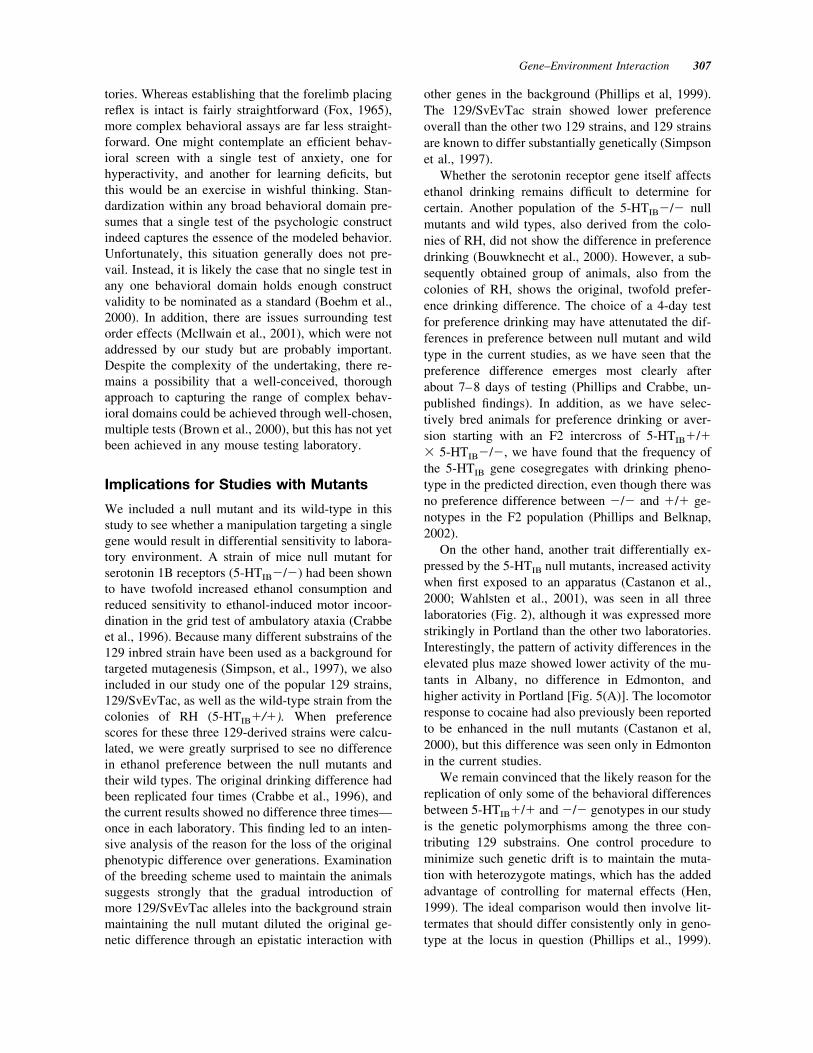
tories. Whereas establishing that the forelimb placingreflex is intact is fairly straightforward (Fox, 1965),more complex behavioral assays are far less straight-forward. One might contemplate an efficient behav-ioral screen with a single test of anxiety, one forhyperactivity, and another for learning deficits, butthis would be an exercise in wishful thinking. Stan-dardization within any broad behavioral domain pre-sumes that a single test of the psychologic constructindeed captures the essence of the modeled behavior.Unfortunately, this situation generally does not pre-vail. Instead, it is likely the case that no single test inany one behavioral domain holds enough constructvalidity to be nominated as a standard (Boehm et al.,2000). In addition, there are issues surrounding testorder effects (Mcllwain et al., 2001), which were notaddressed by our study but are probably important.Despite the complexity of the undertaking, there re-mains a possibility that a well-conceived, thoroughapproach to capturing the range of complex behav-ioral domains could be achieved through well-chosen,multiple tests (Brown et al., 2000), but this has not yetbeen achieved in any mouse testing laboratory.
Implications for Studies with Mutants
We included a null mutant and its wild-type in thisstudy to see whether a manipulation targeting a singlegene would result in differential sensitivity to labora-tory environment. A strain of mice null mutant forserotonin 1B receptors (5-HTIB#/#) had been shownto have twofold increased ethanol consumption andreduced sensitivity to ethanol-induced motor incoor-dination in the grid test of ambulatory ataxia (Crabbeet al., 1996). Because many different substrains of the129 inbred strain have been used as a background fortargeted mutagenesis (Simpson, et al., 1997), we alsoincluded in our study one of the popular 129 strains,129/SvEvTac, as well as the wild-type strain from thecolonies of RH (5-HTIB"/"). When preferencescores for these three 129-derived strains were calcu-lated, we were greatly surprised to see no differencein ethanol preference between the null mutants andtheir wild types. The original drinking difference hadbeen replicated four times (Crabbe et al., 1996), andthe current results showed no difference three times—once in each laboratory. This finding led to an inten-sive analysis of the reason for the loss of the originalphenotypic difference over generations. Examinationof the breeding scheme used to maintain the animalssuggests strongly that the gradual introduction ofmore 129/SvEvTac alleles into the background strainmaintaining the null mutant diluted the original ge-netic difference through an epistatic interaction with
other genes in the background (Phillips et al, 1999).The 129/SvEvTac strain showed lower preferenceoverall than the other two 129 strains, and 129 strainsare known to differ substantially genetically (Simpsonet al., 1997).
Whether the serotonin receptor gene itself affectsethanol drinking remains difficult to determine forcertain. Another population of the 5-HTIB#/# nullmutants and wild types, also derived from the colo-nies of RH, did not show the difference in preferencedrinking (Bouwknecht et al., 2000). However, a sub-sequently obtained group of animals, also from thecolonies of RH, shows the original, twofold prefer-ence drinking difference. The choice of a 4-day testfor preference drinking may have attenutated the dif-ferences in preference between null mutant and wildtype in the current studies, as we have seen that thepreference difference emerges most clearly afterabout 7–8 days of testing (Phillips and Crabbe, un-published findings). In addition, as we have selec-tively bred animals for preference drinking or aver-sion starting with an F2 intercross of 5-HTIB"/"! 5-HTIB#/#, we have found that the frequency ofthe 5-HTIB gene cosegregates with drinking pheno-type in the predicted direction, even though there wasno preference difference between #/# and "/" ge-notypes in the F2 population (Phillips and Belknap,2002).
On the other hand, another trait differentially ex-pressed by the 5-HTIB null mutants, increased activitywhen first exposed to an apparatus (Castanon et al.,2000; Wahlsten et al., 2001), was seen in all threelaboratories (Fig. 2), although it was expressed morestrikingly in Portland than the other two laboratories.Interestingly, the pattern of activity differences in theelevated plus maze showed lower activity of the mu-tants in Albany, no difference in Edmonton, andhigher activity in Portland [Fig. 5(A)]. The locomotorresponse to cocaine had also previously been reportedto be enhanced in the null mutants (Castanon et al,2000), but this difference was seen only in Edmontonin the current studies.
We remain convinced that the likely reason for thereplication of only some of the behavioral differencesbetween 5-HTIB"/" and #/# genotypes in our studyis the genetic polymorphisms among the three con-tributing 129 substrains. One control procedure tominimize such genetic drift is to maintain the muta-tion with heterozygote matings, which has the addedadvantage of controlling for maternal effects (Hen,1999). The ideal comparison would then involve lit-termates that should differ consistently only in geno-type at the locus in question (Phillips et al., 1999).
Gene–Environment Interaction 307
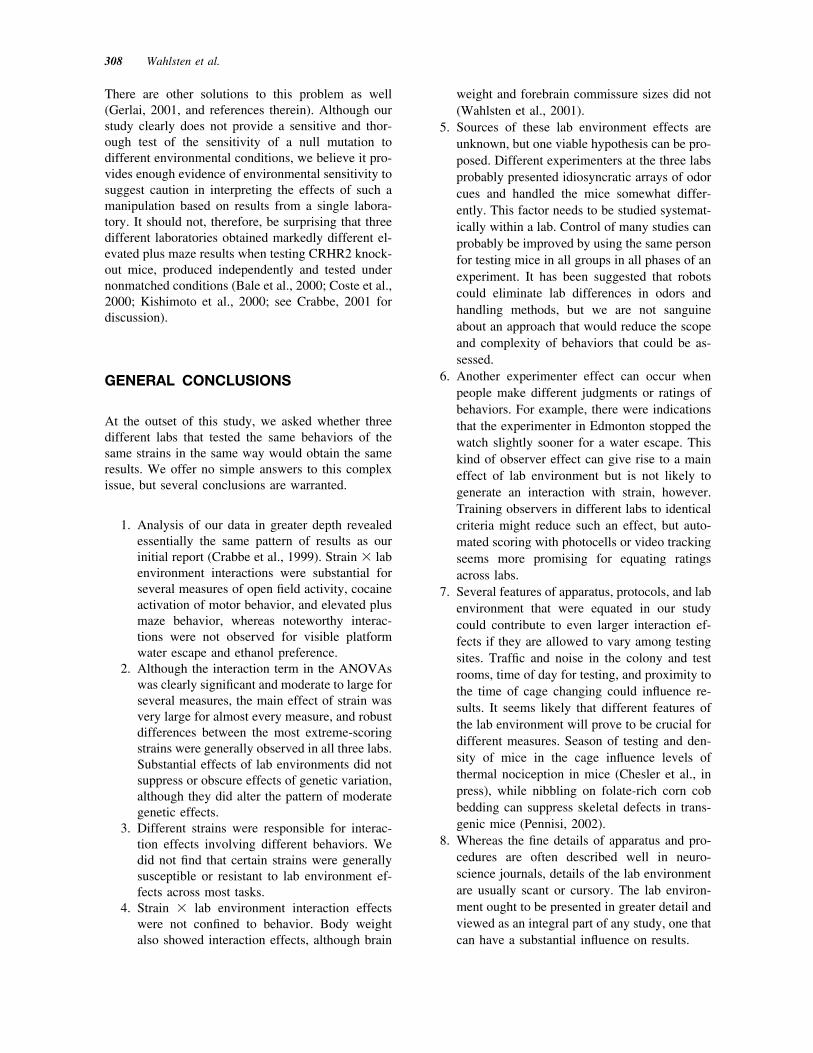
There are other solutions to this problem as well(Gerlai, 2001, and references therein). Although ourstudy clearly does not provide a sensitive and thor-ough test of the sensitivity of a null mutation todifferent environmental conditions, we believe it pro-vides enough evidence of environmental sensitivity tosuggest caution in interpreting the effects of such amanipulation based on results from a single labora-tory. It should not, therefore, be surprising that threedifferent laboratories obtained markedly different el-evated plus maze results when testing CRHR2 knock-out mice, produced independently and tested undernonmatched conditions (Bale et al., 2000; Coste et al.,2000; Kishimoto et al., 2000; see Crabbe, 2001 fordiscussion).
GENERAL CONCLUSIONS
At the outset of this study, we asked whether threedifferent labs that tested the same behaviors of thesame strains in the same way would obtain the sameresults. We offer no simple answers to this complexissue, but several conclusions are warranted.
1. Analysis of our data in greater depth revealedessentially the same pattern of results as ourinitial report (Crabbe et al., 1999). Strain ! labenvironment interactions were substantial forseveral measures of open field activity, cocaineactivation of motor behavior, and elevated plusmaze behavior, whereas noteworthy interac-tions were not observed for visible platformwater escape and ethanol preference.
2. Although the interaction term in the ANOVAswas clearly significant and moderate to large forseveral measures, the main effect of strain wasvery large for almost every measure, and robustdifferences between the most extreme-scoringstrains were generally observed in all three labs.Substantial effects of lab environments did notsuppress or obscure effects of genetic variation,although they did alter the pattern of moderategenetic effects.
3. Different strains were responsible for interac-tion effects involving different behaviors. Wedid not find that certain strains were generallysusceptible or resistant to lab environment ef-fects across most tasks.
4. Strain ! lab environment interaction effectswere not confined to behavior. Body weightalso showed interaction effects, although brain
weight and forebrain commissure sizes did not(Wahlsten et al., 2001).
5. Sources of these lab environment effects areunknown, but one viable hypothesis can be pro-posed. Different experimenters at the three labsprobably presented idiosyncratic arrays of odorcues and handled the mice somewhat differ-ently. This factor needs to be studied systemat-ically within a lab. Control of many studies canprobably be improved by using the same personfor testing mice in all groups in all phases of anexperiment. It has been suggested that robotscould eliminate lab differences in odors andhandling methods, but we are not sanguineabout an approach that would reduce the scopeand complexity of behaviors that could be as-sessed.
6. Another experimenter effect can occur whenpeople make different judgments or ratings ofbehaviors. For example, there were indicationsthat the experimenter in Edmonton stopped thewatch slightly sooner for a water escape. Thiskind of observer effect can give rise to a maineffect of lab environment but is not likely togenerate an interaction with strain, however.Training observers in different labs to identicalcriteria might reduce such an effect, but auto-mated scoring with photocells or video trackingseems more promising for equating ratingsacross labs.
7. Several features of apparatus, protocols, and labenvironment that were equated in our studycould contribute to even larger interaction ef-fects if they are allowed to vary among testingsites. Traffic and noise in the colony and testrooms, time of day for testing, and proximity tothe time of cage changing could influence re-sults. It seems likely that different features ofthe lab environment will prove to be crucial fordifferent measures. Season of testing and den-sity of mice in the cage influence levels ofthermal nociception in mice (Chesler et al., inpress), while nibbling on folate-rich corn cobbedding can suppress skeletal defects in trans-genic mice (Pennisi, 2002).
8. Whereas the fine details of apparatus and pro-cedures are often described well in neuro-science journals, details of the lab environmentare usually scant or cursory. The lab environ-ment ought to be presented in greater detail andviewed as an integral part of any study, one thatcan have a substantial influence on results.
308 Wahlsten et al.
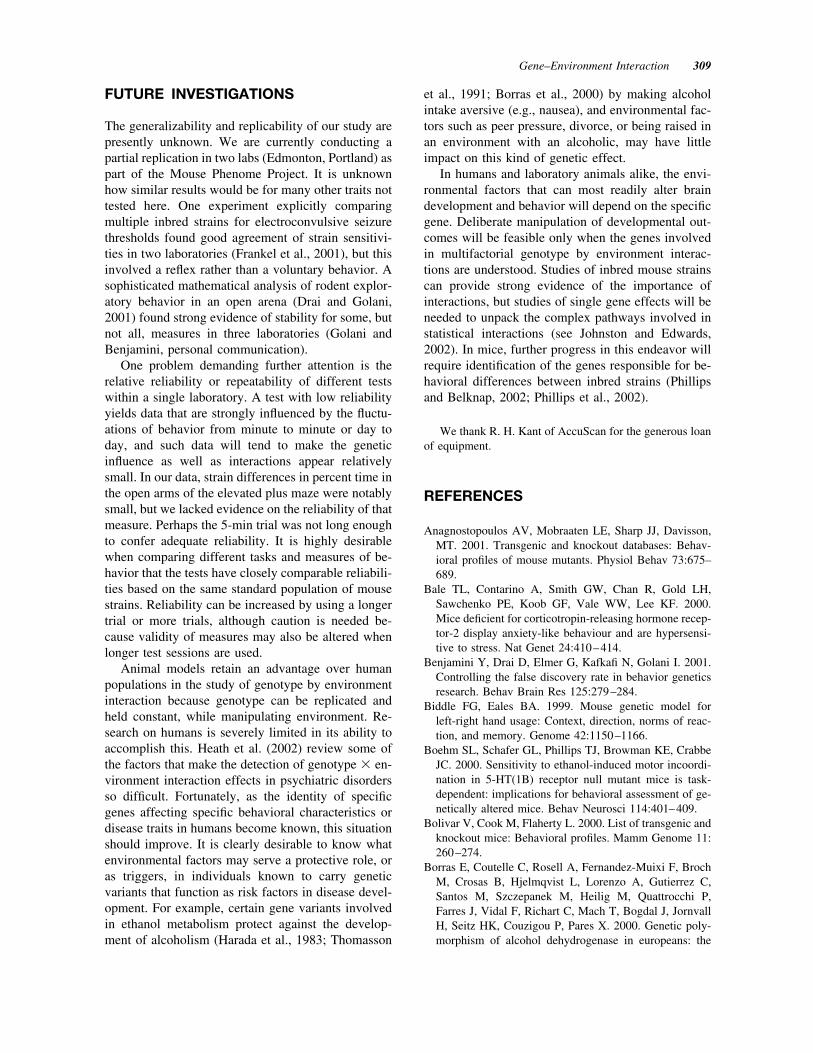
FUTURE INVESTIGATIONS
The generalizability and replicability of our study arepresently unknown. We are currently conducting apartial replication in two labs (Edmonton, Portland) aspart of the Mouse Phenome Project. It is unknownhow similar results would be for many other traits nottested here. One experiment explicitly comparingmultiple inbred strains for electroconvulsive seizurethresholds found good agreement of strain sensitivi-ties in two laboratories (Frankel et al., 2001), but thisinvolved a reflex rather than a voluntary behavior. Asophisticated mathematical analysis of rodent explor-atory behavior in an open arena (Drai and Golani,2001) found strong evidence of stability for some, butnot all, measures in three laboratories (Golani andBenjamini, personal communication).
One problem demanding further attention is therelative reliability or repeatability of different testswithin a single laboratory. A test with low reliabilityyields data that are strongly influenced by the fluctu-ations of behavior from minute to minute or day today, and such data will tend to make the geneticinfluence as well as interactions appear relativelysmall. In our data, strain differences in percent time inthe open arms of the elevated plus maze were notablysmall, but we lacked evidence on the reliability of thatmeasure. Perhaps the 5-min trial was not long enoughto confer adequate reliability. It is highly desirablewhen comparing different tasks and measures of be-havior that the tests have closely comparable reliabili-ties based on the same standard population of mousestrains. Reliability can be increased by using a longertrial or more trials, although caution is needed be-cause validity of measures may also be altered whenlonger test sessions are used.
Animal models retain an advantage over humanpopulations in the study of genotype by environmentinteraction because genotype can be replicated andheld constant, while manipulating environment. Re-search on humans is severely limited in its ability toaccomplish this. Heath et al. (2002) review some ofthe factors that make the detection of genotype ! en-vironment interaction effects in psychiatric disordersso difficult. Fortunately, as the identity of specificgenes affecting specific behavioral characteristics ordisease traits in humans become known, this situationshould improve. It is clearly desirable to know whatenvironmental factors may serve a protective role, oras triggers, in individuals known to carry geneticvariants that function as risk factors in disease devel-opment. For example, certain gene variants involvedin ethanol metabolism protect against the develop-ment of alcoholism (Harada et al., 1983; Thomasson
et al., 1991; Borras et al., 2000) by making alcoholintake aversive (e.g., nausea), and environmental fac-tors such as peer pressure, divorce, or being raised inan environment with an alcoholic, may have littleimpact on this kind of genetic effect.
In humans and laboratory animals alike, the envi-ronmental factors that can most readily alter braindevelopment and behavior will depend on the specificgene. Deliberate manipulation of developmental out-comes will be feasible only when the genes involvedin multifactorial genotype by environment interac-tions are understood. Studies of inbred mouse strainscan provide strong evidence of the importance ofinteractions, but studies of single gene effects will beneeded to unpack the complex pathways involved instatistical interactions (see Johnston and Edwards,2002). In mice, further progress in this endeavor willrequire identification of the genes responsible for be-havioral differences between inbred strains (Phillipsand Belknap, 2002; Phillips et al., 2002).
We thank R. H. Kant of AccuScan for the generous loanof equipment.
REFERENCES
Anagnostopoulos AV, Mobraaten LE, Sharp JJ, Davisson,MT. 2001. Transgenic and knockout databases: Behav-ioral profiles of mouse mutants. Physiol Behav 73:675–689.
Bale TL, Contarino A, Smith GW, Chan R, Gold LH,Sawchenko PE, Koob GF, Vale WW, Lee KF. 2000.Mice deficient for corticotropin-releasing hormone recep-tor-2 display anxiety-like behaviour and are hypersensi-tive to stress. Nat Genet 24:410–414.
Benjamini Y, Drai D, Elmer G, Kafkafi N, Golani I. 2001.Controlling the false discovery rate in behavior geneticsresearch. Behav Brain Res 125:279–284.
Biddle FG, Eales BA. 1999. Mouse genetic model forleft-right hand usage: Context, direction, norms of reac-tion, and memory. Genome 42:1150–1166.
Boehm SL, Schafer GL, Phillips TJ, Browman KE, CrabbeJC. 2000. Sensitivity to ethanol-induced motor incoordi-nation in 5-HT(1B) receptor null mutant mice is task-dependent: implications for behavioral assessment of ge-netically altered mice. Behav Neurosci 114:401–409.
Bolivar V, Cook M, Flaherty L. 2000. List of transgenic andknockout mice: Behavioral profiles. Mamm Genome 11:260–274.
Borras E, Coutelle C, Rosell A, Fernandez-Muixi F, BrochM, Crosas B, Hjelmqvist L, Lorenzo A, Gutierrez C,Santos M, Szczepanek M, Heilig M, Quattrocchi P,Farres J, Vidal F, Richart C, Mach T, Bogdal J, JornvallH, Seitz HK, Couzigou P, Pares X. 2000. Genetic poly-morphism of alcohol dehydrogenase in europeans: the
Gene–Environment Interaction 309
ADH2*2 allele decreases the risk for alcoholism and isassociated with ADH3*1. Hepatology 31:984–989.
Bouwknecht JA, Hijzen TH, van der GJ, Maes RA, Hen R,Olivier B. 2000. Ethanol intake is not elevated in male5-HT(1B) receptor knockout mice. Eur J Pharmacol 403:95–98.
Bowers BJ, Collins AC, Wehner JM. 2000. Backgroundgenotype modulates the effects of g-PKC on the devel-opment of rapid tolerance to ethanol-induced hypother-mia. Addict Biol 5:47–58.
Brown RE, Stanford L, Schellinck HM. 2000. Developingstandardized behavioral tests for knockout and mutantmice. ILAR. J 41:163–174.
Castanon N, Scearce-Levie K, Lucas JJ, Rocha B, Hen R.2000. Modulation of the effects of cocaine by 5-HT1Breceptors: a comparison of knockouts and antagonists.Pharmacol Biochem Behav 67:559–566.
Chesler EJ, Wilson SG, Lariviere WR, Rodriguez-Zas SL,Mogil JS. 2002. The relative influence of organismic andlaboratory environmental factors influencing a behavioraltrait. Nat Neurosci (in press).
Clement Y, Calatayud F, Belzung C. 2002. Genetic basis ofanxiety-like behaviour: a critical review. Brain Res Bull57:57–71.
Cohen J. 1988. Statistical power analysis for the behavioralsciences. Hillsdale, NJ: Erlbaum.
Collins RL. 1975. When left-handed mice live in right-handed worlds. Science 187:181–184.
Coste SC, Kesterson RA, Heldwein KA, Stevens SL, HeardAD, Hollis JH, Murray SE, Hill JK, Pantely GA, Ho-himer AR, Hatton DC, Phillips TJ, Finn DA, Low MJ,Rittenberg MB, Stenzel P, Stenzel-Poore MP. 2000. Ab-normal adaptations to stress and impaired cardiovascularfunction in mice lacking corticotropin-releasing hormonereceptor-2. Nat Genet 24:403–409.
Crabbe JC. 2001. Use of genetic analyses to refine pheno-types related to alcohol tolerance and dependence. Alco-hol Clin Exp Res 25:288–292.
Crabbe JC. 2002. Genetic contributions to addiction. AnnuRev Psychol 53:435–462.
Crabbe JC, Phillips TJ, Feller DJ, Hen R, Wenger CD,Lessov CN, Schafer GL. 1996. Elevated alcohol con-sumption in null mutant mice lacking 5-HT1B serotoninreceptors. Nat Genet 14:98–101.
Crabbe JC, Wahlsten D, Dudek BC. 1999. Genetics ofmouse behavior: interactions with laboratory environ-ment. Science 284:1670–1672.
Crawley JN. 2000. What’s wrong with my mouse? Behav-ioral phenotyping of transgenic and knockout mice. NewYork: Wiley-Liss.
Crawley JN, Paylor R. 1997. A proposed test battery andconstellations of specific behavioral paradigms to inves-tigate the behavioral phenotypes of transgenic and knock-out mice. Horm Behav 31:197–211.
Crawley J N, Belknap JK, Collins A, Crabbe JC, Frankel W,Henderson N, Hitzemann RJ, Maxson SC, Miner LL,Silva AJ, Wehner JM, Wynshawboris A, Paylor R. 1997.Behavioral phenotypes of inbred mouse strains: implica-
tions and recommmendations for molecular studies. Psy-chopharmacology (Berlin) 132:107–124.
Dartmouth professor sees link between fluoride and behav-ior. 2002. Manchester Union Leader, July 2, p. 1.
Drai D, Golani I. 2001. SEE: a tool for the visualization andanalysis of rodent exploratory behavior. Neurosci Biobe-hav Rev 25:409–426.
Erlenmeyer-Kimling L. 1972. Genotype-environment inter-actions and the variabilty of behavior. In Ehrman L, GSOmenn GS, Caspari E, editors. Genetics, environmentand behavior. New York: Academic Press.
Enserink M. 1999. Fickle mice highlight test problems.Science 284:1599–1600.
Fox WM. 1965. Reflex-ontogeny and behavioural develop-ment of the mouse. Anim Behav XIII:234–241.
Frankel WN, Taylor L, Beyer B, Tempel BL, White HS.2001. Electroconvulsive thresholds of inbred mousestrains. Genomics 74:306–312.
Fuller JL. 1964. Measurement of alcohol preference ingenetic experiments. J Comp Physiol Psychol 57:85–88.
Gerlai R. 2001. Gene targeting: technical confounds andpotential solutions in behavioral brain research. BehavBrain Res 125:13–21.
Gold LH. 1999. Hierarchical strategy for phenotypic anal-ysis in mice. Psychopharmacology (Berlin) 147:2–4.
Gottlieb G. 1998. Normally occurring environmental andbehavioral influences on gene activity: from centraldogma to probabilistic epigenesis. Psychol Rev 105:792–892.
Harada S, Agarwal DP, Goedde HW, Ishikawa B. 1983.Aldehyde dehydrogenase isozyme variation and alcohol-ism in Japan. Pharmacol Biochem Behav 18(Suppl 1):151–153.
Hen R. 1999. Letter. Science 285:2068–2069.Henderson ND. 1970. Genetic influences on the behavior of
mice can be obscured by laboratory rearing. J CompPhysiol Psychol 72:505–511.
Henderson ND. 1976. Short exposures to enriched environ-ments can increase genetic variability of behavior inmice. Dev Psychobiol 9:549–553.
Hogg S. 1996. A review of the validity and variability of theelevated plus-maze as an animal model of anxiety. Phar-macol Biochem Behav 54:21–30.
Hyde LA, Crnic LS, Pollock A, Bickford PC. 2001. Motorlearning in Ts65Dn mice, a model for Down syndrome.Dev Psychobiol 38:33–45.
Immen W. 1999. Laid-back Edmonton mice have scientistspuzzled. Globe Mail June 4:A1–A6.
Irwin S. 1968. Comprehensive observational assessment: Ia.A systematic, quantitative procedure for assessing thebehavioral and physiological state of the mouse. Psycho-pharmacologia 13:222–257.
Johnston TD, Edwards L. 2002. Genes, interactions, and thedevelopment of behavior. Psychol Rev 109:26–34.
Kishimoto T, Radulovic J, Radulovic M, Lin CR, Schrick C,Hooshmand F, Hermanson O, Rosenfeld MG, Spiess J.2000. Deletion of crhr2 reveals an anxiolytic role for
310 Wahlsten et al.
corticotropin- releasing hormone receptor-2. Nat Genet24:415–419.
McClearn GE, Rodgers DA. 1959. Differences in alcoholpreference among inbred strains of mice. Q J Stud Alco-hol 20:691–695.
McIlwain KL, Merriweather MY, Yuva-Paylor LA, PaylorR. 2001. The use of behavioral test batteries: Effects oftraining history. Physiol Behav 73:705–717.
Moldin SO, Farmer ME, Chin HR, Battey JF Jr. 2001.Trans-NIH neuroscience initiatives on mouse phenotyp-ing and mutagenesis. Mamm Genome 12:575–581.
Moldin SO, Gottesman II. 1997. At issue: genes, experi-ence, and chance in schizophrenia—positioning for the21st century. Schiz Bull 23:547–561.
Paigen K, Eppig JT. 2000. A mouse phenome project.Mamm Genome 11:715–717.
Pennisi E. 2002. Good diet hides genetic mutations. Science296:1011.
Phillips TJ, Belknap JK. 2002. Complex-trait genetics:emergence of multivariate strategies. Nat Rev Neurosci3:478–485.
Phillips TJ, Belknap JK, Hitzemann R, Buck K, Cunning-ham CL, Crabbe JC. 2002. Harnessing the mouse tounravel the genetics of human disease. Genes Brain Be-hav 1:14–26.
Phillips TJ, Crabbe JC, Metten P, Belknap JK. 1994. Lo-calization of genes affecting alcohol drinking in mice.Alcohol Clin Exp Res 18:931–941.
Phillips TJ, Hen R, Crabbe JC. 1999. Complications asso-ciated with genetic background effects in research usingknockout mice. Psychopharmacology (Berlin) 147:5–7.
Plomin R, Crabbe J. 2000. DNA. Psychol Bull 126:806–828.
Rogers DC, Fisher EMC, Brown SDM, Peters J, Hunter AJ,Martin JE. 1997. Behavioral and functional analysis ofmouse phenotype: SHIRPA, a proposed protocol forcomprehensive phenotype assessment. Mamm Genome8:712–713.
Rogers DC, Jones DN, Nelson PR, Jones CM, Quilter CA,Robinson TL, Hagan JJ. 1999. Use of SHIRPA anddiscriminant analysis to characterise marked differencesin the behavioural phenotype of six inbred mouse strains.Behav Brain Res 105:207–217.
Rogers RJ, Dalvi A. 1997. Anxiety, defence and the ele-vated plus-maze. Neurosci Biobehav Rev 21:801–810.
Sapolsky RM. 2000. Genetic hyping. The Sciences 40:12–15.Simpson EM, Linder CC, Sargent EE, Davisson MT, Mo-
braaten LE, Sharp JJ. 1997. Genetic variation among 129substrains and its importance for targeted mutagenesis inmice. Nat Genet 16:19–27.
Sokolowski MB, Wahlsten D. 2001. Gene–environmentinteraction and complex behavior. In: Chin HR, MoldinSO, editors. Methods in genomic neuroscience. BocaRaton, FL: CRC Press, p 3–27.
Southwick CH, Clark LH. 1968. Interstrain differences inaggressive behavior and exploratory activity of inbredmice. Commun Behav Biol A 1:49–59.
Surjo D, Arndt SS. 2001. The Mutant Mouse Behaviour
network. A medium to present and discuss methods forthe behavioural phenotyping. Physiol Behav 73:691–694.
Takahashi JS. 1996. What’s wrong with my mouse? Newinterplays between mouse genetics and behavior. Wash-ington, DC: Society for Neuroscience.
Tarantino LM, Gould TJ, Druhan JP, Bucan M. 2000.Behavior and mutagenesis screens: the importance ofbaseline analysis of inbred strains. Mamm Genome 11:555–564.
Thomasson HR, Edenberg HJ, Crabb DW, Mai XL, JeromeRE, Li TK, Wang SP, Lin YT, LuRB, Yin SJ. 1991.Alcohol and aldehyde dehydrogenase genotypes and al-coholism in Chinese men. Am J Hum Genet 48:677–681.
Thompson WR. 1953. The inheritance of behavior: behav-ioral differences in fifteen mouse strains. Can J Psychol7:145–155.
Tordoff MG, Bachmanov AA, Friedman MI, BeauchampGK. 1999. Testing the genetics of behavior in mice.Science 285:2069.
Toye AA, Cox R. 2001. Behavioral genetics: anxiety underinterrogation. Curr Biol 11:R473–R476.
Turri MG, Datta SR, DeFries J, Henderson ND, Flint J.2001. QTL analysis identifies multiple behavioral dimen-sions in ethological tests of anxiety in laboratory mice.Curr Biol 11:725–734.
van der Staay FJ, Steckler T. 2002. The fallacy of behav-ioral phenotyping without standardisation. Genes BrainBehav 1:9–13.
Wahlsten D. 1990. Insensitivity of the analysis of varianceto heredity–environment interaction. Behav Brain Sci13:109–120.
Wahlsten D. 1999. Single-gene influences on brain andbehavior. Annu Rev Psychol 50:599–624.
Wahlsten D. 2001. Standardizing tests of mouse behavior:Reasons, recommendations, and reality. Physiol Behav73:695–704.
Wahlsten D, Gottlieb G. 1997. The invalid separation ofeffects of nature and nurture: lessons from animal exper-imentation. In: Sternberg RJ, Grigorenko EL, editors.Intelligence, heredity and environment. Cambridge:Cambridge University Press, p 163–192.
Wahlsten D, Crabbe JC, Dudek BC. 2001. Behavioral test-ing of standard inbred and 5HT1B knockout mice: im-plications of absent corpus callosum. Behav Brain Res125:23–32.
Wehner JM, Radcliffe RA, Bowers BJ. 2001. Quantitativegenetics and mouse behavior. Annu Rev Neurosci 24:845–867.
Wurbel H. 2000. Behaviour and the standardization fallacy.Nat Genet 26:263.
Wurbel H. 2002. Behavioral phenotyping enhanced—be-yond (environmental) standardization. Genes Brain Be-hav 1:3–8.
Xu X, Domino EF. 1994. Genetic differences in the loco-motor response to single and daily doses of phencyclidinein inbred mouse strains. Behav Pharmacol 5:623–629.
Yerkes RM. 1907. The dancing mouse. New York: Mac-millan.
Gene–Environment Interaction 311