Embed Size (px)
Citation preview

Received on: 24-02-2014 Accepted on: 20-03-2014 Published on: 15-04-2014
Ahmed M. Elgebaly*
Analytical Chemistry Department, Faculty of Pharmacy, Nahda University, Beni-Suef, Egypt. Email: [email protected]
QR Code for Mobile users
Different Spectrophotometric and TLC-Densitometric Methods for Determination of Two Analgesic Drugs
Nada S. Abdelwahaba, Nourddin W. Ali,a Mohammed M. Abdelkawyb and Ahmed M. Elgebalyc
aAnalytical Chemistry Department, Faculty of Pharmacy, Beni-Suef University,62111 Beni-Suef, Egypt. bAnalytical Chemistry Department, Faculty of Pharmacy, Cairo University , 11562 Cairo, Egypt. cAnalytical Chemistry Department, Faculty of Pharmacy, Nahda University, Beni-Suef, Egypt.
Abstract Diclofenac sodium (DIC) and Diflunisal (DIF) are two widely used analgesic drugs formulated in combined dosage form to treat inflammation and relive pain in many conditions. In this work, four accurate, precise and specific spectrophotometric and chromatographic methods have been developed and validated for determination of these drugs in their bulk powder and pharmaceutical dosage form. The developed methods are Q-analysis[ graphical absorbance ratio method] (Method I), dual wavelength (Method II), mean centering of ratio spectra MCR (Method III) and TLC-Denitometric (Method IV), In method (I) the absorbance values at 268nm (λ iso) and 226.6 nm (λ max of DIF) were used for computing the Q analysis equations from which concentrations of DIC and DIF have been obtained. In method (II) two wavelengths were selected for each drug in such a way that the difference in absorbance was zero for the second one. The wavelengths 253.6 and 308.6 nm were used for measuring DIC while 287 and 308.6 were used for DIF. In method (III) absorption spectra of each drug were recorded, divided by suitable divisor and the obtained ratio spectra were then mean centered. Method (IV) is TLC –Densitometric method that depends on quantitative separation of DIF and DIC on TLC plates using hexane: ethylacetate: acetic acid (5:4.8:0.2, by volume) as mobile phase and scanning at 280 nm The developed methods were validated according to ICH guidelines demonstrating good accuracy and precision. The results were statistically compared with those obtained by reported method and no significant difference were found between them. Keywords: Diclofenac sodium, Diflunisal, Q-analysis, Dual wavelength, Mean centering of ratio spectra spectrophotometry, TLC-densitometry
Cite this article as:
Nada S. Abdelwahaba, Nourddin W. Ali,a Mohammed M. Abdelkawyb and Ahmed M. Elgebalyc. Different Spectrophotometric and TLC-Densitometric Methods for Determination of Two Analgesic Drugs. Asian Journal of Biomedical and Pharmaceutical Sciences; 04 (30); 2014; 26-33. DOI: 10.15272/ajbps.v4i29.447

Ahmed M. Elgebaly et al.: Asian Journal of Biomedical and Pharmaceutical Sciences; 4(30) 2014, 26-33.
© Asian Journal of Biomedical and Pharmaceutical Sciences, all rights reserved. Volume 4, Issue 30, 2014. 27
INTRODUCTIONDiclofenac sodium (DIC) is a phenyl acetic acid derivative (1) (Figure 1a) and nonsteroidal anti-inflammatory agent (NSAID), it is administered in different conditions such musculoskeletal and joint disorders. Also its used in eye drops for prevention of intra- operative miosis during cataract extraction (2). Diflunisal (DIF) is a salicylic acid derivative (1) (Figure 1b) , its clinical effects resemble more closely those of propionic acid derivative NSAID such as ibuprofen. It’s used in acute or long term management of mild to moderate pain and inflammation associated with osteoarthritis and symptoms of dysmenorrheal (2).
Figure 1: Chemical structures of (a) Diflunisal, (b) Diclofenac sodium
The two studied drugs have been formulated in combined dosage form called Rhumafen forte®
suppositories. The combined formulation is recommended to be used in treating inflammation and pain in different conditions such as rheumatoid arthritis, renal and biliary conditions (3). On reviewing the literature in hand, it was found that both British (4) and United States (5) Pharmacopoeias analyzed DIC in its raw material by potentiometric non aqueous titration and determined it in its dosage forms by RP-HPLC method (4,5). DIC has been also analyzed along with other drugs by different methods such as Spectrophotometric (6-8), multivariate calibration (9),spectroflurimetric (10,11), TLC-Densitometric (12-14), HPLC (15-18), capillary electrophoretic (19,20) and electrochemical (21) methods. On the other hand, DIF has been determined in raw material by titremetric method while in pharmaceutical formulation by direct spectrophotometric method (4). Also DIF has been determined in different combinations by Spectrophotometric (22), multivariate calibration(23), spectroflurimetric (24,25), TLC-Densitometric (26), HPLC (27,28), capillary electrophoretic (29) and electrochemical (
30-32) methods. The binary mixture of DIC and DIF has been analyzed by two spectrophotometric methods , derivative and ratio derivative spectrophotometric methods (33). Also the mixture was determined by TLC-Densitometric
method (33) and by RP-HPLC methods (33). Moreover the studied drugs has been determined in presence of DIC and DIF related substances and forced degradation products by RP-HPLC DAD (3). This work concerns with development and validation of three spectrophotometric methods and TLC-Densitometric one for determination of the suggested drugs in their raw materials,synthetic mixtures and combined dosage form. The suggested methods have the advantages of saving time and cost when compared to the published HPLC methods (3, 33). They don’t need high cost instruments or chemicals. Also the proposed TLC-Densitometric method has the advantage of being more sensitive than other developed method and than the published RP-HPLC methods. Moreover, it differs from the reported TLC-Densitometric method (33) in being able to resolve the studied drugs using one scanning wavelength and developing system. MATERIALS AND METHODS Instruments A double beam UV-visible spectrophotometer (SHIMADZU, Japan) model UV-1601 PC with quartz cell of 1 cm and UV-PC personal software version 3.7 was used. The spectral band width is 2 nm and wavelength-scanning speed 2800 nm/min. All data analysis was performed using PLS-Toolbox 2.0 (34) running under MATLAB®, version 6.5 (35). A UV lamp with short wavelength 254nm UV Lamp(Viber Lourmat, Marine LA VALLEE Cedex 1, France). A TLC scanner 3 densitometer (camage,Muttenz, Switzerland),the following requirements are taken into consideration: Slit dimension: 5x0.2mm, scanning speed :20mm/s , spraying rate :10sµL-1, data resolution: 100 µm/step. TLC plates (20x20cm)coated with silica gel 60F254(Fluka,Sigma-Aldrich Chemie GmbH,Germany).A sample applicator for TLC Linomt IV with 100µL syring(Cama,Muttenz,Switzerland). Pure standards Standard DIF and DIC with claimed purity of 99.6 % and 99.7 % respectively according to manufacturer certificate were kindly supplied by Sigma Pharmaceuticals Industries (El Monofeya, Egypt). Pharmaceutical dosage forms Rhumafen forte®suppositories batch No. (103769) were manufactured by Gallaxo Smithkline (Cairo, Egypt). Each suppository is claimed to contain 200mg of DIF and 100 mg of DIC. Solvents Methanol HPLC grade (CHROMASOLVE®, Sigma -Aldrich Chemie GmbH, Germany). Standard solutions
a. Standard stock solution of DIF and DIC were prepared in methanol in the concentration of

Ahmed M. Elgebaly et al.: Asian Journal of Biomedical and Pharmaceutical Sciences; 4(30) 2014, 26-33.
© Asian Journal of Biomedical and Pharmaceutical Sciences, all rights reserved. Volume 4, Issue 30, 2014. 28
5 mg mL-1. b. Standard working solutions of DIF and DIC were prepared in methanol in the concentration of 0.1 mg mL-1. Procedures Spectral characteristics and wavelengths selection The absorption spectra of 8 µg mL-1 of each of DIC and DIF and their 1:1 mixture (containing 4 µg mL-1) were recorded over the range of 200-400 nm using methanol as a blank. The spectra were observed for selecting of the suitable wavelengths for dual wavelength and Q-analysis spectrophotometric methods. Construction of calibration curves Q-analysis method Different aliquots equivalent to 20-100µg of DIF and DIC were separately transferred from their respective working standard solutions (0.1 mg mL) into two separate series of 10-mL volumetric flasks and the volume was completed using methanol to obtain final concentrations of 2-10 µg mL-1for DIF and DIC respectively. The prepared solutions were scanned in the range of 200 – 400 nm. the absorbance values at 268nm (λ iso) and 226.6 nm (λ max of DIF) were measured from which the absorptivity values for both DIF and DIC at the selected wavelengths were calculated. The method employs Q values and the concentrations of the studied drugs in the prepared solutions were determined by using the following equations: Cx = [Qm - Qy / Qx - Qy] × (A / Ax) Cy = [Qm - Qx / Qy - Qx] × (A / Ay) where Cx and Cy are the concentrations of DIF and DIC in µg mL-1, respectively; Qm is the absorbance of sample at λ 226.6 / absorbance of sample at λ 268; Qx is the absorptivity of DIF at λ 226.6 / absorptivity of DIFat λ 268; Qy is the absorptivity of DIC at λ 226.6/ absorptivity of DIC at λ268; Ax is the absorptivity of DIF at λ 268; Ay is the absorptivity of DIC at λ 268; and A is the absorbance of the sample at λ 268. Dual wavelength method Different aliquots equivalent to 20-100µg of DIF and DIC were separately transferred from their respective standard working solutions (0.1 mg mL-1) into two separate series of 10- mL volumetric flasks and the volume was completed using methanol to obtain final concentrations of 2-10 µg mL-1for both DIF and DIC ,respectively. The prepared solutions were scanned in the range of 200 – 350 nm. Absorbance values at 253.6 and 308.6 nm (for DIF) and at 287 and 308.6 nm (for DIC) were measured. DIF was determined by plotting the difference in absorbance values at 253.6 and 308.6 nm (difference is zero for DIC) against its corresponding concentrations. Similarly for determination of DIC, the difference in absorbance values at 287 and 308.8 nm (difference is zero for DIF)
was plotted against the corresponding concentrations, then regression equations were computed. Mean centering of ratio spectra (MCR) method Different aliquots equivalent to 20-100µg of DIF and DIC were separately transferred from their respective standard working solutions (0.1 mg mL-1) into two separate series of 10-ml volumetric flasks and the volume was completed using methanol to obtain final concentrations of 2-10 µg mL-1 for both DIF and DIC. For measuring DIF, the scanned spectra were divided by the standard spectrum of 4 µg mL-1 DIC and then obtained spectra were mean centered. By the same way the spectra of different concentrations of DIC in the range of 2-10 µg mL-1were recorded in the range of 250-400 nm, divided by the standard spectrum of 3 µg mL-1of DIF and then the obtained ratio spectra were mean centered. Calibration curves for both DIF and DIC were constructed by plotting amplitude values of their respective mean centered ratio spectra at 309 nm for DIF and DIC against their corresponding concentrations. TLC-Densitometric method Accurate and separate aliqutes equivalent to 800-400 µg were separately transferred from their respective stock standard solutions [ 5mg mL-1] and then the volume was completed with methanol to obtain concentrations in the range of 80-400 µg mL-1 for both DIC and DIF. 10 µL of each prepared sample were applied in triplicates as bands of 6 mm width on TLC plates (20x10 cm with 250 µm thickness) using a Camag Linomat IV applicator. The bands were applied at 5 mm intervals and 10mm from the bottom edge of the plate. Linear ascending chromatogram development to a distance of 8 cm was performed in a chromatographic tank previously saturated for 30 minutes with a developing system consisted of hexane: ethylacetate: acetic acid (5:4.8:0.2,by volume ) at room temperature. The applied bands were scanned at 280nm and the calibration curves were constructed by plotting the integrated peak area versus the corresponding concentrations of each drug and the regression equations were computed. Analysis of laboratory prepared mixtures Different laboratory prepared mixtures containing different ratios of (DIF and DIC) were prepared and the procedures under construction of calibration curves for each method was followed. Concentrations of DIF and DIC in the prepared samples were calculated from the computed regression equations. Analysis of pharmaceutical dosage forms Rhumafen forte® suppositories labeled to contain 200 mg DIF and 100 mg DIC per suppository, The contents of 10 suppositories were melted and mixed well. Accurately weighed amount of the melted

Ahmed M. Elgebaly et al.: Asian Journal of Biomedical and Pharmaceutical Sciences; 4(30) 2014, 26-33.
© Asian Journal of Biomedical and Pharmaceutical Sciences, all rights reserved. Volume 4, Issue 30, 2014. 29
suppositories equivalent to 100 mg of DIF and 50 mg DIC were separately transferred into 100 mL volumetric flasks, 50 ml methanol was added and ultrasonicated for 30 min, cooled and then the volume was completed to obtain 1 mg mL-1 DIF and 0.5 mg mL-1 DIC stock solution and then the solution was filtered. Appropriate dilutions of the prepared solution were made to prepare its working solution (containing 1 mg mL-1 DIF and 0.5 mg mL-1 DIC) and the procedures under construction of calibration curves were followed. Recovery studies Recovery studies were carried were carried out by applying the standard addition technique. RESULTS AND DISCUSSION The combination under investigation is used in inflammatory and painful conditions such as rheumatoid arthritis, osteoarthritis, postoperative conditions, acute gouty attack, renal and biliary colic, and dysmenorrhoea. On the other hand, the literature showed only two spectrophotometric (derivative and ratio derivative) spectrophotometric methods, which mainly depended on derivative steps that needs complicated. Only one TLC-Densitometric method have been found in the literature which depended on TLC-Densitometric separation of DIC and DIF using hexane: ethylacetate: acetic acid (5:4.8:0.2,by volume )as a developing system and scanning at 280nm, on the other hand , the literature revealed two RP-HPLC methods (3,33) which needed sophisticated apparatus and high coast chemicals.. Due to the wide application of the studied combination and due to the draw backs of the previous published methods for resolving the studied mixture, we aimed in this work to develop and validate accurate, precise, sensitive and selective spectrophotometric and chromatographic methods for measuring the studied drugs in their combined formulation without preparing or treating the sample. Q-analysis spectrophotometric method This method depends on the property that for the substance that obeys Beer’s Lambert’s law at all wavelengths, the ratio of absorptivity (or absorbance) values at any two wavelengths are constant, independent of the concentration or path length. This ratio is referred as Q-ratio .One of the two selected wavelengths is an isoabsorptive point and the other is the wavelength of maximum absorption of one of the two components (36-38). From the overlain spectra of the two studied components and their mixture, Figure (2), it is evident that DIF and DIC show isoabsorptive points at 268 nm and 308.6nm; DIF has λ max at 207,226.6, 253.6 nm while DIC has λ max at 282nm. Due to the importance of carefull choosing of the two selected wavelengths(λ max and λ iso), all λ max of DIF or DIC have been tested. Upon
using the absorbance values at DIC λ max (=226.6nm), good results were obtained. Also the two observed λ iso were tested and λ iso (=268nm) was the wavelength of choice The absorbance values at 226.6 and 268 nm for DIF and DIC in the range of 2–10 µg mL-1 were obtained, absorptivity coefficients were determined for both drugs and the average values were taken. The values and the absorbance ratio were used to develop the following sets of equations from which the concentration of each component in the sample can be calculated: CDIF = [Qm – 1.645 / (3.452 – 1.645)] × (A / 0.031) CDIC = [Qm – 3.452 / (1.645– 3.452)] × (A / 0.031) Where CDIF and CDIC are the concentrations of DIF and DIC in µg mL-1, respectively; Qm is the absorbance of sample at λ 268 / absorbance of sample at λ 226.6; and A is the absorbance of the sample at λ268.
Figure (2). Zero order absorption spectra of 8 µg mL-1 each of Diclofenac Na (…),Diflunisal(__) and 1:1 mixture (---) containing 4 µg mL-1each using methanol as a blank
Figure 3: Mean centered ratio spectra of DIF (2-10 µg mL-1) using
4µg mL-1of DIC as a divisor and methanol as solvent.
Dual wavelength method The developed dual wavelength method provides a simple spectrophotometric method for selective determination of DIF and DIC in their binary mixtures using their zero order absorption spectra. The principle of dual wavelength the method depended on the absorbance difference at two wavelengths on the spectra is directly proportional to the concentration of component of interest, with no interference from other components (39). To apply this method, only two wavelengths should be carefully chosen on the basis

Ahmed M. Elgebaly et al.: Asian Journal of Biomedical and Pharmaceutical Sciences; 4(30) 2014, 26-33.
© Asian Journal of Biomedical and Pharmaceutical Sciences, all rights reserved. Volume 4, Issue 30, 2014. 30
that the interfering component shows the same absorbance value and the component of interest shows significant difference in absorbance with concentration. Several trials have been made to select the optimum wavelengths for each component. The best results regarding selectivity and sensitivity were obtained by using the absorbance difference at 253.6 and 308.6 nm for determination of DIF where DIC has zero absorbance difference and using absorbance difference values at 287 and 308.6 nm for determination of DIC where no interference from DIF has been founded. Linear correlations were obtained between absorbance difference at selected wavelengths for each drug and their corresponding concentrations in range of 2-10 µg mL-1 for DIF and DIC. The regression equations for the proposed method were computed and found to be: YDIF=0.044CDIF0.0013 r= 0.9998 for DIF
YDIC =0.029CDIC+0.0017 r= 0.9998 for DIC
Where Y is an absorbance difference value at selected wavelengths, C is a corresponding concentration and r is a correlation coefficient.
Figure 4: Mean centered ratio spectra of DIC (2-10 µg mL-1) using
3µg mL-1of DIF as a divisor and methanol as solvent.
Mean centering of ratio spectra (MCR) spectrophotometric method. The developed MCR method is based on the mean centering of ratio spectra. The method was developed and illustrated by Afkhami and Bahram (40), on applying this method, we do not need for spectral derivatization steps and hence method sensitivity is enhanced. In order to optimize the developed MCR method, different parameters were tested. The wavelength range taken was found to have agreat effect on the obtained mean centering ratio spectra, different wavelength ranges were tested. The best results were obtained when using the wavelength range from (250-350 nm) for both DIF and DIC. Also the effect of divisor concentration on the selectivity of the method was checked by testing several concentrations each of DIF and DIC. The best results regarding sensitivity and selectivity were obtained by using 3 and 4 µg mL-1 each of DIF and DIC respectively as divisors.
Beer's Lambert law was obeyed in the range of 2-10 µg mL-1 at 309 nm and for both DIF and DIC, Fig (3, 4). The regression equations for the proposed method were calculated and found to be: YDIF=1.070CDIF - 0.003 r=0.9999 for DIF
YDIC =0.952CDIC+0.028 r= 0.9998 for DIC
Where Y is the mean centered peak amplitudes value at selected wavelengths, C is a corresponding concentration and r is a correlation coefficient. TLC-densitometric method The TLC-Densitometric technique was successfully applied for the determination of DIC and DIF in pure form and in pharmaceutical formulations. This method offers a simple way to quantify directly on TLC plate by measuring the optical density of the separated bands.. In order to obtain optimum separation among the studied drugs, different trials have been carried out to reach the optimum developing system, scanning wavelength, band dimension and slit dimension. Firstly different developing systems with different ratios have been tested such as ethyl acetate – hexane (50: 50, v/v), hexane: ethyl acetate: (60: 40, by volume), hexane: ethyl acetate: acetic acid (50: 48: 2 by volume). On using the first developing system DIC and DIF had Rf values close to each other, while using the next system, DIC and DIF were well separated but with a tailed DIF peak. The best results concerning both chromatographic separation and peak symmetry were obtained upon using the last system, which gave good Rf values for both drugs where Rf values were 0.45 and 0.59 for DIF and DIC, respectively, Figure (5).
Figure 5: TLC Densitogram of mixture of ,(a) Diclofenac Na , (b) Diflunisal using developing system of hexane: ethylacetate: water: acetic acid(50:48: 2,by volume ) as a developing system Different scanning wavelengths were tried such as 215, 254, and 280 nm; the best scanning wavelength was 280 nm which showed good sensitivity with minimum noise for all the studied drugs. Different band dimensions were tested to obtain sharp and symmetrical peaks. The optimum band width was 6 mm with 8.9 mm inter-space between bands. The slit dimensions of scanning should ensure complete coverage of band on the scanned track without interference of adjacent bands. Different slit

Ahmed M. Elgebaly et al.: Asian Journal of Biomedical and Pharmaceutical Sciences; 4(30) 2014, 26-33.
© Asian Journal of Biomedical and Pharmaceutical Sciences, all rights reserved. Volume 4, Issue 30, 2014. 31
dimensions were tried, where 6 mm × 0.45 mm proved to be the slit dimensions of choice. The calibration curves were constructed by plotting the integrated peak area versus the corresponding concentrations in the concentration range of 2-10 µg band-1 of DIC and DIF. The regression equations were computed and found to be:
YDIC=2801CDIC+5986 r = 0.9995 YDIF = 2216 CDIF+7637 r = 0.9994
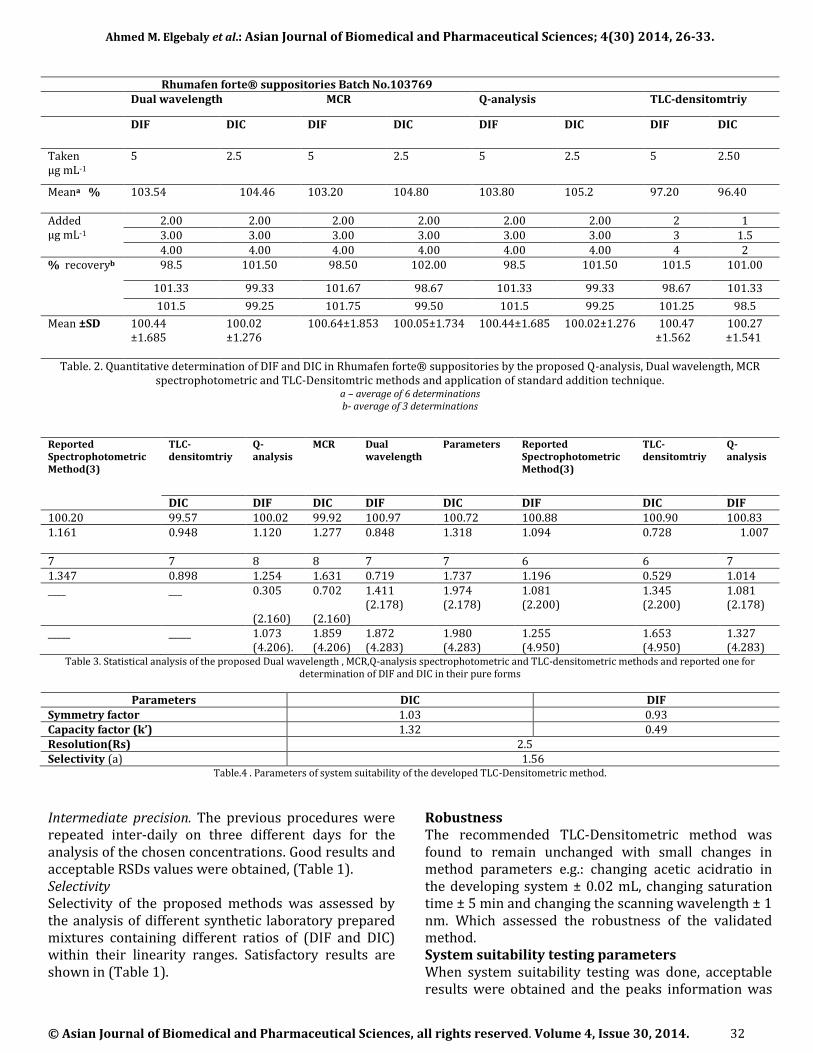
Where, Y is the integrated peak area, C is the concentrations in µg /band and r is the correlation coefficients The developed spectrophotometric and chromatographic methods were also applied for determination of DIF and DIC in Rhumafen forte® suppositories without interferences from suppositories excipients and satisfactory results were obtained. Standard addition technique was performed in order to asses the validity and accuracy of the methods where good percentage recoveries were obtained indicating
no interference from excepients Table (2). The results obtained by applying the proposed methods were statistically compared with those obtained by applying the reported spectrophotometric method (33) for determination of the proposed drugs in their pure forms and no significance differences were obtained between them (Table 3). The test ascertains that the proposed methods are as precise and accurate as the reported spectophotometric method (33) and are comparable to one another. Method validation Validation of the methods was carried out according to ICH recommendation (41). Linearity and range The calibration range for DIF and DIC was established through considerations of the practical range necessary according to adherence to Beer-lambert's law to give accurate, precise and linear results. Linearity ranges of DIF and DIC are shown in (Table 1).
Parameters Dual wavelength method Mean centering of ratio
spectra (MCR)
spectrophotometric
method
Q-analysis
spectrophotometric
method
TLC-Densitometric
Method
DIF DIC DIF DIC DIF DIC DIF DIC
Range 2-10 2-10 2-10 2-10 2-10 2-10 2-10 2-10
Slope 0.044 0.029 1.070 0,952 ____ ____ 2216 2801
Intercept -0.0013 0.0017 -0.003 0.028 ____ ____ 7637 5986
Correlation
coefficient
0.9998 0.9998 0.9999 0.9998 ____ ____ 0.9994 0.9995
Accuracy (%) 100.74 100.83 100.90 100.88 100.72 100.97 99.92 100.02
Specificity±
RSD
99.24
±0.857
100.21
±1.270
99.07
±0.864
99.96
±1.348
99.58
±0.445
100.36
±1.003
_____ _____
Precision
Repeatability
RSD
Intermediate
precision
RSD
0.563
0.641
0.731
0.874
0.557
0.632
0.724
0.865
0.559
0.638
0.729
0.871
0.855
0.913
0.634
0.776
Table.1a. Regression and analytical parameters of the proposed Q-analysis, Dual wavelength, MCR spectrophotometric and TLC-Densitomtric methods for determination of Diclofenac Na and Diflunisal.
Accuracy Accuracy of the proposed methods was calculated as the percentage recoveries of pure samples of the studied drugs. The concentrations were calculated from the corresponding regression equations and the results are shown in (Table1). Accuracy was further assessed by applying the standard addition technique to Rhumafen forte® suppositories, where good
recoveries were obtained revealing no interference from excipients (Table 2). Precision Repeatability. Three concentrations (2, 4, 6 µg mL-1 of DIF and DIC) were analyzed three times intra-daily using the proposed methods. Good results and acceptable relative standard deviations (RSDs) were obtained, (Table 1).
Ahmed M. Elgebaly et al.: Asian Journal of Biomedical and Pharmaceutical Sciences; 4(30) 2014, 26-33.
© Asian Journal of Biomedical and Pharmaceutical Sciences, all rights reserved. Volume 4, Issue 30, 2014. 32
Rhumafen forte® suppositories Batch No.103769
TLC-densitomtriy Q-analysis MCR Dual wavelength
DIC
DIF
DIC
DIF
DIC DIF DIC DIF
2.50 5 2.5
5
2.5 5 2.5 5 Taken µg mL-1
96.40
97.20
105.2
103.80
104.80 103.20 104.46 103.54 Meana %
1 2 2.00 2.00 2.00 2.00 2.00 2.00 Added µg mL-1 1.5 3 3.00 3.00 3.00 3.00 3.00 3.00
2 4 4.00 4.00 4.00 4.00 4.00 4.00 101.00 101.5 101.50 98.5 102.00 98.50 101.50 98.5 % recoveryb
101.33 98.67 99.33 101.33 98.67 101.67 99.33 101.33
98.5 101.25 99.25 101.5 99.50 101.75 99.25 101.5
100.27 ±1.541
100.47 ±1.562
100.02±1.276 100.44±1.685
100.05±1.734 100.64±1.853 100.02 ±1.276
100.44 ±1.685
Mean ±SD
Table. 2. Quantitative determination of DIF and DIC in Rhumafen forte® suppositories by the proposed Q-analysis, Dual wavelength, MCR spectrophotometric and TLC-Densitomtric methods and application of standard addition technique.
a – average of 6 determinations b- average of 3 determinations
Reported Spectrophotometric Method(3)
TLC-densitomtriy
Q-analysis
MCR Dual wavelength
Parameters Reported Spectrophotometric Method(3)
TLC-densitomtriy
Q-analysis
DIC DIF DIC DIF DIC DIF DIC DIF 100.20 99.57 100.02 99.92 100.97 100.72 100.88 100.90 100.83
1.161 0.948 1.120
1.277
0.848 1.318 1.094 0.728 1.007
7 7 8 8 7 7 6 6 7 1.347 0.898 1.254 1.631 0.719 1.737 1.196 0.529 1.014 ____ ___ 0.305
(2.160)
0.702 (2.160)
1.411 (2.178)
1.974 (2.178)
1.081 (2.200)
1.345 (2.200)
1.081 (2.178)
_____ _____ 1.073 (4.206).
1.859 (4.206)
1.872 (4.283)
1.980 (4.283)
1.255 (4.950)
1.653 (4.950)
1.327 (4.283)
Table 3. Statistical analysis of the proposed Dual wavelength , MCR,Q-analysis spectrophotometric and TLC-densitometric methods and reported one for determination of DIF and DIC in their pure forms
Parameters DIC DIF Symmetry factor 1.03 0.93 Capacity factor (k’) 1.32 0.49 Resolution(Rs) 2.5 Selectivity (a) 1.56
Table.4 . Parameters of system suitability of the developed TLC-Densitometric method.
Intermediate precision. The previous procedures were repeated inter-daily on three different days for the analysis of the chosen concentrations. Good results and acceptable RSDs values were obtained, (Table 1). Selectivity Selectivity of the proposed methods was assessed by the analysis of different synthetic laboratory prepared mixtures containing different ratios of (DIF and DIC) within their linearity ranges. Satisfactory results are shown in (Table 1).
Robustness The recommended TLC-Densitometric method was found to remain unchanged with small changes in method parameters e.g.: changing acetic acidratio in the developing system ± 0.02 mL, changing saturation time ± 5 min and changing the scanning wavelength ± 1 nm. Which assessed the robustness of the validated method. System suitability testing parameters When system suitability testing was done, acceptable results were obtained and the peaks information was

Ahmed M. Elgebaly et al.: Asian Journal of Biomedical and Pharmaceutical Sciences; 4(30) 2014, 26-33.
© Asian Journal of Biomedical and Pharmaceutical Sciences, all rights reserved. Volume 4, Issue 30, 2014. 33
given in The resolution (Rs) and selectivity factors (α) values were above 1 and 1.5, respectively, which ensured good separation of each component from the other (Table4). CONCLUSION The developed methods have advantages over the published methods in being more simple, rapid, cost effective and data processing steps are not time consuming. Spectrophotometric methods can be regarded as a useful alternative to chromatographic techniques in the routine quality control analysis of pharmaceutical formulations allowing rapid determination at relatively low cost. The advantages of TLC-densitometric method is its ability to determine the studied drugs using one and the same developing system and scanning wavelength, several samples can be run simultaneously using a small quantity of mobile phase unlike HPLC, thus lowering analysis time and cost . The developed methods can be easily adopted for routine quality control analysis of DIF and DIC. REFERENCES 1. The merk index,An Encyclopedia of Chemicals, drugs and biologicals, 13th Ed.,Merck Research laboratories Division of Merck and Coir.pany., INC. White house station,NJ, (2001). 2. Martindale, the complete drug reference “The Extra Pharmacopoeia”, 31st Ed., Pharmaceutical press Londn,(2007). 3.Shaalan A. R., Tarek S. B., Sci Pharm. In pressdoi:10.3797/scipharm.1301-24. http://dx.doi.org/10.3797/scipharm.xxx 4. The British Pharmacopoeia.Her Majesty’s Stationery Office, London, 2010. 5. The United States Pharmacopeia, 34th edition, The National Formulary, 29th edition, The OfficialCompendia of Standards.The United States Pharmacopeial Convention, Rockville, MD, 2011, pp. 780–781, 2544–2549, 2564–2565 6. Matthieu,T., Rafael,L.DS., Talanta,Volume 68(3), 2006, 776–780. 7. Tomás,P.R. , Carmen,M.L., Antonio,S., Teresa,S.M., J Pharm Biomed Anal ,16(2), 1997, 249–254. 8. Agrawal, Y.K. , Shivramchandra ,K., J Pharm Biomed Anal, 9(2), 1991, 97–100 9. Sylwester,M., Roman ,S., J Pharm Biomed Anal, 40(5), 2006, 1235–1242 . 10. Carreira,L.A, J Pharm Biomed Anal , 13(11), 1995, 1331–1337 . 11. Marcela ,A.C., Liliana ,B., Analytical Sciences, 22(3), 2006, 431-433 . 12. Krzek,J.,Starek,M., J Pharm Biomed Anal, 28(2), 2002, 227–243. 13. Lala, L.G. , D'Mello, P.M., Naik S.R., J Pharm Biomed Anal,29(3), 2002, 539–544. 14. Thongchai, W., Liawruangrath,B., Thongpoon,C., Machan,T., Chiang Mai J. Sci. 33(1) 2006, 123-128. 15. Godbillon,J., Gauron,S., Metayer,J.P., J Chromatogr B Biomed Sci Appl, 338, 1985, 151–159 . 16. Yilmaz,B., Asci,A., and Palabiyik,S.S.,Journal of Chromatographic Science, 49, 2011,422-427. 17. Ahmed ,N.R., Iraqi National Journal of Chemistry,44,2011, 467-473. 18. El-Sayed, Y.M., Abdel-Hameed, M.E., Suleiman ,M.S,, Najib, N.M., J Pharm Pharmacol. 40(10), 1988 ,727-9. 19. Jin, W., Zhang,J., J Chromatogr A , 868(1), 2000, 101–107. 20. Abdel-Hamid, ,M.E., Ladislav Novotny,L., Hamza ,H., J Pharm Biomed Anal 24(4), 2001, 587–594.
21. Kormosh,Zh.A.,Hunka,I.,P.,and Bazel,Ya.,R., int J Anal Chem, 64(8), 2009, 853-858. 22. Abdel-Hay MH, Galal, S.M, Ragab, M.A.A., Taiwan Pharm J. 59(4), 2007,157–170. 23. Wahbi, A.A.M., Mabrouk, M.M., Moneeb, M.S., Kamal, A.H., Pak J Pharm Sci, 22(1) 2009,8–17. 24. Murillo, P.J.A., Alanon, M.A, Fernandez, L.P., Sanchez-F., Robles.,I., Anal Chim Acta 583(1),2007,55–62.http://dx.doi.org/10.1016/j.aca.2006.10.009 25. Pulgarin, J.A.M., Molina, A.A., Robles, I.S.F., J Appl Spectrosc. 64(8), 2010, 949–955. http://dx.doi.org/10.1366/000370210792081055. 26. Bebawy, L.I., El-Kousy, N.M., J Pharm Biomed Anal. 20(4), 1999, 663–670 http://dx.doi.org/10.1016/S0731-7085(99)00039-4. 27. Wahbi, A.A.M., Mabrouk, M.M., Moneeb, MS., Kamal, A.H., Pak J Pharm Sci. 22(1), 2009,8–17. 28. Loewen, G.R., MacDonald, J.I., Verbeeck, R.K., J Pharm Sci. 78(3), 1989,250–255. 29. Milofsky, R., Bauer, E., J High Resolut Chromatogr.20 (12), 1997, 638–642. 30. Solich, P., Macheras, P. E., Koupparis, M.A., J Pharm Sci. 84(7), 1995; 889–894. http://dx.doi.org/10.1002/jps.2600840720. 31. Sayin, F., Kir, S., J Pharm Biomed Anal. 25(1), 2001, 153–163. http://dx.doi.org/10.1016/S0731-7085(00)00481-7 32. Beltagi, A.M., J Appl Electrochem. 39(12), 2009, 2375–2384. http://dx.doi.org/10.1007/s10800-009-9924-0 . 33. El-Saharty, Y.S., Refaat, M., El-Khateeb ,S. Z., Bull Fac Pharm Cairo Univ. 40(3), 2002,47–64. 34. B.M.Wise, N.B. Gallagher(2001)version 2.1.1.ed., Eigenvector Resarch,Inc. N.B., PLS-Toolbox2.0 for use with Matlab® 6.5, Corporation : Manson, WA, 1998. 35. Matlab Ver. 6.5;1999, Mathworks Ink. 36. Nada S. Abdelwahab, Arabian J.Chem., 2011,doi:10.1016/ J.arabic. 2011. 05. 002. 37. Nada S. Abdelwahab, Badr A El- zeiny, Salwa I. Tohamy.,J. Pharm. Anal., 2, 2012, 279-284. 38. Nourddin W. Ali, Nada S. Abdelwahab ,Hamid M. El- fatatry, Weam M Osman, Pharmaceutica. Anal .Acta, 4, 2013, 6. 39. Maha M Abd El-rahman,Spectrochim. Acta, 113, 2013, 291-296. 40. Devi, R., Ramakrishna S., ; (2010) Int. J. Pharm. and Pharm. Sci., 2, 215. 41. Afkhami, A., Bahram, M. Talanta, 2005; 66, 712:720. 42. The European Agency for The evaluation of Medical Products. (1996) ICH Topic Q2B Note for Guidance on validation of Analytical Procedures. Methodology GPMP/ ICH/ 281/ 95.