Embed Size (px)
Citation preview

molecules
Article
Different Ultrasound Exposure Times Influence thePhysicochemical and Microbial Quality Properties inProbiotic Goat Milk Yogurt
Karina Delgado 1,2, Carla Vieira 1,2, Ilyes Dammak 2, Beatriz Frasão 1, Ana Brígida 3,4,Marion Costa 1,5 and Carlos Conte-Junior 1,2,6,*
1 Department of Food Technology, Faculdade de Veterinária, Universidade Federal Fluminense,Niterói 24230-340, Brazil; [email protected] (K.D.); [email protected] (C.V.);[email protected] (B.F.); [email protected] (M.C.)
2 Food Science Program, Instituto de Química, Universidade Federal do Rio de Janeiro,Rio de Janeiro 21941-909, Brazil; [email protected]
3 Embrapa Agroindústria de Alimentos, Empresa Brasileira de Pesquisa Agropecuária,Rio de Janeiro 23020-470, Brazil; [email protected]
4 Embrapa Agroindústria Tropical, Empresa Brasileira de Pesquisa Agropecuária, Fortaleza 60511-110, Brazil5 Laboratory of Inspection and Technology of Milk and Derivatives, Escola de Medicina Veterinária e
Zootecnia, Universidade Federal da Bahia, Salvador 40170-110, Brazil6 National Institute of Health Quality Control, Fundação Oswaldo Cruz, Rio de Janeiro 21040-900, Brazil* Correspondence: [email protected]; Tel.: +55-21-3938-7825
Academic Editors: Alessia Fazio and Pierluigi PlastinaReceived: 1 July 2020; Accepted: 5 October 2020; Published: 12 October 2020
�����������������
Abstract: Despite goat milk having health benefits over cow milk, goat milk yogurt (GY) presentslow consistency and viscosity, which reduces its overall acceptability by the consumer. Thus,new innovative methods can be an alternative to improve the quality of GY. Hence, this study aimedto investigate the effect of ultrasound (US) treatment with different sonication times on qualityparameters of probiotic GY during refrigerated storage. US treatment was conducted at 20 KHz for3, 6, and 9 min in yogurt. Lactobacillus bulgaricus and Lactobacillus acidophilus LA-5 were sensitiveto US treatment, presenting a decrease in the yogurts stocked. This loss of viability led to reducedpost-acidification due to smaller lactose metabolization in yogurt samples submitted to the US.Among tested treatments, the application of 6 min enhanced the apparent viscosity and consistencyindex of GY yogurts. In addition, this time also reduced tyramine and total biogenic amine (BAs)content. These findings suggest that 6 min of sonication is a promising way to improve the rheologicalproperties and reduce the acidity and BAs content in GY. Further studies should be performed tooptimize the US setting conditions to preserve the probiotic culture viability in yogurts.
Keywords: food processing; non-thermal technologies; sonication; caprine milk; physicochemicalstability; microbial viability
1. Introduction
Goat milk has several advantages over cow milk, such as its higher digestibility of fat and proteins,higher vitamin A, vitamin B, and calcium contents [1,2]. In addition, goat milk has a hypoallergenicactivity due to a lower level of αs1-casein than that of cow milk [3]. However, these characteristicsfrom goat milk (fine fat globules, small casein micelles, and a low αs1-casein content) result in a lowconsistency and apparent viscosity in goat milk yogurt (GY) [4]. These factors also influence therheological properties of the yogurt coagulum, which is semi-liquid. The weak gel structure, typical of
Molecules 2020, 25, 4638; doi:10.3390/molecules25204638 www.mdpi.com/journal/molecules

Molecules 2020, 25, 4638 2 of 22
GY, is detrimental to the product quality. Since this sensory attribute is the most relevant to the overallacceptability of yogurts, this contributes to GY rejection by consumers [5,6].
Many conventional methods have been used to improve the textural quality of GY, such asincreasing solids in milk (adding fat, proteins, or sugars) as well as the addition of the stabilizer (pectin,starch, alginate, and gelatin). However, the suitable ratio between additives and goat milk for yogurtmanufacture has not yet been achieved. This limitation can be attributed to this relation being veryvariable, depending on the type of additive and the technological process used [7]. These alternativesto improve GY texture may change nutritional food values [7] and bring unwanted flavors and texturalattributes to the product. Fortification with these expensive dairy commodities also affects productioncosts [8]. In this context, reports in the literature have endeavored the development of innovativemethods to improve the textural and rheological properties of GY [9,10].
Ultrasound (US) is defined as sound waves whose frequency exceeds the human ear (≈20 kHz).US technology has been an alternative to conventional food processing because it is safe and cheap [11].Milk gels and yogurt produced from milk treated by the high-intensity US have shown enhancedfirmness and viscosity and reduced syneresis in fermented cow milk, improving the physical propertiesof the product [12–17]. The changes in fermented cow milk by US are associated with whey proteindenaturation. Once denatured, the whey proteins are more susceptible to association with casein andcasein micelles, resulting in a stronger yogurt coagulum [17]. However, a negative consequence can bethe biogenic amines (BAs) production, which has been neglected [18].
BAs are low-molecular-mass organic bases with an aliphatic, aromatic, or heterocyclic structure.They are produced from free amino acids decarboxylation. BAs represent a considerable toxicologicalrisk in fermented dairy products [19] because free amino acids are naturally present in milk or arereleased from milk proteins by inherent proteolytic activities, as well as those from the starter andprobiotic cultures or contaminating microorganisms. Tyramine is a vasoconstrictive amine that ispredominant in fermented dairy products [20], including goat’s milk yogurts [21,22], due to thehigh tyrosine content in goat’s milk [23]. However, only aged cheeses, or those elaborated fromraw milk, [24] such as “Jben” fresh cheese from raw goat’s milk [25], are typically described ascontaining clinically significant levels of tyramine per serving of food. In contrast, yogurts madefrom pasteurized milk and stocked in a suitable refrigeration temperature range (4 to 10 ◦C) arereported without a clinically significant content of tyramine per serving of food. A definition of aclinically significant level was related to the severity of elevation of the blood pressure raised from theconsumption of tyramine naturally contained in food [24]. Regarding polyamines, their concentration(putrescine, cadaverine, spermidine, and spermine) in organs and tissues depends on their endogenousproduction and oxidation rates and their intake from foods [26]. Dietary polyamines may be harmful,neutral, or beneficial, depending on the specific polyamine involved and disease [27]. In this context,a positive or detrimental effect has been reported for yogurt consumption depending on the cancertype and bacterial strains used in the manufacture of yogurt; evidence supports the potential role ofconsumption of probiotic yogurt in the reduction of colorectal cancer risk in healthy adults [28,29].In line, the consumption (100 g/day for 2 weeks) of Bifidobacterium lactis LKM512-containing probioticyogurt reduced by 79.2%, while conventional yogurt decreased by 47.9% the gut mutagenicity levelin healthy adults [30]. The consumption of yogurt with probiotic LKM512 (100 g/day for 2 weeks)also presented a protective effect in healthy elderly, significantly reducing the haptoglobin content infeces and gut mutagenicity level [31]. The antimutagenic effect on intestinal cells was attributed to theincreased gut polyamines level, specially spermidine, by the consumption of probiotic yogurt, which ledto the inhibition of inflammation [30,31]. On the other hand, limited suggestive evidence has shownthat yogurt consumption increases the risk of prostate and kidney cancers in a dose-dependent mannerin healthy adults, although this effect is not associated with the calcium content in yogurt [32–34].Increased risk to develop these cancers types has been attributed to the polyamines content in dairyproducts [27], since they (putrescine and spermidine) are the other principal biogenic amines inyogurts [20,35], including goat’s milk yogurts [21,22]. Indeed, cadaverine, spermidine, and spermine

Molecules 2020, 25, 4638 3 of 22
present in conventional yogurts (1.9 to 2.8 µmol) were entirely absorbed by the human intestine,being yogurt suggested as a relevant source of polyamines for the organism [36]. Consistent withcontroversial findings on yogurt consumption and cancer risk, dietary spermidine is reported to havedual effects on cancers by targeting oncogenes, immunity, autophagy, or apoptosis [37]. In addition,although the intake of polyamines seems to decrease the risk of development of some cancer types andsuppress tumorigenesis in cancer patients at the early stage, increased dietary spermidine appearsto accelerate the growth of established tumors [37]. Thus, recent epidemiological studies have beenshown that a polyamine-reduced diet can be beneficial to the quality of life of cancer patients [27].In this context, evidence shows that increasing the sonication time leads to protein denaturation, whichfavors the proteolytic enzyme action in dairy products [38]; enhanced proteolytic activity is correlatedto BAs accumulation in fermented dairy products [39], including goat’s milk yogurt [22].
Finally, the effects of the US on the viability and activity of starter and probiotic cultures havebeen controversial. The US conditions, bacterial species, and the matrix are parameters that influencean increase or decrease of bacterial viability and activity [3]. Nevertheless, the effects of the US on themain quality parameters of goat dairy products are still unknown and have been scarcely investigatedin milk only [40,41]. This context requires an investigation into the effect of sonication conditions onGY quality. Thus, the major original hypothesis was that the optimized sonication time promotesdesirable physical properties in GY. The additional hypothesis was that this time of sonication does notnegatively affect the microbial quality and food safety of GY. Therefore, this study aimed to determinethe sonication time effect (3, 6, and 9 min) on GY parameters (physicochemical and microbial) duringrefrigerated storage.
2. Results
2.1. Microbial Growth Evaluation of Freshly Prepared Goat Milk Yogurts
Table 1 shows the microbial count (log CFU g−1) on the first day of refrigerated storage (24 h afterthe yogurt manufacture). The values found here for the control (non-sonicated yogurt) were ≥7.44log CFU g−1 both for the starter and the probiotic culture. However, the US treatments significantlyreduced the viability when compared to the control: up to 22.53%, 41.4%, and 50.81% for S. thermophilus,L. bulgaricus, and L. acidophilus LA-5, respectively.
Table 1. Microbial counts and chemical composition in goat milk yogurts were measured on the firstday of storage at 4 ◦C.
Parameter 1Treatment 2
NSU US3 US6 US9
Lactobacillus bulgaricus 7.44 ± 0.15 c 5.01 ± 0.24 b 4.56 ± 0.32 a 4.36 ± 0.19 a
Streptococcus thermophilus 10.30 ± 0.34 c 8.72 ± 0.15 b 8.36 ± 0.34 ab 7.98 ± 0.38 a
Lactobacillus acidophilus LA-5 8.05 ± 0.03 c 4.94 ± 0.33 b 4.13 ± 0.56 a 3.96 ± 0.17 a
Ash 0.70 ± 0.14 a 0.80 ± 0.08 a 0.77 ± 0.10 a 0.72 ± 0.10 a
Fat 3.33 ± 0.15 a 3.30 ± 0.26 a 3.47 ± 0.15 a 3.30 ± 0.17 a
Moisture 87.33 ± 0.74 a 87.61 ± 3.23 a 87.80 ± 0.44 a 87.80 ± 0.01 a
Protein 0.70 ± 0.11 a 0.61 ± 0.08 a 0.61 ± 0.16 a 0.64 ± 0.1 2a
a–c Different lowercase letters indicate statistical differences between ultrasound treatments of goat’s milk yogurtson the first day of storage (p < 0.05). 1 Bacterial counts were expressed as log CFU g−1; Chemical composition wasexpressed as g/Kg. 2 NSU, non-sonicated goat’s milk yogurt; US3, goat’s milk yogurt sonicated for 3 min; US6,goat’s milk yogurt sonicated for 6 min; US9, goat’s milk yogurt sonicated for 9 min. Mean ± standard deviationfrom triplicate determinations.
S. thermophilus was the most resistant species to sonication. It maintained scores ≥7.98 log CFUg−1 in all sonication times tested. On the other hand, L. bulgaricus and L. acidophilus LA-5 had theircounts decreased to ≤5.01 log CFU g−1, even for the shortest sonication time (3 min). All bacterialspecies presented a decrease in cell viability when the US exposure time increased (Table 1). However,

Molecules 2020, 25, 4638 4 of 22
there was no significant difference (p > 0.05) between average and maximum sonication times (6 and9 min).
2.2. Chemical Composition of Freshly Prepared Goat Milk Yogurt
Table 1 shows the results of the chemical composition of GY samples on the first day of storage.In general, moisture, minerals, fat, and protein content found here were similar between the controland the US treatments. Thus, the US had no influence (p > 0.05) on the chemical composition ofyogurt samples.
2.3. Monosaccharides, Disaccharides, and Organic Acids Content in Goat Milk Yogurt during Storage
As shown in Table 2, lactose and lactic acid were the major disaccharide and organic acid,respectively, found in yogurt samples (both control and US treatments). The lactose content increasedsignificantly with the sonication time, although in 28 days of storage, this tendency was not significant(Table 2). The sonication of 9 min (US9) resulted in the highest lactose accumulation compared to thecontrol (non-sonicated yogurt). Therefore, US treatments reduced the lactose hydrolysis to glucose andgalactose. Consistently, the galactose content decreased with US treatments (Figure 1B,F,J; Tables S1and S2), although this trend was not significant on the first storage day (Table 2).
Table 2. Values of monosaccharides, disaccharides, and organic acids in goat milk yogurt samplesmeasured during 28 days of storage at 4 ◦C.
Parameter 1 Treatment 2Storage Time (Day)
1 14 28
Lactose
NSU 50.40 ± 1.59 ab,B 48.05 ± 2.10 a,A 48.60 ± 2.06 AB
US3 49.92 ± 2.54 a 49.44 ± 2.71 ab 49.47 ± 2.19US6 51.84 ± 1.02 ab,B 49.60 ± 2.50 ab,A 51.01 ± 0.74 AB
US9 52.62 ± 1.67 b 51.91 ± 2.49 b 51.25 ± 3.72
Glucose
NSU 0.10 ± 0.02 ab 0.10 ± 0.01 a 0.09 ± 0.01 a
US3 0.12 ± 0.03 bc,A 0.15 ± 0.02 b,AB 0.16 ± 0.02 c,B
US6 0.14 ± 0.03 c 0.16 ± 0.04 b 0.14 ± 0.01 b
US9 0.08 ± 0.01 a 0.08 ± 0.00 a 0.08 ± 0.00 a
Galactose
NSU 1.11 ± 0.08 1.12 ± 0.06 b 1.11 ± 0.09 b
US3 1.05 ± 0.06 1.10 ± 0.06 ab 1.08 ± 0.05 b
US6 1.08 ± 0.03 1.07 ± 0.05 ab 1.11 ± 0.01 b
US9 1.02 ± 0.12 1.01 ± 0.10 a 0.99 ± 0.07 a
Citric acid
NSU 0.13 ± 0.01 b,B 0.11 ± 0.01 ab,A 0.12 ± 0.01 b,B
US3 0.11 ± 0.01 a 0.10 ± 0.01 a 0.11 ± 0.01 a
US6 0.13 ± 0.01 b 0.11 ± 0.03 ab 0.13 ± 0.00 b
US9 0.13 ± 0.01 b 0.13 ± 0.00 b 0.13 ± 0.01 b
Lactic acid
NSU 1.37 ± 0.08 ab 1.37 ± 0.07 1.33 ± 0.14US3 1.26 ± 0.04 a 1.30 ± 0.04 1.26 ± 0.04US6 1.39 ± 0.15 ab 1.28 ± 0.12 1.32 ± 0.02US9 1.46 ± 0.19 b 1.37 ± 0.14 1.32 ± 0.11
Formic acid
NSU 0.43 ± 0.01 b 0.42 ± 0.01 c 0.43 ± 0.01 b
US3 0.42 ± 0.00 ab,AB 0.41 ± 0.01 bc,A 0.42 ± 0.01 ab,B
US6 0.42 ± 0.00 ab 0.41 ± 0.01 ab 0.39 ± 0.05 a
US9 0.41 ± 0.01 a,B 0.40 ± 0.01 a,A 0.42 ± 0.00 ab,B
a–c Different lowercase letters indicate statistical differences between ultrasound treatments in goat’s milk yogurtsamples during 28 days of storage (p < 0.05). A–B Different uppercase letters indicate statistical differences betweendays of storage in goat’s milk yogurt samples (p < 0.05). 1 Monosaccharides, disaccharides, and organic acids wereexpressed as mg g−1. 2 NSU, non-sonicated goat’s milk yogurt; US3, goat’s milk yogurt sonicated for 3 min; US6,goat’s milk yogurt sonicated for 6 min; US9, goat’s milk yogurt sonicated for 9 min.

Molecules 2020, 25, 4638 5 of 22Molecules 2020, 25, x FOR PEER REVIEW 5 of 22
Figure 1. Significant correlations (p ˂ 0.05) were internally validated by the bootstrap method between physicochemical and microbial parameters for goat milk yogurt stored at 4 °C. (A–D) Streptococcus thermophilus; (E–H) Lactobacillus delbrueckii ssp. bulgaricus; (I–L) Lactobacillus acidophilus LA-5. NSU, non-sonicated goat milk yogurt; US3, goat milk yogurt sonicated for 3 min; US6, goat milk yogurt sonicated for 6 min; US9, goat milk yogurt sonicated for 9 min; total BA, total biogenic amines.
Glucose accumulated in the US3 and US6 treatments compared to the control (Table 2), indicating that exposure times of 3 and 6 min reduced the activity of glucose converting enzymes to organic acids. Consistently, 3 min of sonication significantly reduced the citric acid content. In contrast, the formic acid content decreased in all the samples exposed to the US than the control (Figure 1C,G,K). In addition, a significant and positive correlation was observed between the viability of dairy cultures exposed to treatments and the formic acid content (Figure 1C,G,K; Tables S1 and S2). Among the samples treated with ultrasound, US3 and US6 presented the highest galactose and
Figure 1. Significant correlations (p < 0.05) were internally validated by the bootstrap method betweenphysicochemical and microbial parameters for goat milk yogurt stored at 4 ◦C. (A–D) Streptococcusthermophilus; (E–H) Lactobacillus delbrueckii ssp. bulgaricus; (I–L) Lactobacillus acidophilus LA-5. NSU,non-sonicated goat milk yogurt; US3, goat milk yogurt sonicated for 3 min; US6, goat milk yogurtsonicated for 6 min; US9, goat milk yogurt sonicated for 9 min; total BA, total biogenic amines.
Glucose accumulated in the US3 and US6 treatments compared to the control (Table 2), indicatingthat exposure times of 3 and 6 min reduced the activity of glucose converting enzymes to organic acids.Consistently, 3 min of sonication significantly reduced the citric acid content. In contrast, the formic acidcontent decreased in all the samples exposed to the US than the control (Figure 1C,G,K). In addition,a significant and positive correlation was observed between the viability of dairy cultures exposed totreatments and the formic acid content (Figure 1C,G,K; Tables S1 and S2). Among the samples treated
Molecules 2020, 25, 4638 6 of 22
with ultrasound, US3 and US6 presented the highest galactose and formic acid content, exhibitingbehavior more similar to the control (Table 2). Therefore, US3 and US6 showed a more active processof lactose hydrolysis than US9 treatment during storage.
Regarding storage time, lactose levels reduced only in the control and US6 in the two first weeksof storage when compared to fresh yogurt (1 day of storage) (Table 2), which indicates that significanthydrolysis of lactose occurred only in these samples. Glucose accumulated only in US3, which suggestsa decrease in the activity of glucose-converting enzymes to organic acids for this sonication time.The citric acid significantly fluctuated during storage only in control (Table 2); thus, the productionfollowed by consumption of the citric acid by LAB (lactic acid bacteria) metabolism just occurredin non-sonicated yogurt. The formic acid significantly fluctuated only in US3 and US9 treatments.The maintenance of the formic acid level in US6 and control indicates that the glucose conversion toformic acid remained constant in these samples. Consistently, there was an interaction between thestorage period and sonication treatment for formic acid and glucose values (p < 0.05).
2.4. Evaluation of pH Values of Goat Milk Yogurt Samples during Storage
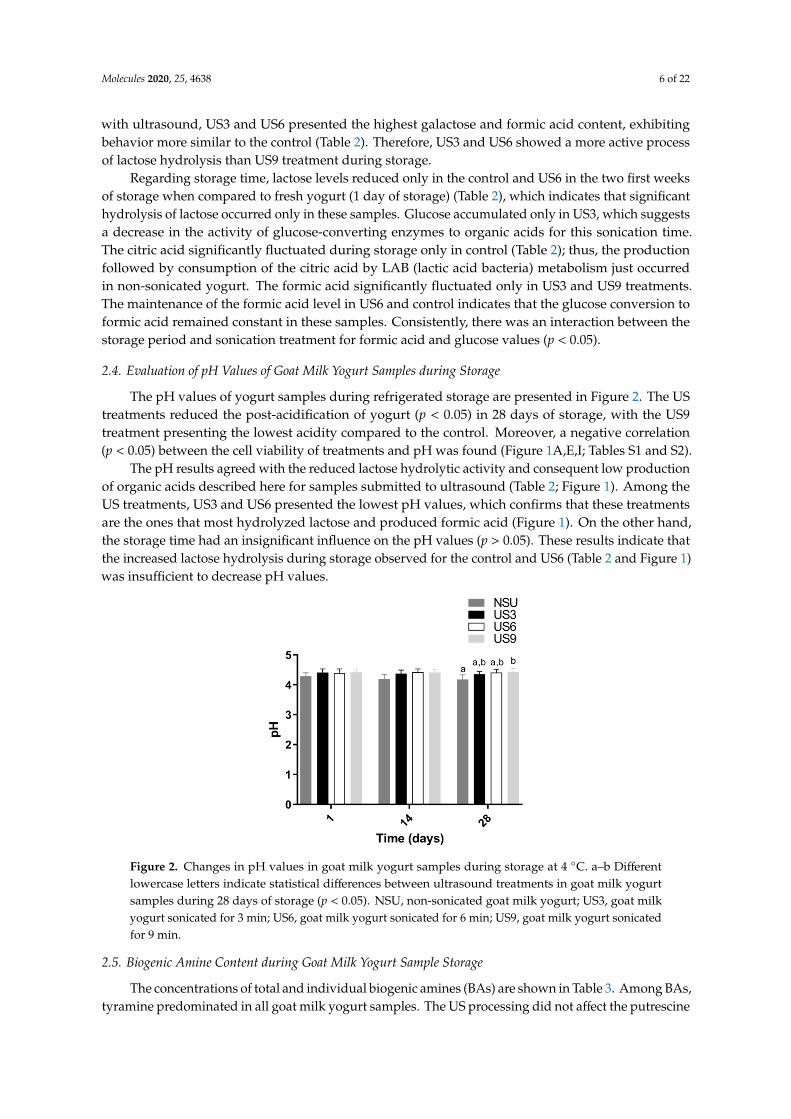
The pH values of yogurt samples during refrigerated storage are presented in Figure 2. The UStreatments reduced the post-acidification of yogurt (p < 0.05) in 28 days of storage, with the US9treatment presenting the lowest acidity compared to the control. Moreover, a negative correlation(p < 0.05) between the cell viability of treatments and pH was found (Figure 1A,E,I; Tables S1 and S2).
The pH results agreed with the reduced lactose hydrolytic activity and consequent low productionof organic acids described here for samples submitted to ultrasound (Table 2; Figure 1). Among theUS treatments, US3 and US6 presented the lowest pH values, which confirms that these treatmentsare the ones that most hydrolyzed lactose and produced formic acid (Figure 1). On the other hand,the storage time had an insignificant influence on the pH values (p > 0.05). These results indicate thatthe increased lactose hydrolysis during storage observed for the control and US6 (Table 2 and Figure 1)was insufficient to decrease pH values.
Molecules 2020, 25, x FOR PEER REVIEW 6 of 22
formic acid content, exhibiting behavior more similar to the control (Table 2). Therefore, US3 and US6 showed a more active process of lactose hydrolysis than US9 treatment during storage.
Regarding storage time, lactose levels reduced only in the control and US6 in the two first weeks of storage when compared to fresh yogurt (1 day of storage) (Table 2), which indicates that significant hydrolysis of lactose occurred only in these samples. Glucose accumulated only in US3, which suggests a decrease in the activity of glucose-converting enzymes to organic acids for this sonication time. The citric acid significantly fluctuated during storage only in control (Table 2); thus, the production followed by consumption of the citric acid by LAB (lactic acid bacteria) metabolism just occurred in non-sonicated yogurt. The formic acid significantly fluctuated only in US3 and US9 treatments. The maintenance of the formic acid level in US6 and control indicates that the glucose conversion to formic acid remained constant in these samples. Consistently, there was an interaction between the storage period and sonication treatment for formic acid and glucose values (p < 0.05).
2.4. Evaluation of pH Values of Goat Milk Yogurt Samples during Storage
The pH values of yogurt samples during refrigerated storage are presented in Figure 2. The US treatments reduced the post-acidification of yogurt (p ˂ 0.05) in 28 days of storage, with the US9 treatment presenting the lowest acidity compared to the control. Moreover, a negative correlation (p ˂ 0.05) between the cell viability of treatments and pH was found (Figure 1A,E,I; Tables S1 and S2).
The pH results agreed with the reduced lactose hydrolytic activity and consequent low production of organic acids described here for samples submitted to ultrasound (Table 2; Figure 1). Among the US treatments, US3 and US6 presented the lowest pH values, which confirms that these treatments are the ones that most hydrolyzed lactose and produced formic acid (Figure 1). On the other hand, the storage time had an insignificant influence on the pH values (p > 0.05). These results indicate that the increased lactose hydrolysis during storage observed for the control and US6 (Table 2 and Figure 1) was insufficient to decrease pH values.
Figure 2. Changes in pH values in goat milk yogurt samples during storage at 4 °C. a–b Different lowercase letters indicate statistical differences between ultrasound treatments in goat milk yogurt samples during 28 days of storage (p < 0.05). NSU, non-sonicated goat milk yogurt; US3, goat milk yogurt sonicated for 3 min; US6, goat milk yogurt sonicated for 6 min; US9, goat milk yogurt sonicated for 9 min.
2.5. Biogenic Amine Content during Goat Milk Yogurt Sample Storage
The concentrations of total and individual biogenic amines (BAs) are shown in Table 3. Among BAs, tyramine predominated in all goat milk yogurt samples. The US processing did not affect the putrescine values (p > 0.05), except on the 14th day of storage, where the ultrasound slightly reduced its contents in all the treatments compared to the control. Additionally, the different sonication times
Figure 2. Changes in pH values in goat milk yogurt samples during storage at 4 ◦C. a–b Differentlowercase letters indicate statistical differences between ultrasound treatments in goat milk yogurtsamples during 28 days of storage (p < 0.05). NSU, non-sonicated goat milk yogurt; US3, goat milkyogurt sonicated for 3 min; US6, goat milk yogurt sonicated for 6 min; US9, goat milk yogurt sonicatedfor 9 min.
2.5. Biogenic Amine Content during Goat Milk Yogurt Sample Storage
The concentrations of total and individual biogenic amines (BAs) are shown in Table 3. Among BAs,tyramine predominated in all goat milk yogurt samples. The US processing did not affect the putrescine

Molecules 2020, 25, 4638 7 of 22
values (p > 0.05), except on the 14th day of storage, where the ultrasound slightly reduced its contents inall the treatments compared to the control. Additionally, the different sonication times did not presenta significant influence on the putrescine content in the samples. Polyamines significantly reduced inUS6 and US9 compared to the control. However, this reduction occurred over the whole storage periodfor spermidine, while the spermine content reduced only half of the storage time. Moreover, US6 andUS9 did not differ from each other as to the spermidine content. The tyramine content decreased in allultrasound treatments compared to the control (p < 0.05) in 14 and 28 days. Only on the first day ofstorage did the treatments not present any effect (p > 0.05). In addition, the tyramine reductions in 6and 9 min of sonication were more dramatic than those in 3 min. The total BA content significantlyreduced in all ultrasound treatments compared to the control until 14 days of storage. However, at theend of storage, the ultrasound did not influence the total BA content. In general, different sonicationtimes did not affect the total BA content. In contrast, cadaverine increased in 6 and 9 min of sonicationwhen compared to the control (p < 0.05) for the whole storage period (Table 3). Its content was higherin 6 min than in 9 min. Additionally, the BA concentration had a direct correlation with the viability ofS. thermophilus, L. bulgaricus, and L. acidophilus by US treatments (p < 0.05) in yogurt samples (Figure 1;Tables S1 and S2).
Table 3. Biogenic amine concentration in goat milk yogurt samples was measured during 28 days ofstorage at 4 ◦C.
Biogenic Amines(mg L−1) Treatment
Storage Time (day)
1 14 28
Cadaverine
NSU 2.80 ± 0.44 a,A 2.80 ± 0.44 a,A 3.90 ± 0.72 ab,B
US3 2.61 ± 0.53 a,A 2.69 ± 0.57 a,A 2.93 ± 0.72 a,A
US6 3.80 ± 0.92 b,A 4.54 ± 0.90 b,AB 5.47 ± 1.42 c,B
US9 3.01 ± 0.85 ab,A 5.49 ± 1.27 b,B 5.21 ± 1.22 bc,B
Putrescine
NSU 2.56 ± 0.76 a,A 3.83 ± 0.67 b,B 4.12 ± 0.96 a,B
US3 2.80 ± 0.47 a,A 2.91 ± 0.68 a,A 3.16 ± 0.87 a,A
US6 2.79 ± 0.51 a,A 2.88 ± 0.54 a,A 3.34 ± 0.93 a,A
US9 2.61 ± 0.71 a,A 2.77 ± 0.59 a,A 3.16 ± 0.54 a,A
Spermidine
NSU 2.34 ± 0.64 b,A 4.53 ± 1.12 b,B 5.87 ± 1.19 c,C
US3 2.32 ± 0.66 b,A 2.24 ± 0.55 a,A 5.04 ± 0.84 bc,B
US6 1.54 ± 0.36 a,A 1.88 ± 0.47 a,A 4.21 ± 0.90 ab,B
US9 1.29 ± 0.36 a,A 1.55 ± 0.42 a,A 3.39 ± 0.91 a,B
Spermine
NSU 1.95 ± 0.33 a,A 3.00 ± 0.75 c,B 3.23 ± 0.97 b,B
US3 1.69 ± 0.20 a,A 2.48 ± 0.65 bc,B 2.95 ± 0.52 b,B
US6 1.78 ± 0.21 a,A 1.52 ± 0.09 a,A 2.49 ± 0.70 ab,B
US9 1.85 ± 0.29 a,A 1.82 ± 0.40 ab,A 1.93 ± 0.30 a,A
Tyramine
NSU 16.50 ± 4.76 a,A 18.35 ± 1.12 b,A 19.34 ± 1.12 b,A
US3 14.33 ± 2.24 a,A 17.30 ± 0.93 ab,B 18.20 ± 1.67 ab,B
US6 16.00 ± 1.13 a,A 16.24 ± 1.16 a,AB 17.76 ± 1.65 ab,B
US9 14.93 ± 1.36 a,A 15.96 ± 2.74 a,A 16.58 ± 0.99 a,A
Total concentration
NSU 30.26 ± 1.64 a,A 32.79 ± 2.80 a,A 32.06 ± 6.10 a,A
US3 27.73 ± 1.51 b,A 27.87 ± 2.03 b,A 28.05 ± 1.89 a,A
US6 27.67 ± 1.74 b,A 27.05 ± 2.26 b,A 31.51 ± 3.93 a,B
US9 25.34 ± 1.27 c,A 27.58 ± 1.85 b,B 28.61 ± 1.70 a,B
a–c Different lowercase letters indicate statistical differences between ultrasound treatments in goat milk yogurtsamples during 28 days of storage (p < 0.05). A–B Different uppercase letters indicate statistical differences betweendays of storage of goat milk yogurt samples (p < 0.05). NSU, non-sonicated goat milk yogurt; US3, goat milkyogurt sonicated for 3 min; US6, goat milk yogurt sonicated for 6 min; US9, goat milk yogurt sonicated for 9 min.Mean ± standard deviation from triplicate determinations.
The BA concentration presented a general increasing trend during storage compared to freshyogurt (1 day of storage) in both the control and US treatments (Table 3). This increase was significant(p < 0.05) for cadaverine in NSU, US3, and US6 treatments. For putrescine, an increase was observed

Molecules 2020, 25, 4638 8 of 22
only in NSU from the 14th day of storage. Spermidine increased in all treatments. Furthermore,spermine increased in NSU, US3, and US6. Tyramine and the total BA content did not change in theNSU during the storage time, and they presented significance only in two treatments: US3 and US6 fortyramine, and US6 and US9 for total BAs. Consistently, there was no interaction (p > 0.05) betweenstorage time and US treatments only for tyramine and total BAs.
2.6. Textural Properties during Goat Milk Yogurt Storage
The texture results are presented in Table 4. Firmness in US6 and US9 was slightly greater (36.59and 34.70 g, respectively) than in NSU (34.16 g) in fresh yogurt. On the other hand, all US treatmentsresulted in slightly less firm samples (25.79 to 30.45 g) than the control (33.55 g) on the 14th day ofstorage, while they did not significantly differ at the end of storage. For consistency, US6 (384.48 g·s)presented a slightly higher value, while US3 and US9 (347.71 and 356.80 g·s, respectively) had slightlylower values when compared to the control (360.25 g·s) in fresh yogurt. However, all US treatments(254.59 to 309.66 g·s) presented lower consistency than the control (365.24 g·s) on the 14th day of storage,while they did not significantly differ at the end of storage. Thus, US treatments poorly contributed tothe firmness and consistency of yogurt. Cohesiveness generally increased with firmness reduction forUS treatments and control (Table 4).
The storage time reduced (p < 0.05) the firmness of all samples compared to fresh yogurt (1 dayof storage). The same occurred for consistency, although this tendency had not been significant forUS9 and the control. Coherently, the interaction between storage time and sonication treatments wassignificant (p < 0.05).
Table 4. Texture profile analysis and rheological characteristics of goat milk yogurt samples measuredduring 28 days of storage at 4 ◦C.
Parameter 1 Treatment 2Storage Time (Day)
1 14 28
F (g)
NSU 34.16 ± 0.41 a,B 33.55 ± 0.26 c,A 33.89 ± 0.27 a,AB
US3 33.56 ± 2.07 a,B 27.26 ± 1.76 a,A 32.22 ± 3.10 a,B
US6 36.59 ± 0.78 b,C 25.79 ± 1.61 a,A 31.45 ± 2.94 a,B
US9 34.70 ± 2.17 ab,B 30.45 ± 4.20 b,A 31.86 ± 2.27 a,AB
Cn (g s)
NSU 360.25 ± 6.64 ab,A 365.24 ± 4.46 c,A 365.81 ± 3.49 a,A
US3 347.71 ± 16.48 a,B 272.51 ± 23.98 ab,A 339.85 ± 44.41 a,B
US6 384.48 ± 8.92 b,C 254.59 ± 22.79 a,A 321.80 ± 46.89 a,B
US9 356.80 ± 37.02 a,A 309.66 ± 47.94 b,A 322.20 ± 33.28 a,A
Ch (g)
NSU −5.07 ± 0.43 b,A−3.21 ± 0.30 d,B
−5.03 ± 0.21 b,A
US3 −4.90 ± 0.39 b,B−7.27 ± 0.65 b,A
−4.99 ± 0.66 b,B
US6 −6.29 ± 0.78 a,B−8.45 ± 0.75 a,A
−6.10 ± 0.66 a,B
US9 −5.89 ± 0.72 a,A−5.04 ± 119 c,A
−5.43 ± 0.76 ab,A
K (Pa sn)
NSU 1.81 ± 0.56 a,B 0.04 ± 0.03 a,A 0.08 ± 0.01 a,A
US3 3.73 ± 1.11 a,B 0.84 ± 0.46 b,A 0.44 ± 0.04 a,A
US6 13.90 ± 3.51 b,B 2.26 ± 0.52 b,A 1.13 ± 0.16 b,A
US9 5.54 ± 0.80 a,B 0.65 ± 0.18 ab,A 0.48 ± 0.02 a,A
n
NSU 0.48 ± 0.01 b,A 0.44 ± 0.06 a,A 0.75 ± 0.17 a,B
US3 0.43 ± 0.07 b,A 0.67 ± 0.05 b,B 0.62 ± 0.14 a,AB
US6 0.17 ± 0.03 a,A 0.40 ± 0.08 a,B 0.61 ± 0.03 a,C
US9 0.40 ± 0.03 b,A 0.70 ± 0.01 b,B 0.67 ± 0.09 a,B
a–d Different lowercase letters indicate statistical differences between ultrasound treatments in goat milk yogurtsamples during 28 days of storage (p < 0.05). A–C Different uppercase letters indicate statistical differences betweendays of storage in goat milk yogurt samples (p < 0.05). 1 F, firmness; Cn, consistency; Ch, cohesiveness; K, consistencyindex; n, flow behavior index. 2 NSU, non-sonicated goat milk yogurt; US3, goat milk yogurt sonicated for 3 min;US6, goat milk yogurt sonicated for 6 min; US9, goat milk yogurt sonicated for 9 min. Mean ± standard deviationfrom triplicate determinations.

Molecules 2020, 25, 4638 9 of 22
2.7. Rheological Behavior and Apparent Viscosity during Goat Milk Yogurt Samples Storage
Figure 3A1–A3 exhibits apparent viscosity as a function of shear rate over 28 days of storage inGY at 4 ◦C. Viscosity decreased with the increase in the shear rate during shearing, while shear stressincreased as a function of shear rate for all samples (Figure 3B1–B3). All US treatments had a higherviscosity rate than the control (Figure 3A1–A3). US6 presented the highest viscosity value in freshyogurt and at the end of storage. US3 showed the highest value on the 14th day, followed by US6and US9. This indicates that overall, the middle time of sonication (6 min) was the most effective inimproving product viscosity.
Molecules 2020, 25, x FOR PEER REVIEW 9 of 22
2.7. Rheological Behavior and Apparent Viscosity during Goat Milk Yogurt Samples Storage
Figure 3A1–A3 exhibits apparent viscosity as a function of shear rate over 28 days of storage in GY at 4 °C. Viscosity decreased with the increase in the shear rate during shearing, while shear stress increased as a function of shear rate for all samples (Figure 3B1–B3). All US treatments had a higher viscosity rate than the control (Figure 3A1–A3). US6 presented the highest viscosity value in fresh yogurt and at the end of storage. US3 showed the highest value on the 14th day, followed by US6 and US9. This indicates that overall, the middle time of sonication (6 min) was the most effective in improving product viscosity.
Figure 3. Flow behavior of goat milk yogurt samples during storage time at 4 °C. (A1–A3) apparent viscosity vs. shear rate; (B1–B3) Flow curves; (A1,B1) day 1 of storage; (A2,B2) day 14 of storage; (A3,B3) day 28 of storage. NSU, non-ultrasonicated goat milk yogurt; US3, goat milk yogurt sonicated for 3 min; US6, goat milk yogurt sonicated for 6 min; US9, goat milk yogurt sonicated for 9 min.
Figure 3. Flow behavior of goat milk yogurt samples during storage time at 4 ◦C. (A1–A3) apparentviscosity vs. shear rate; (B1–B3) Flow curves; (A1,B1) day 1 of storage; (A2,B2) day 14 of storage;(A3,B3) day 28 of storage. NSU, non-ultrasonicated goat milk yogurt; US3, goat milk yogurt sonicatedfor 3 min; US6, goat milk yogurt sonicated for 6 min; US9, goat milk yogurt sonicated for 9 min.

Molecules 2020, 25, 4638 10 of 22
The rheological properties of yogurt samples—expressed as the consistency index (K) and flowbehavior index (n)—are represented in Table 4. K values give an idea of the fluid viscosity; therefore,they were consistent with our finding for viscosity: K was only significantly higher than in the controlfor US6 in fresh yogurt (1.81 and 13.90 Pa sn, respectively) and at the end of storage (0.08 and 1.13 Pa sn,respectively). On the 14th day, all US treatments had a greater K than the control (0.04 Pa sn), but US3and US6 (0.84 and 2.26 Pa sn, respectively) presented the highest values among US treatments. Thus,the middle time of sonication (6 min) was the most effective to improve the viscosity and consistencyindex of yogurt. The index n indicates the degree of deviation from the Newtonian flow (n = 1). All GYsamples presented n < 1.0. The US6 treatment reduced the flow behavior index compared to the controlin fresh yogurt, while it did not differ from the control on the 14th day of storage. However, on thisday, the flow behavior index was higher in US3 and US9 than in NSU. Treatments did not differ at theend of storage (p > 0.05).
The storage time generally reduced the viscosity values for all samples compared to fresh yogurt(Figure 3A1–A3). These results are consistent with the reduction in the consistency index (K) observedin all samples compared to fresh yogurt during storage (Table 4). In contrast, the flow behavior indexincreased during storage in all samples compared to fresh yogurt (Table 4).
3. Discussion
In the current study, the count values for the starter and the probiotic cultures in the control sample(non-sonicated yogurt) were ≥7.44 log CFU g−1 (Table 1), which agree with those reported for viabilityin commercial dairy products (≥6 log CFU g−1) during cold storage [42]. However, the US treatmentsamples in the present work, unlike the control sample, cannot be characterized as probiotics becausecounts of probiotic L. acidophilus LA-5 were below the recommended minimum dose (6 log CFU g−1)to present the health benefits of this organism [43]. The susceptibility to the US varied accordingto the bacterial species studied (Table 1). Consistently, the sonication effect has been reported as aculture-specific treatment due to variations in cell wall thickness, composition, and cell size [13].
US effects on the viability and activity of the starter and probiotic cultures have been controversialbecause of the US setting conditions and particularities of the bacterial species and the matrix used infermentation [3]. It may be explained by sonoporation, which increases the cell membrane permeabilitydue to the US application [44]. Sonoporation can improve microbial growth since it facilitates the masstransfer of substrates or reagents across the cell membrane and the remotion of by-products of cellularmetabolism. However, higher degrees of the US promote irreversible sonoporation, leading to theleakage of cellular content. Thus, the physical disruption and/or alteration of the cell membrane lipidbilayer cause lipid peroxidation and, eventually, cell death [45].
The lack of standardization in US operating conditions hinders comparisons between studies [45].Nevertheless, for wave frequencies similar to those adopted herein (20 kHz), positive reports for thegrowth of starter and probiotic cultures were obtained for prolonged exposure time (up to 15 min),but with a power level (up to 150 W) and US wave amplitude (up to 25%) [46,47] lower than thoseemployed herein (300 W and 67% of amplitude). Similarly, when the US treatment was performedbefore milk inoculation, even using a high-power level (up to 600 W) and time (up to 10 min), the starterand probiotic cultures presented a positive growth [48]. Activating inoculum in a yogurt starter cultureusing the US with a low power level (84 W) and short exposure time (150 s) before its introduction inmilk improves cell viability [45]. A high power and wave amplitude (750 W and 100%, respectively)by prolonged time (10 min) reduces L. acidophilus count by 84% [49]. Thus, as investigated in this study,shorter exposure times with lower wave amplitude and power levels should be employed to preventexcessive sonoporation. Thus, the microbial quality can be maintained and accelerate fermentationduring product elaboration. Consistently, lower exposure times to the US were reported to increase thesurvival percentage of LAB in milk and accelerate the fermentation process [50].
In general, the moisture, mineral, fat, and protein content found here (Table 1) was similar tothat reported in the literature for goat milk yogurt [51]. US treatments do not influence the chemical

Molecules 2020, 25, 4638 11 of 22
composition of yogurt [47], which agrees with our findings. The literature has well established that thecavitation effect of the US only affects the particle size and distribution of yogurt compounds, not theirconcentration [40]. This fact justifies why the chemical composition of yogurt samples does not changeafter US treatments (Table 1).
Lactose and lactic acid are the major disaccharide and organic acid, respectively, in fermenteddairy products [52,53], as observed herein (Table 2). However, the lactose values (40.16 to 44.99 mg g−1)reported for goat’s fermented milk [53] were slightly lower than those found by us (48 to 50 mg g1) ingoat’s milk yogurts (Table 2). It can be justified by possible differences between both studies regardingthe lactose content in the unfermented milk used to elaborate fermented dairy products. Coherently,the average content of lactose in goat’s milk has been reported to vary (44.3 to 59.7 mg/g) accordingto the breed and stages of lactation of the dairy goat [54]. In line, Bagnicka et al. [55] demonstratedthat breed, parity, and litter size affect the content of lactose in the goat’s milk. LAB acidifies milk bylactose fermentation with organic acids production. Initially, the β-galactosidase hydrolyzes lactoseto galactose and glucose [56]. Therefore, lactose accumulation (Table 2) accompanied by galactosereduction (Figure 1B,F,J; Tables S1 and S2) in our US-treated yogurt samples indicates a reductionin the activity of β-galactosidase released by LAB when the US was applied. Then, the glucosereleased from lactose is converted to pyruvate, which is metabolized by lactic dehydrogenase [17] orpyruvate-formate-lyase [57] to lactic acid or formic acid, respectively. Therefore, the highest glucose(Table 2) indicates that exposure times to the US of 3 and 6 min reduced the activity of enzymesconverting glucose to organic acids. In contrast, there are reports that the US may improve the processof lactose hydrolysis by enhancing the membrane permeability of dairy cultures, allowing the release ofintracellular β-galactosidase out from the cell. This release improves the hydrolyzing effect comparedto the condition where β-galactosidase remains in the cells of dairy cultures [46].
Better lactose hydrolysis leads to the secretion of glucose and galactose and enhanced organic acidproduction [46]. However, when the US treatment reduces the viability of dairy cultures, as observedin this study (Table 2; Figure 1), it also reduces the production of organic acids in the cells by LAB.Organic acids are the main end products of lactic fermentation; therefore, the number of viable cellsdetermines the amount of organic acid in the medium [58]. Lactose hydrolysis in our samples duringstorage compared to fresh yogurt may be explained by β-galactosidase released by LAB, which canremain active even at refrigerated storage temperature (0–5 ◦C) [59], as we observed in US6 andNSU (Table 2). Regarding organic acids, citric acid is the primary substrate for acetoin and diacetylformation [52], which justifies its fluctuations observed in non-sonicated yogurt over storage in thepresent work (Table 2).
The pH values of yogurt samples during storage (Figure 2) coincided with those reported in theliterature (4.1–4.6) for goat’s yogurt samples during cold storage [4,53]. During yogurt processing,the fermentation of lactose into organic acids by LAB lowers the pH value [49]; therefore, the mostcritical factor related to pH change during the dairy fermentation process is the LAB activity [38].It explains the reduced post-acidification after US treatments (Figure 2) since they significantlyreduced the dairy culture viability in the present work (Table 1). On the other hand, as reported byJalilzadeh et al. [38], when the US stimulates the starter culture growth, it increases and acceleratesacidity during fermentation due to the increased release of intracellular β-galactosidase from LABcells [46]. The reduced post-acidification after US treatments (Figure 2) is technologically positive,because although sourness is an expected characteristic of yogurt, excessive post-acidification duringstorage may lower acceptance. In addition, post-acidification may affect textural quality and decreasethe organoleptic quality of yogurt [56].
Consistently with our results (Table 3), tyramine has been reported as the BAs predominant infermented dairy products [20]. The values found here for total and individual BA concentrations agreewith those previously described for yogurt in cold storage [35]. The reduction in the total and individualBA content obtained for US-treated GY (Table 3) may be attributed to a reduction in the viability ofthe starter and probiotic cultures when the US was applied (Table 1). Coherently, in goat milk yogurt,

Molecules 2020, 25, 4638 12 of 22
the yogurt culture viability was previously considered as a significant variable in BA content [22].Pintado et al. [60] reported strong and significant correlations between the concentration of BAs andviable microbial numbers in cheese. The lower the number of positive amino acid decarboxylase cells,the lower the number of amino acids converted to BAs [22], which justifies a lower BA production inthe samples when the viability of dairy cultures is reduced. US6 and US9 had similar effects on the BAcontent (Table 3), which may be explained by the similar viability of L. bulgaricus and L. acidophilus LA-5for these times in the present work (Table 1). On the other hand, the accentuated decrease in BAs withthe sonication may be justified by the lower viability of S. thermophilus, L. bulgaricus, and L. acidophilusLA-5 (Table 1). In contrast, the cadaverine content increased in this study for US6 and US9 comparedto the control (NSU). This effect may be associated with the viability of S. thermophilus, which hasbeen reported to accumulate cadaverine, mostly due to lysine decarboxylase action [61]. Consistently,the count of S. thermophilus remained above the minimal level of the starter culture (7 log CFU g−1) [42]for all US treatments (Table 1). Regarding storage time, the BA content increased in all treatmentscompared to fresh yogurt (Table 3). This behavior is attributed to the amino acid decarboxylase enzyme,which remains active even at refrigerated storage (0–5 ◦C) [19].
Although there is no specific legislation regarding the BA content in dairy products, a consensussays it should not accumulate [20]. Therefore, the low total BA concentration observed in all GYsamples (from 25.84 to 32.79 mg L−1; Table 3) indicates that the products are safe in this regard.Tyramine is the BA most frequently associated with BA-mediated dairy-borne intoxications. Moreover,this biogenic amine may be potentiated by putrescine and cadaverine [19]. Although there is nolegislation about the occurrence of tyramine in foods, the European Food Safety Authority (EFSA) [62]proposed a no adverse effect levels (NOAEL) for tyramine, considering each meal intake during theday. NOAEL of 600 mg and 50 mg (per meal per person) for tyramine were established, respectively,for healthy individuals and those taking third-generation monoaminoxidase inhibitory (MAOI) drugs.Finally, NOAEL of 6 mg (per meal per person) for tyramine was proposed for individuals takingclassical MAOI drugs. France is one of the countries that most consume yogurt in the world [63],with an average annual volume of 19.62 L per capita (from 2008 to 2018) [64,65]. Taking France as anexample, the average content of tyramine in yogurt in the present study (Table 3) would lead to a dailytyramine intake of 0.97, 0.89, 0.89, and 0.85 mg per capita, respectively. Thus, none of our goat milkyogurt samples raised a health concern to tyramine content, since its level was below the NOAEL.
The effect of the US on the BA content in fermented dairy products was not found in the literature.Therefore, this study is the first report of this consequence in yogurt. Wójciak et al. [18] reported areduction in the BA content (cadaverine, putrescine, and tyramine) by US treatment (40 kHz andacoustic power 480 W) in dry-fermented beef during ripening (93 days). Although they used US waveswith higher energy and acoustic power values, their US treatments did not reduce the LAB viability,contrary to what was observed in the present study (Table 1). This difference may be justified by theinfluence of the matrix—where the US wave is propagated—on the viability of LAB culture [45].
Regarding the US effect compared to conventional technological strategies to improve the textureof yogurt, the addition of fiber-rich fruit pulp (viscous) was reported to increase by 4.29- and 1.70-foldthe putrescine and spermine levels, respectively, in sheep’s milk yogurt [66]. For cow’s milk yogurt,the fruit addition increased putrescine (1.53 fold) and cadaverine (3.15 fold) [35]. On the other hand,the US treatment increased only cadaverine up to 1.44-fold in 6 min of sonication (Table 3). Regardingtyramine, fruit addition reduced 2.01- and 2.89-fold compared to control in sheep’s [66] and cow’smilk yogurt, respectively. For total BAs, the reduction was 1.19-fold in cow’s milk yogurt [35]. Our UStreatments decreased tyramine and total BAs up to 1.14- and 1.17-fold, respectively, in 9 min ofsonication (Table 3). Therefore, although fruit pulp led to a higher reduction in tyramine than UStreatments, this effect was overlapped by an increase in other amines, so that the reduction in total BAswas similar in both treatments. Vieira et al. [35] described a similar behavior for cow milk yogurt withcarbohydrate addition, where they observed an increase in cadaverine (5.03-fold) and a reduction in

Molecules 2020, 25, 4638 13 of 22
tyramine (2.60-fold), resulting in a reduction in total BAs by 1.19-fold, which is similar those reportedhere for US treatments (1.17-fold).
The data reported here for firmness (Table 4) were in line with Costa et al. [4], Park et al. [67],and Miocinovic et al. [68] for goat milk yogurts stored at 4 ◦C and unfortified with gums or proteinisolate. Moreover, our results agree with Jalilzadeh et al. [38], who reported no difference in hardnessbetween US-treated and control cheese samples during 60 days of ripening. The low ability of UStreatments to improve the firmness and consistency in our study (Table 4) may be explained by anincrease in the number of the particles, including fragments of gel, by a factor of approximately 2.5 inyogurt by US [14,69]. Thus, sonication can result in weaker gels than respective control yogurts [69,70].In general, the firmness tended to reduce with ultrasound herein. However, this trend was notsignificant (p > 0.05) in most of the cases (Table 4). On the other hand, yogurt gels produced frommilk treated by the high-intensity US have shown enhanced firmness [12–17]. This suggests thatultrasound application in milk instead of yogurt may be a better alternative to obtain a firmer product.In addition, particles in yogurt can re-aggregate during its storage [47]. The similar firmness andconsistency between the control and US treatments at 28 days (Table 4) indicate that this re-aggregationoccurred in all samples at the end of storage. The reduction in textural parameters during storage for alltreatments compared to fresh yogurt (Table 4) agrees with the findings of Kamble and Kokate [71] andVieira et al. [22]. They reported a decrease in firmness and consistency in cow’s yogurt in cold storage.Lactobacillus acidophilus and Streptococcus thermophilus have a proteolytic activity that hydrolyzes theprotein network to small peptides and free amino acids during storage, resulting in significant texturereduction [72].
In general, the viscosity values (Figure 3A1–A3) for treatments from 14 days of storage, as wellas for control during the whole storage period, were similar to those reported by Costa et al. [4] andGursoy et al. [47] for yogurts during refrigerated storage. On the other hand, values for treatmentson the first day of storage, US3 on the 14th day, and US6 after 28 days of storage were similar tothose reported for goat’s yogurt fortified with solids or whey proteins [73]. In addition, the behaviorof yogurts during storage (Figure 3B1–B3) highlighted the rheological profile of these samples as anon-Newtonian liquid with pseudoplastic behavior, which is typical of yogurt [74]. The results indicatethat US treatments did not considerably affect the flow behavior of samples, which remained typical ofyogurt. Enhanced viscosity by US treatments, as observed herein (Figure 3A1–A3), was previouslyreported by Gursoy et al. [47]. They found an increase in apparent viscosity due to sonication (125 to150 W for 15 min) in cow’s milk yogurt in 10 days of storage. As the US increases the particle number,including fragments of gel [14,69], the US after inoculation improved the viscosity in the finishedyogurt [75], as also observed herein (Figure 3).
High values of determination coefficient (ranging from 0.911 ± 0.031 to 0.994 ± 0.001) indicatethat the power-law model was appropriate to determine the rheological properties of GY. The valuesof consistency index (K) and flow behavior index (n) (Table 4) were in line with those reported byRamírez-Sucre and Vélez-Ruiz [76] and Keogh and O’Kennedy [77] for yogurt. Similar to our results(Table 4), Barukcic et al. [48] reported an increased consistency index in sonicated milk whey samples(480 W for 10 min) compared to control. The increase in K values by US may be attributed to thereasons previously discussed here, which led to an increase in apparent viscosity. The middle time ofsonication (6 min) was the most effective to improve viscosity (Figure 3) and increase the consistencyindex (Table 4). This indicates that the shorter time used (3 min) may not have been sufficient todissociate gel structure in smaller particles [75] significantly. On the other hand, the longer time ofsonication (9 min) may have disrupted the protein gel and affected the interaction between proteinsduring storage [48].
The flow behavior index (n) indicates the degree of deviation from the Newtonian behavior(n = 1). If n is greater than 1, the fluid is classified as dilatant, presenting shear-thickening; if n isbetween zero and 1, the fluid is classified as pseudoplastic or non-Newtonian, exhibiting shear-thinning.All samples were considered non-Newtonian liquids with pseudoplastic behavior, as expected for

Molecules 2020, 25, 4638 14 of 22
yogurt rheology [74]. This reinforces our finding for viscosity behavior (Figure 3): the US treatmentdid not change the type of flow of samples. Similar behavior was reported for milk whey samplessubmitted to the US [48]. The decrease in the flow index by US6 reinforces the greater efficiency of thistime of sonication to fragment the protein network, which increases the particle concentration in theproduct, leading to a reduction in n [76].
The reduction in the viscosity and consistency index values in all samples compared to freshyogurt during storage (Table 4) agree with the findings of Kamble and Kokate [71], who reported adecrease in apparent viscosity in cow’s yogurt in cold storage. The reduction in these parameters maybe attributed to the growth and release of proteolytic enzymes by starter cultures in yogurt duringstorage, which breaks down the gel structure to small peptides and free amino acids [72]. Finally,the increased flow behavior index in samples compared to the fresh yogurt (Table 4) may be related tothe decrease of consistency index values during storage, since both rheological parameters present aninverse relation in pseudoplastic fluids [78].
4. Materials and Methods
4.1. Reagents and Chemicals
Standards of biogenic amines (tyramine, putrescine, cadaverine, spermine, and spermidine),mono- and disaccharides (lactose, glucose, and galactose), and organic acids (formic, citric, and lacticacids), all ≥ 98%, were purchased from Sigma-Aldrich (St. Louis, MO, USA). Acetonitrile (HPLC grade)and all analytical-grade chemicals were obtained from Tedia (São Paulo, Brazil). A Millipore Milli-Qwater system was also used (Millipore, Bedford, MA, USA).
4.2. Preparation of Goat Milk Yogurt Samples
The UHT-processed whole goat milk (Caprilat®, Paraná, Brazil) used in the manufacture of theyogurt samples presented pH = 6.70 ± 0.20. In addition, the chemical composition of milk was of3.5 ± 0.15, 3.0 ± 0.17, 0.70 ± 0.12, and 88.5 ± 1.0 g/Kg for fat, protein, ash, and moisture, respectively.The yogurt samples processing was performed by Costa et al. [4]. Thermophilic yogurt cultures(1% (v/v); YF-L903; Chr. Hansen, Valinhos, Brazil) and a Lactobacillus acidophilus probiotic culture(5% (v/v); LA-5®®; Chr. Hansen, Valinhos, Brazil) were used to inoculate whole goat milk (Caprilat®,Paraná, Brazil). The milk samples were incubated in a thermosetting incubator (Heratherm, ThermoScientific™, Brazil) at 43 ± 2 ◦C. After 4 h of fermentation, the final pH (4.4) was reached, as describedin the official method [79]. Then, fermentation was stopped by refrigerating the yogurts at 4 ± 1 ◦C.After 2 h of refrigeration, the yogurt samples at 4 ± 2 ◦C were subjected to the ultrasound treatments.
4.3. Ultrasound (US) Treatments
After fermentation, yogurt samples (150 mL) were subjected to US waves of 67% of amplitudein an ultrasonic bath at a frequency of 20 kHz (UIP1000hdT, Hielscher Ultrasonics GmbH, Teltow,Germany). The sonotrodes (18-mm diameter tip; Sonotrode BS2d18, Hielscher Ultrasonics GmbH,Teltow, Germany) generated a total power of 300 W, which corresponds to the US intensity 2 W/mL ofmaterial. Two batches of US treatment were performed.
The US treatment was carried out in an ice bath to minimize the extent of lipid oxidation; thetemperature was kept at 8 ± 2 ◦C. To study the effect of time, different US treatment durations weretested, as follows: non-treated sample (NSU), US treatment for 3 min (US3), US treatment for 6 min(US6), and US treatment for 9 min (US9).
The ultrasound treatment times were chosen based on those reported in the literature for cow’smilk yogurt sonicated before [15,16] or after inoculum of starter cultures [13,14,46,58,75], as well as forunfermented cow and goat milk [12,40].

Molecules 2020, 25, 4638 15 of 22
4.4. Microbial Analysis
The microbial count was performed in triplicate using a spiral plater (model Eddy Jet 2,IUL Instruments, Barcelona, Spain) on the first day of storage. The Streptococcus thermophilus count wasperformed using M17 agar (Difco Laboratories, Detroit, MI, USA), enriched with lactose and incubatedunder aerobic conditions at 37 ± 1 ◦C for 48 h; the count of Lactobacillus delbrueckii ssp. bulgaricus wasperformed using de Man, Rogosa, and Sharpe agar (MRS, Difco Laboratories, Detroit, MI, USA) withpH 5.4 after incubation under an anaerobic condition at 37 ± 1 ◦C for 72 h [42]. Following Costa et al. [4],the L. acidophilus LA-5 enumeration was performed in MRS agar (Difco Laboratories, Detroit, MI, USA)supplemented with 0.15% (w/v) bile salts incubated under microaerophilic conditions at 37 ± 1 ◦C for48 h. The mean of the bacterial counts was calculated, in experimental and analytical triplicate, andexpressed as log CFU g−1 in fresh yogurt (1st day of storage at 4 ◦C).
4.5. Chemical Characterization of Goat Milk Yogurt
After the ultrasound treatments, the samples were analyzed for chemical composition in freshyogurt (1st day of storage at 4 ◦C) and for other chemical parameters at fourteen-day intervals (1, 14,and 28 days) during storage at 4 ◦C. The assays were performed in experimental and analytical triplicate.
4.5.1. Chemical Composition
The mineral content (g/Kg) of yogurt samples was determined by sample incineration in an openinert vessel and destruction of the organic content by thermal decomposition at 550 ◦C within 2 husing a muffle furnace (FO100 Yamato, Tokyo, Japan), as described in the official method 900.02 [79].The protein amount (g/Kg) was analyzed according to the Kjeldahl method, based on the nitrogencontent of the yogurt samples and then expressed as protein content by multiplying the nitrogencontent determined by 6.38, as described in the official method 992.23 [79]. The fat content (g/Kg)was analyzed using the Gerber method described in the official method 920.39C [79]. The moisturecontent was analyzed using infrared radiation drying (model LJ16, Mettler Toledo®®, Barueri, SP,Brazil) following the official method and expressed as g/Kg [79].
4.5.2. Monosaccharides, Disaccharides, and Organic Acids Quantification by HPLC-DAD-RID
The mono- and disaccharides as well as the organic acids were extracted and quantified byhigh-performance liquid chromatography with a diode array detector and a refractive index detector(HPLC-DAD-RID), using a method previously described and validated by our research group [53].Briefly, monosaccharides, disaccharides, and organic acids were extracted from yogurt samples (1 g)through homogenization with 5 mL of 45 mmol L−1 H2SO4 for 30 min in a shaker (TS-2000 A VDRLshaker, Biomixer®, São Paulo, Brazil) at 240 rpm following another 1 min in the vortex. The homogenateswere centrifuged at 5500× g for 20 min at 4 ◦C (Sorvall ST16R, Thermo Scientific, São Paulo, Brazil).The supernatant was initially filtered through Whatman No. 1 filter paper and then passed through a0.45 µm pore size membrane (PVDF, Millipore, Brazil) filter. After, the injection volume of 20 µL ofmonosaccharides, disaccharides, and organic acids was separated on an Aminex HPX-87H column(300 × 7.8 mm, 9 µm particle size, 8% cross-linkage and pH range of 1–3; Bio-Rad, Hercules, CA, USA),utilizing a 3 mM sulfuric acid aqueous mobile phase (pH 2.35) under isocratic conditions at a flow rateof 0.5 mL min−1. The column temperature was maintained at 60 ◦C. The wavelength for organic aciddetection was set at 210 nm. The chromatographic system consisted of a LC-20AT pump integratedwith CBM-20A controller and SPD-M20A diode array detector in-line with RID-10A refractive indexserial detector (Shimadzu, Kyoto, Japan). The compounds were identified by retention times andby spiking the suspect analyte to the sample, and the concentrations (mg g−1) were determined byinterpolation in standard external curves (0.0–60 mg g−1, r2
≥ 0.995) using a LC Solution softwareversion 2.1.

Molecules 2020, 25, 4638 16 of 22
4.5.3. Biogenic Amine Quantification by RP-HPLC-DAD
The extraction and quantification of biogenic amines (BAs) were performed by reverse-phaseHPLC with a diode array detector (RP-HPLC-DAD). The methods of extraction and derivatizationand the chromatographic conditions were previously described and validated following the US-FDAguidelines, which were considered suitable for yogurt quality control [35]. Briefly, BAs extractionfrom yogurt samples was performed with HClO4 (0.6 M) in a shaker (TS-2000 A VDRL shaker,Biomixer®, São Paulo, Brazil) for 30 min. After centrifugation at 5500× g for 30 min at 4 ◦C (SorvallST16R, Thermo Scientific, São Paulo, Brazil), the supernatant filtered through Whatman No. 1 filterpaper was alkalinized with NaOH (2 M) for the precipitation of small peptides. After centrifugation(5500× g for 15 min at 4 ◦C), BAs derivatization in the supernatant was performed using benzoylchloride. Then, twice the extraction of BAs derivatives with diethyl ether was performed, followed byevaporation under N2 and resuspension with acetonitrile. The chromatographic separation of 50 µL ofthe derivatized sample was achieved in a Kromasil® C18 column (250 × 4.6 mm i.d., 5-µm particlesize). A mobile gradient phase with a flow rate of 0.6 mL min−1 composed of ultrapure water (A) andacetonitrile (B) was used. Detection was performed in UV at 254 nm, and the column temperature wasmaintained with a thermostat at 40 ◦C. The HPLC system (Shimadzu, Kyoto, Japan) consisted of anLC-20AT pump, SPD-M20A diode-array detector, CTO-20A oven, and SIL-20AC autosampler, all ofwhich were connected to a CBM-20A controller. The BAs were identified by retention times and byspiking the samples with the suspected amine and quantified by interpolating peak area in standardexternal curves (1–50 mg L−1, r2
≥ 0.980) using LC Solution software. The data were expressed asmg L−1.
4.6. Physical Characterization of Goat Milk Yogurt
After ultrasound treatments, the samples were analyzed in experimental and analytical triplicate,for physical parameters at fourteen-day intervals (1, 14, and 28 days) during storage at 4 ◦C.
4.6.1. pH Determination
The pH of each sample was measured with a digital pH-meter (ISTEK, Model 720P, Guro-dong,Guro-gu, Korea) equipped with a glass electrode, which was inserted directly into the yogurt. Before themeasurement, the electrode was calibrated with standard buffer solutions of pH 4.00 and 7.00 [79].
4.6.2. Textural Properties of Goat Milk Yogurt
Firmness (g), consistency (g·s), and cohesiveness (g) were measured according to Costa et al. [4],using a texture analyzer (TA-XT.Plus, Stable Micro Systems Ltd., Surrey, UK) equipped with a 49.0 Nload cell. The back extrusion cell plunger was 3.6 cm in diameter and was placed at 20 mm above thesample surface. The test cell penetrated 2 cm into the sample at 4 ◦C.
4.6.3. Rheological Behavior and Apparent Viscosity of Goat Milk Yogurt
The gels of yogurt samples were broken by stirring before rheological measurements, which wereperformed using a concentric cylinder Brookfield viscometer (LVDVIII) and a spindle SC4-34(Brookfield Engineering Laboratories, MA, USA). For each measurement, 9 mL of yogurt werecarefully deposited in the sample cup (11 mL). For all samples, the filled sample cup and the spindlewere temperature-equilibrated for about 15 min. The flow curves of samples were determined at speedsbetween 20 and 250 rpm (20, 40, 60, 80, 100, 120, 150, 180, 200, and 250); their corresponding shear rates(γ·) and shear stresses (σ) were computed from relations given by the instrument manufacturer andthen recorded. All characterizations were performed three times for each sample.
The experimental data were fitted to the Power law model [80] as in Equation (1):
Power law model: σ = K (γ·) n (1)

Molecules 2020, 25, 4638 17 of 22
where σ is the shear stress (Pa), γ· is the shear rate (s−1), K is the consistency index (Pa·sn), and n is theflow behavior index (dimensionless).
The Wingather program (Brookfield Engineering Laboratories Inc., Stoughton, MA, USA) wasused to collect data and calculate apparent viscosity. Viscosity values in the upward viscosity/shearrate curves at a shear rate between 4 and 25 s−1 (equivalent to rotation from 20 rpm to 250 rpm) werereported as the apparent viscosity of yogurt samples and expressed in mPa·s.
4.7. Internal Validation of Predictive Models
The performance of a predictive model is overestimated (optimism) when based only on thesample used to construct the model. Therefore, internal validation methods aim to provide an accurateestimate of model performance in new samples [81].
The estimate of Harrell’s optimism was calculated according to Equation (2) [82] and the coefficientof determination of the original model after validation (Equation (3)).
o =
∑Mm=1 o(m)
M(2)
R2v = R2
app − o (3)
where for each bootstrap sample with replacement (m = 1, . . . , M), R2boot
(m) = bootstrap coefficient ofdetermination obtained from the fitted model to the bootstrap dataset; R2
orig(m) = original coefficient
of determination obtained by applying the fitted model from the bootstrap dataset to the originaldataset; o = optimism of the original model; o(m) = R2
boot(m)−R2
orig(m); M = number of bootstrap datasets;
R2v: coefficient of determination of the original model after validation; R2
app = apparent coefficient ofdetermination obtained from fitted model to original data.
4.8. Statistical Analysis
All analyses were performed in experimental and analytical triplicate, and the results wereexpressed as mean ± standard deviation (SD). Significance tests were conducted using one-wayanalysis of variance (ANOVA) at a 0.05 significance level for the variables of chemical compositionand bacterial counts. For the other variables, the two-way ANOVA analysis was applied (p < 0.05).When a significant F was observed, differences between means were evaluated by Tukey’s multiplecomparison tests, and two-side p-values < 0.05 were considered statistically significant. The correlationbetween variables was evaluated using Pearson’s correlation test with a significance level of 0.05.Next, the models were internally validated through the bootstrap method (confidence interval = 95%;number of simulations = 1000; size of bootstrap samples = size of original sample; and number ofbootstrap samples = 200) [82]. The statistical analyses were performed using the XLSTAT software(version 2013.2.03; Addinsoft, Paris, France).
5. Conclusions
US technology has been proposed as an alternative to conventional food processing to improvethe physical properties of dairy products. The US treatment in goat milk yogurt may improve itsrheological properties depending on the exposure time. The exposure to the US for 6 min considerablyenhanced the apparent viscosity and the consistency index of yogurt samples. Therefore, US processingfor 6 min may be potentially used by the dairy industry to improve the physical properties of storedgoat yogurt while reducing the BA content and post-acidification. However, further studies should beperformed, since the direct application of US in yogurt interfered with the viability of probiotic bacteria.

Molecules 2020, 25, 4638 18 of 22
Supplementary Materials: The following materials are available online: Table S1: Pearson’s correlation testbetween microbial count and physicochemical parameters in goat milk yogurt samples stored at 4 ◦C; Table S2:Optimism-corrected performance estimates validated by the bootstrap approach of significant models for predictionof physicochemical parameters of the microbial count in goat milk yogurt stored at 4 ◦C during 28 days.
Author Contributions: C.C.-J. and M.C. presented the idea and designed the experiment; K.D. and B.F. carriedout the experiment; K.D. and C.V. performed the data curation; K.D., C.V. and M.C. wrote the manuscript. C.C.-J.,I.D., and A.B. supervised the experiments and provided funding. All authors read and agreed to the publishedversion of the manuscript.
Funding: This research was supported by Fundação Carlos Chagas Filho de Amparo à Pesquisa do Estado do Riode Janeiro (FAPERJ), grant number E-26/201.185/2014; by the National Council for Scientific and TechnologicalDevelopment (CNPq), grant number 311422/2016-0; and by the Coordination for the Improvement of HigherEducation Personnel (CAPES), grant number E-26/101.403/2014 (CAPES/FAPERJ E-45-PAPDRJ/2013).
Conflicts of Interest: The authors declare no conflict of interest.
References
1. Getaneh, G.; Mebrat, A.; Wubie, A.; Kendie, H. Review on goat milk composition and its nutritive value.J. Nutr. Health Sci. 2016, 3, 1–10. [CrossRef]
2. Pastuszka, R.; Barłowska, J.; Litwinczuk, Z. Nutritional value and health-promoting properties of goat milk.Med. Weter 2015, 71, 480–485.
3. Turknem, N. The nutritional value and health benefits of goat milk components. In Nutrients in Dairy andTheir Implications on Health and Disease, 1st ed.; Watson, R.R., Collier, R.J., Preedy, V.R., Eds.; Elsevier: London,UK, 2017; Volume 1, pp. 441–449. [CrossRef]
4. Costa, M.; Frasao, B.; Silva, A.C.; Freitas, M.; Franco, R.M.; Conte-Junior, C. Cupuassu (Theobroma grandiflorum)pulp, probiotic, and prebiotic: Influence on color, apparent viscosity, and texture of goat milk yogurts.J. Dairy Sci. 2015, 98, 5995–6003. [CrossRef]
5. Costa, M.; Balthazar, C.F.; Franco, R.M.; Mársico, E.T.; Cruz, A.G.; Conte-Junior, C. Changes on expectedtaste perception of probiotic and conventional yogurts made from goat milk after rapidly repeated exposure.J. Dairy Sci. 2014, 97, 2610–2618. [CrossRef]
6. Eissa, E.A.; Ahmed, I.M.; Yagoub, A.E.A.; Babiker, E.E. Physicochemical, microbiological and sensorycharacteristics of yoghurt produced from goat milk. Live Stock. Res. Rural Dev. 2010, 22, 247–253.
7. Gursel, A.; Gursoy, A.; Anli, E.A.K.; Budak, S.O.; Aydemir, S.; Durlu-Ozkaya, F. Role of milk protein-basedproducts in some quality attributes of goat milk yogurt. J. Dairy Sci. 2016, 99, 2694–2703. [CrossRef][PubMed]
8. Loveday, S.M.; Sarkar, A.; Singh, H. Innovative yoghurts: Novel processing technologies for improving acidmilk gel texture. Trends Food Sci. Technol. 2013, 33, 5–20. [CrossRef]
9. Delgado, K.F.; Frasao, B.S.; Costa, M.P.; Conte-Junior, C. Different alternatives to improve rheological andtextural characteristics of fermented goat products-A Review. Rheol. Open Access 2017, 1, 1–6.
10. Ozawa, T.; Mukuda, K.; Fujita, M.; Nishitani, J. Goat milk acceptance and promotion methods in Japan:The questionnaire survey to middle class households. Anim. Sci. J. 2009, 80, 212–219. [CrossRef] [PubMed]
11. Chandrapala, J.; Oliver, C.; Kentish, S.; Ashokkumar, M. Ultrasonics in food processing-food quality assuranceand food safety. Trends Food Sci. Technol. 2012, 26, 88–98. [CrossRef]
12. Nguyen, N.H.A.; Anema, S.G. Effect of ultrasonication on the properties of skim milk used in the formationof acid gels. Innov. Food Sci. Emerg. Technol. 2010, 11, 616–622. [CrossRef]
13. Nguyen, T.M.P.; Lee, Y.K.; Zhou, W. Stimulating fermentative activities of bifidobacteria in milk by highintensity ultrasound. Int. Dairy J. 2009, 19, 410–416. [CrossRef]
14. Nöbel, S.; Ross, N.-L.; Protte, K.; Körzendörfer, A.; Hitzmann, B.; Hinrichs, J. Microgel particle formation inyogurt as influenced by sonication during fermentation. J. Food Eng. 2016, 180, 29–38. [CrossRef]
15. Riener, J.; Noci, F.; Cronin, D.A.; Morgan, D.J.; Lyng, J.G. The effect of thermosonication of milk on selectedphysicochemical and microstructural properties of yoghurt gels during fermentation. Food Chem. 2009, 114,905–911. [CrossRef]

Molecules 2020, 25, 4638 19 of 22
16. Riener, J.; Noci, F.; Cronin, D.A.; Morgan, D.J.; Lyng, J.G. A comparison of selected quality characteristics ofyoghurts prepared from thermosonicated and conventionally heated milks. Food Chem. 2010, 119, 1108–1113.[CrossRef]
17. Sfakianakis, P.; Tzia, C. Conventional and Innovative Processing of Milk for Yogurt Manufacture; Developmentof Texture and Flavor: A Review. Foods 2014, 3, 176–193. [CrossRef] [PubMed]
18. Wójciak, K.M.; Stasiak, D.M.; Stadnik, J.; Ferysiuk, K.; Kononiuk, A. The influence of sonication time on thebiogenic amines formation as a critical point in uncured dry-fermented beef manufacturing. Int. J. Food Sci.2019, 54, 75–83. [CrossRef]
19. Linares, D.M.; del Río, B.; Ladero, V.; Martínez, N.; Fernández, M.; Martín, M.C.; Martín, M.A. Factorsinfluencing biogenic amines accumulation in dairy products. Front. Microbiol. 2012, 3, 1–10. [CrossRef]
20. Benkerroum, N. Biogenic Amines in Dairy Products: Origin, Incidence, and Control Means. Compr. Rev.Food Sci. Food Saf. 2016, 15, 801–826. [CrossRef]
21. Costa, M.P.; Balthazar, C.F.; Rodrigues, B.L.; Lázaro, C.A.; Silva, A.C.O.; Gomes, A.C.; Conte-Junior, C.A.Probiotic fermented cow’s and goat’s milks: Determination of biogenic amines and sensory acceptance.Food Sci. Nutr. 2015, 3, 172–178. [CrossRef]
22. Vieira, C.P.; Costa, M.P.; Frasao, B.S.; Silva, V.L.; Moreira, R.V.B.P.; Nunes, Y.E.O.; Conte-Junior, C.A.Nondestructive prediction of the overall quality of cow milk yogurt by correlating a biogenic amine indexwith traditional quality parameters using validated nonlinear models. J. Food Comp. Anal. 2019, 84, 103328.[CrossRef]
23. Kumar, S.; Kumar, B.; Kumar, R.; Kumar, S.; Khatkar, S.K.; Kanawjia, S.K. Nutritional features of goat milk—Areview. Indian J. Dairy Sci. 2012, 65, 266–273. [CrossRef]
24. McCabe-Sellers, B.J.; Staggs, C.G.; Bogle, M.L. Tyramine in foods and monoamine oxidase inhibitor drugs:A crossroad where medicine, nutrition, pharmacy, and food industry converge. J. Food Compos. Anal. 2006,19, S58–S65. [CrossRef]
25. Tadjine, D. Milk heat treatment affects microbial characteristics of cows’ and goats’ “Jben” traditional freshcheeses. Food Sci. Technol. 2020, 1–8. [CrossRef]
26. Baratella, D.; Bonaiuto, E.; Magro, M.; Roger, J.A.; Kanamori, Y.; Lima, G.P.P.; Agostinelli, E.; Vianello, F.Endogenous and food-derived polyamines: Determination by electrochemical sensing. Amino Acids 2018, 50,1187–1203. [CrossRef]
27. Büyükuslu, N. Dietary polyamines and diseases: Reducing polyamine intake can be beneficial in cancertreatment. J. Nutr. 2015, 2, 27–38. [CrossRef]
28. Saikali, J.; Picard, C.; Freitas, M.; Holt, P. Fermented milks, probiotic cultures, and colon cancer. Nutr. Cancer2004, 49, 14–24. [CrossRef]
29. Zheng, X.; Wu, K.; Song, M.; Ogino, S.; Fuchs, C.S.; Chan, A.T.; Giovannucci, E.L.; Cao, Y.; Zhang, X.Yogurt consumption and risk of conventional and serrated precursors of colorectal cancer. Gut 2020, 69,970–972. [CrossRef]
30. Matsumoto, M.; Benno, Y. Consumption of Bifidobacterium lactis LKM512 yogurt reduces gut mutagenicity byincreasing gut polyamine contents in healthy adult subjects. Mutat. Res. 2004, 568, 147–153. [CrossRef]
31. Matsumoto, M.; Ohishi, H.; Benno, Y. Impact of LKM512 yogurt on improvement of intestinal environmentof the elderly. FEMS Immunol. Med. Microbiol. 2001, 31, 181–186. [CrossRef]
32. Kesse, E.; Bertrais, S.; Astorg, P.; Jaouen, A.; Arnaultu, N.; Galan, P.; Hercberg, S. Dairy products, calciumand phosphorus intake, and the risk of prostate cancer: Results of the French prospective SU.VI.MAX(Supple’mentation en Vitamines et Mine’raux Antioxydants) study. Brit. J. Nutr. 2006, 95, 539–545. [CrossRef]
33. López-Plaza, B.; Bermejo, L.M.; Santurino, C.; Cavero-Redondo, I.; Álvarez-Bueno, C.; Gómez-Candela, C.Milk and dairy product consumption and prostate cancer risk and mortality: An overview of systematicreviews and meta-analyses. Adv. Nutr. 2019, 10, S212–S223. [CrossRef] [PubMed]
34. Hsu, C.C.; Chow, W.-H.; Boffetta, P.; Moore, L.; Zaridze, D.; Moukeria, A.; Janout, V.; Kollarova, H.; Bencko, V.;Navratilova, M.; et al. Dietary risk factors for kidney cancer in eastern and central Europe. Am. J. Epidemiol.2007, 166, 62–70. [CrossRef] [PubMed]
35. Vieira, C.P.; Costa, M.P.; Silva, V.L.; Frasao, B.S.; Aquino, L.F.C.; Nunes, Y.E.O.; Conte-Junior, C.A.Development and validation of RP-HPLC-DAD method for biogenic amines determination in probioticyogurts. Arab. J. Chem. 2020, 13, 1582–1597. [CrossRef]

Molecules 2020, 25, 4638 20 of 22
36. Benamouzig, R.; Mahé, S.; Luengo, C.; Rautureau, J.; Tomé, D. Fast and postprandial polyamine concentrationsin the human digestive lumen. Am. J. Clin. Nutr. 1997, 65, 766–770. [CrossRef] [PubMed]
37. Fan, J.; Feng, Z.; Chen, N. Spermidine as a target for cancer therapy. Pharm. Res. 2020, 159, 104943. [CrossRef]38. Jalilzadeh, A.; Hesari, J.; Peighambardoust, S.H.; Javidipour, I. The effect of ultrasound treatment on microbial
and physicochemical properties of Iranian ultrafiltered feta-type cheese. J. Dairy Sci. 2018, 101, 5809–5820.[CrossRef] [PubMed]
39. Bonczar, G.; Filipczak-Fiutak, M.; Pluta-Kubica, A.; Duda, I.; Walczycka, M.; Staruch, L. The range of proteinhydrolysis and biogenic amines content in selected acid-and rennet-curd cheeses. Chem. Pap. 2018, 72,2599–2606. [CrossRef]
40. Karlovic, S. Reducing fat globules particle-size in goat milk: Ultrasound and high hydrostatic pressuresapproach. Chem. Biochem. Eng. Q. 2015, 28, 499–507. [CrossRef]
41. Zhao, L.; Zhang, S.; Uluko, H.; Liu, L.; Lu, J.; Xue, H.; Kong, F.; Lv, J. Effect of ultrasound pretreatment onrennet-induced coagulation properties of goat’s milk. Food Chem. 2014, 165, 167–174. [CrossRef]
42. Codex Alimentarius. Codex Standard for Fermented Milks. Codex Standard 243-2003 in Codex Alimentarius:Milk and Milk Products, 2nd ed.; Codex Alimentarius Commission: Brussels, Belgium, 2010; pp. 1–11.
43. Bedani, R.; Rossi, E.A.; Saad, S.M.I. Impact of inulin and okara on Lactobacillus acidophilus LA-5 andBifidobacterium animalis BB-12 viability in a fermented soy product and probiotic survival under in vitrosimulated gastrointestinal conditions. Food Microbiol. 2013, 34, 382–389. [CrossRef] [PubMed]
44. Fan, Z.; Kumon, R.E.; Deng, C.X. Mechanisms of microbubble-facilitated sonoporation for drug and genedelivery. Ther. Deliv. 2015, 5, 467–486. [CrossRef] [PubMed]
45. Ojha, K.S.; Mason, T.J.; O’Donnell, C.P.; Kerry, J.P.; Tiwari, B.K. Ultrasound technology for food fermentationapplications. Ultrason. Sonochem. 2017, 34, 410–417. [CrossRef]
46. Gholamhosseinpour, A.; Hashemi, S.M.B. Ultrasound pretreatment of fermented milk containing probioticLactobacillus plantarum AF1: Carbohydrate metabolism and antioxidant activity. J. Food Process. Eng. 2019, 42,e12930. [CrossRef]
47. Gursoy, O.; Yilmaz, Y.; Gokce, O.; Ertan, K. Effect of ultrasound power on physicochemical and rheologicalproperties of yoghurt drink produced with thermosonicated milk. Emir. J. Food Agric. 2016, 28, 235–241.[CrossRef]
48. Barukcic, I.; Jakopovic, K.L.; Herceg, Z.; Karlovic, S.; Božanic, R. Influence of high intensity ultrasoundon microbial reduction, physicochemical characteristics and fermentation of sweet whey. Innov. Food Sci.Emerg. Technol. 2015, 27, 94–101. [CrossRef]
49. Cameron, M.; McMaster, L.D.; Britz, T.J. Electron microscopic analysis of dairy microbes inactivated byultrasound. Ultrason. Sonochem. 2008, 15, 960–964. [CrossRef]
50. Abesinghe, A.M.N.L.; Islam, N.; Vidanarachchi, J.K.; Prakash, S.; Silva, K.F.S.T.; Karim, M.A. Effects ofultrasound on the fermentation profile of fermented milk products incorporated with lactic acid bacteria.Int. Dairy J. 2019, 90, 1–14. [CrossRef]
51. Vianna, F.S.; Canto, A.C.V.d.C.S.; Costa-Lima, B.; Salim, A.P.; Balthazar, C.F.; Costa, M.P.; Panzenhagen, P.;Rachid, R.; Franco, R.M.; Conte-Junior, C.A. Milk from different species on physicochemical andmicrostructural yoghurt properties. Cienc. Rural 2019, 49, 1–15. [CrossRef]
52. Costa, M.P.; Conte-Junior, C.A. Chromatographic methods for the determination of carbohydrates andorganic acids in foods of animal origin. Compr. Rev. Food Sci. Food Saf. 2015, 14, 586–600. [CrossRef]
53. Costa, M.P.; Frasao, B.S.; Lima, B.R.C.C.; Rodrigues, B.L.; Conte-Junior, C.A. Simultaneous analysis ofcarbohydrates and organic acids by HPLC-DAD-RI for monitoring goat’s milk yogurts fermentation. Talanta2016, 152, 162–170. [CrossRef] [PubMed]
54. Mba, A.U.; Boyo, B.S.; Oyenuga, V.A. Studies on the milk composition of West African dwarf, Red Sokotoand Saanen goats at different stages of lactation. J. Dairy Res. 1975, 42, 217–226. [CrossRef]
55. Bagnicka, E.; Łukaszewicz, M.; Ådnøy, T. Genetic parameters of somatic cell score and lactose content ingoat’s milk. J. Anim. Feed Sci. 2016, 25, 210–215. [CrossRef]
56. Mousavi, M.; Heshmati, A.; Daraei, G.A.; Vahidinia, A.; Taheri, M. Texture and sensory characterizationof functional yogurt supplemented with flaxseed during cold storage. Food Sci. Nutr. 2019, 7, 907–917.[CrossRef]

Molecules 2020, 25, 4638 21 of 22
57. Nishimura, J.; Makino, S.; Kimura, K.; Isogai, E.; Saito, T. Influence of different sterilization conditions on thegrowth and exopolysaccharide of Streptococcus thermophilus and co-cultivation with Lactobacillus delbrueckiisubsp. bulgaricus OLL1073R-1. Adv. Microbiol. 2015, 5, 760–767. [CrossRef]
58. Nguyen, T.M.P.; Lee, Y.K.; Zhou, W. Effect of high intensity ultrasound on carbohydrate metabolism ofbifidobacteria in milk fermentation. Food Chem. 2012, 130, 866–874. [CrossRef]
59. Kailasapathy, K.; Harmstorf, I.; Phillips, M. Survival of Lactobacillus acidophilus and Bifidobacterium animalisssp. lactis in stirred fruit yogurts. Lwt-Food Sci. Technol. 2008, 41, 1317–1322. [CrossRef]
60. Pintado, A.I.E.; Pinho, O.; Ferreira, I.M.P.L.V.O.; Pintado, M.M.E.; Gomes, A.M.P.; Malcata, F.X.Microbiological, biochemical and biogenic amine profiles of Terrincho cheese manufactured in several dairyfarms. Int. Dairy J. 2008, 18, 631–640. [CrossRef]
61. Kuley, E.; Balıkcı, E.; Özogul, I.; Gökdogan, S.; Özogul, F. Stimulation of cadaverine production by foodbornepathogens in the presence of Lactobacillus, Lactococcus, and Streptococcus spp. J. Food Sci. 2012, 77, M650–M658.[CrossRef]
62. EFSA Panel on Biological Hazards (BIOHAZ). Scientific opinion on risk based control of biogenic amineformation in fermented foods. Efsa J. 2011, 9, 93. [CrossRef]
63. Fisberg, M.; Machado, R. History of yogurt and current patterns of consumption. Nutr. Rev. 2015, 73, 4–7.[CrossRef]
64. FAOSTAT. Available online: https://www.fao.org/faostat/en/#home (accessed on 29 June 2020).65. FAS-USDA. Available online: https://www.fas.usda.gov/data (accessed on 29 June 2020).66. Silva, V.L.M.; Costa, M.P.; Vieira, C.P.; Conte-Junior, C.A. Short communication: Biogenic amine formation
during fermentation in functional sheep milk yogurts. J. Dairy Sci. 2019, 102, 8704–8709. [CrossRef] [PubMed]67. Park, Y.W.; Oglesby, J.; Hayek, S.A.; Aljaloud, S.O.; Gyawali, R.; Ibrahim, S.A. Impact of different gums
on textural and microbial properties of goat milk yogurts during refrigerated storage. Foods 2019, 8, 169.[CrossRef]
68. Miocinovic, J.; Miloradovic, Z.; Josipovic, M.; Nedeljkovic, A.; Radovanovic, M.; Pudja, P. Rheological andtextural properties of goat and cow milk set type yoghurts. Int. Dairy J. 2016, 58, 43–45. [CrossRef]
69. Körzendörfer, A.; Nöbel, S.; Hinrichs, J. Particle formation induced by sonication during yogurtfermentation—Impact of exopolysaccharide-producing starter cultures on physical properties. Food Res. Int.2017, 97, 170–177. [CrossRef] [PubMed]
70. Körzendörfer, A.; Schäfer, J.; Hinrichs, J.; Nöbel, S. Power ultrasound as a tool to improve the processabilityof protein-enriched fermented milk gels for Greek yogurt manufacture. J. Dairy Sci. 2019, 102, 7826–7837.[CrossRef] [PubMed]
71. Kamble, K.D.; Kokate, P.S. Production and keeping quality of yogurt from buffalo and cow milk—Atraditional milk product of high health value. Indian J. Tradit. Know. 2015, 14, 279–284. [CrossRef]
72. Gandhi, A.; Shah, N.P. Cell growth and proteolytic activity of Lactobacillus acidophilus, Lactobacillus helveticus,Lactobacillus delbrueckii ssp. bulgaricus, and Streptococcus thermophilus in milk as affected by supplementationwith peptide fractions. Int. J. Food Sci. Nutr. 2014, 65, 937–941. [CrossRef]
73. Li, J.; Guo, M. Effects of polymerized whey proteins on consistency and water-holding properties of goat’smilk yogurt. Food Chem. Toxicol. 2006, 71, C34–C38. [CrossRef]
74. Behnia, A.; Karazhiyan, H.; Niazmand, R.; Nafchi, A.R.M. Rheological properties of low fat yogurt containingcress seed gum. Agric. Sci. 2013, 4, 29–32. [CrossRef]
75. Wu, H.; Hulbert, G.J.; Mount, J.R. Effects of ultrasound on milk homogenization and fermentation withyogurt starter. Innov. Food Sci. Emerg. Technol. 2000, 1, 211–218. [CrossRef]
76. Ramírez-Sucre, M.O.; Vélez-Ruiz, J.F. Physicochemical, rheological and stability characterization of a caramelflavored yogurt. LWT-Food Sci. Technol. 2013, 51, 233–241. [CrossRef]
77. Keogh, M.K.; O’Kennedy, B.T. Rheology of stirred yogurt as affected by added milk fat, protein andhydrocolloids. J. Food Sci. 1998, 63, 108–112. [CrossRef]
78. Krokida, M.K.; Maroulis, Z.B.; Saravacos, G.D. Rheological properties of fluid fruit and vegetable pureeproducts: Compilation of literature data. Int. J. Food Prop. 2007, 4, 179–200. [CrossRef]
79. AOAC International. Official Methods of Analysis, 19th ed.; AOAC Int.: Arlington, VA, USA, 2012.80. Lee, W.J.; Lucey, J.A. Formation and physical properties of yogurt. Asian Austral. J. Anim. 2010, 23, 1127–1136.
[CrossRef]
Molecules 2020, 25, 4638 22 of 22
81. Steyerberg, E.W.; Harrell, F.E., Jr.; Borsboom, G.J.; Eijkemans, M.J.C.; Vergouwe, Y.; Habbema, J.D.F.Internal validation of predictive models: Efficiency of some procedures for logistic regression analysis.J. Clin. Epidemiol. 2001, 54, 774–781. [CrossRef]
82. Harrell, F.E.; Lee, K.L.; Mark, D.B. Tutorial in biostatistics multivariable prognostic models: Issues indeveloping models, evaluating assumptions and adequacy, and measuring and reducing errors. Stat. Med.1996, 15, 361–387. [CrossRef]
Sample Availability: Samples of the compounds are available from the authors.
© 2020 by the authors. Licensee MDPI, Basel, Switzerland. This article is an open accessarticle distributed under the terms and conditions of the Creative Commons Attribution(CC BY) license (http://creativecommons.org/licenses/by/4.0/).


![Influence of Transitory, as Compared with Permanent, High … · [CANCER RESEARCH 34, 328-336, February 1974] Influence of Transitory, as Compared with Permanent, High-Altitude Exposure](https://img.pdfslide.net/doc/110x75/6052a0544f1c1f29e54fa7ad/influence-of-transitory-as-compared-with-permanent-high-cancer-research-34-328-336.jpg)