Embed Size (px)
Citation preview
J Anim Ecol. 2017;1–14. wileyonlinelibrary.com/journal/jane | 1© 2017 The Authors. Journal of Animal Ecology © 2017 British Ecological Society
Received:28June2016 | Accepted:2March2017DOI: 10.1111/1365-2656.12700
A L L E E E F F E C T S I N E C O L O G Y A N D E V O L U T I O N
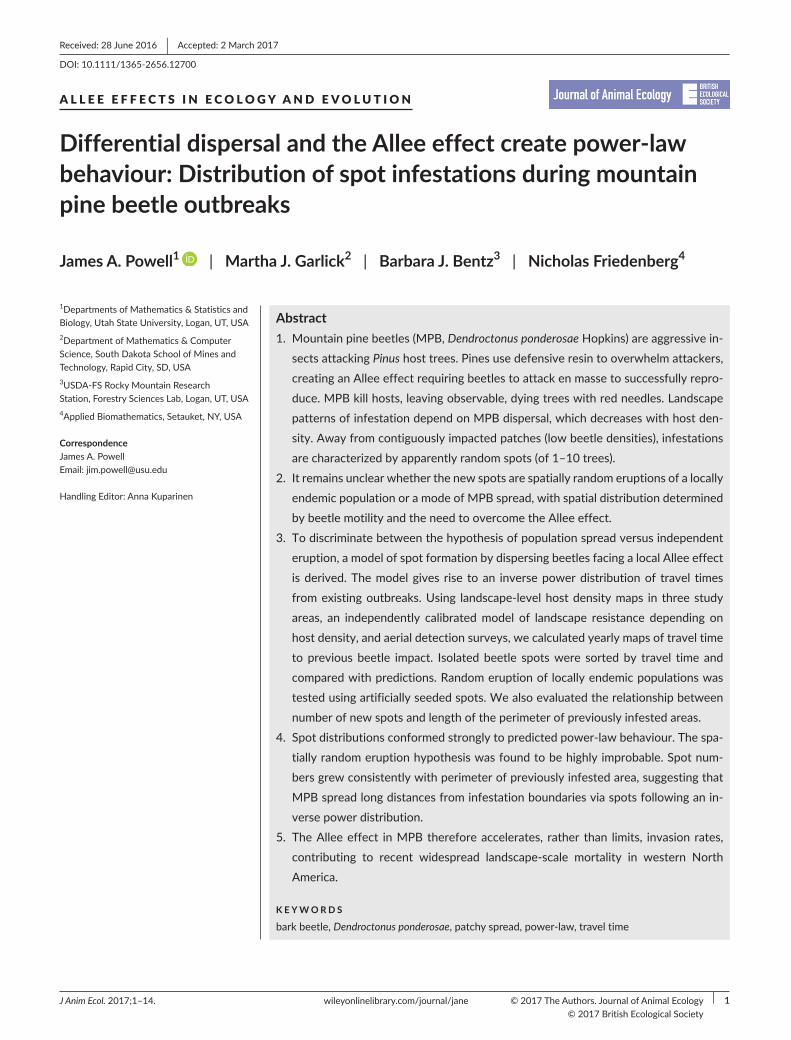
Differential dispersal and the Allee effect create power-law behaviour: Distribution of spot infestations during mountain pine beetle outbreaks
James A. Powell1 | Martha J. Garlick2 | Barbara J. Bentz3 | Nicholas Friedenberg4
1DepartmentsofMathematics&StatisticsandBiology,UtahStateUniversity,Logan,UT,USA2DepartmentofMathematics&ComputerScience,SouthDakotaSchoolofMinesandTechnology,RapidCity,SD,USA3USDA-FSRockyMountainResearchStation,ForestrySciencesLab,Logan,UT,USA4AppliedBiomathematics,Setauket,NY,USA
Correspondence JamesA.Powell Email:[email protected]
HandlingEditor:AnnaKuparinen
Abstract1. Mountainpinebeetles(MPB,Dendroctonus ponderosaeHopkins)areaggressivein-sectsattackingPinushosttrees.Pinesusedefensiveresintooverwhelmattackers,creatinganAlleeeffectrequiringbeetlestoattackenmassetosuccessfullyrepro-duce.MPBkillhosts,leavingobservable,dyingtreeswithredneedles.LandscapepatternsofinfestationdependonMPBdispersal,whichdecreaseswithhostden-sity.Awayfromcontiguouslyimpactedpatches(lowbeetledensities),infestationsarecharacterizedbyapparentlyrandomspots(of1–10trees).
2. ItremainsunclearwhetherthenewspotsarespatiallyrandomeruptionsofalocallyendemicpopulationoramodeofMPBspread,withspatialdistributiondeterminedbybeetlemotilityandtheneedtoovercometheAlleeeffect.
3. Todiscriminatebetweenthehypothesisofpopulationspreadversusindependenteruption,amodelofspotformationbydispersingbeetlesfacingalocalAlleeeffectisderived.Themodelgives rise toan inversepowerdistributionof travel timesfromexistingoutbreaks.Using landscape-levelhostdensitymaps in threestudyareas, an independently calibratedmodel of landscape resistance depending onhostdensity,andaerialdetectionsurveys,wecalculatedyearlymapsoftraveltimetopreviousbeetle impact. Isolatedbeetle spotswere sortedby travel time andcomparedwithpredictions.Randomeruptionoflocallyendemicpopulationswastestedusingartificiallyseededspots.Wealsoevaluatedtherelationshipbetweennumberofnewspotsandlengthoftheperimeterofpreviouslyinfestedareas.
4. Spotdistributionsconformedstronglytopredictedpower-lawbehaviour.Thespa-tiallyrandomeruptionhypothesiswasfoundtobehighlyimprobable.Spotnum-bersgrewconsistentlywithperimeterofpreviouslyinfestedarea,suggestingthatMPBspreadlongdistancesfrominfestationboundariesviaspotsfollowinganin-versepowerdistribution.
5. TheAlleeeffect inMPBthereforeaccelerates, rather than limits, invasion rates,contributing to recent widespread landscape-scale mortality in western NorthAmerica.
K E Y W O R D S
barkbeetle,Dendroctonus ponderosae,patchyspread,power-law,traveltime
2 | Journal of Animal Ecology POWELL Et aL.
1 | INTRODUCTION
TheAlleeeffectistheacceleratingimpactofconspecificnumbers/densities on some aspect of fitness for small populations (Allee,1931).At the levelofpopulations, a “demographic”Alleeeffect isthepositivedensitydependenceofpopulationgrowthrateaspop-ulation size grows from zero (Stephens, Sutherland,& Freckleton,1999). Small populations experienceAllee effects through severalgoverninginteractionsthataffectindividualfitness,includinggroupforaging,defenceagainstpredatorsandmatefinding(Lande,1998).A “strong”Alleeeffectoccurswhengrowth ratesarenegative forpopulations below a critical threshold (Wang & Kot, 2001). Alleeeffectsarecommonacrosstheanimalkingdomandalsoappearfre-quentlyinotherorganisms(Taylor&Hastings,2005andreferencestherein).
Allee effects are often associatedwith “patchy” spread or in-vasion (Morozov, Petrovskii, & Li, 2006; Petrovskii, Morozov, &Venturino,2002).Patchinesscanbeanemergent,passiveresponsetoheterogeneityofspaceand/orstochasticityofdispersal.Forex-ample,geneticdiversityofSpartina alternifloraclumpsinPacifices-tuaries improves seedproduction in plants throughhybridvigour,and consequently occasional accidents of dispersal create diverseclumpswithmuchhigher reproduction rates than individuals, cre-ating anAllee effect (Taylor, Davis, Civille, Grevstad, & Hastings,2004).Patchinesscanalsodevelopduetothegrowthof instabili-tiesandsubsequentfilteringbytheAlleeeffect(Wang,Shi,&Wei,2011),amechanismwhichalsodependsonpassivedispersal.Gypsymoths(Lymantria dispar)spreadbystratifieddispersal(i.e.short-andlong-distancedispersaloccurviadifferentprocesses,withseparatedispersal kernels), establishing stable, isolated patches only afterepisodiclong-distancedispersaleventsthatsurvivethesubsequentAlleegauntlet(Sharov&Liebhold,1998).Environmentalheteroge-neitycanleadtolocalizedpopulationsexceedingtheAlleethresh-old,suchasinpatchesoffavourablehabitatwheretheAlleeeffectislocallyreduced.Inallofthesecases,patchyspreadiscreatedbypassive dispersal, and theAllee threshold is exceeded indiscrimi-nately, resulting inpatchestablishment.Asmorepatches are cre-ated they coalesce and become a source population (Liebhold &Tobin,2008).
SpeciesfacingstrongAlleeeffectswilladapttoovercomethem.Allee (1931)himself recognizedthataggregationwastheprimarymechanism by which species increase survival rates and arguedthatonlyinthesimplestorganismswouldaggregationbehappen-stance.Except in rare, small,well-mixedsystems,populationsarelikelytohaveactivedispersaladaptationsforaggregating individ-uals. Understanding the population-level expression of the Alleeeffect will require understanding the aggregation mechanisms.Example mechanisms include habitat selection in heterogeneousenvironments(Greene,2003),congregationviadensity-dependentdispersal (Turchin,1989)andpheromoneresponses inarthropods(Wertheim, van Baalen, Dicke, & Vet, 2005). Aggregations thatresult from active dispersal at lowpopulation densitieswill drawdownsurroundingpopulationsandleadtospatialtrade-offswhich
maybeexpressed independentlyfromthoseoccurringasaresultof landscapeheterogeneity.Moreover,whenthe landscapeoffersvaryingresistancetomovement,aggregationshouldbemorelikelyinpatchesthatareeasiertoaccessorcausebottleneckstoother-wise fluidmovement. Thus, patterns of patchy spread in speciesactivelyaggregating toovercomeAlleeeffectscouldbemarkedlydifferentthaninspecieswithindiscriminatepatchcreation.
The mountain pine beetle (MPB, Dendroctonus ponderosae Hopkins) provides an excellent opportunity to study active patchformationinaspeciesfacinganAlleeeffect.MPBisaneconomicallyand ecologically important native species that has caused signifi-cantmortalityinPinusforestsacrossthewesternUnitedStatesandCanada (Meddens,Hicke,&Ferguson,2012).Dueto itseconomicimpact, there isan impressiveamountofscientific informationonMPB, and it has been established that active dispersal processesat large and small spatial scales play a central role in populationoutbreakdynamics(Logan,White,Bentz,&Powell,1998;Powell&Bentz,2014).
Unlike many phytophagous insects, successful MPB reproduc-tionusuallyresultsindeathofallorpartofthehost.Hosttreeshaveevolvedvaryingchemicalandresinresponsesthatreducevulnerabil-itytoattackbybarkbeetlesandtheirfungalandbacterialassociates(Booneetal.,2013;Kane&Kolb,2010;Raffa,Powell,&Townsend,2012).Vigorous,well-defendedtreesrequirerapidattackandcoloni-zationbyalargenumberofbeetles(i.e.amassattack)tooutpacetreeresponses(Berryman,Dennis,Raffa,&Stenseth,1985), leadingtoastrongAlleeeffectforthebeetles.Conversely,treesstressedbybioticandabioticagentshavea reducedcapacity fordefenceandcanbeovercomebylownumbersofbeetles(Raffa,Aukema,Erbilgin,Klepzig,&Wallin,2005;Safranyik&Carroll,2006).Thebetterdefended,morevigorous trees tend tobe larger andhavehighernutritional qualitythereby leading toapositive feedbackasbeetlepopulationdensityincreases (Boone,Aukema,Bohlmann,Carroll,&Raffa, 2011;Raffaetal.,2008).
EpidemicMPBpopulationdynamicsarewell-describedbyphenol-ogy,host-dependentdispersalandtheAlleeeffect (Powell&Bentz,2009,2014).Beetlesemergedailyfrompreviouslyinfestedhostsanddisperse with motility decreasing exponentially with host density.Where the dispersed population exceeds the Allee threshold newhosts are successfully colonized. Powell and Bentz (2014) showedthatthiscombinationofmechanismsdescribes85%oftheobservedspatialpatternofbeetle-killedtreesonkilometrescales.Interestingly,wherethePowellandBentz(2014)modelmissedpredictingobservedimpacts(approximately8%ofthelandscape),thetypeofimpactwassmall,isolatedspots.Thesespotsrepresentatrivialportionofagivenyear'sMPBfootprintduringanepidemic,buttheevolvingpatterninsubsequentyearsdependsstronglyonthedensityandspatiallocationofspotsacrossthelandscape.
Regardless of whether satellite spots are caused by beetlesdispersingfromthemainbodyofanoutbreak,spot initiationandgrowthdependsonMPBmovement,conditionedbyhosttreeavail-abilityandsize,MPBpopulationsize,weatherandbehaviour-mod-ifying chemicals (Mitchell & Preisler, 1991; Safranyik, Linton,
| 3Journal of Animal EcologyPOWELL Et aL.
Silversides,&McMullen,1992).Hostkairomonesplayasignificantrolebysignallingtreesthatareunderstresscausedbybioticandabioticfactors(Chapman,Veblen,&Schoennagel,2012;Goheen&Hansen,1993).Atlowerbeetledensities,afteraweakenedtreeisfound, aggregation is facilitatedbypheromones,which throughasynergistic reactionwith host defensive compounds attract addi-tionalbeetles(Raffaetal.,2005),resultinginmassattacksonasin-gletree.Followingaggregationtooneorseveralweakenedtrees,thenumberofadultbeetlesnecessarytoovercometheAlleeeffectonmorevigorouslydefendedhosttreesbecomeavailableandat-tackingbeetlesswitchtonearbytrees,creatingaspotwithonetoseveralkilledhosts.Wehypothesizethatspotcreationisnotindis-criminate,butinsteadthatthespatialdistributionofMPBspotsaretheresultofdispersersleavingtheperimeterofpreviouslyaffectedareas,spreadingdifferentiallyduetohost-dependentmotilityandaggregating locallytomassattacktrees.Furthermore,wesuggestthat thespatialdistributionofspots reflects landscaperesistancetobeetlemovement.
MPB are not likely to disperse to distant focus trees if accept-ablehostsareencounteredfirst.PowellandBentz(2014)calibratedamodelofMPBmovementbasedonhosttreedensity-derivedbee-tlemotilitywherein resistance to beetlemovement increases expo-nentially with host tree density. Assuming that potential spot fociarerandomlydistributedpercapitaamonghosts,wearguethat thedistributionofspotsshouldfollowapower-lawdistributionintraveltime along landscape paths of least resistance frombeetle sources.Thepowerlaw,inwhichspatialprobabilityofspotoccurrenceispro-portionaltoanegativepoweroftraveltime,arisesbecauseincreasingencounter rates forweakened focal trees correlatewith decreasingmotilityashostdensitiesincrease.Moreover,becausetheperimeterofpreviouslyinfestedareaswouldbetheprimarysourceofdispersers,wehypothesizethattheyearlynumberofnewspotsshouldscalewithperimetersize.
Wetest thesehypothesesusingaerial surveysofMPB-causedtreemortality and host tree density data for three study areas inIdaho, Washington and Colorado. Annual occurrence of isolatedspotswere identified and travel time between each spot and thenearest contiguous area ofMPB-killed trees that could provide abeetlesourcewas recorded.Thedistributionofobservedspots intraveltimewasdetermined,andthenumberofspotscomparedwiththeperimetersizeofpreviouslyinfestedareas.Analternatehypoth-esis,thatspotsoccurasrandomeruptionsofanendemicbeetlepop-ulation,wasalsoexamined.Theobservednumberofspotseachyearwereseededspatiallyatrandomandtestedforpossiblepower-lawbehaviour.We found that thepower-lawhypothesiswas stronglysupportedacrossmanyyearsofobservations,while randomerup-tionwashighlyimprobable.Yearlyspotnumbersscalewitharoughmeasure of the size of the perimeter of previous infested areas,supportingthecontentionthatbeetlesdispersefromtheedgesofmajor infestations to invade new areasvia spots.Accelerating in-vasionratesareoneconsequenceofpower-lawdispersal,whichisconsistentwithobservationsofMPB'sexplosivespreadinwesternNorthAmerica.
2 | MATERIALS AND METHODS
2.1 | Study areas
2.1.1 | Sawtooth study area
TheSawtoothstudyarea incentral Idaho (Figure1) isa rectangularregion fromapproximately44◦22′N to43◦44′N (∼60km) and115◦
10′Wto114◦28′W(∼30km),comprisingover180,000ha,includingtheSawtoothNationalRecreationArea.Asinglehost,lodgepolepine,predominatesfrom1,650to2,000mandgrowsinstandswithrela-tivelyhomogeneousdemographicsatthelowestelevations.Theland-scape is characterizedby a valley and surroundingmountains,withelevationsfrom1,650to3,600m.Vegetationtypesrangefromshrubandgrasslandstoconiferousforestswithlodgepolepine,Douglasfir(Pseudotsuga menziesii (Mirb.) Franco), subalpine fir (Abies lasiocarpa [Hook.]Nutt),andwhitebarkpine(P. albicaulisEngelm.)athigheral-titudes.Densitiesofpineaverage450trees/ha,althoughthevalleyincludesmanydensestandsof1,000trees/haaswellasmeadowsandpasturelandwithnohosts.Extensivebarrenareasexistabovetree-lineatthehighestelevations.Between1995and2005,aMPBout-breakoccurredthroughouttheSawtoothstudyarea,impactingmorethanathirdofthepinehosttype(Pfeifer,Hicke,&Meddens,2011).
2.1.2 | Chelan study area
TheChelanstudyareainnorthernWashington(Figure1)encompasses446,000ha, fromapproximately47◦56′N to48◦35′Nand from119◦
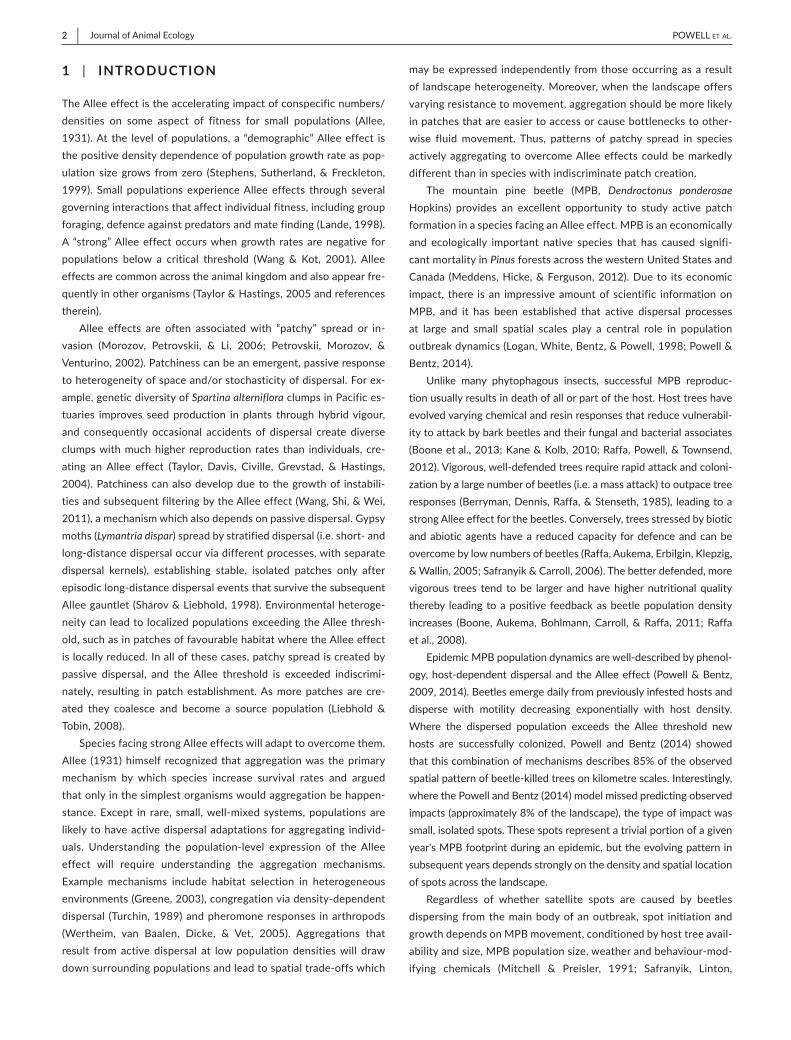
F IGURE 1 Studyareasusedinthispaper.Allstudyareashadatleast10yearsofcontinuousaerialdetectionsurveyformountainpinebeetleimpact.Anoutbreakoccurredbetween1995and2005intheSawtoothandbetween2001and2010inColorado.IntheChelanstudyarea,multi-modalimpactoccurredover20years,peakingin2008
WA
ID
CO
Sawtoothstudy area
Coloradostudy area
Chelanstudy area
CA
MT
AZ
NV
NM
OR
UT
TX
WY
ND
SD
NE
KS
0 250 500 km
4 | Journal of Animal Ecology POWELL Et aL.
52′W to120◦44′W.Elevations range from336mat LakeChelan topeaks at 2,700m. The study area is comprisedof public andprivatelands, including portions of the Methow Valley and Chelan RangerDistricts,Okanagan-WenatcheeNational Forest andNorthCascadesNational Park. TheMethowRiver drainage characterizes the easternhalf of the study area. Coniferous vegetation within the study areaincludeponderosapine(P. ponderosa),lodgepolepine,whitebarkpine,Englemannspruce(Picea englemanniiParry)andDouglasfir,withhostpinetreesaveraging500trees/ha.TheChelanstudyareaboundarywaschosentoencompasspinevegetationsusceptibletoMPB infestationandactiveMPBpatchesbasedongroundsurveys.MPBimpactbeganinthelate1990sandpeakedin2008(Crabb,Powell,&Bentz,2012).
2.1.3 | Colorado study area
The Colorado study area contains over 4,380,000ha in northernColorado, including Rocky Mountain National Park, North Park andseveralofColorado'shighestpeaks (Figure1). Elevations range from1,700mon theFrontRangewestofFortCollins toover4,300matLongsPeak.ThestudyareabeginsroughlyatInterstate70inthesouthand reaches in the north to approximately 41◦50′N (into southernWyoming),intheeastto105◦0′W,andinthewestto108◦0′W,encom-passing portions of theMedicineBow-Routt andArapaho-RooseveltNationalForests.ThesouthernboundaryalongtherouteofI-70waschosen as a natural break inMPB impacts, andwestern boundarieswere chosen to encompass impacted regions as far to the west asGlenwoodSprings.Conifersincludelodgepoleandlimberpines(P. flexi-lis),Engelmannspruce,subalpinefirandDouglasfir,andaveragepinehostdensitiesare780trees/haacrossthearea.SignificantMPBimpactbeganintheearly2000sandpeakedin2007(Crabbetal.,2012).
2.2 | Data sources
2.2.1 | Pine density data
Spatiallyexplicitdatasetsofpinedensityat30-mresolutionwerede-rivedforthestudyareasusingexistinggeospatialdatasetsofvegeta-tioncompositionandstructure.Briefly,fortheSawtoothandColoradostudyareasforestdensity(treesperhectare>2.54cmDBH)at250-mresolution,developedbytheUSDAForestServiceFIA(Blackardetal.,2008),weredownscaledto30-mresolutionusingdatafromtheinter-agency Landscape Fire and Resource Management Planning ToolsProject(LANDFIRE).DatafromtheGNNFireproject(LEMMA,2005;Pierce,Ohmann,Wimberly,Gregory,&Fried,2009)wereusedtode-rivepinedensitymatricesofpotentialpinehostsfortheChelanstudyareaat30-mresolutions.MethodsforallstudyareasaredescribedindetailbyCrabbetal.(2012).
2.2.2 | Aerial detection survey data
Geo-referenced data describing the annual number of MPB-killedtreeswereobtainedforallthreestudyareasbeginningin1991fortheSawtooth, 1980 forChelan and2001 fornorthernColorado (USDA
Forest Service, http://www.foresthealth.info/portal). The aerial de-tectionsurveys(ADS)areconductedinfixed-wingaircraftbytrainedobserverswhomanuallyrecordnumbersofkilledtreesbasedonthecolouroftreefoliage(Halsey,1998).Foliageofdead,beetle-killedtreeschangesfromgreentoredwithinasingleyear,andinsubsequentyearsthefoliageturnsgreyandneedlesarelost.ADSdatasetsincludepoly-gonshapefileswithmetadatadescribingtheestimatednumberoftreesperacreaffectedandacodeforthedamagecausalagent(s).PolygonsdepictingMPBimpactwerequeriedusingtheiruniquecode.RastersoftotalMPBimpactbyyearwerecreatedbysummingMPBimpactsacrossallpinehosttypesforeachpolygonthenconvertingto30-mrasters.Forpurposesof this study, rasterswereconverted toeitheroneorzerotoindicatewhetherornotMPBinfestationwasobservedinapixelonagivenyear.RasterswerekeptinthecoordinatesystemoftheADSshapefiles,NorthAmericanDatum1983Albers,andothergeospatialrasterdatausedinthisstudywereconvertedtothisprojec-tionat30-mresolutionusingArcGIS9.3software(ESRI,2008).
2.2.3 | Diagnosing isolated spots
We defined a spot as a single 30-m pixel withMPB impact, sur-roundedbypixelswithno impact.LetADSn
i,j indicatethepresence
(1)orabsence(0)ofMPBimpactinapixelinrowi, column joftheADSrasterforyearn.Todeterminethelocationofapotentialiso-latedspot,weappliedadiscretesecondderivativetest,recordingallpositionsbelow50%ofthemaximumsecondderivativefortheyear,
whereΔx is thepixelwidth (30m).Theminussign isusedbecausespotsarelocalmaximawithlargenegativeconcavity.Eachpotentialspotwasthenscreenedtotestwhethertheeightsurroundingpixelswere impact-free (guaranteeing it to be separated from contiguousregionsof impact).The listofverifiedspot locations inayearwererecordedforfurtheranalysis.
2.3 | Determining travel times to spots from previously infested areas
2.3.1 | Resistance to movement, motility and pixel residence time
Theecologicaldiffusionmodel(Turchin,1998)describesthepopula-tion-level distribution,P(x,y,t), that emerges from individual randomwalkswithmovementprobabilitiesbasedonlocalhabitatinformation:
(Okubo&Levin,2001;Patlak,1953).Theindividualmovementprob-abilityat anypoint in space isproportional to the “motility” at thatpoint,μ(x,y),resultinginvariablepatchresidencetimeswhicharein-versely proportional to μ. In a homogeneous environment, motility
ΔADSn
i,j
def=
1
Δx2
(ADS
n
i+1,j+ ADS
n
i−1,j+ ADS
n
i,j+1+ ADS
n
i,j−1− 4ADS
n
i,j
)
≤−1
2maxi,j
|||ΔADS
n
i,j
|||,
∂P
∂t=
(∂2
∂x2+
∂2
∂y2
)[μ(x, y)P
]
| 5Journal of Animal EcologyPOWELL Et aL.
isthesameasthediffusionconstantandhasunitsofareapertime.In variable environments, ecological diffusion is verydifferent fromstandard(“Fickian”)diffusion,inwhichthediffusionconstantisinter-mingledwithderivatives
(e.g. ∂
∂x(D(x) ∂
P
∂x
) inonedimension). Ineco-
logicaldiffusion,allspatialderivativesapplytotheproductofmotilityandpopulationdensity(μ(x, y)P),supporting“weak”solutionswithdis-continuitieswherehabitattypeschangeandlong-termsolutionswithdensities inverselyproportional tomotility leadingtoaggregation infavourable(highresidencetime)habitat.Intuitively,themathematicaljustificationforecologicaldiffusion is that thediffusionprocessap-pliesonlytothoseindividualschoosingtoleaveapatch(thenumberofwhichisproportionaltoμP,theproductofmovementprobabilityandthedensityavailabletodepart).Thus,theLaplacian, ∂
2
∂x2+ ∂
2
∂y2,ap-
pliesonly to themovingpopulation,μP.Moremathematical detailsaboutthedifferencesbetweenecologicalandFickiandiffusion,andtheconsequencesforlarge-scalepopulationmovement,canbefoundinGarlick,Powell,Hooten,andMcFarlane(2011).
Motilityinapatchisinverselyrelatedtomeanresidencetimesforindividuals in thepatch (Turchin,1998); inapixelwithareaΔx2 theexpectedresidencetimeofindividualsis
ForMPB,PowellandBentz(2014)showedthatbeetlepopulationshavemotilityfollowinganegativeexponentialwithhostdensity,
where Si,j is the density of hosts in pixel i,j, scaled in thousands ofhostsperhectare,μ0 is themaximummotility (3.79km
2/day) in theabsenceofhosts,andμ1 = −10.9 is therelativerateofmotilityde-cline with host density. This model for motility reflects the timespent by beetles searching an increasingly complex environmentfor chemical plumes and potentially susceptible hosts. The param-eter μ̂1 =
μ1+ln (μ0)
1000= 1.3472×10⁻³ is introduced for convenience.
Converting tominutesduringa10-hr flightday, thismodel gives ameanresidencetimeof64minina30-mpixelcontainingadensityof500hosts/ha.Residencetimeinapixelwithnotreesis8.5s(corre-spondingtoanaveragespeedof3.5m/sforMPBcrossingunforestedpixels).Thisvariability inresidencetimescausesbeetlestodisperserapidly through areas with few hosts and aggregate in areas withhigherhostdensity.
2.3.2 | Minimum travel time for attacking MPB
If a beetle follows a path passing throughK pixels,{(ik, jk)}Kk=1, theexpectedtraveltimeis
Pathsfollowedbybeetleswhenparticipatinginaspotattackcannotbeknownapriori.However,beetlesaremorelikelytobesuccessfulatovercominghostdefencesinlocationswheretraveltimestobeetle
sourcesare shorter.We thereforehypothesize thatobservedspotswillbestructuredaccordingtominimaltraveltimesfromthenearestbeetlesources.
Theminimumtraveltimetoapointinalandscape,T,satisfiestheeikonalequation,
whichconnectsminimumtraveltimes(T)andresidencetimesthroughthe gradient vector, (Tx,Ty) = ∇T (subscripts indicate partial deriva-tives).InEquation(1),thetemporalcostofmovementfromonepixeltothenext (i.e. therateofchangeoftravel time) isproportional tohowlongbeetlesspendinthespacebetween(i.e.theresidencetime).Theeikonalequation isdifficult tosolveanalytically,butcanbeef-ficiently solved numerically using the fast sweepingmethod (Zhao,2004). This approach iterates to a solution in a pixel by examiningneighbourstodeterminewhichhasthelowesttraveltime,thenup-datingprojected travel timebyadding thecurrentpixel's residencetimetotheminimumamongnearestneighbours.
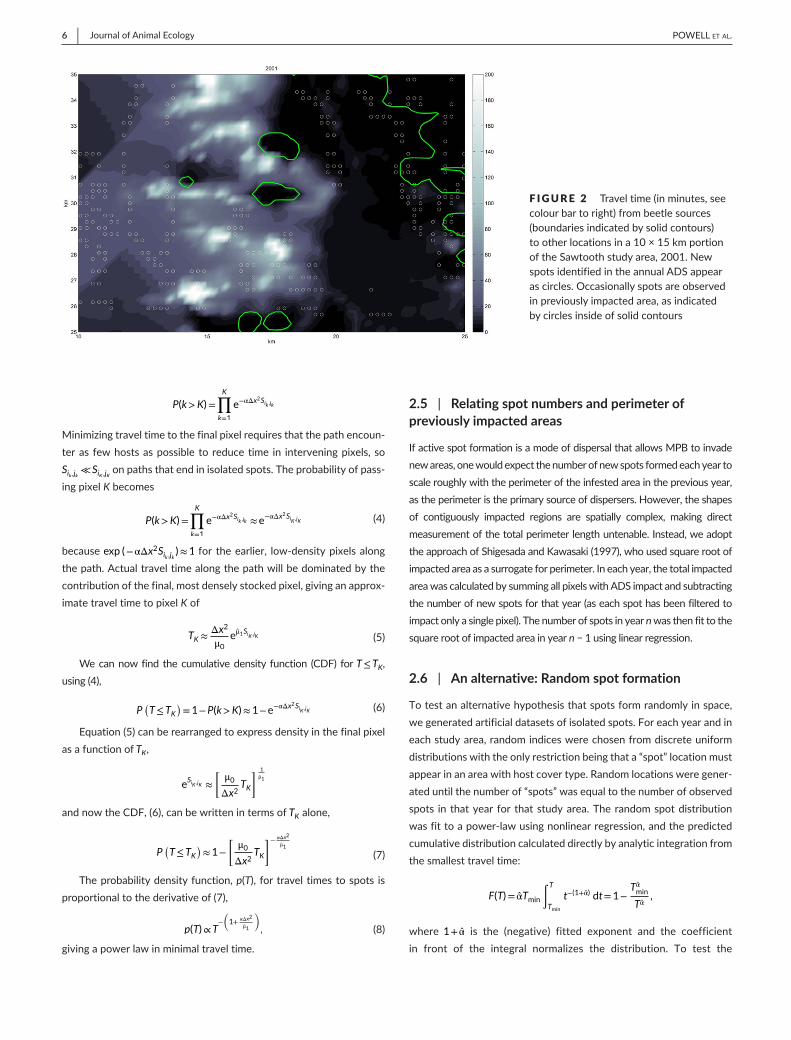
BecausebeetlescomefromtreesinfestedinthepreviousyearweuseADSdatainyearn−1tosetTi,j = 0 inpixelswithsourcepopu-lationsofbeetles.ThefastsweepingmethodthengeneratesminimaltraveltimesfromtheperimeterofobservedADSimpact inthepre-viousyeartoallotherpointsonthelandscape,conditionedbyinter-veninghostdensitywhichaltersmotilityinpixelsbetweenspotsandthenearestsources(1).Ineveryyear,thetraveltimemapisdifferentbecausethelocationofsourcepopulationschanges.Figure2depictsprojected travel times for a portionof the Sawtooth study area for2001.
Observed travel times at spot locations were recorded yearly,using that year's spatial pattern of travel times resulting from hostdensitiesandADSimpactfromthepreviousyear.Acrossallyearsineachstudyarea(8intheSawtooth,10inColoradoand20inChelan),ahistogramofobservedtraveltimetospotswascreated.Thenumberofbinswaschosensothatthebincorrespondingtothelargesttraveltimesheldat leastonepercentofthetotalnumberofobservations.Thebincontainingzerotraveltimewasignored(asapeculiarityoftheADSdataisthatisolatedspotsaresometimesobservedinsidepoly-gons indicatingcontiguous impact inthepreviousyear,seeFigure2foranexample).Ineachcase,apower-lawcurvewasfittothebinnedobservations using nonlinearmaximum likelihood on the arithmeticscaleandassumingnormaldistributionoferrors.
2.4 | Predicted distribution of spots
We assume that spotswhere beetles have overcome theAllee ef-fect are most likely at foci located with minimal travel time fromsourcepopulations.ConsiderabeetlepathpassingthroughKpixels,{(ik, jk)}
K
k=1.Ifpotentialfociarerandomlydistributedamonghosts,the
probabilityofpassingthroughpixelk and notencounteringaweak-enedfocustreeisexp [−αΔx2Sik ,jk ],whereαisthepercapitaencoun-terrateforweakenedtrees.TheprobabilityofpassingpixelKonthepathistherefore
ΔT =Δx2
μ.
(1)μ = μ0 exp
[
−(μ1+ ln (μ0)
) Si,j
1,000
]
= μ0 exp[−μ̂1Si,j
],
(2)K∑
k=1
Δx2
μ0eμ̂1Sik , jk .
(3)‖∇T‖ =
�T2x+T2
y=
Δx
μ0eμ̂1S,
6 | Journal of Animal Ecology POWELL Et aL.
Minimizingtraveltimetothefinalpixelrequiresthatthepathencoun-terasfewhostsaspossibletoreducetime in interveningpixels,soSik ,jk ≪SiK ,jKonpathsthatendinisolatedspots.Theprobabilityofpass-ingpixelKbecomes
becauseexp (−αΔx2Sik ,jk )≈1 for theearlier, low-densitypixelsalongthepath.Actualtraveltimealongthepathwillbedominatedbythecontributionofthefinal,mostdenselystockedpixel,givinganapprox-imatetraveltimetopixelKof
Wecannowfind thecumulativedensity function (CDF) forT≤TK, using(4),
Equation(5)canberearrangedtoexpressdensityinthefinalpixelasafunctionofTK,
andnowtheCDF,(6),canbewrittenintermsofTK alone,
Theprobabilitydensityfunction,p(T), fortraveltimestospots isproportionaltothederivativeof(7),
givingapowerlawinminimaltraveltime.
2.5 | Relating spot numbers and perimeter of previously impacted areas
IfactivespotformationisamodeofdispersalthatallowsMPBtoinvadenewareas,onewouldexpectthenumberofnewspotsformedeachyeartoscaleroughlywiththeperimeteroftheinfestedareainthepreviousyear,astheperimeteristheprimarysourceofdispersers.However,theshapesof contiguously impacted regions are spatially complex, making directmeasurementofthetotalperimeterlengthuntenable.Instead,weadopttheapproachofShigesadaandKawasaki(1997),whousedsquarerootofimpactedareaasasurrogateforperimeter.Ineachyear,thetotalimpactedareawascalculatedbysummingallpixelswithADSimpactandsubtractingthenumberofnewspotsforthatyear(aseachspothasbeenfilteredtoimpactonlyasinglepixel).Thenumberofspotsinyearnwasthenfittothesquarerootofimpactedareainyearn−1usinglinearregression.
2.6 | An alternative: Random spot formation
Totestanalternativehypothesisthatspotsformrandomlyinspace,wegeneratedartificialdatasetsofisolatedspots.Foreachyearandineachstudyarea,randomindiceswerechosenfromdiscreteuniformdistributionswiththeonlyrestrictionbeingthata“spot”locationmustappearinanareawithhostcovertype.Randomlocationsweregener-ateduntilthenumberof“spots”wasequaltothenumberofobservedspots inthatyearforthatstudyarea.Therandomspotdistributionwasfittoapower-lawusingnonlinearregression,andthepredictedcumulativedistributioncalculateddirectlybyanalyticintegrationfromthesmallesttraveltime:
where1+α̂ is the (negative) fitted exponent and the coefficientin front of the integral normalizes the distribution. To test the
P(k>K)=
K∏
k=1
e−αΔx2Sik ,jk
(4)P(k>K)=
K∏
k=1
e−αΔx2Sik ,jk ≈e
−αΔx2SiK,jK
(5)TK≈Δx2
μ0eμ̂1Si
K,jK
(6)P(T≤TK
)=1−P(k>K)≈1−e
−αΔx2SiK,jK
eSiK,jK ≈
[μ0
Δx2TK
] 1
μ̂1
(7)P(T≤TK
)≈1−
[μ0
Δx2TK
]− αΔx2
μ̂1
(8)p(T)∝T−
(
1+αΔx2
μ̂1
)
,
F(T)=α̂Tmin∫
T
Tmin
t−(1+α̂) dt=1−Tα̂min
Tα̂,
F IGURE 2 Traveltime(inminutes,seecolourbartoright)frombeetlesources(boundariesindicatedbysolidcontours)tootherlocationsina10×15kmportionoftheSawtoothstudyarea,2001.NewspotsidentifiedintheannualADSappearascircles.Occasionallyspotsareobservedinpreviouslyimpactedarea,asindicatedbycirclesinsideofsolidcontours
| 7Journal of Animal EcologyPOWELL Et aL.
hypothesisthatthedatawereactuallygeneratedbyapower-lawdis-tribution“spots”werebinnedaccordingtotraveltimefrompreviousyear's impactedareaandgoodnessof fit testedusingCramér-vonMises’ A2 (as recommended by Choulakian, Lockhart, & Stephens,1994). The statistic tests the correspondence between observedandpredicted cumulative distributions, and is defined for discreteobservations:
whereNisthenumberofspots,kisthenumberofbins,andifej and ojarethenumberofexpectedandobservedspotsinbinj,thenpj=
ej
N
and
(Choulakianetal.,1994).CalculatedA2werecomparedwithtabulatedcritical values,A2
crit, usingdegreesof freedomcorresponding to the
numberofbins (k) +number fittedparameters (2)−1 todeterminewhetherthenullhypothesis(randomspotsfollowapower-lawdistri-bution)canberejectedwith90%confidence.
3 | RESULTS
3.1 | Spot distributions and relation to perimeter size of previous year infestations
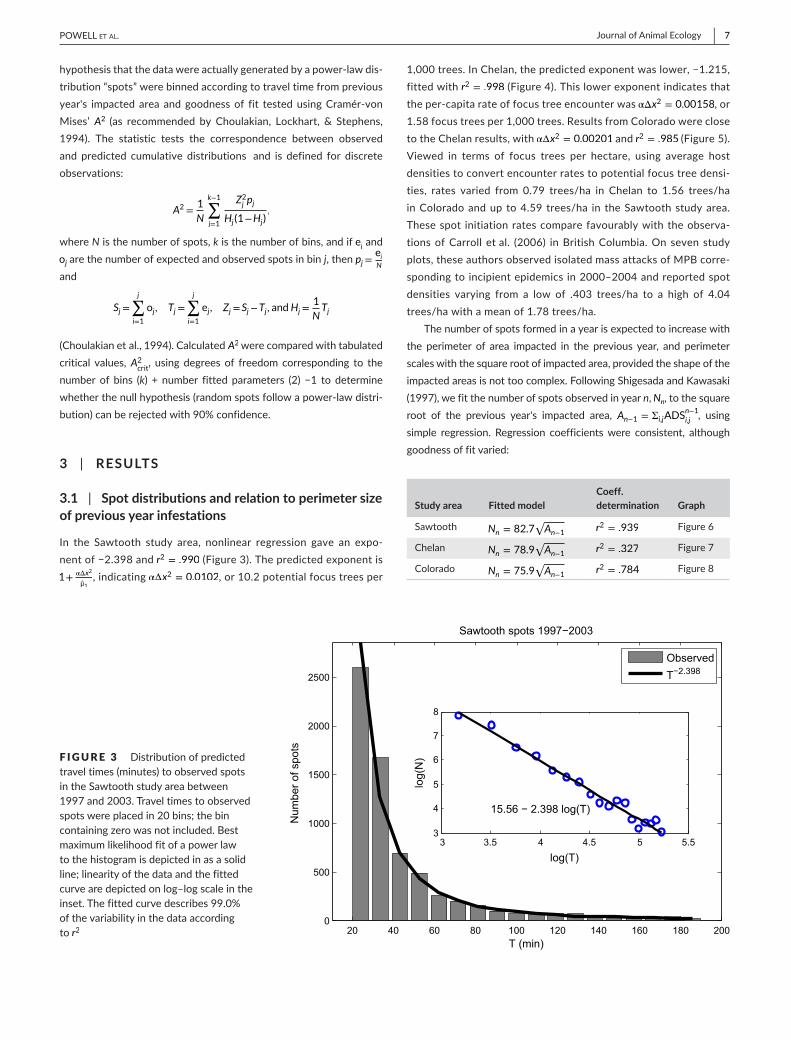
In the Sawtooth study area, nonlinear regression gave an expo-nentof−2.398andr2 = .990(Figure3).Thepredictedexponentis1+
αΔx2
μ̂1,indicatingαΔx2 = 0.0102,or10.2potentialfocustreesper
1,000trees.InChelan,thepredictedexponentwaslower,−1.215,fittedwithr2 = .998(Figure4).Thislowerexponentindicatesthattheper-capitarateoffocustreeencounterwasαΔx2 = 0.00158, or 1.58focustreesper1,000trees.ResultsfromColoradowereclosetotheChelanresults,withαΔx2 = 0.00201 and r2 = .985(Figure5).Viewed in terms of focus trees per hectare, using average hostdensitiestoconvertencounterratestopotentialfocustreedensi-ties, rates varied from 0.79 trees/ha in Chelan to 1.56 trees/hainColoradoandupto4.59trees/ha in theSawtoothstudyarea.Thesespot initiationratescomparefavourablywiththeobserva-tionsofCarroll etal. (2006) inBritishColumbia.Onsevenstudyplots,theseauthorsobservedisolatedmassattacksofMPBcorre-spondingtoincipientepidemicsin2000–2004andreportedspotdensities varying from a low of .403 trees/ha to a high of 4.04trees/hawithameanof1.78trees/ha.
Thenumberofspotsformedinayearisexpectedtoincreasewiththe perimeter of area impacted in the previousyear, and perimeterscaleswiththesquarerootofimpactedarea,providedtheshapeoftheimpactedareasisnottoocomplex.FollowingShigesadaandKawasaki(1997),wefitthenumberofspotsobservedinyearn, Nn,tothesquareroot of the previous year's impacted area, An−1 = Σi,jADS
n−1
i,j, using
simple regression. Regression coefficientswere consistent, althoughgoodnessoffitvaried:
A2=1
N
k−1∑
j=1
Z2jpj
Hj(1−Hj),
Sj=
j∑
i=1
oj, Tj=
j∑
i=1
ej, Zj=Sj−Tj, andHj=1
NTj
F IGURE 3 Distributionofpredictedtraveltimes(minutes)toobservedspotsintheSawtoothstudyareabetween1997and2003.Traveltimestoobservedspotswereplacedin20bins;thebincontainingzerowasnotincluded.Bestmaximumlikelihoodfitofapowerlawtothehistogramisdepictedinasasolidline;linearityofthedataandthefittedcurvearedepictedonlog–logscaleintheinset.Thefittedcurvedescribes99.0%ofthevariabilityinthedataaccordingtor2 20 40 60 80 100 120 140 160 180 200
0
500
1000
1500
2000
2500
T (min)
Num
ber o
f spo
ts
Sawtooth spots 1997−2003
ObservedT−2.398
3 3.5 4 4.5 5 5.53
4
5
6
7
8
log(T)
log(
N)
15.56 − 2.398 log(T)
Study area Fitted modelCoeff. determination Graph
Sawtooth Nn = 82.7√An−1
r2 = .939 Figure6
Chelan Nn = 78.9√An−1
r2 = .327 Figure7
Colorado Nn = 75.9√An−1
r2 = .784 Figure8

8 | Journal of Animal Ecology POWELL Et aL.
ThefittedcurvesaredisplayedintermsofimpactedareaandyearofimpactinFigures6–8.Asexpected,thenumberofspotsincreaseswith the sizeof themain infestation and in particularwith a roughmeasureofinfestationperimeter,withbetween75and83spotsgen-eratedperkilometreofperimeter.Thissupportstheideathatbeetlescreatingisolatedspotstravelfromtheperimeterofmajorinfestationsinthesurroundinglandscape.
3.2 | Random seeding of spots
To illustrate the differences between random formation of spotsand the power-law distribution of spots,we seeded forested areaswithartificial“spots”whoselocationswereselectedfromauniform
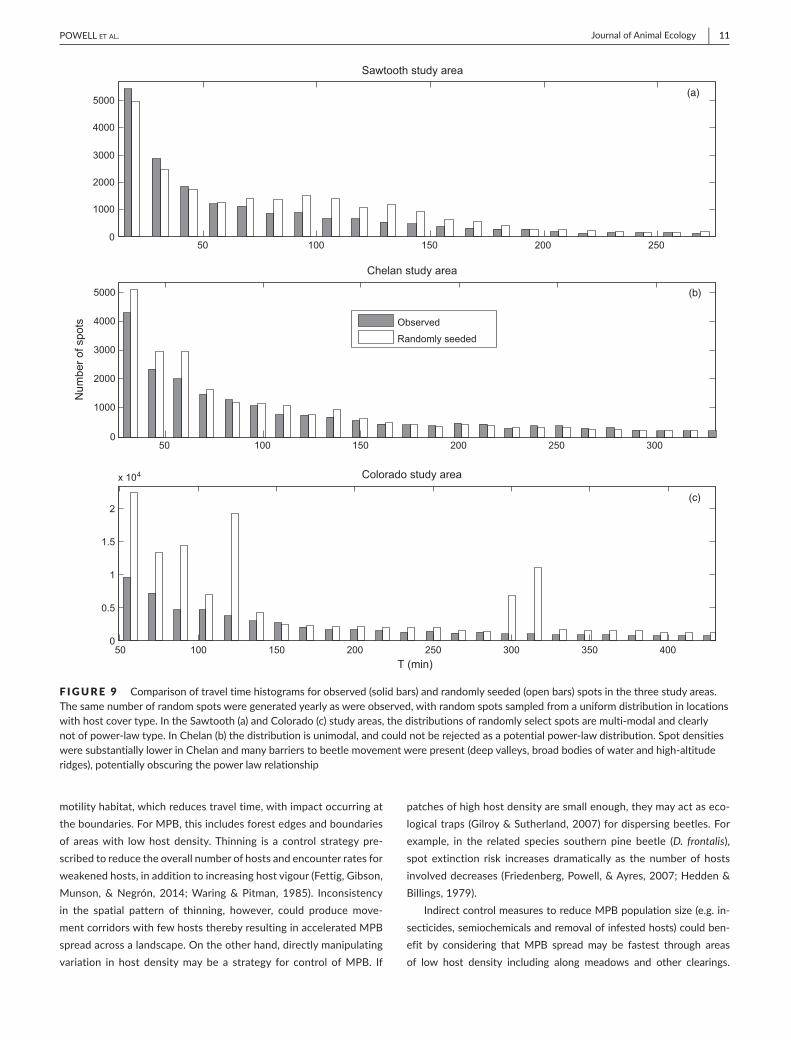
distributionover areaswithhost cover type. In each study area, ineach year as many random “spots” were generated as were actu-ally observed in that year, and the spot numbers binned accordingtotheyear'straveltimemapinthesamewayastheobservedspots(Figure9).TheCramér-vonMisesA2statisticwascalculatedforeachstudyarea.
F IGURE 4 Distributionofpredictedtraveltimes(minutes)toobservedspotsintheChelanstudyareabetween1990and2009.Traveltimestoobservedspotswereplacedin22bins;thebincontainingzerowasnotincluded.Bestmaximumlikelihoodfitofapowerlawtothehistogramisdepictedasasolidline;linearityofthedataandthefittedcurvearedepictedonlog–logscaleintheinset.Thefittedcurvedescribes99.8%ofthevariabilityinthedataaccordingtor2 50 100 150 200 250 300 350 400 450
0
1000
2000
3000
4000
5000
6000
7000
8000
9000
10000
T (min)
Num
ber o
f spo
tsChelan spots 1990−2009
ObservedT−1.215
2 3 4 5 6 74
5
6
7
8
9
10
log(T)
log(
N)
12.34 − 1.215 log(T)
F IGURE 5 Distributionofpredictedtraveltimes(minutes)toobservedspotsintheColoradostudyareabetween2002and2010.Traveltimestoobservedspotswereplacedin25bins;thebincontainingzerowasnotincluded.Bestmaximumlikelihoodfitofapowerlawtothehistogramisdepictedasasolidline;linearityofthedataandthefittedcurvearedepictedonlog–logscaleintheinset.Thefittedcurvedescribes98.5%ofthevariabilityinthedataaccordingtor2 0 50 100 150 200 250 300 350 400 450
0
0.5
1
1.5
2
2.5
x 104
T (min)
Num
ber o
f spo
ts
Colorado spots 2001−2010
ObservedT−1.291
3 3.5 4 4.5 5 5.5 6 6.56
7
8
9
10
11
log(T)
log(
N)
14.15 − 1.291 log(T)
Study area A2 df A2
critResult
Sawtooth 63.95 20 1.834 Reject(p<.0001)
Chelan 1.842 22 1.835 Reject?(p<.1)
Colorado 73.12 25 1.837 Reject(p<.0001)
| 9Journal of Animal EcologyPOWELL Et aL.
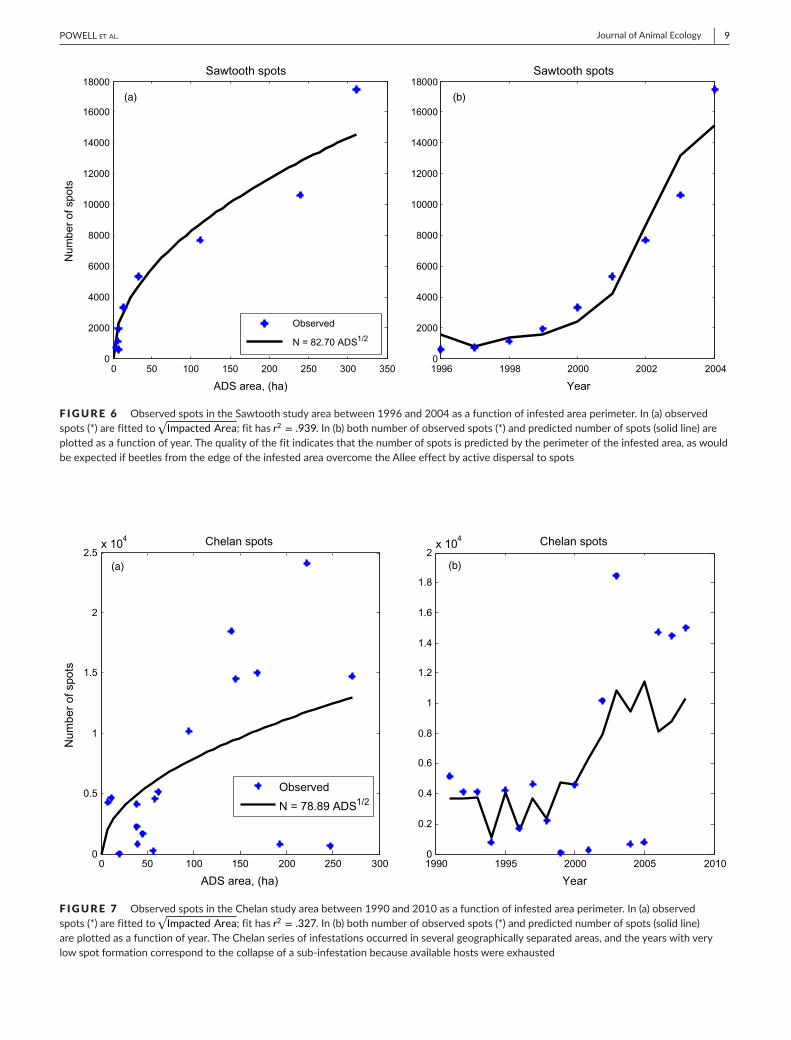
F IGURE 6 ObservedspotsintheSawtoothstudyareabetween1996and2004asafunctionofinfestedareaperimeter.In(a)observedspots(*)arefittedto
√Impacted Area;fithasr2 = .939.In(b)bothnumberofobservedspots(*)andpredictednumberofspots(solidline)are
plottedasafunctionofyear.Thequalityofthefitindicatesthatthenumberofspotsispredictedbytheperimeteroftheinfestedarea,aswouldbeexpectedifbeetlesfromtheedgeoftheinfestedareaovercometheAlleeeffectbyactivedispersaltospots
1996 1998 2000 2002 20040
2000
4000
6000
8000
10000
12000
14000
16000
18000
Year
Sawtooth spots
0 50 100 150 200 250 300 3500
2000
4000
6000
8000
10000
12000
14000
16000
18000
ADS area, (ha)
Num
ber o
f spo
tsSawtooth spots
Observed
N = 82.70 ADS1/2
(a) (b)
F IGURE 7 ObservedspotsintheChelanstudyareabetween1990and2010asafunctionofinfestedareaperimeter.In(a)observedspots(*)arefittedto
√Impacted Area;fithasr2 = .327.In(b)bothnumberofobservedspots(*)andpredictednumberofspots(solidline)
areplottedasafunctionofyear.TheChelanseriesofinfestationsoccurredinseveralgeographicallyseparatedareas,andtheyearswithverylowspotformationcorrespondtothecollapseofasub-infestationbecauseavailablehostswereexhausted
1990 1995 2000 2005 20100
0.2
0.4
0.6
0.8
1
1.2
1.4
1.6
1.8
2x 10⁴ Chelan spots
Year0 50 100 150 200 250 300
0
0.5
1
1.5
2
2.5x 10⁴
ADS area, (ha)
Num
ber o
f spo
ts
Chelan spots
ObservedN = 78.89 ADS1/2
(a) (b)
10 | Journal of Animal Ecology POWELL Et aL.
In the cases of the Sawtooth and Colorado study areas,the hypothesis that the randomly generated “spots” followeda power-law distribution in travel time from previously im-pacted areas could be rejected with a high degree of con-fidence. In the Chelan study area, the pattern of spots wasmore random.While it is not clearwhy the Chelan data did notmore closely adhere to the power-law prediction, we note thatthe area had substantially lower spot densities and stronger spatialstructuretoitshostpopulation.
4 | DISCUSSION
WehaveshownthatastrongAlleeeffect,requiringbeetleaggrega-tiontoovercomehostpinedefences,incombinationwithlandscaperesistance, inwhichmotilitydecreasesexponentiallywithhostden-sity,leadstodispersivespreadviaspotsunderapower-lawdistribu-tionoftraveltimesfromsourcepopulations.Lowdensitiesofbeetles,dispersing fromtheperimeterofprevious infestedareas,aggregateatweakened focus treeswhichnucleate isolated spots.The impactoftheAlleeeffect is thataggregationawayfrommajor infestationsdrawsdownthedispersingbeetlepopulationsothatmorespotsarepossibleatlocationswithlowertraveltime,withalgebraicallyfewerspotsinregionswithhighertraveltime.AerialsurveysofannualMPBinfestationinIdaho,WashingtonandColoradostudyareaswereana-lysedandfoundtoconformverystronglytothepower-lawprediction(r2 ≥ .985).Thealternatehypothesisthatspotsarisespontaneously,
wasnotsupportedinIdahoandColorado,however,spontaneousspotcreationcouldnotberuledoutintheWashington(Chelan)studyarea.
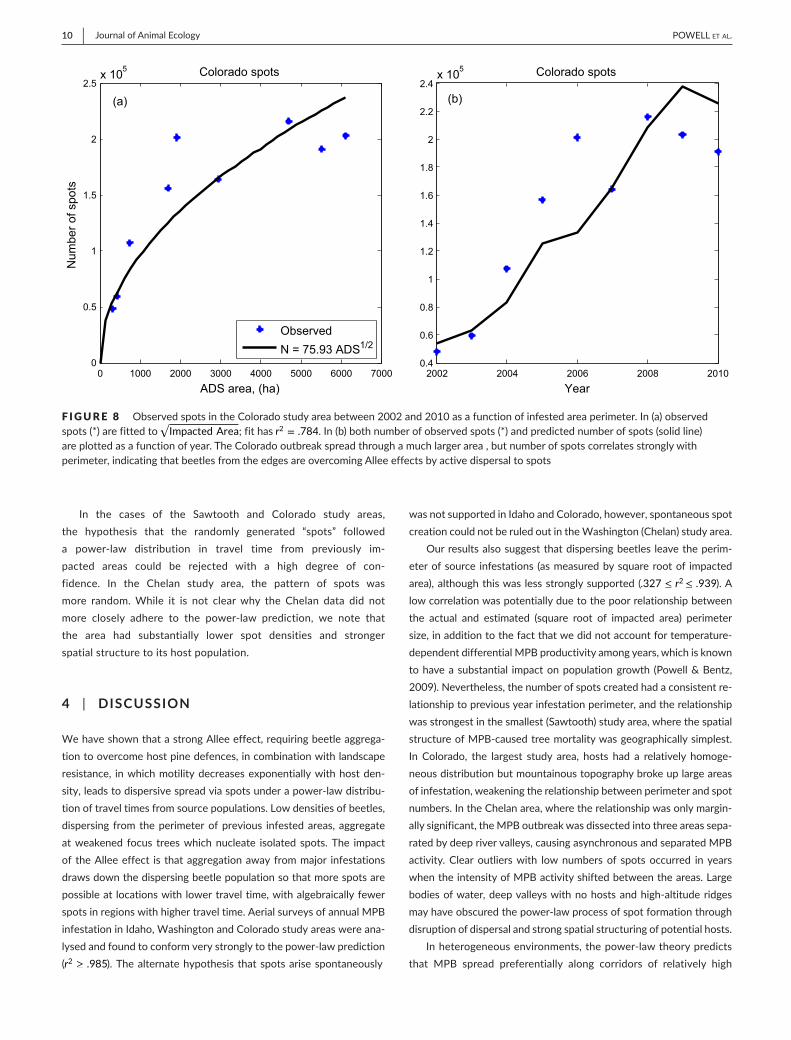
Ourresultsalsosuggestthatdispersingbeetles leavetheperim-eterofsource infestations (asmeasuredbysquarerootof impactedarea),althoughthiswas lessstronglysupported(.327 ≤ r2≤ .939).Alowcorrelationwaspotentiallyduetothepoorrelationshipbetweenthe actual and estimated (square root of impacted area) perimetersize,inadditiontothefactthatwedidnotaccountfortemperature- dependentdifferentialMPBproductivityamongyears,whichisknowntohaveasubstantial impactonpopulationgrowth (Powell&Bentz,2009).Nevertheless,thenumberofspotscreatedhadaconsistentre-lationshiptopreviousyearinfestationperimeter,andtherelationshipwasstrongestinthesmallest(Sawtooth)studyarea,wherethespatialstructureofMPB-causedtreemortalitywasgeographicallysimplest.In Colorado, the largest study area, hosts had a relatively homoge-neousdistributionbutmountainoustopographybrokeuplargeareasofinfestation,weakeningtherelationshipbetweenperimeterandspotnumbers.IntheChelanarea,wheretherelationshipwasonlymargin-allysignificant,theMPBoutbreakwasdissectedintothreeareassepa-ratedbydeeprivervalleys,causingasynchronousandseparatedMPBactivity.Clear outlierswith lownumbersof spotsoccurred inyearswhentheintensityofMPBactivityshiftedbetweentheareas.Largebodiesofwater,deepvalleyswithnohostsandhigh-altituderidgesmayhaveobscuredthepower-lawprocessofspotformationthroughdisruptionofdispersalandstrongspatialstructuringofpotentialhosts.
Inheterogeneousenvironments,thepower-lawtheorypredictsthat MPB spread preferentially along corridors of relatively high
F IGURE 8 ObservedspotsintheColoradostudyareabetween2002and2010asafunctionofinfestedareaperimeter.In(a)observedspots(*)arefittedto
√Impacted Area;fithasr2 = .784.In(b)bothnumberofobservedspots(*)andpredictednumberofspots(solidline)
areplottedasafunctionofyear.TheColoradooutbreakspreadthroughamuchlargerarea,butnumberofspotscorrelatesstronglywithperimeter,indicatingthatbeetlesfromtheedgesareovercomingAlleeeffectsbyactivedispersaltospots
2002 2004 2006 2008 20100.4
0.6
0.8
1
1.2
1.4
1.6
1.8
2
2.2
2.4x 10⁵ Colorado spots
Year0 1000 2000 3000 4000 5000 6000 7000
0
0.5
1
1.5
2
2.5x 10⁵
ADS area, (ha)
Num
ber o
f spo
tsColorado spots
ObservedN = 75.93 ADS1/2
(a) (b)
| 11Journal of Animal EcologyPOWELL Et aL.
motilityhabitat,whichreducestraveltime,withimpactoccurringattheboundaries.ForMPB,thisincludesforestedgesandboundariesof areaswith lowhost density.Thinning is a control strategypre-scribedtoreducetheoverallnumberofhostsandencounterratesforweakenedhosts,inadditiontoincreasinghostvigour(Fettig,Gibson,Munson,&Negrón, 2014;Waring&Pitman, 1985). Inconsistencyin the spatial pattern of thinning, however, could produce move-mentcorridorswithfewhoststherebyresultinginacceleratedMPBspreadacrossalandscape.Ontheotherhand,directlymanipulatingvariation in host densitymay be a strategy for control ofMPB. If
patchesofhighhostdensityaresmallenough,theymayactaseco-logicaltraps(Gilroy&Sutherland,2007)fordispersingbeetles.Forexample, in the related species southern pine beetle (D. frontalis),spot extinction risk increases dramatically as the number of hostsinvolveddecreases(Friedenberg,Powell,&Ayres,2007;Hedden&Billings,1979).
IndirectcontrolmeasurestoreduceMPBpopulationsize(e.g.in-secticides,semiochemicalsandremovalofinfestedhosts)couldben-efit by considering thatMPB spreadmay be fastest through areasof low host density including along meadows and other clearings.
F IGURE 9 Comparisonoftraveltimehistogramsforobserved(solidbars)andrandomlyseeded(openbars)spotsinthethreestudyareas.Thesamenumberofrandomspotsweregeneratedyearlyaswereobserved,withrandomspotssampledfromauniformdistributioninlocationswithhostcovertype.IntheSawtooth(a)andColorado(c)studyareas,thedistributionsofrandomlyselectspotsaremulti-modalandclearlynotofpower-lawtype.InChelan(b)thedistributionisunimodal,andcouldnotberejectedasapotentialpower-lawdistribution.SpotdensitiesweresubstantiallylowerinChelanandmanybarrierstobeetlemovementwerepresent(deepvalleys,broadbodiesofwaterandhigh-altituderidges),potentiallyobscuringthepowerlawrelationship
50 100 150 200 2500
1000
2000
3000
4000
5000
Sawtooth study area
50 100 150 200 250 3000
1000
2000
3000
4000
5000
Chelan study area
Num
ber o
f spo
ts Observed
Randomly seeded
50 100 150 200 250 300 350 4000
0.5
1
1.5
2
x 104 Colorado study area
T (min)
(a)
(c)
(b)
12 | Journal of Animal Ecology POWELL Et aL.
Consequently, controlmeasures directed along boundaries ofmini-mumtraveltimecorridorsare likelytohavedisproportionately largerewards.Usingthepower-lawmodelandestimatesofhosttreeden-sity,traveltimemapsforMPBspreadacrossalandscapecanbecalcu-lated,helpingtoprioritizetreatmentapplication.
5 | CONCLUSION
The relationshipbetweenactiveaggregation toovercometheAlleeeffectandthepatchyspreadofpopulationshasnotbeenpreviouslyconsidered.Themechanismsevaluatedhere,differentialdispersalre-flectinglandscaperesistancetomovementandactiveaggregationtoovercomeastrongAlleeeffectat lowpopulationdensities,arerea-sonablygeneral.Exponentialrepresentationsofhabitatinfluenceonresidencetimesarethemostfrequentmodelforlandscaperesistancetomovement(e.g.Hanks&Hooten,2013).AnyPoissonprocessforencountering spot nucleation conditions will generate exponentialfailureprobabilities for stopping inpixels.Asdiscussed inNewman(2005),thecombinationofsuchexponentialeffectsisacommonwayforpowerlawstoariseinnature.WehaveshownthatforMPBtheseexponential mechanisms do, in fact, combine to create power-lawdistributionsofobservablepatchyspread.
ThereisalonghistoryofconsideringtheconsequencesofAlleeeffects on the passive dispersal and spread of organisms (see re-viewsbyLiebhold&Tobin,2008;Taylor&Hastings,2005).Generallyspeaking, theAlleeeffect isexpectedtoslowdown invasions (Kot,Lewis,&denDriessche, 1996).The inertia of a strongAllee effectdiminishesspreadratesbecausesmallpopulations(belowthreshold)cannotestablishawayfromtheperimeterand“pull”thewaveofinva-sion;sourcepopulationsbehindtheperimeterofthewaveofinvasionmustgrowsufficientlyto“push”outenoughdisperserstoovercometheAlleeeffect.Putmoremathematically,theAlleeeffecttruncatesthepassivedispersal kernel so that even fat-tailed (includingpow-er-law) kernels end up with finite moments, making the effective meandispersaldistancemuchsmallerthanthekernel'smeandisper-saldistance.Thus,withpassivedispersalAlleeeffectssloworstopthe spread of invasives. Invasions thatwould otherwise acceleratebecomeconstantspeedinvasionsinthepresenceoftheAlleeeffect(Wang,Kot,&Neubert,2002); inheterogeneousenvironments,theAlleeeffectcanstopinvasionsthrough“rangepinning”(Keitt,Lewis,&Holt,2001).
Wehaveshownthatactivedispersalandspot formationduetotheAllee effect result in power-law dispersal of propagules (spots)spreading fromtheperimeterof invadedareas.This isanalogous toclassicexamplesofspeciesinvasionswithouttheAlleeeffect(Andow,Kareiva,Levin,&Okubo,1990;Shigesada&Kawasaki,1997;Skellam,1951),andwethereforeproposethatthedispersedspotsofimpact“pull”thewaveofinvasion.Aslow-exponentpower-lawkernelsmayhaveonlyonemoment,spreadratesarelimitedonlybythenumberoftimesthedispersalpatternissampled(i.e.75–83timesperkilometreofever-expandingperimeter),leadingtoacceleratinginvasions(Clark,Lewis, & Horvath, 2001) in spite of an obviousAllee effect. These
mechanismscouldhavecontributedtotherecentrapidspreadofMPBacrosswesternCanada(delaGiroday,Carroll,&Aukema,2012).
ACKNOWLEDGEMENTS
TheauthorsthankTomEdwardsandEthanWhitefor formativedis-cussionsandfeedback,aswellasthreeanonymousreviewerswhoof-feredmanyexcellentsuggestions.TheUSDAForestServiceWesternWildlandsEnvironmentalThreatAssessmentCenterprovidedsupportthrough a cooperative agreement with USU. This project was alsosupported in part by the Small Business Innovation Research (SBIR)programmeof theUSDANational Institute forFoodandAgriculture(NIFA).
AUTHORS’ CONTRIBUTIONS
B.B.andJ.P.procureddatausedinthispaper;N.F.,B.B.andJ.P.de-signedanalyses;whileM.G.andJ.P.organizedandimplementedcom-putational approaches used in the analyses;B.B. andN.F. providedecologicalbackgroundonmountainpinebeetle;andJ.P.ledthewrit-ingofthemanuscript.Allauthorscontributedcriticallytothedraftsandgavefinalapprovalforpublication.
DATA ACCESSIBILITY
DatausedinthispaperarearchivedinUtahStateUniversity'sDigitalCommons, http://digitalcommons.usu.edu/all_datasets/24/ (Powell,2017;https://doi.org/10.15142/T31C73).
REFERENCES
Allee, W. C. (1931). Co-operation among animals. American Journal of Sociology, 37, 386–398.
Andow,D.A.,Kareiva,P.M.,Levin,S.A.,&Okubo,A. (1990).Spreadofinvadingorganisms.Landscape Ecology, 4, 177–188.
Berryman,A.A.,Dennis,B.,Raffa,K.F.,&Stenseth,N.C.(1985).Evolutionof optimal group attack, with particular reference to bark beetles(Coleoptera:Scolytidae).Ecology, 11, 898–903.
Blackard,J.A.,Finco,M.V.,Helmer,E.H.,Holden,G.R.,Hoppus,M.L.,Jacobs,D.M.,...Tycio,R.P.(2008).MappingU.S.forestbiomassusingnationwideforestinventorydataandmoderateresolutioninformation.Remote Sensing of Environment, 112, 1658–1677.
Boone, C. K., Aukema, B. H., Bohlmann, J., Carroll, A. L., & Raffa, K. F.(2011). Efficacy of tree defense physiology varies with bark beetlepopulationdensity:Abasis forpositivefeedback ineruptivespecies.Canadian Journal of Forest Research, 41, 1174–1188.
Boone,C.K.,Keefover-Ring,K.,Mapes,A.C.,Adams,J.,Bohlmann,A.S.,&Raffa,K.F.(2013).Bacteriaassociatedwithatree-killinginsectre-duceconcentrationsofplantdefensecompounds.Journal of Chemical Ecology, 39, 1003–1006.
Carroll, A. L., Aukema, B. H., Raffa, K. F., Linton, D.A., Smith, G. D., &Lindgren,B. S. (2006).Mountainpinebeetleoutbreakdevelopment:The endemic-incipient epidemic transition. Canadian Forest Service, Mountain Pine Beetle Initiative Project, 1, 22.
Chapman,T.B.,Veblen,T.T.,&Schoennagel,T.(2012).Spatiotemporalpat-ternsofmountainpinebeetleactivityinthesouthernRockyMountains.Ecology, 93, 2175–2185.

| 13Journal of Animal EcologyPOWELL Et aL.
Choulakian,V.,Lockhart,R.A.,&Stephens,M.A.(1994).Cramér-vonMisesstatistics for discrete distributions.The Canadian Journal of Statistics, 22, 125–137.
Clark, J. S., Lewis, M., & Horvath, L. (2001). Invasion by extremes:Population spreadwith variation in dispersal and reproduction. The American Naturalist, 157, 537–554.
Crabb, B. A., Powell, J. A., & Bentz, B. J. (2012). Development and as-sessment of 30-m pine density maps for landscape-level modelingof mountain pine beetle dynamics. Res. Pap. RMRS-RP-96WWW (p.43).U.S.DepartmentofAgriculture,ForestService,RockyMountainResearchStation,FortCollins,CO.
delaGiroday,H.M.C.,Carroll,A.L.,&Aukema,B.H.(2012).BreachofthenorthernRockyMountaingeoclimaticbarrier:Initiationofrangeexpan-sionbythemountainpinebeetle.Journal of Biogeography, 39, 1112–1123.
ESRI. (2008). ArcGIS desktop: Release 9.3. Redlands, CA: EnvironmentalSystemsResearchInstitute.
Fettig,C.J.,Gibson,K.E.,Munson,A.S.,&Negrón,J.F. (2014).Culturalpracticesforpreventionandmitigationofmountainpinebeetleinfes-tations.Forest Science, 60, 450–463.
Friedenberg,N.A.,Powell,J.A.,&Ayres,M.P. (2007).Synchrony'sdou-bleedge:TransientdynamicsandtheAlleeeffect instagestructuredpopulations.Ecology Letters, 10, 564–573.
Garlick, M. J., Powell, J. A., Hooten, M. B., & McFarlane, L. R. (2011).Homogenizationof large-scalemovementmodels inecology.Bulletin of Mathematical Biology, 73, 2088–2108.
Gilroy,J.J.,&Sutherland,W.J.(2007).Beyondecologicaltraps:Perceptualerrorsandundervaluedresources.Trends in Ecology and Evolution, 22, 351–356.
Goheen,D.&Hansen,E.(1993).Effectsofpathogensandbarkbeetlesonforests.InT.D.Schowalter&G.M.Filip(Eds.),Beetle-pathogen inter-actions in conifer forests(pp.175–196).London,UK:AcademicPress.
Greene,C.M.(2003).HabitatselectionreducesextinctionofpopulationssubjecttoAlleeeffects.Theoretical Population Biology, 64, 1–10.
Halsey, R. (1998). Aerial detection survey metadata for the Intermountain Region 4.Ogden,UT:U.S.DepartmentofAgricultureForestService,ForestHealthProtection.
Hanks,E.M.,&Hooten,M.B.(2013).Circuittheoryandmodel-basedin-ference for landscape connectivity. Journal of the American Statistical Association, 108, 22–33.
Hedden,R.L.,&Billings,R.F.(1979).Southernpinebeetle:Factorsinflu-encing thegrowthanddeclineof summer infestations ineastTexas.Forest Science, 25, 547–556.
Kane, J.M., & Kolb,T. E. (2010). Importance of resin ducts in reducingponderosa pine mortality from bark beetle attack. Oecologia, 164, 601–609.
Keitt,T.H.,Lewis,M.A.,&Holt,R.D.(2001).Alleeeffects,invasionpinning,andspeciesborders.The American Naturalist, 157, 203–216.
Kot,M.,Lewis,M.A.,&denDriessche,P. (1996).Dispersaldataandthespreadofinvadingorganisms.Ecology, 77, 2027–2042.
Lande, R. (1998).Demographic stochasticity andAllee effect on a scalewithisotropicnoise.Oikos, 83, 353–358.
LEMMA.(2005).LEMMA:TheGNNFireproject[HomepageoftheLandscapeEcology, Modeling, Mapping & Analysis research group of the USDAForest Service Pacific Northwest Research Station and Oregon StateUniversity].[Online].Retrievedfromhttp://www.fsl.orst.edu/lemma/main. php?project=gnnfire&id=mapProducts(accessedOctober24,2010).
Liebhold,A.M.,&Tobin,P.C.(2008).Populationecologyofinsectinvasionsandtheirmanagement.Annual Review of Entomology, 53, 387–408.
Logan,J.A.,White, P., Bentz,B. J.,&Powell, J.A. (1998).Model analy-sisof spatialpatterns inmountainpinebeetleoutbreaks.Theoretical Population Biology, 53, 236–255.
Meddens,A.J.H.,Hicke,J.A.,&Ferguson,C.A. (2012).Spatiotemporalpatterns of observed bark beetle-caused tree mortality in BritishColumbia and thewesternUnitedStates.Ecological Applications, 22, 1876–1891.
Mitchell, R. G., & Preisler, H. K. (1991). Analysis of spatial patterns oflodgepolepineattackedbyoutbreakpopulationsofthemountainpinebeetle.Forest Science, 37, 1390–1408.
Morozov,A.,Petrovskii,S.,&Li,B.L.(2006).Spatiotemporalcomplexityofpatchyinvasioninapredator-preysystemwiththeAlleeeffect.Journal of Theoretical Biology, 238, 18–35.
Newman,M. E. (2005). Power laws, Pareto distributions and Zipf's law.Contemporary Physics, 46, 323–351.
Okubo,A.,&Levin,S.A.(2001).Diffusion and ecological problems: Modern perspectives(Vol.14).NewYork,NY:Springer-Verlag.
Patlak,C.S.(1953).Randomwalkwithpersistenceandexternalbias.The Bulletin of Mathematical Biophysics, 15, 311–338.
Petrovskii,S.V.,Morozov,A.Y.,&Venturino,E.(2002).Alleeeffectmakespossi-blepatchyinvasioninapredator-preysystem.Ecology Letters, 5, 345–352.
Pfeifer,E.M.,Hicke,J.A.,&Meddens,A.J.H. (2011).Observationsandmodeling of aboveground tree carbon stocks and fluxes followinga bark beetle outbreak in thewesternUnited States.Global Change Biology, 17, 339–350.
Pierce,K.B.,Ohmann,J.L.,Wimberly,M.C.,Gregory,M.J.,&Fried,J.S.(2009).Mappingwildlandfuelsandforeststructureforlandmanage-ment:Acomparisonofnearestneighbor imputationandothermeth-ods.Canadian Journal of Forest Research, 39, 1901–1916.
Powell, J. A. (2017).MPB spot infestation data. [email protected],https://doi.org/10.15142/T31C73
Powell, J.A., &Bentz, B. J. (2009). Connecting phenological predictionswithpopulation growth rates formountainpinebeetle, anoutbreakinsect.Landscape Ecology, 24, 657–672.
Powell,J.A.,&Bentz,B.J.(2014).Phenologyanddensity-dependentdis-persalpredictpatternsofmountainpinebeetle(Dendroctonus pondero-sae)impact.Ecological Modelling, 273, 173–185.
Raffa,K.F.,Aukema,B.H.,Erbilgin,N.,Klepzig,K.D.,&Wallin,K.F.(2005).ChapterFourInteractionsamongconiferterpenoidsandbarkbeetlesacrossmultiplelevelsofscale:Anattempttounderstandlinksbetweenpopulation patterns and physiological processes. Recent Advances in Phytochemistry, 39, 79–118.
Raffa,K.F.,Aukema,B.H.,Bentz,B.J.,Carroll,A.L.,Hicke,J.A.,Turner,M.G.,&Romme,W.H.(2008).Cross-scaledriversofnaturaldisturbancesprone toanthropogenicamplification:Dynamicsofbiome-widebarkbeetleeruptions.BioScience, 58, 501–518.
Raffa,K.F.,Powell,E.N.,&Townsend,P.A. (2012).Temperature-drivenrangeexpansionofanirruptiveinsectheightenedbyweaklycoevolvedplantdefense.PNAS, 110, 2193–2198.
Safranyik, L., & Carroll,A. (2006). The biology and epidemiology of themountain pine beetle in lodgepole pine forests. In L. Safranyik&B.Wilson(Eds.),The mountain pine beetle: A synthesis of biology, manage-ment, and impacts on lodgepole pine (pp. 3–66).Victoria, BC:NaturalResourcesCanada,CanadianForestService.
Safranyik, L., Linton, D. A., Silversides, R., & McMullen, L. H. (1992).Dispersal of releasedmountain pine beetles under the canopy of amature lodgepole pine stand. Journal of Applied Entomology, 113, 441–450.
Sharov,A.A.,& Liebhold,A.M. (1998).Model of slowing the spreadofgypsymoth(Lepidoptera:Lymantriidae)withabarrierzone.Ecological Applications, 8, 1170–1179.
Shigesada,N.,&Kawasaki,K.(1997).Biological invasions: Theory and prac-tice.Oxford,UK:OxfordUniversityPress.
Skellam, J. G. (1951). Random dispersal in theoretical populations.Biometrika, 38, 196–218.
Stephens,P.A.,Sutherland,W.J.,&Freckleton,R.P. (1999).WhatistheAlleeeffect?Oikos, 87, 185–190.
Taylor,C.M.,&Hastings,A. (2005).Alleeeffects inbiological invasions.Ecology Letters, 8, 895–908.
Taylor,C.M.,Davis,H.G.,Civille,J.C.,Grevstad,F.S.,&Hastings,A.(2004).ConsequencesofanAlleeeffectintheinvasionofaPacificestuarybySpartina alterniflora. Ecology, 85, 3254–3266.
14 | Journal of Animal Ecology POWELL Et aL.
Turchin,P.(1989).Populationconsequencesofaggregativemovement.The Journal of Animal Ecology, 58, 75–100.
Turchin, P. (1998). Quantitative analysis of movement. Sunderland, MA:SinauerAssociates,Inc.
Wang,M.H.,&Kot,M.(2001).SpeedsofinvasioninamodelwithstrongorweakAlleeeffects.Mathematical Biosciences, 171, 83–97.
Wang,M.H.,Kot,M.,&Neubert,M.G. (2002). Integrodifferenceequa-tions,Alleeeffects,andinvasions.Journal of Mathematical Biology, 44, 150–168.
Wang,J.,Shi,J.,&Wei,J.(2011).Dynamicsandpatternformationinadif-fusivepredator-preysystemwithstrongAlleeeffectinprey.Journal of Differential Equations, 251, 1276–1304.
Waring, R.H., & Pitman,G. B. (1985).Modifying lodgepole pine standsto change susceptibility tomountain pine beetle attack.Ecology, 66, 889–897.
Wertheim, B., van Baalen, E. J. A., Dicke, M., & Vet, L. E. (2005).Pheromone-mediated aggregation innonsocial arthropods:Anevo-lutionary ecological perspective. Annual Review of Entomology, 50, 321–346.
Zhao,H.(2004).Afastsweepingmethodforeikonalequations.Mathematics
of Computation, 74, 603–627.
How to cite this article:PowellJA,GarlickMJ,BentzBJ,FriedenbergN.DifferentialdispersalandtheAlleeeffectcreatepower-lawbehaviour:Distributionofspotinfestationsduringmountainpinebeetleoutbreaks.J Anim Ecol. 2017;00:1–14.https://doi.org/10.1111/1365-2656.12700