Embed Size (px)
Citation preview

DIFFERENTIAL EFFECTS OF SELF-PACED AND DEVICE-GUIDED SLOW DEEP
BREATHING ON PHYSIOLOGICAL OUTCOMES
By
Kevin Lawrence Kelly
A THESIS
Submitted to
Michigan State University
in partial fulfillment of the requirements
for the degree of
Physiology—Masters of Science
2015

LAYMAN’S ABSTRACT
DIFFERENTIAL EFFECTS OF SELF-PACED AND DEVICE-GUIDED SLOW DEEP
BREATHING
By
Kevin Lawrence Kelly
Slow breathing exercises have been used for thousands of years in practices such as yoga and
meditation, and recent scientific studies demonstrate that they do reduce stress and lower blood
pressure. Yet recently, device-guided breathing maneuvers that seek to replicate self-paced
breathing practices have raised doubts about the effectiveness of slow breathing techniques. It is
hypothesized that the act of reducing breathing rate is not the only factor contributing to stress
and blood pressure reduction, and that other factors such as devices themselves and the patient’s
baseline personality traits and state of mind at the time of the maneuver are also important in
determining the effectiveness. The present study found that changes in blood flow to the forearm,
heart rate, and blood pressure were affected differently by device-guided maneuvers and self-
paced maneuvers. In addition, several psychological metrics are predictive of different
physiological responses to each of these practices.

ABSTRACT
DIFFERENTIAL EFFECTS OF SELF-PACED AND DEVICE-GUIDED SLOW DEEP
BREATHING
By
Kevin Lawrence Kelly
Slow breathing exercises have been used for thousands of years in yoga and meditation practices,
and have been successful in reducing sympathetic nerve activity and lowering blood pressure.
Recently, computerized devices aimed to replicate self-guided breathing have been used. There
have been mixed results regarding the efficacy of these devices. It is hypothesized that the act of
reducing breathing rate is not the only factor contributing to physiological changes, and that
factors such as external aid and psychological metrics are also important in determining the
responses to breathing rate changes. Therefore we compared device-guided (n=10) and self-
paced (n=11) slow breathing maneuvers in young healthy males and found differences between
conditions in forearm vasodilation as measured by venous occlusion plethysmography
(111.78±7.82% and 96.24±5.82%, p=0.067) and changes in systolic blood pressure as measured
by finometry (-3.47±1.43 mmHg and -0.45±2.35 mmHg, p=0.138). In addition, several
psychological metrics are predictive of differences in physiological responses to each of these
practices: trait anxiety correlates with a lack of reduction in mean arterial pressure (MAP) in the
self-guided intervention (r=0.452, p=0.81); acting without awareness correlates with a lack of
reduction in MAP in the self-guided intervention (r=0.683, p=0.01); and acting without
awareness correlates with a reduction in MAP in the device-guided intervention (r=-0.472,
p=0.084). It is concluded that these two breathing practices are inherently different breathing
maneuvers, given the differences in physiological outcomes and psychological predictors.

iii
To those who have supported me

iv
ACKNOWLEDGEMENTS
I would like to thank Dr. Wehrwein for helping me through my Master’s degree and giving me
every opportunity to be successful. I also would like to thank my committee members, Dr.
Kreulen, Dr. Parameswaran, and Dr. Root-Bernstein for their input and support throughout the
process of the research presented within. Finally, I want to thank the department as a whole for
providing me with a quality education over the course of both my Master’s and Bachelor’s
degrees.

v
TABLE OF CONTENTS
LIST OF TABLES .................................................................................................................vii
LIST OF FIGURES ...............................................................................................................vi
KEY TO ABBREVIATIONS ................................................................................................ix
LITERATURE REVIEW ......................................................................................................1
Breathing Practices ...........................................................................................................1
Yoga and self-paced breathing...................................................................................1
Device-guided breathing ............................................................................................2
Physiological Mechanisms of Respiratory Control ..........................................................3
Central control of respiration .....................................................................................3
Respiratory-sympathetic coupling .............................................................................4
Psychological Correlates to Physiological Outcomes.......................................................6
Specific Aim I ...................................................................................................................7
Specific Aim II ..................................................................................................................8
CURRENT STUDY...............................................................................................................11
Methods.............................................................................................................................11
Subject inclusion/exclusion criteria ............................................................................11
IRB approval ...............................................................................................................12
Software/hardware ......................................................................................................12
Electrocardiography (ECG) ........................................................................................12
Pneumobelt .................................................................................................................12
Finometer ....................................................................................................................13
Venous occlusion plethysmography ...........................................................................13
Study conditions..........................................................................................................14
Psychological surveys .................................................................................................14
Results ...............................................................................................................................18
Breathing Manipulation ..............................................................................................18
Specific Aim I .............................................................................................................19
Specific Aim II ............................................................................................................21
Discussion .........................................................................................................................36
Conclusion ........................................................................................................................41
REFERENCES ......................................................................................................................42

vi
LIST OF TABLES
Table 1: Demographics ..........................................................................................................11

vii
LIST OF FIGURES
Figure 1: Central Respiratory Control Diagram ....................................................................9
Figure 2: Timeline for Studies ...............................................................................................16
Figure 3: Respiratory Rate .....................................................................................................23
Figure 4: Tidal Volume ..........................................................................................................24
Figure 5: Ventilation ..............................................................................................................25
Figure 6: Systolic Blood Pressure ..........................................................................................26
Figure 7: Diastolic Blood Pressure ........................................................................................27
Figure 8: Mean Arterial Blood Pressure ................................................................................28
Figure 9: Forearm Vasodilation .............................................................................................29
Figure 10: Heart Rate .............................................................................................................30
Figure 11: State Anxiety ........................................................................................................31
Figure 12: Trait Anxiety ........................................................................................................32
Figure 13: Cognitive Failure ..................................................................................................33
Figure 14: Observational Mindfulness...................................................................................34
Figure 15: Acting Without Awareness ..................................................................................35

viii
KEY TO ABBREVIATIONS
AHA American Heart Association
BMI Body Mass Index
CFQ Cognitive Failure Questionnaire
CVLM Caudal Ventrolateral Medulla
DBP Diastolic Blood Pressure
DG Device-Guided
ECG Electrocardiogram
IRB Institutional Review Board
FFMQ Five-Faceted Mindfulness Questionnaire
MAP Mean Arterial Pressure
MSNA Muscle Sympathetic Nerve Activity
NTS Nucelus Tractus Solitarius
pFRG Parafacial Respiratory Group
PreBotC PreBotzinger Complex
RSA Respiratory Sinus Arrhythmia
RTN Retrotrapezoidal Nucleus
RVLM Rostroventrolateral Medulla
SBP Systolic Blood Pressure
SDB Slow Deep Breathing
SE Standard Error
Self Self-Guided Breathing

ix
STAI-S State Trait Anxiety Inventory – State
STAI-T State Trait Anxiety Inventory – Trait
VE Total Ventilation
VOP Venous Occlusion Plethysmography
VRG Ventral Respiratory Group
1
LITERATURE REVIEW
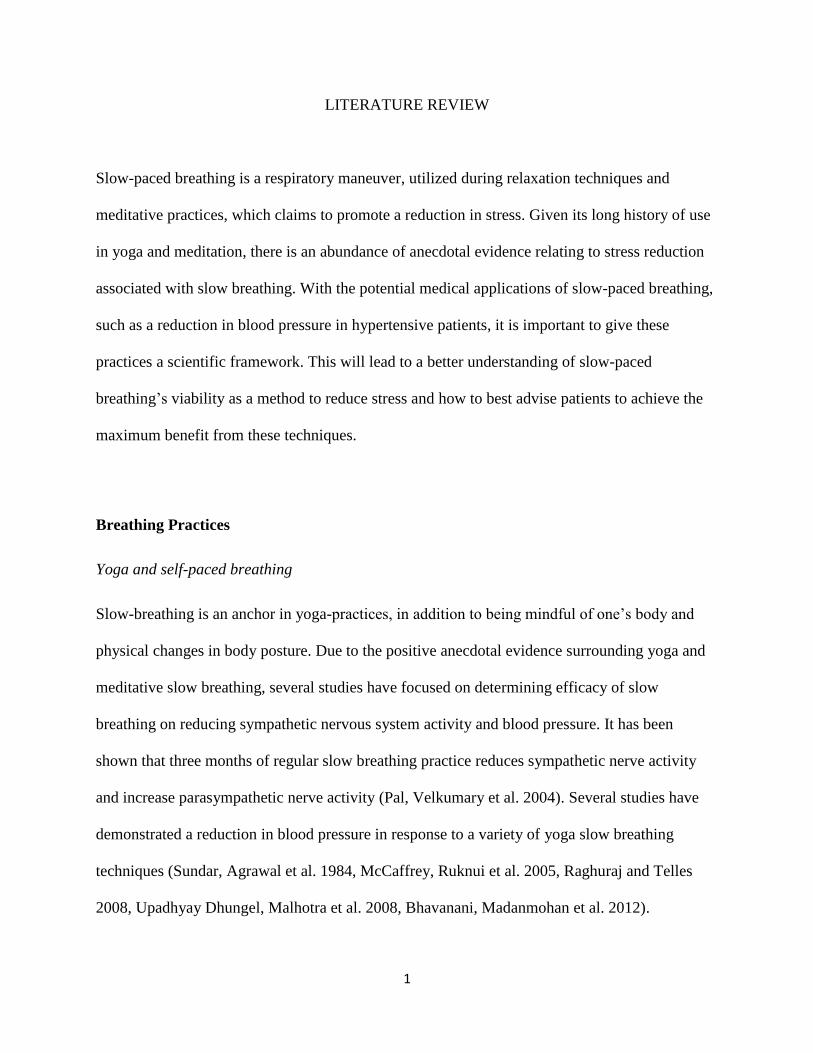
Slow-paced breathing is a respiratory maneuver, utilized during relaxation techniques and
meditative practices, which claims to promote a reduction in stress. Given its long history of use
in yoga and meditation, there is an abundance of anecdotal evidence relating to stress reduction
associated with slow breathing. With the potential medical applications of slow-paced breathing,
such as a reduction in blood pressure in hypertensive patients, it is important to give these
practices a scientific framework. This will lead to a better understanding of slow-paced
breathing’s viability as a method to reduce stress and how to best advise patients to achieve the
maximum benefit from these techniques.
Breathing Practices
Yoga and self-paced breathing
Slow-breathing is an anchor in yoga-practices, in addition to being mindful of one’s body and
physical changes in body posture. Due to the positive anecdotal evidence surrounding yoga and
meditative slow breathing, several studies have focused on determining efficacy of slow
breathing on reducing sympathetic nervous system activity and blood pressure. It has been
shown that three months of regular slow breathing practice reduces sympathetic nerve activity
and increase parasympathetic nerve activity (Pal, Velkumary et al. 2004). Several studies have
demonstrated a reduction in blood pressure in response to a variety of yoga slow breathing
techniques (Sundar, Agrawal et al. 1984, McCaffrey, Ruknui et al. 2005, Raghuraj and Telles
2008, Upadhyay Dhungel, Malhotra et al. 2008, Bhavanani, Madanmohan et al. 2012).

2
Device-guided breathing
Given the positive benefits noted above, the medical device industry has attempted to extract and
standardize the breathing aspect of these practices by inventing devices that coach patients
through a slow breathing practice with tones and monitoring. Recently, a study concluded that
device-guided breathing practices were not effective at reducing blood pressure after an eight
week period in white, hypertensive male and female patients (Landman, Drion et al. 2013).
Although the conclusions of that study have been challenged due to low sample sizes and
potentially unsuccessful randomization (Huang and Subak 2014). Several other device-guided
studies have also supported the idea that slow deep breathing is not feasible as a method to
reduce blood pressure (Altena, Kleefstra et al. 2009, Anderson, McNeely et al. 2010, Hering,
Kucharska et al. 2013).
On the other hand, many groups have shown a reduction in blood pressure using device-guided
practices (Grossman, Grossman et al. 2001, Schein, Gavish et al. 2001, Viskoper, Shapira et al.
2003, Elliot, Izzo et al. 2004, Meles, Giannattasio et al. 2004, Schein, Gavish et al. 2009, Oneda,
Ortega et al. 2010, Bertisch, Schomer et al. 2011). Similarly, several studies have concluded that
muscle sympathetic nerve activity (MSNA) was significantly lower after an acute use of device-
guided breathing (Hering, Kucharska et al. 2013, Harada, Asanoi et al. 2014), although this was
not seen in chronic use (Hering, Kucharska et al. 2013).
Despite the evidence that self-paced breathing exercises, such as yoga breathing, lowers blood
pressure and despite mixed results from device-guided studies, the American Heart Association
(AHA) recently issued a position statement providing moderate support to device-guided
breathing while withholding support of yoga breathing (Brook, Appel et al. 2013). Notably,
however, resistance to supporting yoga breathing is based on a lack of good studies and not to

3
negative findings, per se. Rather than working from data that does not take into account all of
the variables, it is important to perform well-controlled studies on slow breathing practices to
determine whether there are significant differences between these two slow deep breathing
practices and their effects on the cardiovascular system.
Physiological Mechanisms of Respiratory Control
In order to carry out useful studies of the effects of controlled breathing on heart-related
functions, it is necessary to understand some of the key mechanisms by which the two
physiological systems interact.
Central control of respiration
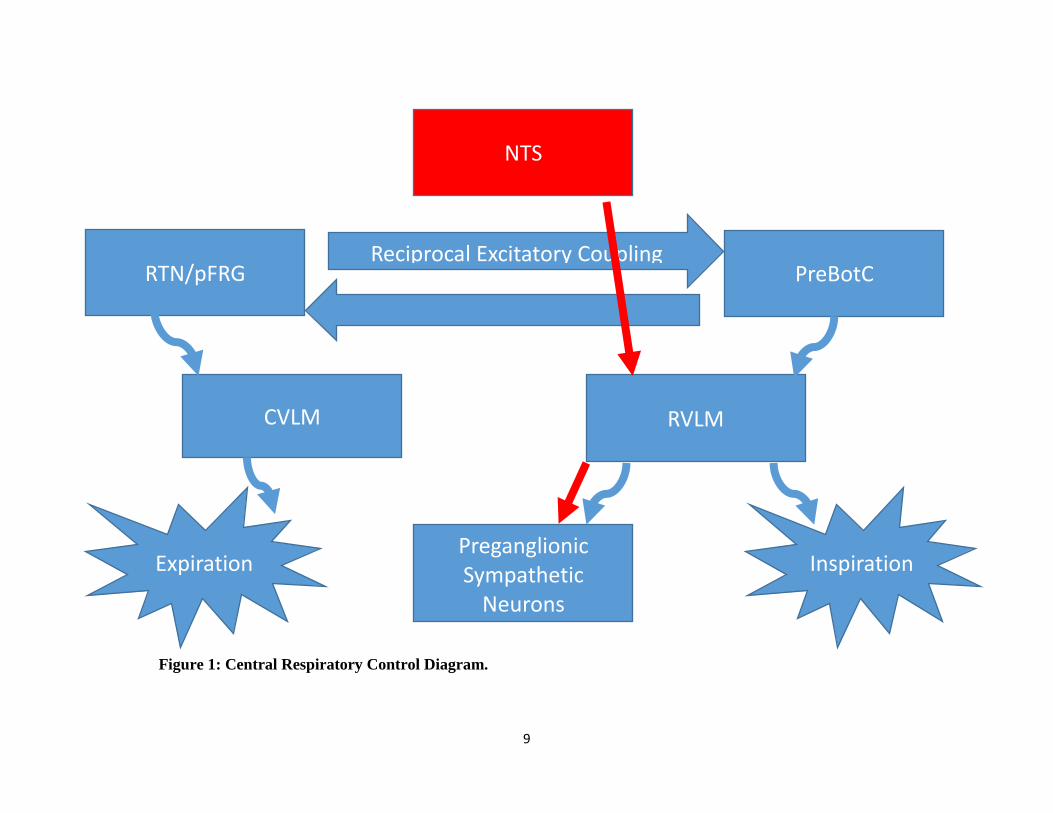
See figure 1. Inspiration and expiration involve two areas in the medulla that rhythmically
generate motor efferent activity to muscles involved in respiration, the Pre-Botzinger Complex
(PreBotC) and the parafacial respiratory group/retrotrapezoidal nucleus (pFRG/RTN). These two
areas in the brainstem—PreBotC and pFRG/RTN—are phase-locked, or synchronized, through
reciprocal excitatory coupling to ensure proper breathing patterns, or eupnoea. (Mellen and
Thoby-Brisson 2012).
The PreBotC is involved in generating inspiration. This was established by observing that
PreBotC activity is coupled to respiratory patterns (Smith, Greer et al. 1990, Smith, Ellenberger
et al. 1991, Richter and Spyer 2001, Ramirez, Zuperku et al. 2002) and lesion studies showing
that destruction of the PreBotC leads to ataxic breathing patterns (Gray, Janczewski et al. 2001).
While much of the rhythmicity of the PreBotC is still unclear and debated, it is agreed upon that
about half of this area in the medulla is comprised of pacemaker neurons that initiate the

4
inspiratory patterning. From there, inspiratory-related neural activity is relayed to premotor
neurons in the rostral ventrolateral medulla (RVLM), which continues to project to the phrenic
nerve (diaphragm) and intercostal nerves (external intercostal muscles) to cause contraction of
these muscles and thus inhalation (Feldman and Del Negro 2006).
Under rest or light activity, the lungs will deflate through passive recoil of the ribcage and
diaphragm. Under conditions that require increased ventilation or conscious breathing, active
expiration will arise from a second area in the medulla, the pFRG/RTN. The pFRG/RTN also
exhibits rhythmicity similar to the PreBotC, but is lesser known due to its recent identification
(Mellen, Janczewski et al. 2003, Feldman and Del Negro 2006, Janczewski and Feldman 2006).
Activity in the pFRG/RTN is relayed to the central ventrolateral medulla, before continuing on to
the intercostal nerves, which innervate the internal intercostal muscles as well as the abdominal
muscles. Contraction of both of these muscle groups results in active expiration.
Respiratory-sympathetic coupling
The central respiratory neural network is anatomically and physiologically linked to autonomic
outflow to the rest of the body. The most obvious case of this is evident in variations in heart rate
that align with breathing patterns, called respiratory sinus arrhythmia (RSA). RSA causes heart
rate to increase during periods of inspiration and decrease during periods of expiration, allowing
for more efficient gas exchange. This is modulated via changes in parasympathetic cardiac vagal
outflow, causing an increase in vagal tone during expiration and a withdrawal during inhalation,
controlled by pulmonary stretch afferents and the Hering-Breuer reflex (Yasuma and Hayano
2004).
Less evidently, the central respiratory neural network also acts as a “gate” for sympathetic
outflow. To be more specific, the sympathetic nervous system is more active during the

5
inspiratory phase, and is “blocked” during the expiratory phase. An example of this was shown
cleverly through stimulation of the baroreceptors by applying a baroreflex-triggering procedure
of external neck pressure or suction during different phases of the respiratory cycle and
observing that blood pressure responses, and therefore sympathetic responses, were greatest
during inspiratory phases (Eckberg and Orshan 1977, Eckberg, Kifle et al. 1980, Wallin and
Eckberg 1982, Eckberg 2003). This respiratory “gate” phenomenon is also demonstrated by
observing that MSNA quiescence occurs during exhalation (Mozer, Fadel et al. 2014).
Beyond the acute effects of respiratory-sympathetic coupling on physiological outcomes
mentioned earlier, there are also several relevant chronic effects. It has been shown that, when
broken in tertiles based on breathing rate, those who breathe at a faster rate also have a higher
MSNA burst incidence (Narkiewicz, van de Borne et al. 2006). It has also been shown that
higher breathing rates are correlated with an increase in total peripheral resistance in young
males (Charkoudian, Gusman et al. 2010).
The anatomical basis for the above relationships is based in central connections between the
respiratory and autonomic neurons. The nucleus tractus solitarius (NTS) is a structure in the
dorsolateral medulla, and is considered an integrative center for various processes related to the
sympathetic nervous system, including baroreflex and chemoreflex control. The NTS can be
considered the “master” regulator of sympathetic outflow through direct projections to the
RVLM (Zoccal, Furuya et al. 2014).
The RVLM, found in the medulla, houses presympathetic neurons, which are the point of origin
for excitatory inputs to the preganglionic sympathetic neurons that are responsible for controlling
arterial pressure (Guertzenstein and Silver 1974, Ross, Ruggiero et al. 1984).
6
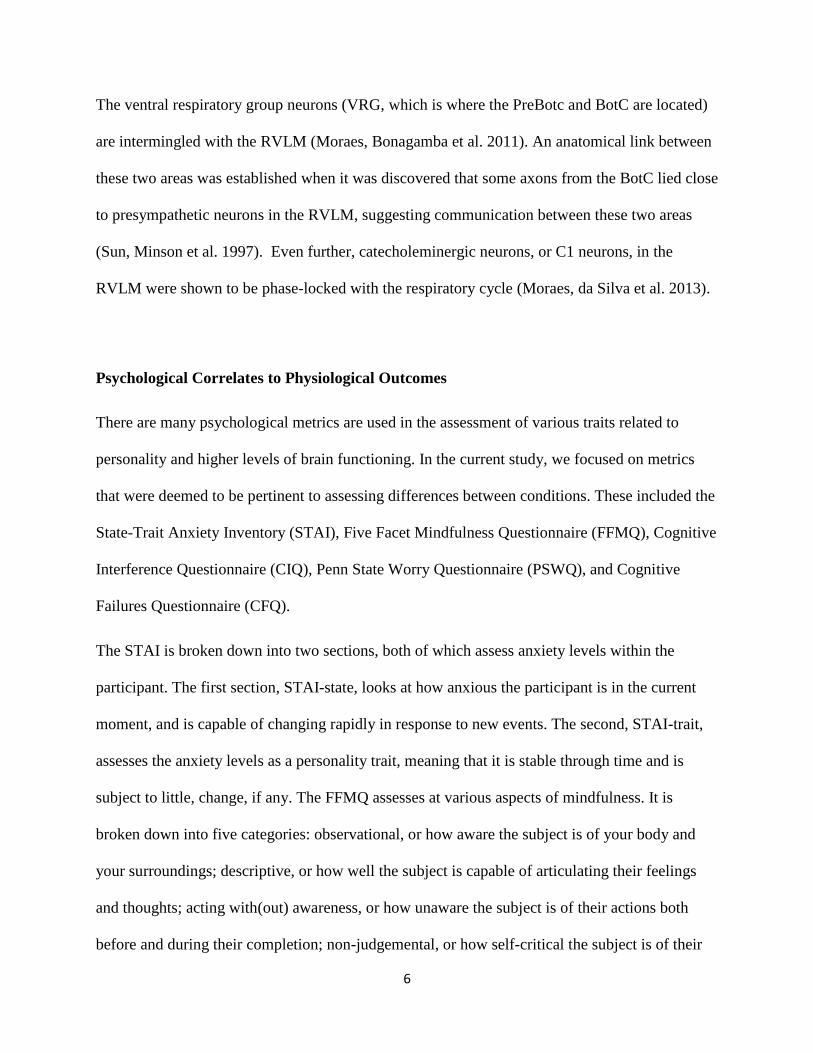
The ventral respiratory group neurons (VRG, which is where the PreBotc and BotC are located)
are intermingled with the RVLM (Moraes, Bonagamba et al. 2011). An anatomical link between
these two areas was established when it was discovered that some axons from the BotC lied close
to presympathetic neurons in the RVLM, suggesting communication between these two areas
(Sun, Minson et al. 1997). Even further, catecholeminergic neurons, or C1 neurons, in the
RVLM were shown to be phase-locked with the respiratory cycle (Moraes, da Silva et al. 2013).
Psychological Correlates to Physiological Outcomes
There are many psychological metrics are used in the assessment of various traits related to
personality and higher levels of brain functioning. In the current study, we focused on metrics
that were deemed to be pertinent to assessing differences between conditions. These included the
State-Trait Anxiety Inventory (STAI), Five Facet Mindfulness Questionnaire (FFMQ), Cognitive
Interference Questionnaire (CIQ), Penn State Worry Questionnaire (PSWQ), and Cognitive
Failures Questionnaire (CFQ).
The STAI is broken down into two sections, both of which assess anxiety levels within the
participant. The first section, STAI-state, looks at how anxious the participant is in the current
moment, and is capable of changing rapidly in response to new events. The second, STAI-trait,
assesses the anxiety levels as a personality trait, meaning that it is stable through time and is
subject to little, change, if any. The FFMQ assesses at various aspects of mindfulness. It is
broken down into five categories: observational, or how aware the subject is of your body and
your surroundings; descriptive, or how well the subject is capable of articulating their feelings
and thoughts; acting with(out) awareness, or how unaware the subject is of their actions both
before and during their completion; non-judgemental, or how self-critical the subject is of their

7
thoughts and feelings; and non-reactionary, or how capable the subject is at stepping away from
their emotions and feelings without becoming overwhelmed by them.
Finally, the CIQ measures the relative amount that the subject thought of other topics during the
duration of the study, including topics related to the study (“am I performing well?”) and in their
everyday lives (“I need to pick up the kids after work”). The PSWQ measures the how frequently
the participant worries and how much worry affects their lives. The CFQ measures the relative
frequency at which the participant forgets what they are doing, how frequently they fail to notice
their surroundings.
There is an increasing amount of evidence that points to the involvement of the state of mind on
physiological outcomes. It has been shown that a high level of trait mindfulness is related to a
reduction in blood pressure, lower IL-6 levels (Tomfohr, Pung et al. 2015), lower cortisol levels
(Brown, Weinstein et al. 2012, Jacobs, Shaver et al. 2013), and lower activation of the amygdala
in response to stressors (Creswell, Way et al. 2007). Taken together, these studies indicate that a
person’s level of mindfulness is important to consider when discussing autonomic activity.
Another psychological trait potentially linked to autonomic activity is cognitive interference. It
has been shown that a decrease in the amount of attention that can be spared, or an increase in
the amount of cognitive interference occurring, results in an increase in blood pressure in
response to negative, stressful images (Okon-Singer, Mehnert et al. 2014).
Specific Aim I
To determine if device-guided and self-guided breathing result in different physiological
outcomes. We hypothesize that self-guided breathing and device-guided breathing are
8
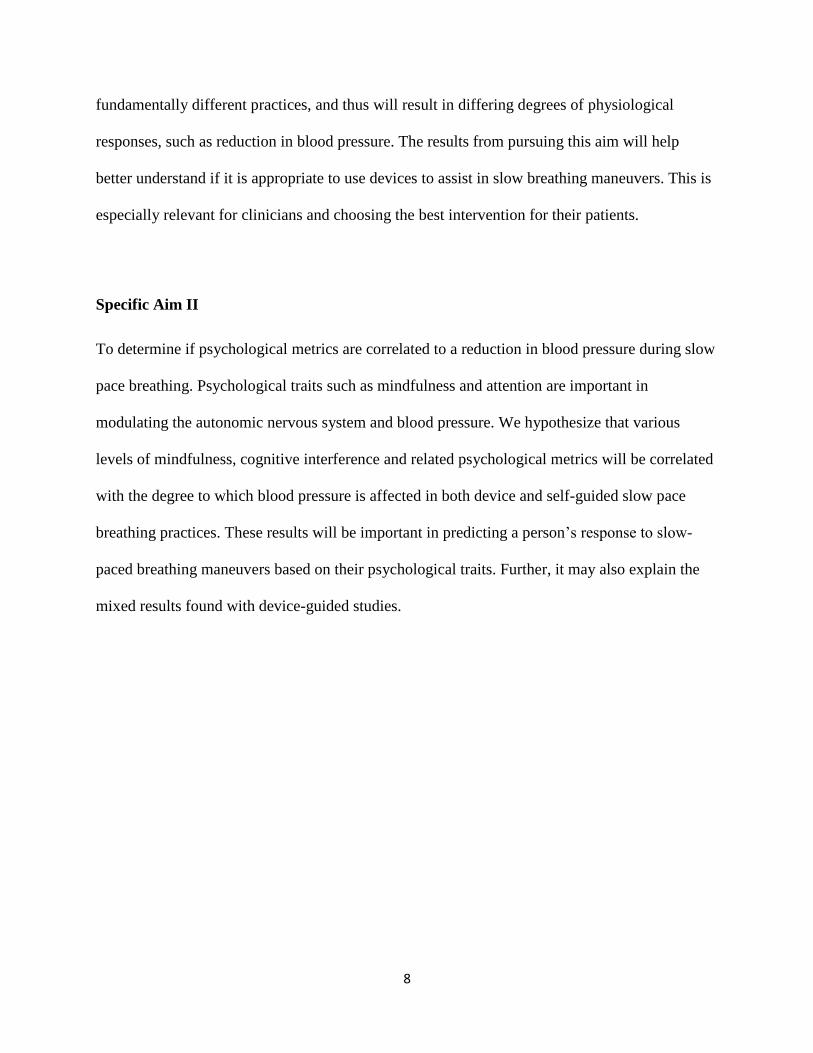
fundamentally different practices, and thus will result in differing degrees of physiological
responses, such as reduction in blood pressure. The results from pursuing this aim will help
better understand if it is appropriate to use devices to assist in slow breathing maneuvers. This is
especially relevant for clinicians and choosing the best intervention for their patients.
Specific Aim II
To determine if psychological metrics are correlated to a reduction in blood pressure during slow
pace breathing. Psychological traits such as mindfulness and attention are important in
modulating the autonomic nervous system and blood pressure. We hypothesize that various
levels of mindfulness, cognitive interference and related psychological metrics will be correlated
with the degree to which blood pressure is affected in both device and self-guided slow pace
breathing practices. These results will be important in predicting a person’s response to slow-
paced breathing maneuvers based on their psychological traits. Further, it may also explain the
mixed results found with device-guided studies.
9
NTS
RVLM
Preganglionic Sympathetic
Neurons
CVLM
RTN/pFRG
Inspiration Expiration
PreBotC
Reciprocal Excitatory Coupling
Figure 1: Central Respiratory Control Diagram.

10
Figure 1: Central Respiratory Control Diagram (cont’d). The PreBotzinger’s Complex (PreBotC) houses inspiratory pace maker
neurons. Inspiratory neurons project to the Rostroventrolateral Medulla (RVLM), which relays inspiratory signals to the diaphragm
and external intercostal muscles via the phrenic and intercostal nerves, respectively, to cause inhalation. The Retrotrapezoid Nucleus/
Parafacial Respiratory Group (RTN/pFRG) houses expiratory pacemaker neurons that function under active expiration situations. The
expiratory neurons project to the Caudal Ventrolateral Medulla, which relays exhalation signals to the abdominal and internal
intercostal muscles, triggering exhalation. The RTN/pFRG and PreBotC reciprocally excite each another, leading to phase locking and
ensuring proper breathing patters, or eupnoea. The Nucleus Tractus Solitarius (NTS) receives input from baroreceptors and
chemoreceptors. These inputs are then translated to sympathetic nerve activity increases or decreases through the RVLM. The
RVLM’s role in modulating inspiration and sympathetic output is the reason for respiratory-sympathetic coupling.

11
CURRENT STUDY
Methods
Subject inclusion/exclusion
Participants in this study were young healthy males, 18-25 years of age, non-obese (BMI<30),
non-hypertensive (BP <140/90), moderately active (less than 60 min, 3 times per week), and
yoga/meditation naïve. Participants could not be smokers or have any chronic diseases related to
the cardiovascular or respiratory systems, nor be taking any medication that could potentially
alter cardiovascular function.
On the day of the study, participants were asked to refrain from caffeine or alcohol in the past 6
hours and food in the past 3 hours, and intense exercise 24 hours. Prior to arrival, participants
were randomly sorted into either device-guided or self-guided breathing groups. Participants
were screened and consented prior to enrollment.
Table 1: Demographics.
Demographics
Device
(n=10) ±SE
Self
(n=11) ±SE
P-
value
Age 20.01 ±0.4
20.17 ±0.43
0.78
BMI 23.92 ±0.96
24.59 ±0.77
0.59
Heart Rate 60.2 ±2.71
63.18 ±3.30
0.5
Systolic 117.46 ±1.91
121.3 ±2.58
0.26
Diastolic 67.41 ±1.45
65.2 ±2.77
0.5
Breathing Rate 15.39 ±1.28
14.35 ±1.03
0.53

12
IRB approval
This study was reviewed and approved by Michigan State University’s Institutional Review
Board, IRB approval #: 14-691. All participants read and signed a consent form outlining their
rights as a participant.
Software/hardware
All physiological data was collected and analyzed using Labchart (version 7.3.7, ADInstruments)
in conjunction with Powerlab 8/35 (ADInstruments). The inductotrace, finometer, and
plethysmograph (see below) were all connected to the Powerlab unit with BNC cables. ECG was
connected using a BNC cable allowing communication between the main unit and the bio amp
unit.
Electrocardiography (ECG)
ECG was obtained using a 4cm x 3.5cm electrode (3M Red Dot 2560). The electrodes were
attached to an ADInstruments 5-lead shielded bio amp cable, which was plugged into a
ADInstruments Dual Bio Amp/Stimulator unit.
Three leads were placed in total. The negative lead was positioned just under the right clavicle.
The positive lead was positioned just above the left iliac crest. The ground was placed just above
the right iliac crest. This positioning is known as Lead II. The skin was cleaned using an alcohol
swab prior to lead attachment.
Pneumobelt
A double pnuemobelt set up from Inductotrace was used to monitor chest wall and abdominal
movements associated with breathing (model number 10.9000 from Ambulatory Monitoring
Inc.) Appropriate transducer band sizes were determined by measuring the circumference of the
13
subject’s body at the level of the navel and just below the axilla for the waist and chest bands,
respectively. Pneumobelts were calibrated using a one-liter spirobag after the participant was
lying down, using a nose clip to prevent nose breathing. Participants fully inflated and deflated
the bag 4 times and these values were used to convert raw voltage readings to liters. Data from
both calibrated belts were summed to determine total air flow.
Finometer
The finometer MIDI (Finapres Medical Systems) was used to assess beat-to-beat blood pressure
continuously throughout the study. Appropriate finger cuff sizes were determined by using the
cuff size guide apparatus provided by the company. The finger cuff was placed on the left hand
middle finger intermediate phalanx and adjusted for proper readouts. To verify and calibrate the
finometer readouts, manual blood pressure was taken two to three times before and after the
study. Participants were asked to remain still. If the participant’s hand or finger became cold, we
provided a small heating pad.
Venous occlusion plethysmography
Forearm blood flow was assessed using Venous Occlusion Plethysmography (VOP). Two rapid
cuff inflators (E20, Hokanson) were attached to one inflator air source (AG 101, Hokanson). One
rapid cuff inflator was attached to a child’s arm blood pressure cuff, which was wrapped around
the wrist, and the other rapid cuff inflator was attached to an adult arm blood pressure cuff,
which was fastened around the upper arm. The rapid cuff inflator attached to the cuff around the
bicep was on an 8 sec inflate/7 sec deflate timer, while the wrist cuff stayed inflated for 4
minutes.

14
Mercury strain gauges (Hokanson) were used to assess the expansion of the forearm. To select
the appropriate sized strain gauge, the forearm circumference was measured two cm distal from
the elbow fold. This was also the location of the strain gauge when fitted onto the participant.
The measured size of the forearm was then subtracted by two and the resulting value was the size
of the strain gauge used (cm). The cables were taped to avoid any unnecessary movement. The
strain gauge was attached to a plethysmograph (EC6, Hokanson). The plethysmograph was
calibrated prior to fitting of the strain gauge to the participant.
VOP data was analyzed in Labchart by measuring the slope of each tracing during the inflation
phase of the upper arm cuff over eight cycles of VOP and the individual slopes were averaged.
Study conditions
Participants in the device-guided breathing condition were instructed to synchronize their
breathing to a series of tones administered through headphones, which results in a breathing rate
of 6 breaths/min. Participants in the self-guided condition were instructed to reduce their
breathing to a rate slower than normal, but still maintain a breathing pattern that is comfortable
to them in both rate and depth. Self-guided participants also had headphones on, but no audio
was played. All studies occurred in the same room with controlled temperature and humidity,
dimmed lighting, and quiet conditions.
Psychological surveys
A State-Trait Anxiety Survey-State (STAI-S) was administered prior to instrumentation. Another
STAI-S was administered after de-instrumentation. Following the second STAI-S, the participant
was given the following surveys, in order: STAI-Trait, Five Facet Mindfulness Questionnaire,

15
Cognitive Interference Questionnaire, Penn State Worry Questionnaire, and Cognitive Failures
Questionnaire.

16
Figure 2: Timeline for studies.
0 10 25 35
VO
P S
tart
VO
P S
tart
VO
P S
tart
VO
P E
nd
VO
P E
nd
End
o B
reat
hin
g St
art
Co
nd
itio
n B
reat
hin
g St
art
End
o B
reat
hin
g St
art
End
of
Stu
dy
8 27 33 12 23
Instrumentation Deinstrumentation

17
Figure 2 (cont’d): Participants were screened and consented, then filled out an STAI-S, followed by intake forms. Next, the
participant was instrumented with ECG, pnuemobelts, finometer, and VOP equipment, and the appropriate calibrations completed. To
begin data collection, the participant was asked to breathe normally for 10 minutes, then slow their breathing down for 15 minutes
either by self-guiding or device-guiding, then breathe normally again for 10 minutes. Data collection stopped after the end of the
second endogenous breathing, and the participant was deinstrumented and asked to fill out the remaining psychological surveys.
Throughout the entirety of data collection, the ECG, pneumobelts, finometer were continuously recording data. VOP cycling began 2
minutes before the end of a condition and ended 2 minutes after the beginning of the next.

18
Results
Breathing Manipulation
Baseline breathing rate was not different between the self-guided and device-guided groups
(14.36±1.03 vs 15.39±1.29 breaths per minute, p=0.27). Breathing was reduced to 8.36±0.74
breaths per minute (BPM) in self-guided (p<0.01 compared to baseline) and 6.37±0.10 BPM in
device-guided (p>0.01 compared to baseline, p<0.01 between groups). During recovery,
breathing rate was lower from baseline levels in self-paced (13.25±0.716 BPM, p=.030) and
device-guided (13.67±1.11 BPM, p=0.020, Figure 3). Recovery breathing was not significant
between conditions (p=0.378). Breathing data represents the mean breath rate of the entire 10 or
15 min period.
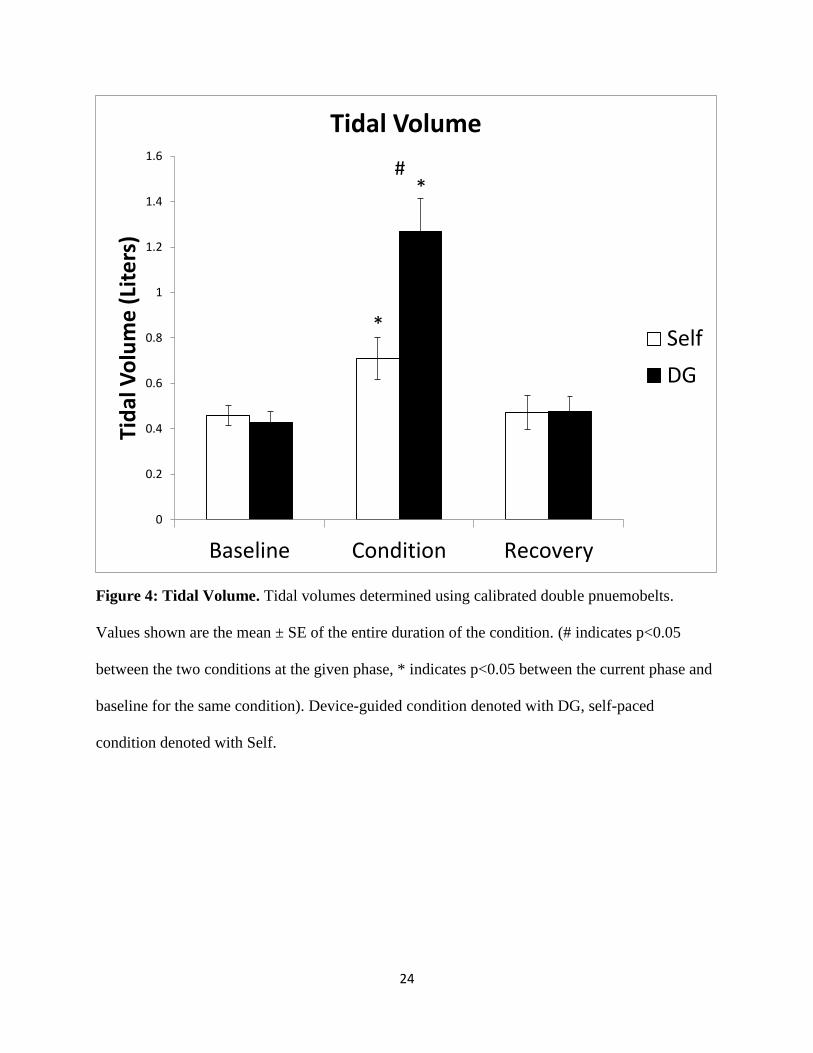
During baseline, self-guided and device-guided conditions had similar tidal volumes of 0.460.04
L and 0.42±0.05 L, respectively (p=0.31). During condition breathing, the device-guided group
had higher tidal volumes of 1.17±0.116 L (p>0.01 compared to baseline) compared to self-
guided conditions with an average of 0.710±0.0924 L (p<0.01 compared to baseline, p>0.01
between groups). During the recovery period, both self- and device-guided groups returned to
baseline tidal volume levels of 0.47±0.075 L and 0.49±0.087 L, respectively (p>0.05 between
groups, Figure 4).
Total ventilation (VE) was similar for both self- and device-guided breathing during baseline at
6.172±0.35 L/min and 6.176±0.82 L/min, respectively (p=0.498). VE was increased in the
device-guided condition during condition breathing at 7.41±0.69 L/min (p=0.056 compared to
baseline) compared to self-guided condition breathing at 5.430± 0.364 L/min (p>0.01). During
recovery, both groups returned to baseline ventilation levels and did not differ from each other:

19
5.919±0.721 (p=0.322 compared to baseline) and 6.335±1.000 (p=0.300 compared to baseline)
L/min respectively (p=0.368 between conditions, Figure 5).
Specific Aim I
Aim I: To determine if device-guided and self-guided breathing result in different physiological
outcomes.
Self-guided and device-guided conditions do not statistically differ (p>0.05) nor come
statistically close to differing from each other (p>0.1) in any study phase (baseline, condition
start, condition end, recovery start, recovery end) unless explicitly stated. Similarly, within-
condition differences to baseline during study phases are either statistically insignificant (p>0.05)
and/or are not statistically close to significance (p>0.1) unless explicitly stated.
Changes in systolic blood pressure (SBP) from baseline for self-guided breathing during the start
of condition, end of condition, start of recovery, and end of recovery was -1.4±1.6, -3.5±2.4
(p=0.018 compared to baseline), -3.9±2.2 (p=0.003 compared to baseline), and -1.9±1.7 mmHg
(p=0.0332 compared to baseline), respectively. Changes in SBP from baseline in device-guided
breathing during the start of condition, end of condition, start of recovery, and end of recovery
was 0.0±1.5, -0.4±2.4, -0.7±2.3, and +0.3±1.6 mmHg, respectively. During the end of condition
breathing, self-guided and device-guided breathing were not statistically different (p=0.138),
though the means differed by a clinically relevant 3.2 mmHg (Figure 6).
Changes in diastolic blood pressure (DBP), from baseline for self-guided breathing during the
start of condition, end of condition, start of recovery, and end of recovery was +0.1±0.7, -1.8±0.8
(p=0.019 compared to baseline), -2.0±0.9, and -1.0±1.4 mmHg, respectively. Changes in DBP
during device-guided breathing during the start of condition, end of condition, start of recovery,

20
and end of recovery was -1.8±0.6 (p=0.008 compared to baseline), -0.6±1.0, -0.3±1.0, and -
0.6±1.4 mmHg, respectively. During the start of the condition, device-guided breathing had a
significantly greater drop in blood pressure compared to the self-guided condition (p=0.036
between conditions) (Figure 7).
Changes in mean arterial pressure (MAP), from baseline for self-guided breathing during the
start of condition, end of condition, start of recovery, and end of recovery was -0.4±2.3, -2.3±2.0
(p=0.004 compared to baseline), -2.6±2.1 (p=0.013 compared to baseline), and -1.4±3.1 mmHg,
respectively. Changes in MAP during device-guided breathing during the start of condition, end
of condition, start of recovery, and end of recovery was -1.2±2.3 (p=0.045 compared to
baseline), -0.5±1.9, -0.4±1.9, and -0.3±3.0 mmHg, respectively (Figure 8).
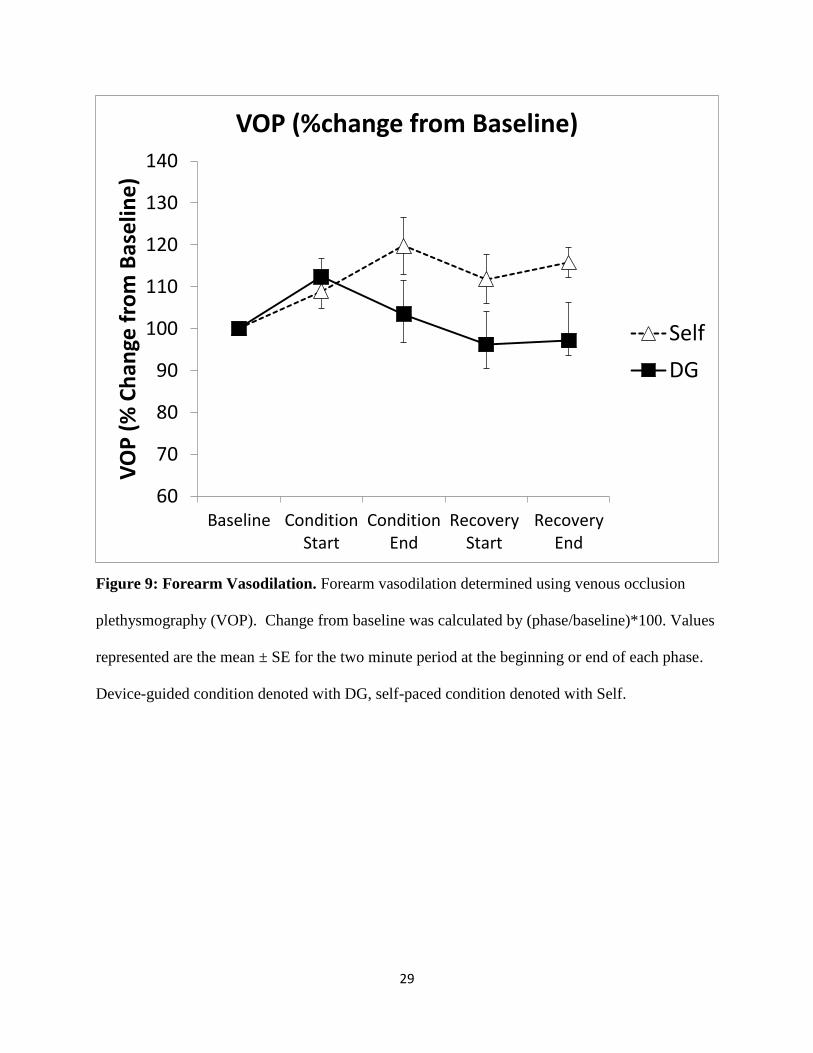
Change in forearm blood flow, as percentage changes from baseline, for self-guided breathing
during the start of condition, end of condition, start of recovery, and end of recovery was
108.9±4.2 (p=0.030 compared to baseline), 119.8±8.0 (p=0.018 compared to baseline),
111.8±7.8, and 115.8±9.0 %, respectively. Forearm blood flow for device-guided breathing
during the start of condition, end of condition, start of recovery, and end of recovery was
112.4±4.1 (p=0.025 compared to baseline), 103.5±6.8, 96.2±5.8, and 97.2±3.5 %, respectively.
During the recovery end phase, the self-guided condition had significantly higher forearm blood
flow than the device-guided group (p=0.039) (Figure 9).
Change in heart rate, as percentage change from baseline, for self-guided breathing during the
start of condition, end of condition, start of recovery, and end of recovery was 101.5±1.4,
98.7±1.8, 99.0±1.5, and 97.5±1.7 %, respectively. Change in heart rate for device-guided
breathing during the start of condition, end of condition, start of recovery, and end of recovery
was 105.3±1.7 (p=0.007 compared to baseline), 98.6±5.2, 99.8±2.7, and 99.2± 1.9%,

21
respectively. At the condition start phase, device-guided breathing had a significantly higher
change in heart rate than the self-guided condition (p=0.047) (Figure 10).
Specific Aim II
Aim II: To determine if psychological metrics are correlated to a reduction in blood pressure
during slow pace breathing.
All changes in blood pressure used for testing correlation with psychological metrics are
referring to a change in MAP from the average of the last two minutes of baseline to the average
of the last two minutes of condition breathing.
Before the study, anxiety levels as determined by the STAI-S were not different between groups,
30.54±2.23 for the self-guided group and 32.5±3.08 for the device-guided group (p=0.304
between groups). After the study, anxiety levels decreased to 26.00±1.24 for self-guided
(p=0.024 pre vs. post) and 28.5±1.81 for device-guided (p=0.038 pre vs. post, p=0.131 between
groups) (Figure 11).
Trait anxiety as determined by the STAI-T was found to be highest in participants whose blood
pressure did not fall in response to self-guided breathing conditions (r=0.452, p=0.081). There
was no correlation found with device-guided conditions (r=-0.301, p=0.199) (Figure 12).
Cognitive failures was found to be highest in participants whose blood pressure did not respond
to self-guided breathing conditions (r=0.498, p=0.059). There was no correlation found with
device-guided conditions (r=0.0923, p=0.400) (Figure 13).
Observational mindfulness was found to be highest in participants whose blood pressure did not
respond to device-guided breathing conditions (r=0.405, p=0.123). There was no correlation
found with self-guided conditions (r=-0.246, p=0.233) (Figure 14).

22
Acting without awareness, a trait associated with no thinking about your actions before and
during their execution, was found to correlate with a lack of response in blood pressure in self-
guided participants (r=0.683, p<0.01). Acting without awareness was found to correlate with a
reduction in blood pressure in device-guided participants (r=-0.472, p=.084) (Figure 15).

23
Figure 3: Respiratory Rate. Respiratory rate determined using double pneumobelts. Bars
represent the mean ± SE of each entire phase. (# indicates p<0.05 between the two conditions at
the given phase, * indicates p<0.05 between the current phase and baseline for the same
condition). Device-guided condition denoted with DG, self-paced condition denoted with Self.
0
2
4
6
8
10
12
14
16
18
Baseline Condition Recovery
Bre
ath
ing
Rat
e (
Bre
ath
s/M
in)
Respiratory Rate
Self
DG
*
*
#
24
Figure 4: Tidal Volume. Tidal volumes determined using calibrated double pnuemobelts.
Values shown are the mean ± SE of the entire duration of the condition. (# indicates p<0.05
between the two conditions at the given phase, * indicates p<0.05 between the current phase and
baseline for the same condition). Device-guided condition denoted with DG, self-paced
condition denoted with Self.
0
0.2
0.4
0.6
0.8
1
1.2
1.4
1.6
Baseline Condition Recovery
Tid
al V
olu
me
(Li
ters
) Tidal Volume
Self
DG
#
*
*

25
Figure 5: Ventilation. Ventilation (VE) (breathing rate x tidal volume). Breathing rate and tidal
volumes determined using double pnuemobelts were manually multiplied for VE calculation.
Values shown are the mean ± SE of the entire duration of the condition. (# indicates p<0.05
between the two conditions at the given phase, * indicates p<0.05 between the current phase and
baseline for the same condition, & indicates p=0.056). Device-guided condition denoted with
DG, self-paced condition denoted with Self.
0
1
2
3
4
5
6
7
8
9
10
Baseline Condition Recovery
Ve
nti
lati
on
(Li
ters
/min
) Ventilation
Self
DG
#
*
&

26
Figure 6: Systolic Blood Pressure. Systolic blood pressure determined using a finometer.
Values represented are the mean ± SE for the two minute period at the beginning or end of each
phase. Device-guided condition denoted with DG, self-paced condition denoted with Self.
-7
-6
-5
-4
-3
-2
-1
0
1
2
3
Baseline ConditionStart
ConditionEnd
RecoveryStart
RecoveryEnd
Ch
ange
in B
loo
d P
ress
ure
(m
mH
g)
Systolic Blood Pressure
Self
DG

27
Figure 7: Diastolic Blood Pressure. Diastolic blood pressure determined using a finometer.
Values represented are the mean ± SE for the two minute period at the beginning or end of each
phase. Device-guided condition denoted with DG, self-paced condition denoted with Self.
-4.0
-3.5
-3.0
-2.5
-2.0
-1.5
-1.0
-0.5
0.0
0.5
1.0
1.5
Baseline ConditionStart
ConditionEnd
RecoveryStart
RecoveryEnd
Ch
ange
in B
loo
d P
ress
ure
(m
mH
g)
Diastolic Blood Pressure
Self
DG

28
Figure 8: Mean Arterial Blood Pressure: Mean arterial pressure was calculated by adding
(2/3*Diastolic) and (1/3*Systolic). Diastolic and systolic values determined using a finometer.
Values represented are the mean ± SE for the two minute period at the beginning or end of each
phase. Device-guided condition denoted with DG, self-paced condition denoted with Self.
-4.0
-3.0
-2.0
-1.0
0.0
1.0
2.0
Baseline ConditionStart
ConditionEnd
RecoveryStart
RecoveryEnd
Ch
ange
in B
loo
d P
ress
ure
(m
mH
g)
Mean Arterial Pressure
Self
DG
29
Figure 9: Forearm Vasodilation. Forearm vasodilation determined using venous occlusion
plethysmography (VOP). Change from baseline was calculated by (phase/baseline)*100. Values
represented are the mean ± SE for the two minute period at the beginning or end of each phase.
Device-guided condition denoted with DG, self-paced condition denoted with Self.
60
70
80
90
100
110
120
130
140
Baseline ConditionStart
ConditionEnd
RecoveryStart
RecoveryEnd
VO
P (
% C
han
ge f
rom
Bas
elin
e)
VOP (%change from Baseline)
Self
DG

30
Figure 10: Heart Rate. Heart rate determined using ECG lead II. Values represented are the
mean ± SE for the entirety of the phase. (# indicates p<0.05 between the two conditions at the
given phase, * indicates p<0.05 between the current phase and baseline for the same condition).
Device-guided condition denoted with DG, self-paced condition denoted with Self.
90
92
94
96
98
100
102
104
106
108
Baseline ConditionStart
ConditionEnd
RecoveryStart
RecoveryEnd
Ch
ange
in H
ear
t R
ate
(%
fro
m
Bas
elin
e)
Heart Rate
Self
DG
*#

31
Figure 11: State Anxiety. State-Trait Anxiety Inventory – State was administered before and
after the study. Values shown are the mean ± SE. (# indicates p<0.05 between the two conditions
at the given time point, * indicates p<0.05 between the two different time point, same condition).
Device-guided condition denoted with DG, self-paced condition denoted with Self.
0
5
10
15
20
25
30
35
40
PRE POST
STA
I-s
Sco
re
STAI
Self
DG
*
*

32
Figure 12: Trait Anxiety. STAI-T administered post-study. Pearson correlations listed below.
A) STAI-T scores positively correlate with change in MAP in self-paced conditions(r=0.452,
p=0.081). B) STAI-T scores weakly negatively correlate with change in MAP in device-guided
conditions(r=-0.301, p=0.199). Device-guided condition denoted with DG, self-paced condition
denoted with Self.
-8
-6
-4
-2
0
2
0 10 20 30 40 50
Ch
ange
in M
ean
A
rter
ial P
ress
ure
(m
mH
g)
STAI-T Anxiety Score
A: Self: STAI-T
-8
-6
-4
-2
0
2
0 10 20 30 40 50
Ch
ange
in M
ean
A
rter
ial P
ress
ure
(m
mH
g)
STAI-T Anxiety Score
B: DG: STAI-T

33
Figure 13: Cognitive Failure. Cognitive failure questionnaire (CFQ) administered post-study.
Pearson correlations listed below. A) CFQ scores positively correlated with change in MAP in
self-paced conditions (r=0.498, p=0.059). B) CFQ score did not correlate with change in MAP in
device-guided conditions (r=0.092, p=0.400). Device-guided condition denoted with DG, self-
paced condition denoted with Self.
-8
-6
-4
-2
0
2
0 10 20 30 40 50 60
Ch
ange
in M
ean
A
rter
ial P
ress
ure
(m
mH
g)
CFQ Cognitive Failure Score
A: Self: CFQ
-8-6-4-202
0 10 20 30 40 50 60
Ch
ange
in M
ean
A
rter
ial P
ress
ure
(m
mH
g)
CFQ Cognitive Failure Score
B: DG: CFQ

34
Figure 14: Observational Mindfulness. Five-facet mindfulness questionnaire (FFMQ) was
administered post study. Pearson correlations listed below. A) FFMQ-observation scores weakly
negatively correlated with change in MAP in self-paced conditions(r=-0.246, p=0.233). B)
FFMQ-observation scores moderately positively correlated with change in MAP in device-
guided conditions (r=0.405, p=0.123). Device-guided condition denoted with DG, self-paced
condition denoted with Self.
-8
-6
-4
-2
0
2
0 1 2 3 4 5
Ch
ange
in M
ean
A
rter
ial P
ress
ure
(m
mH
g)
5 Facet Observation Score
A: Self: Observational Mindfulness
-8
-6
-4
-2
0
2
0 1 2 3 4 5
Ch
ange
in M
ean
A
rter
ial P
ress
ure
(m
mH
g)
5 Facet Observation Score
B: DG: Observational Mindfulness

35
Figure 15: Acting Without Awareness. Five-facet mindfulness questionnaire (FFMQ) was
administered post study. Pearson correlations listed below. A) FFMQ-act without awareness
scores positively correlated with a change in MAP in self-paced conditions (r=0.683, p=0.010).
B) FFMQ-act without awareness scores negatively correlated with a change in MAP in device-
guided conditions (r=-0.472, p=0.084). Device-guided condition denoted with DG, self-paced
condition denoted with Self.
-8
-6
-4
-2
0
2
0 1 2 3 4 5
Ch
ange
in M
ean
A
rter
ial P
ress
ure
(m
mH
g)
5 Facet Anti-Awareness Score
A: Self: Acting Without Awareness
-8
-6
-4
-2
0
2
0 1 2 3 4 5 6
Ch
ange
in M
ean
A
rter
ial P
ress
ure
(m
mH
g)
5 Facet Awareness Score
B: DG: Acting Without Awareness

36
Discussion
Slow-paced breathing has been used for thousands of years and has amassed anecdotal evidence
for its effects on stress reduction. Due to recent attempts to replicate self-paced breathing
maneuvers with devices, and their mixed results in recent studies, we looked at the differences
between self-guided and device-guided slow breathing practices and the psychological
correlates. We hypothesized that slow-breathing exercises would result in a reduction in blood
pressure, that self-paced slow breathing would be more effective than device-guided breathing,
and that psychological metrics could explain the variability in responses to each condition. Our
data supported our hypotheses. Diastolic blood pressure, systolic blood pressure and mean
arterial pressure were reduced in the self-guided condition but not the device-guided condition.
Trait anxiety, cognitive interference, observational mindfulness, and acting without awareness all
were predictive of blood pressure responses in either device-guided or self-guided practices. In
all, device-guided slow breathing and self-guided slow breathing are inherently different
maneuvers with different outcomes and psychological predictors.
In both self and device-guided conditions during the slow breathing phase, breathing rate was
reduced and tidal volume increased (Figure 3, 4). VE increased during device-guided breathing,
but decreased during self-paced breathing (Figure 5). The device-guided group had a lower
breathing rate, higher tidal volume and higher ventilation during slow breathing than the self-
paced breathing (Figures 3, 4, 5). During device-guided breathing, there is a possibility that
arterial oxygen and carbon dioxide levels are altered, which could cause changes in chemoreflex
function not seen in the self-guided group. This is another aspect where the two breathing
practices may differ, as self-paced breathing practices allow participants to alter their blood gas
levels through modulation of their breathing rate.

37
We attribute these differences between conditions in breathing rate, tidal volume, and ventilation
to the instructions given to participants for their slow breathing phases. Device-guided
participants reduced their breathing to exactly 6 breaths/min by matching to the musical tones
that were played to this cadence. Subjects were breathing, either inhaling or exhaling, during the
entire 5 second duration of the continuous tone played during to mark the inspiratory/expiratory
phases, producing a very low standard error for breathing rate, a higher tidal volume and higher
VE. Self-paced participants varied in their slow breathing patterns based on individual
preference, and were able to breathe at a comfortable depth and rate as long as it was slower than
their regular breathing rate. It is arguable that the drop in breathing rate in the device-guided
condition may have induced stress in some participants, preventing reductions in blood pressure.
While six breaths per minute is not necessarily strenuous for most people, perhaps there is an
optimal rate for each person that should be explored further, perhaps by instructing participants
to first perform self-guided breathing to find a comfortable slow breathing rate, then syncing the
device to this cadence.
The self-guided condition resulted in a reduction in systolic blood pressure with a persistence of
this effect lasting into the recovery period, whereas device-guided breathing resulted in systolic
blood pressure remaining at baseline levels throughout the entirety of the study (Figure 7),
suggesting that self-paced breathing on average may be more effective in reducing blood
pressure.
The reduction in diastolic and mean arterial blood pressure seen in the device-guided group at
the beginning of the condition (Figures 6, 8) is likely an immediate response to the deep
breathing practice that is quickly compensated for through baroreflex mechanisms over the
course of condition breathing. Self-guided reductions in diastolic and mean arterial pressure do

38
not immediately present themselves at the onset of condition breathing, but drop during the
condition breathing and persist through recovery (Figures 6, 8). This could also potentially be
due to a change in baroreflex function, including a change in the operating point and/or a change
in sensitivity, though this has not been confirmed and requires further investigation.
Supporting the idea of differential baroreflex influence on changes in blood pressure, there is an
increase in heart rate alongside the decrease in mean arterial and diastolic blood pressure that
occurs immediately after the onset of slow breathing in the device-guided group (Figure 10),
which would be expected due to baroreflex functioning. In self-paced breathing, heart rate does
not change instead of increasing, potentially allowing for a decrease in diastolic and mean
arterial blood pressure. This is suggestive of a change in the operating point of the baroreflex, as
otherwise heart rate would increase. This would need to be confirmed in future studies.
These data concerning blood pressure reductions during self-paced breathing maneuvers (Figures
6, 7, 8) support previous studies on the acute effects of yoga breathing (Raghuraj and Telles
2008, Bhavanani, Madanmohan et al. 2012), and though the current study was an acute study, its
findings also support previous studies on the effects of chronic yoga breathing (Sundar, Agrawal
et al. 1984, McCaffrey, Ruknui et al. 2005, Upadhyay Dhungel, Malhotra et al. 2008).
The results regarding device-guided breathing and lack of reduction in blood pressure (Figure 6,
7, 8) are difficult to compare to previous studies. This is because the present study used young,
healthy men, and previous studies used older, hypertensive men (and in some cases, women).
Setting this aside, our data supports previous studies that show that device-guided breathing does
not reduce blood pressure (Altena, Kleefstra et al. 2009, Anderson, McNeely et al. 2010, Hering,
Kucharska et al. 2013), and contradicts the studies that show a reduction in blood pressure
(Grossman, Grossman et al. 2001, Schein, Gavish et al. 2001, Viskoper, Shapira et al. 2003,

39
Elliot, Izzo et al. 2004, Meles, Giannattasio et al. 2004, Schein, Gavish et al. 2009, Oneda,
Ortega et al. 2010, Bertisch, Schomer et al. 2011).
The increase in forearm blood flow in the self-guided condition (Figure 9) indicates that there is
a reduction in sympathetic outflow, resulting in a decrease in vasoconstriction in the forearm.
This is consistent with previous findings of reductions in sympathetic nerve activity in self-paced
breathing practiced (Pal, Velkumary et al. 2004). There is no increase in forearm blood flow in
the device-guided group (Figure 9), indicating no change in sympathetic outflow. Because
forearm blood flow is determined by vasodilation and vasoconstriction, it is intimately related to
sympathetic nerve activity. Thus, the lack of increase in forearm blood flow contradicts previous
work that shows a decrease in MSNA activity due to device-guided breathing slow breathing
(Hering, Kucharska et al. 2013, Harada, Asanoi et al. 2014).
We examined several psychological metrics in attempts to reveal predictor variables for success
in reduction of blood pressure in response to these breathing practices. Both groups had a
reduction in state anxiety after the study compared to before (Figure 11), despite no correlation
between reduction of anxiety and reduction in blood pressure (data not shown). Trait anxiety was
predictive of blood pressure reductions in both groups (Figure 12). It appears that the more
anxious a person is, the worse they will respond with a self-paced practice, but they will perform
better on a device-guided maneuver. We suggest that this is because highly anxious people need
guidance in performing a task so that they are validated that they are doing what is being asked.
High levels of cognitive failures were predictive of poor responses in blood pressure in self-
paced groups, but were not correlated with device-guided groups (Figure 13). This makes sense,
as those with high levels of cognitive failures may forget to follow instructions and not adhere to
the protocol, resulting in blunted results. This goes hand-in-hand with acting without awareness,

40
as those with higher levels of this trait are not attentive to what they are doing and thus may
forget. Interestingly, those who act without awareness performed better on device-guided
breathing (Figure 15), suggesting that not thinking about the protocol while doing it is best.
Higher levels of observational mindfulness, or your awareness to your body and surroundings,
were prognostic of poor responses to device-guided breathing (Figure 14). We suggest that this is
due to a focus shift from the body to an external device, which could be potentially invasive to a
highly mindful person.

41
Conclusion
Our data shows that there are physiological and psychological differences between device-
guided and self-paced breathing practices. This provides support to the idea that devices used to
help reduce breathing rate in hopes to replicate the successes of self-paced breathing may not be
appropriate in some cases. Our psychological data suggests that there are several metrics that a
patient could be screened for prior to prescribing a slow-paced breathing practice in order to
improve efficacy and successfully reduce blood pressure. Further studies should be done to
understand the mechanisms behind the phenomenon of divergent physiological responses to
these two seemingly similar maneuvers.

42
REFERENCES

43
REFERENCES
Altena, M. R., N. Kleefstra, S. J. Logtenberg, K. H. Groenier, S. T. Houweling and H. J. Bilo
(2009). "Effect of device-guided breathing exercises on blood pressure in patients with
hypertension: a randomized controlled trial." Blood Press 18(5): 273-279.
Anderson, D. E., J. D. McNeely and B. G. Windham (2010). "Regular slow-breathing exercise
effects on blood pressure and breathing patterns at rest." J Hum Hypertens 24(12): 807-
813.
Bertisch, S. M., A. Schomer, E. E. Kelly, L. A. Baloa, L. E. Hueser, S. D. Pittman and A.
Malhotra (2011). "Device-guided paced respiration as an adjunctive therapy for
hypertension in obstructive sleep apnea: a pilot feasibility study." Appl Psychophysiol
Biofeedback 36(3): 173-179.
Bhavanani, A. B., Madanmohan and Z. Sanjay (2012). "Immediate effect of chandra nadi
pranayama (left unilateral forced nostril breathing) on cardiovascular parameters in
hypertensive patients." Int J Yoga 5(2): 108-111.
Brook, R. D., L. J. Appel, M. Rubenfire, G. Ogedegbe, J. D. Bisognano, W. J. Elliott, F. D.
Fuchs, J. W. Hughes, D. T. Lackland, B. A. Staffileno, R. R. Townsend and S.
Rajagopalan (2013). "Beyond medications and diet: alternative approaches to lowering
blood pressure: a scientific statement from the american heart association." Hypertension
61(6): 1360-1383.
Brown, K. W., N. Weinstein and J. D. Creswell (2012). "Trait mindfulness modulates
neuroendocrine and affective responses to social evaluative threat."
Psychoneuroendocrinology 37(12): 2037-2041.
Charkoudian, N., E. Gusman, M. J. Joyner, B. G. Wallin and J. Osborn (2010). "Integrative
mechanisms of blood pressure regulation in humans and rats: cross-species similarities."
Am J Physiol Regul Integr Comp Physiol 298(3): R755-759.
Creswell, J. D., B. M. Way, N. I. Eisenberger and M. D. Lieberman (2007). "Neural correlates of
dispositional mindfulness during affect labeling." Psychosom Med 69(6): 560-565.
Eckberg, D. L. (2003). "The human respiratory gate." J Physiol 548(Pt 2): 339-352.
Eckberg, D. L., Y. T. Kifle and V. L. Roberts (1980). "Phase relationship between normal human
respiration and baroreflex responsiveness." J Physiol 304: 489-502.
Eckberg, D. L. and C. R. Orshan (1977). "Respiratory and baroreceptor reflex interactions in
man." J Clin Invest 59(5): 780-785.
Elliot, W. J., J. L. Izzo, Jr., W. B. White, D. R. Rosing, C. S. Snyder, A. Alter, B. Gavish and H.
R. Black (2004). "Graded blood pressure reduction in hypertensive outpatients associated

44
with use of a device to assist with slow breathing." J Clin Hypertens (Greenwich) 6(10):
553-559; quiz 560-551.
Feldman, J. L. and C. A. Del Negro (2006). "Looking for inspiration: new perspectives on
respiratory rhythm." Nat Rev Neurosci 7(3): 232-242.
Gray, P. A., W. A. Janczewski, N. Mellen, D. R. McCrimmon and J. L. Feldman (2001).
"Normal breathing requires preBotzinger complex neurokinin-1 receptor-expressing
neurons." Nat Neurosci 4(9): 927-930.
Grossman, E., A. Grossman, M. H. Schein, R. Zimlichman and B. Gavish (2001). "Breathing-
control lowers blood pressure." J Hum Hypertens 15(4): 263-269.
Guertzenstein, P. G. and A. Silver (1974). "Fall in blood pressure produced from discrete regions
of the ventral surface of the medulla by glycine and lesions." J Physiol 242(2): 489-503.
Harada, D., H. Asanoi, J. Takagawa, H. Ishise, H. Ueno, Y. Oda, Y. Goso, S. Joho and H. Inoue
(2014). "Slow and deep respiration suppresses steady-state sympathetic nerve activity in
patients with chronic heart failure: from modeling to clinical application." Am J Physiol
Heart Circ Physiol 307(8): H1159-1168.
Hering, D., W. Kucharska, T. Kara, V. K. Somers, G. Parati and K. Narkiewicz (2013). "Effects
of acute and long-term slow breathing exercise on muscle sympathetic nerve activity in
untreated male patients with hypertension." J Hypertens 31(4): 739-746.
Huang, A. J. and L. L. Subak (2014). "What constitutes an adequate evaluation of device-guided
breathing?" JAMA Intern Med 174(4): 637.
Jacobs, T. L., P. R. Shaver, E. S. Epel, A. P. Zanesco, S. R. Aichele, D. A. Bridwell, E. L.
Rosenberg, B. G. King, K. A. Maclean, B. K. Sahdra, M. E. Kemeny, E. Ferrer, B. A.
Wallace and C. D. Saron (2013). "Self-reported mindfulness and cortisol during a
Shamatha meditation retreat." Health Psychol 32(10): 1104-1109.
Janczewski, W. A. and J. L. Feldman (2006). "Distinct rhythm generators for inspiration and
expiration in the juvenile rat." J Physiol 570(Pt 2): 407-420.
Landman, G. W., I. Drion, K. J. van Hateren, P. R. van Dijk, S. J. Logtenberg, J. Lambert, K. H.
Groenier, H. J. Bilo and N. Kleefstra (2013). "Device-guided breathing as treatment for
hypertension in type 2 diabetes mellitus: a randomized, double-blind, sham-controlled
trial." JAMA Intern Med 173(14): 1346-1350.
McCaffrey, R., P. Ruknui, U. Hatthakit and P. Kasetsomboon (2005). "The effects of yoga on
hypertensive persons in Thailand." Holist Nurs Pract 19(4): 173-180.
Meles, E., C. Giannattasio, M. Failla, G. Gentile, A. Capra and G. Mancia (2004).
"Nonpharmacologic treatment of hypertension by respiratory exercise in the home
setting." Am J Hypertens 17(4): 370-374.

45
Mellen, N. M., W. A. Janczewski, C. M. Bocchiaro and J. L. Feldman (2003). "Opioid-induced
quantal slowing reveals dual networks for respiratory rhythm generation." Neuron 37(5):
821-826.
Mellen, N. M. and M. Thoby-Brisson (2012). "Respiratory circuits: development, function and
models." Curr Opin Neurobiol 22(4): 676-685.
Moraes, D. J., L. G. Bonagamba, D. B. Zoccal and B. H. Machado (2011). "Modulation of
respiratory responses to chemoreflex activation by L-glutamate and ATP in the rostral
ventrolateral medulla of awake rats." Am J Physiol Regul Integr Comp Physiol 300(6):
R1476-1486.
Moraes, D. J., M. P. da Silva, L. G. Bonagamba, A. S. Mecawi, D. B. Zoccal, J. Antunes-
Rodrigues, W. A. Varanda and B. H. Machado (2013). "Electrophysiological properties
of rostral ventrolateral medulla presympathetic neurons modulated by the respiratory
network in rats." J Neurosci 33(49): 19223-19237.
Mozer, M., P. Fadel, C. Johnson, N. C. B Wallin, J. Drobish, M. Joyner and E. Wehrwein
(2014). "Acute slow-paced breathing increases periods of sympathetic nervous system
quiescence." The FASEB Journal 28(1): Supplement 1170.1112.
Narkiewicz, K., P. van de Borne, N. Montano, D. Hering, T. Kara and V. K. Somers (2006).
"Sympathetic neural outflow and chemoreflex sensitivity are related to spontaneous
breathing rate in normal men." Hypertension 47(1): 51-55.
Okon-Singer, H., J. Mehnert, J. Hoyer, L. Hellrung, H. L. Schaare, J. Dukart and A. Villringer
(2014). "Neural control of vascular reactions: impact of emotion and attention." J
Neurosci 34(12): 4251-4259.
Oneda, B., K. C. Ortega, J. L. Gusmao, T. G. Araujo and D. Mion, Jr. (2010). "Sympathetic
nerve activity is decreased during device-guided slow breathing." Hypertens Res 33(7):
708-712.
Pal, G. K., S. Velkumary and Madanmohan (2004). "Effect of short-term practice of breathing
exercises on autonomic functions in normal human volunteers." Indian J Med Res 120(2):
115-121.
Raghuraj, P. and S. Telles (2008). "Immediate effect of specific nostril manipulating yoga
breathing practices on autonomic and respiratory variables." Appl Psychophysiol
Biofeedback 33(2): 65-75.
Ramirez, J. M., E. J. Zuperku, G. F. Alheid, S. P. Lieske, K. Ptak and D. R. McCrimmon (2002).
"Respiratory rhythm generation: converging concepts from in vitro and in vivo
approaches?" Respir Physiol Neurobiol 131(1-2): 43-56.
Richter, D. W. and K. M. Spyer (2001). "Studying rhythmogenesis of breathing: comparison of
in vivo and in vitro models." Trends Neurosci 24(8): 464-472.

46
Ross, C. A., D. A. Ruggiero, D. H. Park, T. H. Joh, A. F. Sved, J. Fernandez-Pardal, J. M.
Saavedra and D. J. Reis (1984). "Tonic vasomotor control by the rostral ventrolateral
medulla: effect of electrical or chemical stimulation of the area containing C1 adrenaline
neurons on arterial pressure, heart rate, and plasma catecholamines and vasopressin." J
Neurosci 4(2): 474-494.
Schein, M. H., B. Gavish, T. Baevsky, M. Kaufman, S. Levine, A. Nessing and A. Alter (2009).
"Treating hypertension in type II diabetic patients with device-guided breathing: a
randomized controlled trial." J Hum Hypertens 23(5): 325-331.
Schein, M. H., B. Gavish, M. Herz, D. Rosner-Kahana, P. Naveh, B. Knishkowy, E. Zlotnikov,
N. Ben-Zvi and R. N. Melmed (2001). "Treating hypertension with a device that slows
and regularises breathing: a randomised, double-blind controlled study." J Hum
Hypertens 15(4): 271-278.
Smith, J. C., H. H. Ellenberger, K. Ballanyi, D. W. Richter and J. L. Feldman (1991). "Pre-
Botzinger complex: a brainstem region that may generate respiratory rhythm in
mammals." Science 254(5032): 726-729.
Smith, J. C., J. J. Greer, G. S. Liu and J. L. Feldman (1990). "Neural mechanisms generating
respiratory pattern in mammalian brain stem-spinal cord in vitro. I. Spatiotemporal
patterns of motor and medullary neuron activity." J Neurophysiol 64(4): 1149-1169.
Sun, Q. J., J. Minson, I. J. Llewellyn-Smith, L. Arnolda, J. Chalmers and P. Pilowsky (1997).
"Botzinger neurons project towards bulbospinal neurons in the rostral ventrolateral
medulla of the rat." J Comp Neurol 388(1): 23-31.
Sundar, S., S. K. Agrawal, V. P. Singh, S. K. Bhattacharya, K. N. Udupa and S. K. Vaish (1984).
"Role of yoga in management of essential hypertension." Acta Cardiol 39(3): 203-208.
Tomfohr, L. M., M. A. Pung, P. J. Mills and K. Edwards (2015). "Trait mindfulness is associated
with blood pressure and interleukin-6: exploring interactions among subscales of the Five
Facet Mindfulness Questionnaire to better understand relationships between mindfulness
and health." J Behav Med 38(1): 28-38.
Upadhyay Dhungel, K., V. Malhotra, D. Sarkar and R. Prajapati (2008). "Effect of alternate
nostril breathing exercise on cardiorespiratory functions." Nepal Med Coll J 10(1): 25-27.
Viskoper, R., I. Shapira, R. Priluck, R. Mindlin, L. Chornia, A. Laszt, D. Dicker, B. Gavish and
A. Alter (2003). "Nonpharmacologic treatment of resistant hypertensives by device-
guided slow breathing exercises." Am J Hypertens 16(6): 484-487.
Wallin, B. G. and D. L. Eckberg (1982). "Sympathetic transients caused by abrupt alterations of
carotid baroreceptor activity in humans." Am J Physiol 242(2): H185-190.
Yasuma, F. and J. Hayano (2004). "Respiratory sinus arrhythmia: why does the heartbeat
synchronize with respiratory rhythm?" Chest 125(2): 683-690.

47
Zoccal, D. B., W. I. Furuya, M. Bassi, D. S. Colombari and E. Colombari (2014). "The nucleus
of the solitary tract and the coordination of respiratory and sympathetic activities." Front
Physiol 5: 238.