Embed Size (px)
Citation preview
Differential Entropy in Wavelet Sub-Band for Assessmentof Glaucoma
Malaya Kumar Nath, Samarendra Dandapat
Department of Electronics and Electrical Engineering, IIT Guwahati, Guwahati, Assam, India
Received 23 April 2012; revised 18 May 2012; accepted 24 May 2012
ABSTRACT: Glaucoma is an eye disease that causes progressive
optic neuropathy and vision loss due to degeneration of the opticnerves. Cup to disc ratio (CDR) is the standard measure for evaluation
of glaucoma. It is difficult to estimate the value of CDR if the bounda-
ries of cup and disc are not well defined. In this work, we propose anovel method based on differential entropy (DE) for evaluation of
glaucoma. DE can be used as a measure of glaucoma as it is propor-
tional to the probability of number of glaucoma pixels in wavelet sub-
bands. It has been shown that DE or negentropy value of 0.25 as anoptimum threshold for glaucoma detection. This method is evaluated
and its performance is compared with three existing methods using
54 retinal images. The proposed method shows the best result with
an accuracy value of 92.59%. VVC 2012 Wiley Periodicals, Inc. Int J Imag-
ing Syst Technol, 22, 161–165, 2012; Published online in Wiley Online Library
(wileyonlinelibrary.com). DOI 10.1002/ima.22017
Key words: glaucoma; differential entropy; cup to disc ratio; wavelet
sub-band
I. INTRODUCTION
Glaucoma (Leite et al., 2011) is the leading cause of blindness after
diabetic retinopathy (Niemeijer et al., 2010) worldwide. It occurs
due to the elevated intraocular pressure (IOP) exerted by aqueous
humor of the eye (Schacknow and Samples, 2010). IOP can be
measured by Tonometry, Goldman Applanation Tonometry, and
Tonopen. These methods of defining glaucoma do not provide accu-
rate measurement always, as tissue damage does not have a direct
relation with IOP. So, IOP cannot be used as a standard measure for
glaucoma. It is a critical job for the doctors to detect the vision loss
or glaucoma by measuring IOP (Jonas et al., 1999). Visual field is
more specific indicator than IOP. Visual field test is done by perim-
etry, which document the level of peripheral vision. In this case, the
patient responds to a perceived flash of light by looking at it every
time. The accuracy of the testing depends on patient’s patience,
attention, and retinal sensitivity. Limitations in IOP measurement
and visual field test are reduced by looking at the appearance of
optic disc (OD). Glaucoma affects the structure of optic nerve head
by reducing the neuroretinal rim. Glaucoma minimally affects the
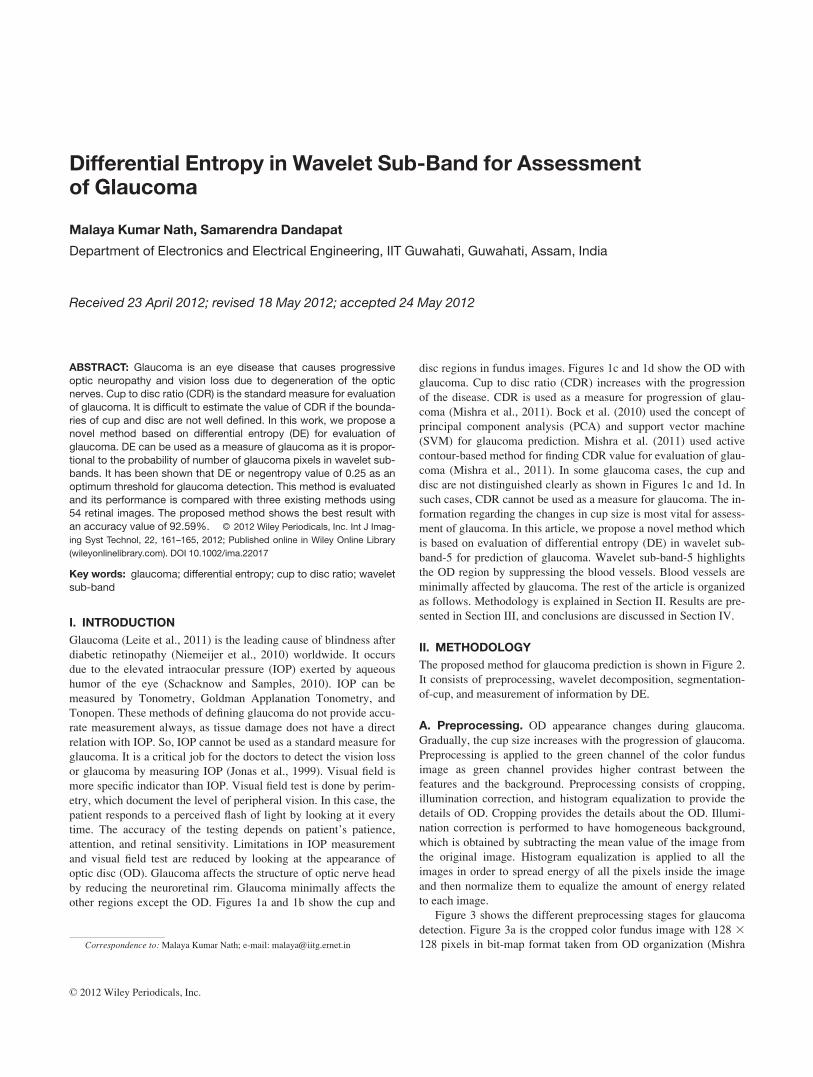
other regions except the OD. Figures 1a and 1b show the cup and
disc regions in fundus images. Figures 1c and 1d show the OD with
glaucoma. Cup to disc ratio (CDR) increases with the progression
of the disease. CDR is used as a measure for progression of glau-
coma (Mishra et al., 2011). Bock et al. (2010) used the concept of
principal component analysis (PCA) and support vector machine
(SVM) for glaucoma prediction. Mishra et al. (2011) used active
contour-based method for finding CDR value for evaluation of glau-
coma (Mishra et al., 2011). In some glaucoma cases, the cup and
disc are not distinguished clearly as shown in Figures 1c and 1d. In
such cases, CDR cannot be used as a measure for glaucoma. The in-
formation regarding the changes in cup size is most vital for assess-
ment of glaucoma. In this article, we propose a novel method which
is based on evaluation of differential entropy (DE) in wavelet sub-
band-5 for prediction of glaucoma. Wavelet sub-band-5 highlights
the OD region by suppressing the blood vessels. Blood vessels are
minimally affected by glaucoma. The rest of the article is organized
as follows. Methodology is explained in Section II. Results are pre-
sented in Section III, and conclusions are discussed in Section IV.
II. METHODOLOGY
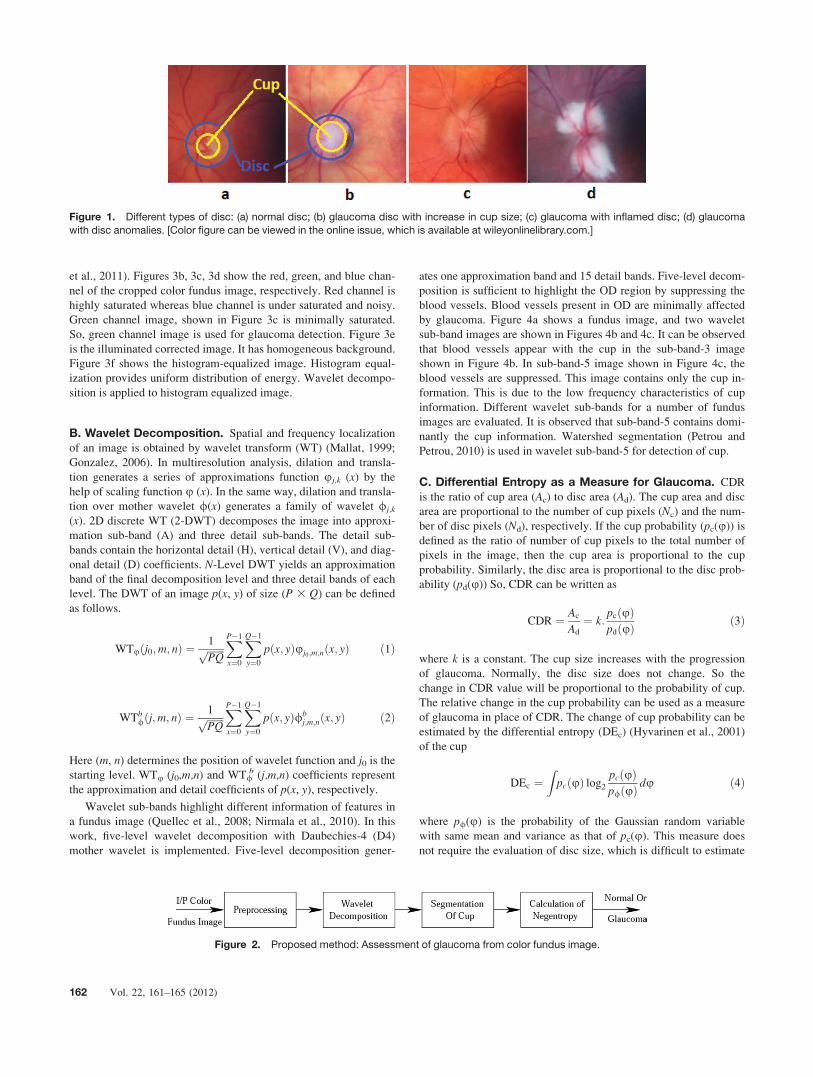
The proposed method for glaucoma prediction is shown in Figure 2.
It consists of preprocessing, wavelet decomposition, segmentation-
of-cup, and measurement of information by DE.
A. Preprocessing. OD appearance changes during glaucoma.
Gradually, the cup size increases with the progression of glaucoma.
Preprocessing is applied to the green channel of the color fundus
image as green channel provides higher contrast between the
features and the background. Preprocessing consists of cropping,
illumination correction, and histogram equalization to provide the
details of OD. Cropping provides the details about the OD. Illumi-
nation correction is performed to have homogeneous background,
which is obtained by subtracting the mean value of the image from
the original image. Histogram equalization is applied to all the
images in order to spread energy of all the pixels inside the image
and then normalize them to equalize the amount of energy related
to each image.
Figure 3 shows the different preprocessing stages for glaucoma
detection. Figure 3a is the cropped color fundus image with 128 3
128 pixels in bit-map format taken from OD organization (MishraCorrespondence to: Malaya Kumar Nath; e-mail: [email protected]
' 2012 Wiley Periodicals, Inc.
et al., 2011). Figures 3b, 3c, 3d show the red, green, and blue chan-
nel of the cropped color fundus image, respectively. Red channel is
highly saturated whereas blue channel is under saturated and noisy.
Green channel image, shown in Figure 3c is minimally saturated.
So, green channel image is used for glaucoma detection. Figure 3e
is the illuminated corrected image. It has homogeneous background.
Figure 3f shows the histogram-equalized image. Histogram equal-
ization provides uniform distribution of energy. Wavelet decompo-
sition is applied to histogram equalized image.
B. Wavelet Decomposition. Spatial and frequency localization
of an image is obtained by wavelet transform (WT) (Mallat, 1999;
Gonzalez, 2006). In multiresolution analysis, dilation and transla-
tion generates a series of approximations function uj,k (x) by the
help of scaling function u (x). In the same way, dilation and transla-
tion over mother wavelet f(x) generates a family of wavelet fj,k
(x). 2D discrete WT (2-DWT) decomposes the image into approxi-
mation sub-band (A) and three detail sub-bands. The detail sub-
bands contain the horizontal detail (H), vertical detail (V), and diag-
onal detail (D) coefficients. N-Level DWT yields an approximation
band of the final decomposition level and three detail bands of each
level. The DWT of an image p(x, y) of size (P 3 Q) can be defined
as follows.
WTuðj0;m; nÞ ¼1ffiffiffiffiffiffiffiPQ
pXP�1
x¼0
XQ�1
y¼0
pðx; yÞuj0;m;nðx; yÞ ð1Þ
WTb/ðj;m; nÞ ¼
1ffiffiffiffiffiffiffiPQ
pXP�1
x¼0
XQ�1
y¼0
pðx; yÞ/bj;m;nðx; yÞ ð2Þ
Here (m, n) determines the position of wavelet function and j0 is thestarting level. WTu (j0,m,n) and WTf
b (j,m,n) coefficients representthe approximation and detail coefficients of p(x, y), respectively.
Wavelet sub-bands highlight different information of features in
a fundus image (Quellec et al., 2008; Nirmala et al., 2010). In this
work, five-level wavelet decomposition with Daubechies-4 (D4)
mother wavelet is implemented. Five-level decomposition gener-
ates one approximation band and 15 detail bands. Five-level decom-
position is sufficient to highlight the OD region by suppressing the
blood vessels. Blood vessels present in OD are minimally affected
by glaucoma. Figure 4a shows a fundus image, and two wavelet
sub-band images are shown in Figures 4b and 4c. It can be observed
that blood vessels appear with the cup in the sub-band-3 image
shown in Figure 4b. In sub-band-5 image shown in Figure 4c, the
blood vessels are suppressed. This image contains only the cup in-
formation. This is due to the low frequency characteristics of cup
information. Different wavelet sub-bands for a number of fundus
images are evaluated. It is observed that sub-band-5 contains domi-
nantly the cup information. Watershed segmentation (Petrou and
Petrou, 2010) is used in wavelet sub-band-5 for detection of cup.
C. Differential Entropy as a Measure for Glaucoma. CDR
is the ratio of cup area (Ac) to disc area (Ad). The cup area and disc
area are proportional to the number of cup pixels (Nc) and the num-
ber of disc pixels (Nd), respectively. If the cup probability (pc(u)) isdefined as the ratio of number of cup pixels to the total number of
pixels in the image, then the cup area is proportional to the cup
probability. Similarly, the disc area is proportional to the disc prob-
ability (pd(u)) So, CDR can be written as
CDR ¼ Ac
Ad
¼ k:pcðuÞpdðuÞ
ð3Þ
where k is a constant. The cup size increases with the progression
of glaucoma. Normally, the disc size does not change. So the
change in CDR value will be proportional to the probability of cup.
The relative change in the cup probability can be used as a measure
of glaucoma in place of CDR. The change of cup probability can be
estimated by the differential entropy (DEc) (Hyvarinen et al., 2001)
of the cup
DEc ¼ZpcðuÞ log2
pcðuÞp/ðuÞ
du ð4Þ
where pf(u) is the probability of the Gaussian random variable
with same mean and variance as that of pc(u). This measure does
not require the evaluation of disc size, which is difficult to estimate
Figure 1. Different types of disc: (a) normal disc; (b) glaucoma disc with increase in cup size; (c) glaucoma with inflamed disc; (d) glaucoma
with disc anomalies. [Color figure can be viewed in the online issue, which is available at wileyonlinelibrary.com.]
Figure 2. Proposed method: Assessment of glaucoma from color fundus image.
162 Vol. 22, 161–165 (2012)

in some glaucoma cases. By choosing a suitable threshold, the nor-
mal and glaucoma images can be separated. The optimum threshold
value for DEc is calculated by the simulated cup and disc. Figure 5
shows CDR value versus DEc value for different sizes of cup. The
DEc value of cup lies below 0.26 for the CDR value ranges from
0.3 to 0.5. DEc value is higher than 0.26 for glaucoma images. The
linear relationship between CDR and DEc values suggests that DEc
can be used not only for detection of glaucoma but also for evalua-
tion and progression of glaucoma.
III. RESULTS AND DISCUSSIONS
The proposed method is applied on the data obtained from the
optic-disc organization (Mishra et al., 2011). It consists of eight
normal images and 37 glaucoma images of dimension of 144 3 144
pixels in bit-map format. From DRIVE database (Niemeijer and
Ginneken, 2002), nine color images of the retina are considered for
the testing purpose. Five-level wavelet decomposition is performed
on the preprocessed images using D4 mother wavelet. Watershed
segmentation is performed in wavelet sub-band-5, and DEc values
for the segmented cup are calculated. Table I shows the results for
54 images. Out of 37 glaucoma images, 35 glaucoma images are
classified correctly. Out of 17 normal images, 14 normal images are
classified correctly. For normal images, the DEc value is found to
be less than 0.25. For glaucoma images, the value is found to be
greater than 0.25. Im-7 and Im-49 are normal images, but they are
classified as glaucoma images. Im-14 and Im-15 are glaucoma
images, but they are classified as normal images. In this case, all
types of glaucoma having different disc appearance are classified.
The performance of the method is evaluated by true positive (TP),
true negative (TN), false positive (FP), and false negative (FN) val-
ues (Walter et al., 2002; Chang et al., 2009). TP, TN, FP, and FN
for the proposed method are found to be 0.9459, 0.8823, 0.1176,
Figure 4. Appearance of different features of color fundus image indifferent wavelet sub-bands: (a) preprocessed green channel image;
(b) sub-band-3 image; (c) sub-band-5 image. Figure 5. CDR value versus DE value of different size of cup.
Figure 3. Preprocessing: (a) cropped color image; (b) red channel image; (c) green channel image; (d) blue channel image; (e) illumination cor-
rected image; (f) histogram-equalized image. [Color figure can be viewed in the online issue, which is available at wileyonlinelibrary.com.]
Vol. 22, 161–165 (2012) 163

and 0.0540, respectively. Sensitivity (Sn) and specificity (Sp) are
defined as
Sn ¼TP
TPþ FNð5Þ
Sp ¼TN
TNþ FPð6Þ
For this method, Sn and Sp are found to be 94.59% and 88.23%,
respectively. Sn and Sp should be high value for better performance.
Figure 6 shows the receiver operating characteristic (ROC) for the
proposed method. It is the plot between the specificity versus the
sensitivity (Zou et al., 2012). The accuracy becomes maximum if
the ROC curve runs from (0, 0) coordinate to (1, 1) coordinate
through the (0, 1) coordinate. Accuracy becomes 50%, when the
ROC curve passes through the diagonal. In the proposed method,
the ROC curve lies toward the higher accuracy side. Figure 6
explains the better separation of the cup as it is more inclined to the
sensitivity. So, the method can perform better classification.
The proposed method is compared with three existing methods
(Fink et al., 2009; Bock et al., 2010; Hatanaka et al., 2011) in the
literature. Bock et al. (2010) have used PCA and SVM for glau-
coma classification. In their paper, they have reported an accuracy
value of 80%. Fink et al. (2009) have used ICA and K-nearest
neighbor (KNN) classifier for glaucoma classification. In their pa-
per, they have reported an accuracy value of 85%. Hatanaka et al.
(2011) finds the CDR which is based on line profile analysis in reti-
nal images. In this method, they have found the ratio of vertical cup
diameter (Cv) to the vertical disc diameter (Dv) as a measure of
glaucoma. For glaucoma images, the CDR value is higher than the
CDR value of normal images. They have reported an accuracy of
94.7%. The works in these papers are carried out with different
databases. In this work, the proposed method and the above three
methods are evaluated with the same dataset for comparison of their
performances. Fifty four images (37 images are glaucoma and 17
images are normal) are used for evaluation. Bock et al. (2010)
method shows different accuracy values for different kernel func-
tions. The mean accuracy value for Bock et al. (2010) with five ker-
nel functions is found to be 80%. The accuracy value for Fink et al.
(2009) is 85%. The accuracy of the Hatanaka et al. (2011) method
is found to be 79.62%. This method fails in case of disc dursen and
disc anomalies. In the proposed method, out of 54 images, a total of
50 images are correctly detected. The proposed method shows the
best result with an accuracy value of 92.59%. This shows that the
proposed method performs better compared to the existing
methods.
IV. CONCLUSIONS
In this article, normal and glaucoma images are classified by meas-
uring the DEc value of the segmented cup in wavelet sub-band. It is
not possible to evaluate the CDR if the disc is not segmented from
the image. The proposed method is effective in evaluation of glau-
coma images in different disc conditions. Accuracy of 92.59% is
obtained in the proposed method.
REFERENCES
R. Bock, J. Meier, L.G. Nyul, J. Hornegger, and G. Michelson, Glaucoma
risk index: Automated glaucoma detection from color fundus images, Med
Image Anal 14 (2010), 471–481.
H. Chang, A.H. Zhuang, D.J. Valentino, and W.C. Chu, Performance mea-
sure characterization for evaluating neuroimage segmentation algorithms,
Neuroimage 47 (2009), 122–135.
F. Fink, K. Wrle, P. Gruber, A.M. Tom, J.M.G. Sez, C.G. Puntonet, and
E.W. Lang, ICA analysis of retinal images for glaucoma classification, Pro-
ceedings of 30th Annual International Conference of the IEEE Engineering
in Medicine and Biology Society, Vancouver, British Columbia, Canada,
August 20–24, 2008, pp. 4664–4667.
R.C. Gonzalez, Digital image processing, 2nd ed., PHI Publication,
New Jersey, USA, 2006.
Y. Hatanaka, A. Noudo, C. Muramatsu, A. Sawada, T. Hara, T. Yamamoto,
and H. Fujita, Automatic measurement of cup to disc ratio based on line
Table I. Differential entropy (DEc) value of segmented cup for glaucoma detection
Images DEc Images DEc Images DEc Images DEc Images DEc Images DEc
Im-1 0.12 Im-10 0.88 Im-19 0.80 Im-28 0.74 Im-37 0.89 Im-46 0.10
Im-2 0.20 Im-11 0.90 Im-20 0.52 Im-29 0.27 Im-38 0.69 Im-47 0.17
Im-3 0.24 Im-12 0.85 Im-21 0.50 Im-30 0.32 Im-39 0.79 Im-48 0.11
Im-4 0.22 Im-13 0.73 Im-22 0.37 Im-31 0.49 Im-40 0.87 Im-49 0.26
Im-5 0.06 Im-14 0.19 Im-23 0.84 Im-32 0.69 Im-41 0.79 Im-50 0.17
Im-6 0.05 Im-15 0.17 Im-24 0.37 Im-33 0.54 Im-42 0.59 Im-51 0.15
Im-7 0.28 Im-16 0.27 Im-25 0.89 Im-34 0.56 Im-43 0.90 Im-52 0.17
Im-8 0.22 Im-17 0.30 Im-26 0.99 Im-35 0.58 Im-44 0.88 Im-53 0.87
Im-9 0.60 Im-18 0.94 Im-27 0.36 Im-36 0.90 Im-45 0.87 Im-54 0.87
Figure 6. Specificity versus sensitivity.
164 Vol. 22, 161–165 (2012)
profile analysis in retinal images, Proceedings of 33rd Annual International
Conference of the IEEE EMBS, Boston, MA, 2011, pp. 3387–3390.
A. Hyvarinen, J. Karhunen, and E. Oja, Independent component analysis,
1st ed., Wiley, USA and Canada, 2001.
J.B. Jonas, W.M. Budde, and S. Panda Jonas, Ophthalmoscopic evaluation
of the optic nerve head, Survey Ophthalmol 43 (1999), 293–320.
M.T. Leite, L.M. Sakata, and F.A. Medeiros, Managing glaucoma in devel-
oping countries, Arq Bras Oftalmol 74 (2011), 83–84.
S. Mallat, A wavelet tour of signal processing, 2nd ed., AP Publication, An
Imprint of Elsevier, California, USA, 1999.
M. Mishra, M.K. Nath, S.R. Nirmala, and S. Dandapat, ‘‘Image Processing
Techniques for Glaucoma Detection,’’ International Conference on ACC,
Springer in Communications in Computer and Information Science Series,
Rajagiri School of Engineering and Technology, India, 2011.
M. Niemeijer and B.V. Ginneken, 2002. Available at:http://www.isi.uu.nl/
research/databases/drive/results.php. Accessed on July 2009.
M. Niemeijer, B. van Ginneken, M.J. Cree, A. Mizutani, G. Quellec, C.I.
Sanchez, B. Zhang, R. Hornero, M. Lamard, C. Muramatsu, X. Wu, G.
Cazuguel, J. You, A. Mayo, Q. Li, Y. Hatanaka, B. Cochener, C. Roux, F.
Karray, M. Garca, H. Fujita, and M.D. Abramoff, Retinopathy online chal-
lenge: Automatic detection of microaneurysm in digital color fundus photo-
graphs, IEEE Trans Med Imaging 29 (2010), 185–195.
S.R. Nirmala, S. Dandapat, and P.K. Bora, Wavelet weighted blood
vessel distortion measure for retinal images, Biomed Signal Process Control
5 (2010), 282–291.
M. Petrou and C. Petrou, Image processing: The fundamentals, 2nd ed.,
John Wiley and Sons, Chichester, United Kingdom, 2010.
G. Quellec, M. Lamard, P.M. Josselin, G. Cazuguel, B. Cochener, and C.
Roux, Optimal wavelet transform for the detection of microaneurysm in ret-
ina photographs, IEEE Trans Med Imaging 27 (2008), 1230–1241.
P.N. Schacknow and J.R. Samples, The glaucoma book, 1st ed., Springer
Publication, Springer New York Dordrecht Heidelberg London, 2010.
T. Walter, J.C. Klein, P. Massin, and A. Erginay, Contribution of
image processing to the diagnosis of diabetic retinopathy detection of exu-
dates in color fundus images of the human retina, IEEE Trans Med Imaging
21 (2002), 1236–1243.
K.H. Zou, A.J. OMalley, and L. Mauri, Receiver-operating characteristics
analysis for evaluating diagnostic tests and predictive models, J Am Heart
Assoc 115 (2012), 654–657.
Vol. 22, 161–165 (2012) 165


![Entropy OPEN ACCESS entropy - Semantic Scholar · for the retrieval performance. In the work of [34], a color histogram based on the wavelet is introduced, which also considers the](https://img.pdfslide.net/doc/110x75/5fb111d70462a673a3732de9/entropy-open-access-entropy-semantic-scholar-for-the-retrieval-performance-in.jpg)