Embed Size (px)
Citation preview
UNIVERSIDADE DE LISBOA
FACULDADE DE CIÊNCIAS
DEPARTAMENTO DE BIOLOGIA VEGETAL
DIFFERENTIAL EXPRESSION OF FOOD
ENTEROCOCCI IN RESPONSE TO
DISTINCT GROWTH ENVIRONMENTS
Cláudia Raquel da Silva Nóbrega
MESTRADO EM MICROBIOLOGIA APLICADA
2011

ii
UNIVERSIDADE DE LISBOA
FACULDADE DE CIÊNCIAS
DEPARTAMENTO DE BIOLOGIA VEGETAL
DIFFERENTIAL EXPRESSION OF FOOD
ENTEROCOCCI IN RESPONSE TO
DISTINCT GROWTH ENVIRONMENTS
Cláudia Raquel da Silva Nóbrega
Dissertação orientada pela Doutora Teresa Maria Leitão Semedo
Lemsaddek e pelo Professor Doutor Mário Manuel Carmo de
Almeida Santos
MESTRADO EM MICROBIOLOGIA APLICADA
2011

iii
DIFFERENTIAL EXPRESSION OF FOOD
ENTEROCOCCI IN RESPONSE TO
DISTINCT GROWTH ENVIRONMENTS
Cláudia Raquel da Silva Nóbrega
2011
This thesis was fully performed at the Faculty of Veterinary Medicine of the
Technical University of Lisbon under the direct supervision of Dr. Teresa
Semedo Lemsaddek.
Prof. Dr. Mário Santos was the internal designated supervisor in the scope of
the Master in Applied Microbiology of the Faculty of Sciences of the University
of Lisbon.

iv
Acknowledgments
I would like to thank everyone that supported me in this work especially my advisor, Dr. Teresa
Semedo Lemsaddek for accepting me at the Faculty of Veterinary Medicine of the Technical
University of Lisbon and for her time, patience, assistance, teachings, constructive criticism and
support throughout the year that made me grow both as a person and a researcher. I would
also like to thank Prof. Dr. Mário Santos for accepting to be my co-advisor and for discussing
and listening with interest my work.
To all my colleagues at the Faculty of Veterinary Medicine of the Technical University of Lisbon
a great thank you for welcoming me in their group, supporting me whenever I had any doubt
and helping me in every way they possibly could.
I would also like to thank Dr. Sílvia Ferreira from ICAT-FCUL for the insights on two dimensional
electrophoresis which were quite helpful and important to establish this platform in our
laboratory.
Last but not least I would like to thank my family for supporting me and making it possible to
happily conclude my Master’s degree.
v
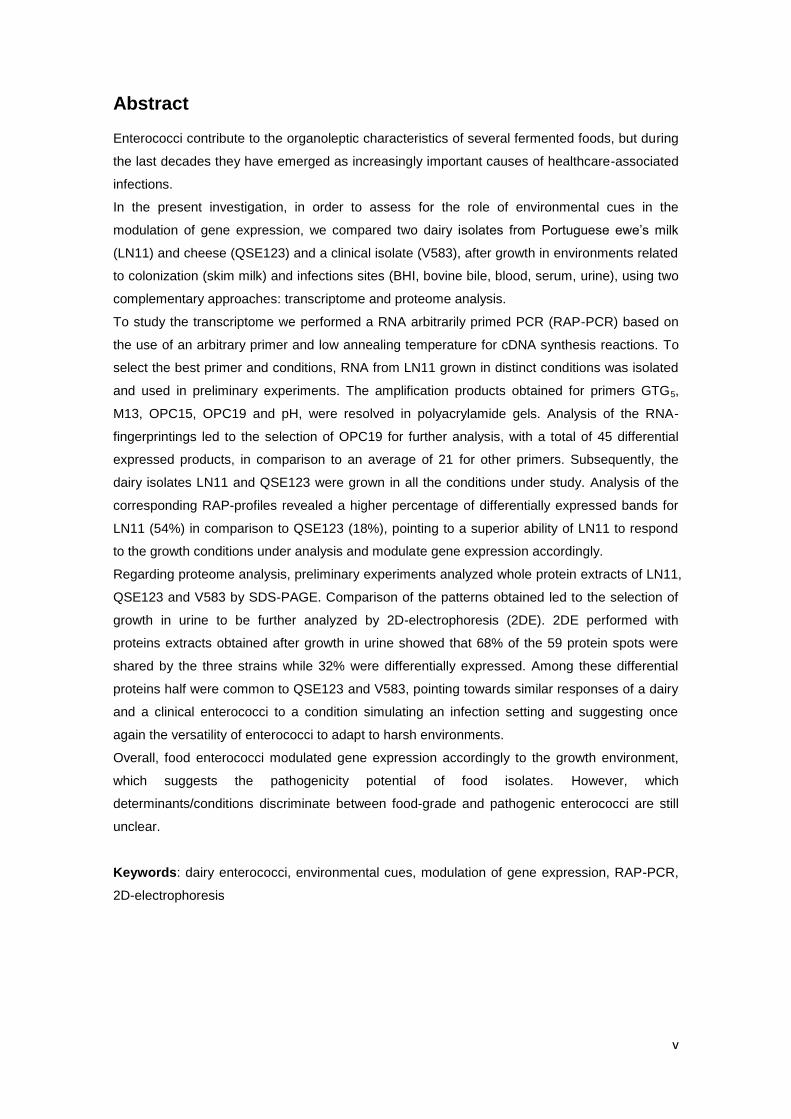
Abstract
Enterococci contribute to the organoleptic characteristics of several fermented foods, but during
the last decades they have emerged as increasingly important causes of healthcare-associated
infections.
In the present investigation, in order to assess for the role of environmental cues in the
modulation of gene expression, we compared two dairy isolates from Portuguese ewe’s milk
(LN11) and cheese (QSE123) and a clinical isolate (V583), after growth in environments related
to colonization (skim milk) and infections sites (BHI, bovine bile, blood, serum, urine), using two
complementary approaches: transcriptome and proteome analysis.
To study the transcriptome we performed a RNA arbitrarily primed PCR (RAP-PCR) based on
the use of an arbitrary primer and low annealing temperature for cDNA synthesis reactions. To
select the best primer and conditions, RNA from LN11 grown in distinct conditions was isolated
and used in preliminary experiments. The amplification products obtained for primers GTG5,
M13, OPC15, OPC19 and pH, were resolved in polyacrylamide gels. Analysis of the RNA-
fingerprintings led to the selection of OPC19 for further analysis, with a total of 45 differential
expressed products, in comparison to an average of 21 for other primers. Subsequently, the
dairy isolates LN11 and QSE123 were grown in all the conditions under study. Analysis of the
corresponding RAP-profiles revealed a higher percentage of differentially expressed bands for
LN11 (54%) in comparison to QSE123 (18%), pointing to a superior ability of LN11 to respond
to the growth conditions under analysis and modulate gene expression accordingly.
Regarding proteome analysis, preliminary experiments analyzed whole protein extracts of LN11,
QSE123 and V583 by SDS-PAGE. Comparison of the patterns obtained led to the selection of
growth in urine to be further analyzed by 2D-electrophoresis (2DE). 2DE performed with
proteins extracts obtained after growth in urine showed that 68% of the 59 protein spots were
shared by the three strains while 32% were differentially expressed. Among these differential
proteins half were common to QSE123 and V583, pointing towards similar responses of a dairy
and a clinical enterococci to a condition simulating an infection setting and suggesting once
again the versatility of enterococci to adapt to harsh environments.
Overall, food enterococci modulated gene expression accordingly to the growth environment,
which suggests the pathogenicity potential of food isolates. However, which
determinants/conditions discriminate between food-grade and pathogenic enterococci are still
unclear.
Keywords: dairy enterococci, environmental cues, modulation of gene expression, RAP-PCR,
2D-electrophoresis

vi
Resumo
Os enterococos são microrganismos ubíquos que podem ser encontrados no microbiota
gastrointestinal de humanos e outros animais de sangue quente (Moellering, 1992) podendo
também aparecer nos alimentos, no solo, águas superficiais, plantas e alimentos (Giraffa,
2003).
Quando presentes nos alimentos os enterococos contribuem principalmente para o processo
de maturação e desenvolvimento de algumas das características organolépticas do produto
como a textura e o sabor. Poderão ter também um papel importante na preservação dos
alimentos pois algumas estirpes produzem bacteriocinas que impedem o crescimento de
algumas bactérias indesejáveis (Moreno et al., 2006).
Contudo, os enterococos aparecem muitas vezes como agentes etiológicos de várias infecções
associadas a cuidados de saúde como infecções do tracto urinário, meningites, endocardites e
bacterémias (Poh, Oh and Tan, 2006; Savas et al., 2006; Sood et al., 2008; ECDC, 2010).
Não se sabe ao certo a origem dos isolados clínicos que causam estas infecções. Por vezes a
causa é atribuída ao microbiota intestinal do próprio doente, à disseminação destas bactérias
pela alimentação ou ao contacto entre humanos, animais ou o próprio ambiente.
Sabe-se porém, que estes microrganismos possuem factores de virulência que têm sido
identificados não só em isolados clínicos mas também em isolados alimentares contribuindo
para o carácter patogénico destes últimos (Semedo et al., 2003b; Lopes et al., 2006; Pimentel
et al., 2007; Martín-Platero et al., 2009). Para além de factores de virulência foram também
encontrados em isolados clínicos/alimentares várias resistências a antibióticos tais como a
vancomicina que é apenas utilizada em último recurso (Mannu et al., 2003; Lopes et al., 2005).
Estas resistências, que podem ser intrínsecas ou adquiridas por transferência horizontal de
genes, contribuem para o carácter patogénico dos enterococos pois dificultam o tratamento das
infecções.
Devido a esta dupla face dos enterococos são necessários novos estudos para discriminar
estirpes patogénicas de comensais/seguras para utilização em alimentos.
Alguns estudos preliminares tentaram desenvolver esta problemática em enterococos
alimentares e demonstraram que estes têm uma elevada adaptabilidade a meios com
concentrações elevadas de NaCl (6.5%), urina e soro de coelho (Carlos et al., 2009 e 2010).
Estudos de transcriptómica em estirpes alimentares/clínicas submetidas a diferentes condições
de crescimento demonstraram que factores de virulência como a citolisina (proteína modificada
pós traducionalmente com actividade hemolítica e bactericida codificada pelo operão cyl), a
substância de agregação (agg), a proteína de superfície (esp), ambas responsáveis pela
adesão aos tecidos do hospedeiro, e a gelatinase (enzima capaz de hidrolizar gelatina,
colagénio e caseína, codificada por gelE) eram sobre-expressos em urina, soro e BHI (Shepard
and Gilmore, 2002; Hew, Korakli and Vogel, 2007; Carlos, 2010).
Porém, estes genes não são normalmente expressos em condições normais de crescimento
em estirpes alimentares, em oposição a estirpes patogénicas. Considerando o elevado
potencial de patogenicidade encontrado em isolados alimentares coloca-se a seguinte questão:

vii
que condições e sinais ambientais modulam a expressão génica e determinam o carácter
patogénico ou não de um isolado pertencente ao género Enterococcus?
No presente estudo, para avaliar o papel destes sinais na modulação génica, comparámos dois
isolados alimentares de produtos lácteos portugueses (Lopes et al., 1999), nomeadamente
isolados de leite de ovelha da Nisa (LN11, E. casseliflavus) e de queijo da Serra da Estrela
(QSE123, E. faecalis), e um isolado clínico (V583, E. faecalis), após crescimento em ambientes
relacionados com locais de colonização (‘skim milk’ com 0%, 2.5%, 5.0% e 6.5% de NaCl) e de
infecção (BHI, BHI com 1% bilis bovina, soro de cavalo, 2YT com 10% de sangue de carneiro e
urina), utilizando duas abordagens complementares: análise do transcriptoma e do proteoma.
A inovação desta abordagem baseia-se na aplicação de técnicas previamente validadas para
adquirir novos conhecimentos e juntá-los numa análise integrativa para conseguir responder à
problemática em questão. Em resumo, identificar novas moléculas que esclareçam se
enterococos alimentares são ou não seguros e que mecanismos de stress/adaptação estão por
detrás da resposta a sinais do meio ambiente.
Uma das análises que realizámos foi direccionada ao transcriptoma, razão pela qual extraímos
o RNA das estirpes LN11 e QSE123, crescidos nas diferentes condições e respectivos
controlos (meio ‘2x yeast tryptone’, 2YT com variados valores de pH e concentração salina).
Utilizámos uma abordagem baseada na técnica ‘RNA Arbitrarily Primed PCR’ (RAP-PCR). O
RAP-PCR consiste na utilização de um primer aleatório que se liga ao RNA a baixas
temperaturas durante a síntese da primeira e segunda cadeias de cDNA. Os produtos de
amplificação quando separados em geis de poliacrilamida produzem um perfil ‘fingerprint’ que
permite identificar bandas diferencialmente expressas nas várias condições ambientais
aplicadas, isto é, as que estavam presentes na condição de crescimento mas ausentes no
respectivo controlo.
Numa análise preliminar, para definir o primer e as condições a utilizar, analisámos o RNA da
estirpe LN11 crescida nas várias condições e cinco primers aleatórios diferentes: GTG5, M13,
OPC15, OPC19 e pH. A análise dos perfis de RAP-PCR levou á escolha do primer OPC19
para as análises seguintes pois identificámos 45 bandas diferenciais em comparação a 21 nos
outros primers.
Utilizámos o primer OPC19 e os RNAs das estirpes alimentares LN11 e QSE123 crescidas das
nas várias condições e respectivos controlos para comparar os genes diferencialmente
expressos. Alguns desses genes foram posteriormente clonados, sequenciados e identificados
por comparação com a base de dados online do NCBI.
A análise dos perfis dos isolados alimentares permitiu concluir que a LN11 é mais susceptível a
sinais presentes no meio ambiente do que o isolado QSE123, especialmente nos meios de
‘skim milk’. Isto foi demonstrado pela elevada percentagem de bandas diferenciais na LN11
(54%) em comparação à QSE123 (18%). Esta elevada adaptabilidade foi confirmada pela
identificação de dois genes diferencialmente expressos em meio ‘skim milk’, um
correspondente a um factor sigma-70, da subfamília dos factores extracitoplasmáticos, e o
outro um transportador tipo-ABC de oligopéptidos. O primeiro está geralmente associado à

viii
regulação de vários regulões responsáveis pela adaptação ao stress ambiental e o segundo
permite aos enterococos utilizar péptidos presentes no meio para compensar algumas faltas
nutricionais. Ambos os genes são representativos da elevada adaptabilidade dos enterococos
alimentares.
Em geral, ambos os isolados tiveram uma forte modulação da expressão génica quando
crescidos em urina, um dos meios de infecção analisado. QSE123 expressou neste meio um
gene que codifica para uma proteína facilitadora do ‘uptake’ de glicerol, a GlpF, pertencente a
um regulão responsável por adaptações energéticas e aproveitamento dos nutrientes
disponíveis no ambiente. Estes resultados demonstram a elevada capacidade de suportar
ambientes de stress o que sugere um maior potencial de patogenicidade nestes isolados
alimentares.
Numa abordagem distinta mas complementar ao estudo do transcriptoma, estudámos o
proteoma analisando os extractos proteicos dos isolados crescidos nas diferentes condições de
crescimento e respectivos controlos por electroforese uni- (SDS-PAGE ) e bi-dimensional (2D).
Comparámos os perfis SDS-PAGE de cada isolado para cada condição de
colonização/infecção construindo um dendrograma (no software BioNumerics utilizando o
coeficiente de Pearson e o método de aglomeração UPGMA) que nos permitia ver os níveis de
semelhança entre perfis.
Concluímos uma vez mais que a LN11, pelos elevados níveis de semelhança que apresenta
entre todos os perfis, consegue adaptar-se a qualquer uma das condições sejam estas de
colonização ou de infecção, o que está de acordo com os resultados previamente descritos da
análise do transcriptoma.
Nos perfis do isolado QSE123 detectámos algumas proteínas diferenciais, nomeadamente
duas em resposta ao crescimento em urina indicando mais uma vez uma resposta diferencial
dos enterococos alimentares a esta condição, e uma proteína diferencialmente expressa por
este isolado em resposta a crescimento em ‘skim milk’. Esta última correspondia no perfil a
uma banda com aproximadamente 32kDa e a sua expressão parece ser inibida pelo aumento
da concentração de NaCl nos meios ‘skim milk’, visto que a intensidade da banda foi
diminuindo progressivamente nos perfis com concentração de sal superior. Estes resultados
sugerem que esta proteína será regulada por um mecanismo em resposta ao stress osmótico,
stress esse presente nos queijos de onde este isolado provém.
Ambas as análises, do transcriptoma e proteoma, apontavam para o papel importante de sinais
na urina na modulação da expressão génica nos enterococos alimentares. Para podermos
analisar mais pormenorizadamente o potencial de patogenicidade destes isolados usámos esta
condição na análise de electroforese 2D. Comparámos o número de spots de proteínas
diferencialmente expressas pelos isolados alimentares e a estirpe clinica humana V583.
As proteínas diferencialmente expressas representavam 32% (19/59) dos spots e cerca de
metade desses eram compartilhados pela V583 e QSE123 demonstrando uma resposta
semelhante entre isolados clínicos e alimentares a sinais ambientais na urina o que sugere um
maior potencial de patogenicidade. Isto pode ser uma preocupação tendo em conta que as
ix
infecções do tracto urinário são uma das principais infecções causadas por enterococos (Sood
et al., 2008).
Relativamente ao isolado alimentar LN11, este expressou proteínas diferenciais únicas
demonstrando que entre isolados de enterococos da mesma origem pode haver vários perfis
diferentes de expressão génica e respostas distintas ao meio ambiente.
Em conclusão, isolados alimentares e clínicos modulam a sua expressão génica de acordo
com o meio ambiente e parte dessa expressão é dirigida a mecanismos de stress/adaptação
ao meio circundante. Os nossos resultados sugerem um potencial de patogenicidade nos
isolados alimentares embora permaneça por definir que determinantes/condições separam os
enterococos seguros (uso alimentar) dos patogénicos.
Palavras chave: Enterococos alimentares, sinais ambientais, modulação da expressão génica,
RAP-PCR, electroforese 2D,

x
Index
1. Introduction .......................................................................................................................... 1
1.1. The genus Enterococcus ........................................................................................... 1
1.2. Food enterococci ........................................................................................................ 1
1.3. Enterococcal pathogenicity potential ....................................................................... 2
1.4. Food and clinical enterococci: the switch between commensal and pathogenic
lifestyle ..................................................................................................................................... 6
1.5. Differential expression: a dual approach ................................................................ 7
1.5.1. Transcriptome ..................................................................................................... 7
1.5.2. Proteome............................................................................................................ 10
1.5.3. Integrative analysis ........................................................................................... 11
1.6. Aims of the study ...................................................................................................... 12
2. Materials and Methods .................................................................................................... 14
2.1. Microorganisms and growth conditions ................................................................. 14
2.2. Transcriptomic approach ......................................................................................... 15
2.2.1. RNA extraction, quantification and treatment with DNase I ....................... 15
2.2.2. RNA Arbitrarily Primed PCR ........................................................................... 16
2.2.3. Polyacrylamide Gel .......................................................................................... 16
2.2.4. Amplicon isolation and reamplification .......................................................... 17
2.2.5. Cloning and sequencing .................................................................................. 17
2.2.6. Data analysis ..................................................................................................... 18
2.3. Proteomic approach ................................................................................................. 18
2.3.1. Protein extraction and quantification ............................................................. 18
2.3.2. One-Dimensional Gel Electrophoresis (1DE) ............................................... 18
2.3.3. Two-Dimensional Gel Electrophoresis (2DE) ............................................... 19
2.3.4. Data analysis ..................................................................................................... 19
3. Results and Discussion ................................................................................................... 20
3.1. Transcriptome Analysis ........................................................................................... 22
3.2. Proteome Analysis.................................................................................................... 29
3.3. Integrative Analysis .................................................................................................. 36
4. Conclusions and Future Perspectives ........................................................................... 39
5. Bibliographic references .................................................................................................. 41
xi
Index of figures
Figure 1 - Growth curves from LN11, QSE123 and V583 grown in two media simulating
infection (horse serum and BHI + 1%BB) and serum control medium (2YT pH 7.7) representing
the mean values from the three replicas. .................................................................................... 20
Figure 2 - RAP-PCR profiles in polyacrylamide gel using primer OPC19 and RNA extracted
from LN11 and QSE123 grown in urine, skim milk 0% NaCl and respective controls.. .............. 24
Figure 3 - Dendrogram based on whole-cell protein profiles from LN11 and QSE123 grown in
media simulating colonization and infection sites.. ..................................................................... 30
Figure 4 - Differential expressed protein in protein profile from QSE123 cells grown in skim milk
with distinct NaCl concentrations which is absent in their respective controls. .......................... 31
Figure 5 - Two-dimensional gel electrophoresis patterns of the whole-cell protein extracts from
QSE123, V583 and LN11 grown in urine... ................................................................................. 33
Figure 6 - Differentially expressed protein, present in QSE123 and V583 2D electrophoresis
protein patterns but absent in LN11. ........................................................................................... 35
Index of tables
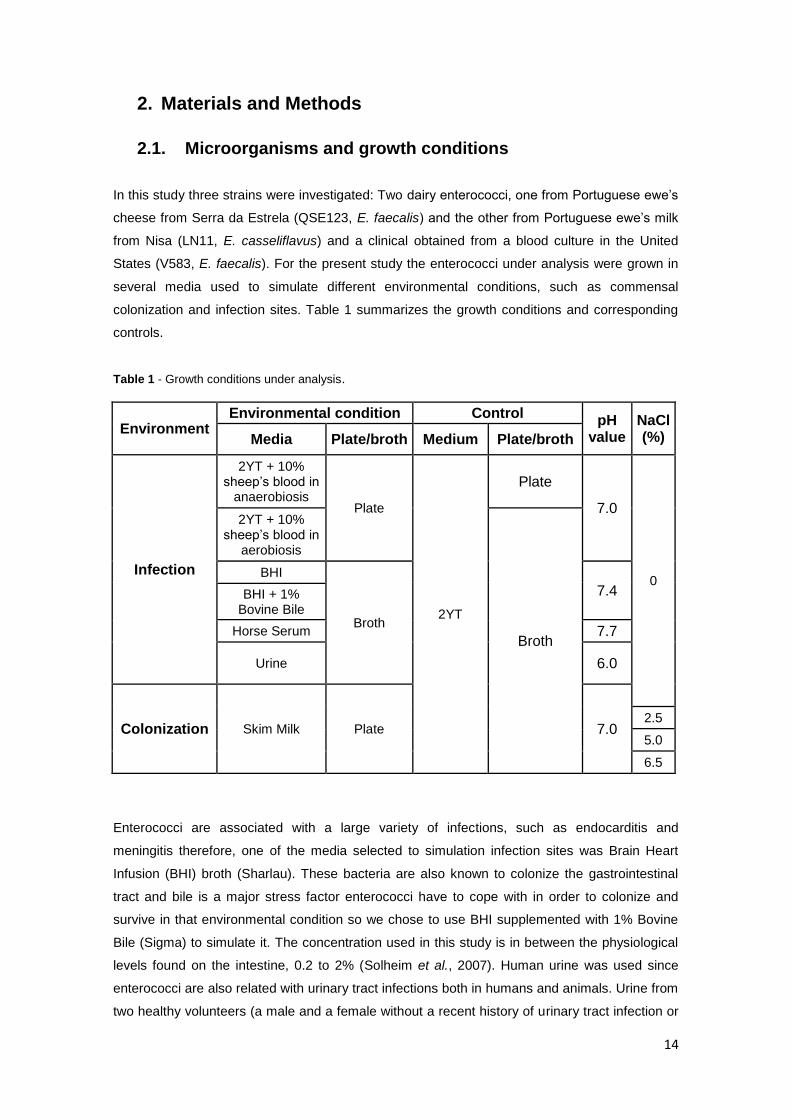
Table 1 - Growth conditions under analysis. ............................................................... 14
Table 2 - Late exponential phase of growth (collection times) for each strain and
medium. ...................................................................................................................... 21
Table 3 - Number of differential bands from RAP-PCR profiles using RNA from LN11
grown in seven distinct conditions and five arbitrary primers. ...................................... 23
Table 4 - Differential bands identified by comparison with NCBI Nucleotide online
database ..................................................................................................................... 27

1
1. Introduction
1.1. The genus Enterococcus
Originally, according to the Lancefield classification, enterococci were part of group D
streptococci. However, in 1984, DNA-DNA and DNA-RNA hybridization studies demonstrated
that enterococci are distantly related to other true streptococci and the new genus Enterococcus
was proposed (Schleifer and Kilpper-Balz, 1984).
Enterococci are common residents of the gastrointestinal tract of humans, mammals and other
warm-blooded animals (Moellering, 1992) and can also occur in soil, surface waters, plants and
food; some strains are also used in probiotics (Buydens and Debeuckelaere, 1996; Giraffa,
2003; Moreno et al., 2006). Though enterococci were considered harmless commensal
microorganisms it has been found that they are associated with a large variety of healthcare
associated infections.
Bacteria of the genus Enterococcus are gram-positive, have low G+C content (<50%), are
catalase-negative, non-spore-forming, facultative anaerobes and occur as single cocci, in pairs
or short chains (Schleifer and Kilpper-Balz, 1984; Moellering, 1992; Fisher and Phillips, 2009).
Enterococci are chemoorganotrophs capable of hydrolyzing pyrrolidonyl-pnaphthylamide and
the main product of their glucose fermentation is L-lactic acid. Contrary to other lactic acid
bacteria, enterococci are not “Generally Recognized As Safe” (GRAS). In the water, for instance,
they are considered indicators of fecal contamination (Ogier and Serror, 2008).
These microorganisms are highly resistant bacteria since they are able to grow at pH 9.6, in the
presence of 6,5% NaCl, 40% bile salts and at temperatures from 10 to 45°C. Most strains can
also survive at 60°C for 30 minutes (Schleifer and Kilpper-Balz, 1984; Moellering, 1992). This
harsh nature explains how they can be isolated from so many different environments.
There are currently more than thirty species in the Enterococcus genus
(http://www.bacterio.cict.fr/e/enterococcus.html) and their distribution throughout Europe varies,
with E. faecalis and E. faecium being the most commonly isolated species from both clinical and
environmental sources (Kuhn et al., 2003).
1.2. Food enterococci
Enterococci are present in a large variety of food products, in which they play an important role
in improving texture and flavor. These microorganisms can be found in meat (Hugas, 2003),
dairy products (Giraffa, 2003; Ogier and Serror, 2008) and even vegetables, such as olives
(Moreno et al., 2006).
Overall, microorganisms found in food products are of great interest to producers since they can
be responsible for many of the organoleptic characteristics of the product during ripening.
Enterococci are no exception and, especially in artisan cheeses produced in southern Europe,
they are known to be members of the nonstarter lactic acid bacteria (Giraffa, 2003; Moreno et

2
al., 2006). In artisanal cheese the number of enterococci ranges from 104 to 10
6 CFU/g in the
cheese curd and from 105 to 10
7 CFU/g in the fully ripened product (Ogier and Serror, 2008).
In some Portuguese regions ewe’s cheeses are still produced in a traditional way. Some of the
strains used in the present study were isolated from ewe’s cheese or raw milk from Serra da
Estrela and Nisa regions (Lopes et al., 1999). The presence of enterococci in milk and cheese
is essentially associated with unhygienic conditions, more specifically to direct contamination
from animal feces or indirectly through contaminated equipment from the collection and
processing stages, product handling or contaminated water. The fact that enterococci have the
ability to grow at a wide range of temperatures and in different substrates is another reason for
their survival throughout the production process (Alves et al., 2004).
Not only enterococci contribute to the flavor development in cheeses but they also produce
several enzymes involved in important biochemical transformations such as acidification,
proteolytic, lipolytic and esterase activities (Giraffa, 2003). Additionally, other molecules such as
bacteriocins, are produced by many Enterococcus strains and their use as biopreservatives in
food is considerably investigated. Bacteriocins, or enterocins as they are called for the
enterococci, are small peptides with antimicrobial activity, usually, against close related Gram
positive bacteria such as Listeria (Moreno et al., 2006). Such molecules are of great interest
and their production is favored in stressful growth conditions, such as the ones found in the food
production process (Fisher and Phillips, 2009).
In addition to the previous referred applications enterococci are also used in probiotics for
humans or farm animals (Mercenie, Pavan and Pot, 2002; Ogier and Serror, 2008). One of the
most well recognized strains used in probiotics is Enterococcus faecium SF 68 (Mercenier,
2002).
Overall, enterococcal strains may have a high biotechnological potential which can be
especially important and useful when applied to food production.
1.3. Enterococcal pathogenicity potential
As referred above, enterococci have a beneficial role in the organoleptic characteristics of
diverse food products however; these bacteria are also known to possess pathogenicity
potential, i.e., the ability to cause infection.
Nowadays, enterococci are considered opportunistic pathogens, able to cause disease mainly
in patients in intensive care units (ICU), hospitalized or with impaired immune systems
(Ogier and Serror, 2008). In the last decades enterococci have emerged as an increasingly
important cause of healthcare-associated infections (Sood et al., 2008). The most common
infections due to enterococci are urinary tract infections (Savas et al., 2006), followed by intra-
abdominal and intra-pelvic abscesses or post-surgery wounds where enterococci are often part
of a polymicrobial infection and the third most frequent are bloodstream infections
(Sood et al., 2008).
In Portugal, 11.5% of ICU-acquired bloodstream infections in 2008 were due to Enterococcus
according to the 2010 Annual Epidemiological Report on Communicable Diseases in Europe

3
(ECDC, 2010). Overall, enterococci are the second most common microorganism isolated from
bloodstream infections in Europe (ECDC, 2010). In some cases the enterococcal bacteremia
occurs in patients that had undergone invasive procedures like surgery, catheterization,
endoscopy, intubation and intravascular cannulation (Poh, Oh and Tan, 2006).
Other infections, such as endocarditis, meningitis and neonatal infections are less frequent and
enterococci are also rarely associated with respiratory infections, osteomyelitis or cellulitis
(Sood et al., 2008).
Approximately 80% of the enterococcal infections are caused by E. faecalis and the remaining
20% are caused by E. faecium. Nevertheless, species like E. avium, E. casseliflavus, E. durans,
E. gallinarum and E. hirae have been associated with enterococcal infections throughout the
years (Sood et al., 2008; ECDC, 2010).
Little is known about the factors that contribute for the pathogenicity character of these bacteria
however, over the last decades several virulence traits have been identified, both in clinical and
food isolates.
One of the factors associated with virulence in the Enterococcus genus is cytolysin, a post-
translation modified protein with hemolytic activity towards certain blood erythrocytes and
bactericidal activity against a broad range of bacteria. For cytolysin expression, maturation,
secretion and activation, six genes from the operon cyl, clustered and arranged in the same
orientation, are necessary (cylLL, cylLS, cylM, cylB, cylA, and cylI). The genes cylLL and cylLS
code for the cytolysin structural subunits and the remaining genes code for proteins involved in
post-translational modifications (cylM), transport (cylB), activation (cylA) and self-protection
(cylI) (Haas, Shepard and Gilmore, 2002; Carlos et al., 2010). A previous work showed a higher
incidence of these genes in clinical (62%) than in food isolates (38%) however, the high
frequency of cyl genes observed in food isolates (70%) clearly points to their pathogenicity
potential (Semedo et al., 2003a).
Adhesins play an important role in adherence to host tissues, one of the first steps in the
establishment and maintenance of colonization, possibly evolving to an infection
(Semedo et al., 2003b). Enterococcal adhesins, such as the aggregation substance, the
enterococcal surface protein, the collagen-adhesins from E. faecalis and E. faecium (encoded
by agg, esp, ace and acm genes, respectively) are considered important virulence factors
(Mannu et al., 2003; Hew, Korakli and Vogel, 2007).
Aggregation substance mediates binding of donor cells to plasmid-free recipients and
adherence to different host cells. The enterococcal surface protein contributes to colonization
and persistence in the urinary tract. The collagen-adhesins allow adherence to extracellular
matrix proteins, which is thought to be a crucial step in the pathogenicity process of many
bacterial infections (Semedo-Lemsaddek and Mato, 2011). Other adhesion-associated protein
was identified and named EfaA for E. faecalis antigen A. Similar EfaA coding genes were also
found in other strains of E. faecalis and E. faecium (efaAfs and efaAfm, respectively). All these
adhesion genes were detected by PCR-screening in dairy isolates from Portuguese ewe’s milk
and cheese. Virulence profiles were found to be strain-specific and not origin related
(Semedo et al., 2003b; Pimentel et al., 2007).

4
Hydrolytic enzymes are also consider to be virulence factors, such as gelatinase (encoded by
gelE) which is an extracellular zinc-endopeptidase capable of hydrolysing gelatin, collagen,
casein and other small biologically active peptides. Another important gene and essential for
gelE expression is frsB, a regulator of this enzyme. Gelatinase, similarly to cytolysin, plays a
role in damaging host tissues. There are other hydrolytic enzymes associated with pathogenicity
potential such as serine protease (sprE) and bile acid hydrolase (Semedo et al., 2003b;
Lopes et al., 2006, Sood et al., 2008; Fisher and Phillips, 2009).
Overall, diverse studies published over the years have shown that virulence traits are widely
distributed both in clinical and food isolates, so instead of origin-specific they seem to be a
common trait in the Enterococcus genus (Mannu et al., 2003; Semedo et al., 2003b;
Lopes et al., 2006; Pimentel et al., 2007; Martín-Platero et al., 2009)
Although the detection of virulence genes may point to a pathogenicity potential in food strains,
foodborne enterococcal infections have never been reported. Furthermore, the presence of
virulence genes does not mean that they are functional (Sood et al., 2008). However, when
these genes are functional the pathogenicity potential of food isolates cannot be disregarded,
especially when given the right environment, for example, an infection site in a patient with
impaired immune system.
In a previous work with dairy isolates (Carlos et al., 2010) it was demonstrated that infection
related media may induce the up-regulation of virulence factors (e.g. in clinical and food isolates
grown in serum and urine, cylMBAI, efaAfm and agg were up-regulated). In a similar work with
clinical/food isolates, Hew, Korakli and Vogel (2007), showed that growth in BHI (an infection
related medium) significantly up-regulated several virulence factors such as agg, cylB, efaA and
gelE in the exponential growth phase. This can be considered a health risk, since there does
not seem to be a clear difference between enterococci from clinical and food origin regarding
their ability to express virulence traits, if given a specific cue.
Other roles have been studied for these virulence determinants, namely how gelE and fsrB
promoted infection in animal models (Gaspar et al., 2009), the role of esp and cyl genes in the
adherence to siliconized latex urinary catheters, frequently associated with urinary tract
infections (Hallgren et al., 2009) and how adhesins promote biofilm production, which increases
bacterial tolerance to antimicrobial agents (Mohamed and Huang, 2007; Garsin and
Willems, 2010).
Many of these virulence factors are associated with another important feature in enterococci,
the pathogenicity island (PAI). A PAI is a genomic island, i.e., a large genomic region that
frequently harbors phage- and/or plasmid-derived sequences, including transfer genes or
integrases and insertion sequence elements (Semedo-Lemsaddek and Mato, 2011). This
genomic island receives the name PAI because it contains genes that directly or indirectly
contribute to the pathogenicity potential of the microorganism harboring it. There are at least
two species with quite distinct PAIs described in the Enterococcus genus: the E. faecalis
(Shankar, Baghdayan and Gilmore, 2002) and the E. faecium PAIs (Leavis et al., 2004). Some
of the genes present in these PAIs encode virulence factors such as cytolysin, the aggregation
substance, the extracellular surface protein (Pillar and Gilmore, 2004; Nallapareddy et al., 2005;

5
Semedo-Lemsaddek, Barreto-Crespo and Tenreiro, 2009; van Schaik, 2010), and antibiotic
resistance determinants, among other genes of unknown function (Leavis et al, 2004; Semedo-
Lemsaddek and Mato, 2011).
The presence of PAIs in enterococci is extremely important, particularly since they have been
found to be widely distributed among enterococcal isolates, regardless of their origin, and can
be transferred intra- and interspecies making it a tool to horizontal gene transfer (HGT) (Gomez
et al., 2011). This is especially demonstrated in Nallapareddy et al. (2005) work where they
identified three PAI-associated genes (esp, xylA and gls24-like) in 17.6% of the 454 E. faecalis
strains (isolated over 30 years) from different origins and places around the world, suggesting a
worldwide dissemination of the pathogenicity island. A similar result reported in
Semedo-Lemsaddek, Barreto-Crespo and Tenreiro et al.(2009) work suggests a wide
dissemination of pathogenicity islands among dairy enterococci (ewe’s cheese/milk)
representing several species (e.g. E. faecalis, E. faecium, E. casseliflavus, E. raffinosus,
E. durans, and E. hirae). This raises the issue of how the acquisition of these genomic regions
can enhance the overall fitness of the microorganism and its pathogenicity potential.
The fact that enterococci possess several antibiotic resistance traits, highly increases the risk
associated with these bacteria, turning these microorganisms into a global public health concern
(Savas et al., 2006; Sood et al., 2008). This is especially true considering that such resistances
turn the therapeutic options more difficult and can allow the bacteria to multiply and establish an
infection. From this point of view it is clear that antimicrobial resistances enhance pathogenicity
potential.
Enterococcal antibiotic resistances can either be intrinsic to the microorganism or acquired by
HGT (Sood et al., 2008). Mobile elements such as vanB vancomycin-resistance conjugative
transposon found in the clinical isolate V583 are just an example (Paulsens et al., 2003). This
ability to acquire antibiotic resistances horizontally often compromises the efficiency of
treatment (Woodford and Livermore, 2009).
Many of these traits are found not only in clinical isolates but also in food isolates such as dairy
enterococci (Mannu et al., 2003). Lopes et al. (2005) work reported from one to six resistances
to antimicrobial agents such as: methicillin, bacitracin, netilmycin, rifampicin, tetracycline,
oxytetracycline and kanamycin, in dairy isolates.
The most significant types of resistance in the enterococci are high level resistance to
aminoglycosides and resistance to glycopeptides such as vancomycin (Sood et al., 2008). The
occurrence of vancomycin resistant enterococci (VRE) is a concern since vancomycin is
traditionally a last resort antibiotic. This resistance limits the therapeutic options for some more
serious enterococcal infections and it is spreading, becoming difficult to contain the problem
(Woodford and Livermore, 2009). In Lopes et al. (2005) work only four isolates in 172 were VRE
however, from those isolates two had been obtained from dairy products. A more concerning
situation regarding VRE is the 25% resistance found in food isolates in a total of 102
enterococci from Italian cheese (Giraffa, Olivari and Neviani, 2000).

6
Alternatives to vancomycin, such as linezolid, have appeared however, linezolid resistance has
already been reported in clinical isolates, including VRE (Gonzales et al., 2001;
Bonora et al., 2006).
It is clear that virulence and antibiotic resistances are spread among enterococci regardless of
their origin. This has a great impact in enterococcal pathogenicity potential which poses the
question of whether the presence of enterococci in food products and probiotics is actually safe.
1.4. Food and clinical enterococci: the switch between
commensal and pathogenic lifestyle
Enterococci are microorganisms that have both a beneficial and a harmful nature, whether we
are referring to their role in food products or in healthcare associated infections. Considering
food safety, their presence in food products is highly controversial due to their opportunistic
pathogenicity character (Hugas, 2003; Ogier and Serror, 2008). Another concern lies in the
ability of enterococci to transfer and receive antimicrobial resistances and virulence genes
through HGT and how this will affect human microbiota.
As previously described, food enterococci can harbor several virulence genes but normally
these genes are not expressed in their normal growth conditions. However, the right
environment and signaling cues may induce virulence gene expression and all the machinery
necessary to colonize and possibly infect in that condition. There is little information about these
signals and what triggers the pathogenic lifestyle.
Strain V583 (E. faecalis) is commonly used in studies worldwide since this clinical isolate
obtained from a blood culture was the first vancomycin resistant enterococci to be reported in
the United States and also the first to have its whole genome sequenced (Paulsen et al., 2003).
For those reasons it was included in the present investigation in comparison to food isolates, in
order to determine if there is actually a frontier between food and clinical isolates, commensal
and pathogenicity lifestyle.
As reported in Lopes et al. (1999) six hundred and five Enterococcus isolates were obtained
from milk and cheese samples obtained from four different Portuguese Registered Designation
of Origin areas: Serra da Estrela, Nisa, Castelo Branco and Azeitão. The dairy enterococci to be
analyzed in the present investigation are a part of this bacterial collection, LN11
(E. casseliflavus) was isolated from Nisa ewe’s milk and QSE123 (E. faecalis) from Serra da
Estrela ewe’s cheese.
LN11 and QSE123 are known to possess a high level of adaptability to different growth
environments. One conclusion taken in Carlos et al. (2009) work was that their growth behavior
and adaptability was similar to the ones observed for clinical isolates such as V583, MMH584
(E. faecalis; isolated from a hospital outbreak in the USA and clonally related to V583) and
E300 (VRE-E. faecium), leading the authors to conclude that environmental adaptability was
neither origin nor species related.

7
Previous investigations performed by the same research group point furthermore towards the
pathogenicity potential of the dairy enterococci LN11 and QSE123, since these enterococcal
strains possess and express several virulence factors, including cytolysin, the aggregation
substance and the enterococcal surface protein (Semedo et al., 2003a; Semedo et al., 2003b).
Another study demonstrated that both harbor PAI-related genes, that their virulence genotypes
are not much different from the clinical isolates and also showed that LN11 has a PAI
organization almost 100% similar to the PAI present in the clinical isolate
MMH594 (Semedo-Lemsaddek, Barreto-Crespo and Tenreiro, 2009).
The presence and expression of virulence traits in food enterococci (Hew, Korakli and
Vogel, 2007; Carlos et al. 2010) emphasizes once again the need for further studies regarding
the evaluation of the role of environmental cues in the modulation of gene expression, in order
to reliably assess for the food safety of products harboring enterococci.
These issues were preliminary addressed in Carlos et al. (2010) study where the authors
analyzed how growth conditions, simulating commensal colonization and infection sites,
influenced the expression of virulence factors. In their work, LN11 and QSE123 showed distinct
virulence expression profiles, depending on the growth medium, demonstrating once again the
importance of environmental cues on the modulation of gene expression. Moreover, QSE123
was able to adapt and activate virulence gene expression despite the growth condition which,
associated with the presence of a high number of virulence determinants in its genome, clearly
points towards its pathogenicity potential.
Taking all this information into account it is clear that there are similarities between food and
clinical isolates and that environmental cues trigger a response in the levels of virulence gene
expression. Understanding which cues and mechanisms are involved will clarify our
comprehension on the lifestyle adopted by enterococci. A question that takes place is if, given
the right environment, an Enteroccocus isolate can easily switch from one lifestyle to another.
This hypothesis seems to correspond to the truth, a recent study using an insect infection model
has shown that, given the opportunity, an enterococcal food isolate (LN68, isolated from Nisa
ewe’s milk, from the same bacterial collection as LN11) can cause a higher percentage of
mortality than the clinical isolate V583 (Gaspar et al., 2009).
Commensal isolates can be, in many ways, similar to clinical isolates and this fact surely has an
impact in the way we regard enterococci because, although they are not GRAS, they still
appear in daily used food products and even in probiotics. We need a better insight on this
matter which can be accomplished through further studies, based not only in genomics but
especially regarding transcriptome and proteome analysis.
1.5. Differential expression: a dual approach
1.5.1. Transcriptome
Numerous technologies have been developed with the sole purpose of better understanding
the transcriptome of an organism. Transcriptome is the entire RNA of a microorganism, the
8
result of gene transcription that can be modulated through several regulation mechanisms. For
this reason this type of study always implies a certain stress/environmental condition under
analysis surrounding the microorganism from which the transcripts are extracted, analyzed and
identified.
This kind of analysis has become easier for enterococci since the first Enterococcus complete
genome was sequenced, E. faecalis V583, making new gene sequences available
(Paulsen et al., 2003). In the past decade many other enterococcal genomes have been fully
sequenced, most of them from clinical isolates but also commensal (Brede et al., 2011) and
animal enterococci (Palmer et al., 2010).
The possibility of comparing whole-genomes can be useful and informative but, for comparing
closely related bacterial species or isolates, it is extremely expensive and these approaches do
not reflect how the environment influences gene expression (Shanks, Santo Domingo and
Graham, 2006; van Schaik, 2010). The use of transcriptomic approaches based in Reverse
Transcriptase PCR (RT-PCR), quantitative Real Time PCR (qPCR), RNA arbitrarily primed PCR
(RAP-PCR) or microarrays, allows to address those issues.
Both in RT-PCR and QPCR previous knowledge of the nucleotide sequence of the gene to be
analyzed is essential in order to design the primers that anneal with the transcript of interest.
There are works with enterococci which include these techniques.
The study from Carlos et al. (2010) that was previously referred was based in RT-PCR. Using
primers directed to known virulence determinants the authors compared gene expression under
the influence of several growth conditions and concluded that enterococci are able to express
virulence genes in different conditions regardless of their origin (food/clinical isolates) or species.
However, with RT-PCR it can only be performed a semi-quantitative analysis and expression
levels of each gene are usually compared with the expression observed for a housekeeping
gene.
QPCR has the advantage, in comparison to RT-PCR, of allowing a more sensitive and
quantitative analysis, since it measures nucleic acid abundance in real time. In 2002, Shepard
and Gilmore (2002) studied enterococci grown in serum and urine and used QPCR to analyze
the expression values of known virulence factors. One of their conclusions was that one of the
virulence factors, gelE the gelatinase encoding gene, was 7-fold induced during exponential
growth while cyl genes were only induced in stationary phase in urine. The abundance of
messenger RNA (mRNA) from adhesins genes such as agg and esp increased in exponential
growth in both serum and urine. These results showed not only the importance of the media that
simulate infection sites in the increase of virulence gene expression but also why it is important
in a transcriptomic analysis to define in which growth phase the RNA is extracted.
RAP-PCR was the methodology applied for the present investigation, it consists in using
random primers which anneal to several arbitrary regions in the RNA sample, due to low-
stringency conditions (Shepard and Gilmore, 1999; Benson, Wong and McClelland, 2000;
Le Breton et al., 2007). By using this method it is possible to analyze the transcriptome of a
microorganism exposed to a certain environment without having access to the genome
9
sequence or knowledge on specific primers or probes. This is the main advantage and the key
reason why we chose this approach.
This technique allows the identification of differentially expressed genes because with the use of
arbitrary primers we direct the PCR to the whole transcriptome and not towards a specific
transcript. Shepard and Gilmore (1999), using RAP-PCR, studied the influence of aerobiosis
and anaerobiosis on gene expression in Enterococcus. They identified seven genes that were
differentially expressed in those conditions and that showed significant levels of similarity to
known sequences in current databases. Four differentially expressed in anaerobic environment
were identified as Ycdl ABC transporter, Seryl-tRNA synthetase and two NADH
dehydrogenases. Catalase and two oxidoreductases were expressed in aerobic conditions.
Another important tool to be applied for transcriptome analysis is the microarrays which can
contain thousands of probes, allowing multiple genes to be compared at the same time. The
main disadvantage is the fact that the transcriptome is compared to a group of previously known
genes that are present in the microarray. Completely novel genes that may be expressed in the
condition under study do not emerge in microarrays. However, due to the ability to analyze
thousands of genes simultaneously this methodology is frequently applied and already
produced interesting results regarding enterococci.
The first microarray directed for the Enterococcus genus was built using the first whole-genome
sequenced from E. faecalis V583 (Aakra et al., 2005). It was then established a platform to test
several hypothesis in enterococci and many kind of stress conditions/environments, such as the
ones described on the microarray-based studies that we will further discuss.
Microarray studies using V583 grown in media with bovine bile showed that the differentially
expressed genes had membrane-associated functions implying that the membrane structure
and composition play a key role in E. faecalis bile tolerance (Solheim et al., 2007).
A similar work with V583 grown in blood also showed a change in membrane-associated
proteins and an increased expression of genes associated with general stress response, more
specifically oxidative stress protection, suggesting enterococcal adaptability do stressful
environments (Vebø et al., 2009).
Not only infection-like environments are being studied but also the response to antibiotics such
as cloramphenicol (Aakra et al., 2010) and erythromycin (Aakra et al., 2005). In both works the
settings under analysis induced the expression of drug resistance proteins, as expected, mainly
associated with membrane ABC-transporters or efflux pumps.
Microarrays studies can be used to define regulons from E. faecalis regulators such as CodY
studied in cells grown in a media with copper media (Reyes-Jara et al., 2010). They can also be
applied to more than one strain enabling comparisons such as in Vebø et al. (2010) work where
three strains (a probiotic, a laboratory and a clinical strain) grown in human urine showed an
overall similar response in energy and nitrogen metabolism, stress mechanisms, cell envelope
modifications, and trace metal acquisition. This type of analysis shows hundreds of differentially
expressed genes which, as we can see from these examples, allow the comparison of
organisms and the formulation of hypothesis for stress-adaptation mechanisms.
10
There are many approaches to choose from if the aim is to analyze the transcriptome, and
many of them have already been used to study enterococci and to help clarify the role of
environmental cues in enterococcal behavior, namely in the expression of known genes in this
genus. However, in the present investigation we chose the RAP-PCR technique since we
wanted to identify novel differentially expressed genes in isolates in which genome sequence is
not available.
1.5.2. Proteome
Each organism has a genome which encodes one or more copies of the genes that characterize
him. However, how that information is used to synthesize proteins is subject to various
mechanisms of regulation. That is why proteins are considered the true reflection of gene
expression and why there has been such a great effort to identify and characterize new proteins.
All the proteins in a bacterium constitute the proteome of that microorganism.
Due to proteome complexity it is necessary to use sophisticated methods for efficient separation
and sensitive detection of proteins. Separation techniques are mainly electrophoretic and
chromatographic but no technique can resolve all the proteins in the proteome (Issaq and
Veenstra, 2008). One dimension electrophoresis such as sodium dodecyl sulfate
polyacrylamide gel electrophoresis (SDS-PAGE) is not enough to resolve a complex protein
sample though it is quite informative and useful for identification. Some previous works
compared SDS-PAGE protein profiles and it was possible to separate the isolates into species,
regardless of their origin (Devriese et al., 2002; Alves et al., 2004).
A two dimension electrophoresis (2DE) has a greater resolution power, since it separates the
proteins according to their isoelectric point and molecular weight. 2DE starts with an IEF
(isoelectric focusing) where the proteins migrate in an immobilized pH gradient according to
their isoelectric point. Then it takes place a SDS-PAGE which separates the proteins according
to their molecular weight. The result, after staining, is a series of spots which, ideally, represent
a protein each. Through this technique it is possible to identify which proteins (spots) are being
differentially expressed by comparing samples. Usually this method allows only one sample to
be analyzed in each gel. Some advances made it possible to analyze more than one sample in
the same gel, by marking each sample with a distinct fluorescent marker (2D-DIGE:
Two-dimensional Differential In-gel Electrophoresis). This can improve gel reproducibility but it
is quite expensive (Issaq and Veenstra, 2008).
Direct analysis of the spots in a 2DE gel is useful in terms of identifying isoelectric point,
molecular mass and relative quantity of a specific protein. However, in a complex matrix of
spots many are unknown and a further step is needed: mass spectrometry (MS) to identify the
protein comparing the results to existing databases.
There are several methods for protein sequencing which can be put to use depending on the
previous technique used and the desired application. Prior to 2DE one possible approach is
Matrix Assisted Laser Desorption and Ionization – Time of Flight (MALDI-TOF). The basis of
MALDI is that the molecule is vaporized and ionized by a laser pulse and then its mass is
11
measured by the time taken for the ions to pass down a time of flight detector. This method is
more appropriate for peptides and that is why the protein of interest is previously digested with a
peptidase such as trypsin. The tryptic peptides are desalinized and concentrated and the
sample is analyzed in a MALDI-TOF system. Knowing the peptides mass and amino acid
sequence we can use that information for peptide mapping and to identify the protein.
In Enterococcus there are already some 2DE reports which tested stress/environmental
conditions. The stress proteome has been analyzed in several studies, stress factors such as
temperature, SDS, hydrogen peroxide, salts and starvation. Most of the molecules that were
regulated and identified were general stress proteins (heat shock proteins) or in some way
involved in energy metabolism. The authors concluded that E. faecalis was able to persist in
adverse environments as vegetative cells with low metabolic activity, via the activation of the
viable but nonculturable (VBNC) state or, in case of nutrient depletion in starvation state.
Whether or not they would enter one of those two states depended on the environmental cues
(e.g. water lake at low temperatures and directly illuminated or, glucose depletion respectively).
Overall they demonstrated that VBNC and starvation were two physiologically distinct states
which activated distinct protein expression profiles in response to several stress signals,
suggesting enterococcal high adaptability to extremely harsh conditions (Giard et al., 1996;
Giard et al., 2001; Heim et al., 2002).
In V583 grown with bovine bile, proteins involved in fatty acid metabolism were overrepresented
among the regulated proteins (Bøhle et al., 2010). Lastly, the last resort antibiotic vancomycin
has been tested in two separate works: one in two clinical isolates, V583 and V309, (Wang et
al., 2010) and the other in a seagull isolates (Radhouani et al., 2010). In both studies, as
expected, proteins with vancomycin resistance functions were up-regulated as well as others
related to virulent factors, stress, metabolism, translation, and conjunction, enabling
Enterococcus to survive under drug selection.
All these works in 2DE, so far, enabled to identify several molecules, in comparison to previous
databases, which, as our knowledge furthers, will helps us to understand the adaptation
mechanisms in enterococci and how it affects their physiological state. It is a hardworking and
expensive process but, it is quite informative and therefore one of the main trends in modern
proteomics.
1.5.3. Integrative analysis
Transcriptome and proteome can be seen as separate parts of a bacterial system. However,
they should be regarded as a whole when considering overall stress tolerance/adaptation
mechanisms and general functional systems in a microorganism. Both analyses are
interconnected because there are complex relationships between genes and proteins essential
to maintain a functional organism. The amount of information generated is overwhelming and it
must be integrated in a growing amount of previously available data in several databases.
Identifying the main molecules is, therefore, not enough to understand their functionality.

12
Microbes can respond, adapt, and change their external environment through differential
expression of genes and proteins that lead to alterations in the structure, behavior and
metabolism of the organism. If we compare some of the previously referred transcriptomic and
proteomic works we can see how similar this change is in gene expression and proteins. Taking
into consideration Solheim et al. (2007) and Bøhle et al. (2010) works, both, through completely
separate approaches concluded that bovine bile induced differential expression in
genes/proteins involved in fatty acid metabolism (Solheim et al., 2007; Bøhle et al. 2010).
Another example is the response in Enterococcus to antibiotics such as chloramphenicol
(Aakra et al., 2010), erythromycin (Aakra et al., 2005) and vancomycin (Radhouani et al., 2010;
Wang et al., 2010). Each antibiotic induced expression of specific molecules but a common
response was the differential expression of drug resistance and stress related genes/proteins.
These studies allow us to assess if a gene expressed in a defined condition will be translated
and result in a similar protein expression level, or vice-versa. We cannot ignore regulation
mechanisms that can, for instance, degrade proteins or silence transcripts, which would
possibly result in different outcomes whether we are analyzing the transcriptome or the
proteome. As we can see, this integrated analysis gives us a broader image of the molecule
interactions and the system that is the enterococcal bacteria.
A further development for integrative analysis is post-genomic studies. This would include gene
knock-out technology and the use of animals as an in vivo model to study the pathogenicity
potential of a microorganism. Animal models are truly important because in vitro essays, though
essential, cannot demonstrate the complex interactions between host and pathogen necessary
to extrapolate for human hosts (Falkow, 2004).
Animal models are used as an attempt to address causality, this is, to attribute a certain gene a
function that can be proven and demonstrated in these animals. In a certain way, this line of
thinking fallows in principle the Robert Koch’s postulates (Fredericks and Relman, 1996), which
defend the search to establish causality with coherence and plausibility. In animal models
several strategies can be applied but mainly they resort to the use of mutants that do not have
the gene in analysis in comparison to the wild type (Gaspar et al., 2009) or even
Recombination-based In Vivo Expression Technology (RIVET) that allows in vivo activated
gene analysis (Hanin et al., 2010).
Comprehending mechanisms underlying pathogenicity potential is a long road that includes the
integration of transcriptomic and proteomic data acquired. An integrative analysis is required so
we can formulate a hypothesis and advance to post-genomic studies.
1.6. Aims of the study
Enterococci are the cause of several serious healthcare associated infections such as urinary
tract infections, meningitis, endocarditis and bacteremia. The origin of the clinical isolates
responsible for these infections is still not well understood; some attribute the infection to the
patient’s own intestinal microbiota, while others assume the occurrence of dissemination
through the food chain or by direct contact between humans, animals or the environment.

13
In the present investigation we compared dairy isolates from Portuguese artisanal cheese and
milk with a clinical strain from a human infection in order to compare their potential
pathogenicity.
Many food enterococci, such as these dairy isolates, are known to harbor several virulence
genes, which are normally not expressed in their normal growth conditions. Thus, defining the
signaling cues that lead to virulence gene expression and the development of infection is crucial.
To determine which environmental cues may be important for the modulation of gene
expression in enterococci we compared the transcriptome and proteome of food and clinical
enterococci grown in distinct conditions (simulating commensal and pathogenic lifestyle) in
order to identify which genes/proteins are differentially expressed and in which conditions.
Overall, our main goal was to, through these complementary approaches, further understand
enterococcal pathogenicity mechanisms and identify the environmental cues that may lead to a
switch from a commensal to a pathogenic lifestyle.
14
2. Materials and Methods
2.1. Microorganisms and growth conditions
In this study three strains were investigated: Two dairy enterococci, one from Portuguese ewe’s
cheese from Serra da Estrela (QSE123, E. faecalis) and the other from Portuguese ewe’s milk
from Nisa (LN11, E. casseliflavus) and a clinical obtained from a blood culture in the United
States (V583, E. faecalis). For the present study the enterococci under analysis were grown in
several media used to simulate different environmental conditions, such as commensal
colonization and infection sites. Table 1 summarizes the growth conditions and corresponding
controls.
Table 1 - Growth conditions under analysis.
Environment Environmental condition Control
pH value
NaCl (%) Media Plate/broth Medium Plate/broth
Infection
2YT + 10% sheep’s blood in
anaerobiosis Plate
2YT
Plate
7.0
0
2YT + 10% sheep’s blood in
aerobiosis
Broth
BHI
Broth
7.4 BHI + 1% Bovine Bile
Horse Serum 7.7
Urine 6.0
Colonization Skim Milk Plate 7.0 2.5
5.0
6.5
Enterococci are associated with a large variety of infections, such as endocarditis and
meningitis therefore, one of the media selected to simulation infection sites was Brain Heart
Infusion (BHI) broth (Sharlau). These bacteria are also known to colonize the gastrointestinal
tract and bile is a major stress factor enterococci have to cope with in order to colonize and
survive in that environmental condition so we chose to use BHI supplemented with 1% Bovine
Bile (Sigma) to simulate it. The concentration used in this study is in between the physiological
levels found on the intestine, 0.2 to 2% (Solheim et al., 2007). Human urine was used since
enterococci are also related with urinary tract infections both in humans and animals. Urine from
two healthy volunteers (a male and a female without a recent history of urinary tract infection or
15
antibiotic usage) was sterilized by filtration through a 0.2 μm-pore-size membrane before use.
An increase in bacteremias due to enterococci led to the inclusion of horse serum and 2YT
supplemented with 10% sheep blood both at aerobiosis and anaerobiosis (GENbox anaer,
bioMérieux).
The strains used in this work were isolated from dairy products (milk and artisanal cheese)
therefore to mimic those conditions skim milk (Sharlau) plates were used. Skim milk was
sterilized for 5 minutes at 121°C followed by rapid cooling. The highest saline concentration
found in the cheeses from which the enterococci were isolated was 2.5% and the highest
reported NaCl concentration tolerated by enterococci is 6.5%. Taking this into account, we used
skim milk plates with 0%, 2.5%, 5.0% and 6.5% of NaCl.
2x yeast tryptone (2YT) medium broth (1.6% tryptone, 1% yeast extract and 0.5% NaCl) was
used as the basic control condition, since it contains a relative minimum amount of infection
cues (contrary to, for example, Brain Heart Infusion). Incubations throughout this study were
performed at 37°C, the human body temperature.
The enterococci under analysis were pre-cultured overnight in 2YT broth pH 7.0 at 37°C in
order to obtain a fresh cellular suspension. Subsequently, bacterial cells (ca 109 cfu) were
collected by centrifugation, the pellet washed twice with 0,1M phosphate buffer saline (PBS)
pH 7.0 and resuspended in 100 l of the same buffer. For each of the media previously
described, 10 ml of broth or a plate (ϕ=9cm) were inoculated with 100 µl of this cellular
suspension followed by incubation at 37°C. The cells were collected by centrifugation when the
culture reached either the late exponential phase of growth (liquid media) or overnight (solid
media).
The time needed to reach the late exponential phase of growth for the strains under study was
calculated in a previous work (Carlos et al., 2009) for all the media used except for horse serum,
2YT pH 7.7 and BHI supplemented with 1% BB. For these media, the growth curves of the
enterococci LN11, QSE123 and V583 were performed during the present work using the
Microbiology Workstation Bioscreen C® (ThermoLabSystems) as previously described
(Carlos et al., 2009).
The three bacterial cultures were grown in duplicate using all the media under analysis; one
pellet was used for RNA extraction and the other for protein extraction (procedures described
subsequently).
2.2. Transcriptomic approach
2.2.1. RNA extraction, quantification and treatment with DNase I
For RNA extraction, each bacterial pellet was resuspended in 250 µl Tris–EDTA with 10 mg.ml-1
lysozyme (Sigma) and incubated at 37°C for 1 h. RNA isolation was performed with the Trizol®
reagent (Invitrogen, Life Technologies) according to manufacturer instructions. At the end of the
procedure the RNA pellet was air-dried and resuspended in 50 µl of DEPC-treated water. The
RNA was divided in 10 µl aliquots each and stored at -80°C. RNA integrity was assessed by

16
electrophoresis in 0.8% agarose gels. RNA quantification was determined in the Nanodrop
2000c (ThermoScientific).
In order to avoid false positives 2 to 5 µg of RNA from each sample were treated with 5 U
RNase-Free DNase I (Epicentre Biotechnologies) and incubated at 37°C for 1 hour and
20 minutes. Reaction was terminated by addition of EDTA to a concentration of 1.25 mM and
incubation at 65°C for 15 min. The efficiency of DNase treatment was confirmed by PCR using
primers pA (5’-AGAGTTTGATCCTGGCTCAG-3’) and 907R (5’-CCGTCAATTCMTTTRAGTTT-3’)
(Invitrogen, Life Technologies) directed to the housekeeping gene, 16S rRNA. If the treatment
was successful we expected no amplification.
2.2.2. RNA Arbitrarily Primed PCR
To synthesize the complementary DNA (cDNA) from the RNA we performed a Reverse
Transcriptase Polymerase Chain Reaction (RT-PCR) as described below.
For each sample of treated RNA a total of five independent reactions were performed, using five
arbitrary primers: (GTG)5 (5’-GTGGTGGTGGTGGTG-3’), pH (5’-AAGGAGGTGATCCAGCCGCA-3’),
M13 (5’-GAGGGTGGCGGTTCT-3’), OPC15 (5’-GACGGATCAG-3’) and OPC19 (5’-GTTGCCAGCC-3’)
at low annealing temperature, a RNA arbitrarily primed PCR (RAP-PCR). Each RAP-PCR
mixture contained 0.2 µg RNA, 0.1 mM deoxynucleoside triphosphates (VWR), 50 pmol of one
of the arbitrary primers (Invitrogen, Life Technologies) and DEPC-treated water to a final volume
of 10 µl. This mixture was heated for 5 minutes at 65°C and transferred to ice for 1 minute. To
the previous mixture a second was added: 1X First-Strand Buffer, 0.01M DTT, 40 U RNaseOUT
Recombinant RNase Inhibitor, 100U SuperScript III Reverse Transcriptase (Invitrogen, Life
Technologies) and sterile water treated with DEPC to a final volume of 10 µl. Total reaction
volume becomes 20 µl. The mixtures were incubated for 10 minutes at 25°C, followed by
50 minutes at 50°C and finally 10 minutes at 85°C. The cDNA was stored at -20°C until further
use.
A second PCR was performed using the cDNA as template and the same arbitrary primer used
for cDNA synthesis. Each reaction mix consisted in 1X Reaction Buffer, 3mM MgCl2 (NZYTech),
0.2 mM dNTPs (VWR), 2 µM of primer, 1 U Taq (NZYTech) in a total volume of 25 µl. Each
reaction was incubated for 5 minutes at 95°C, followed by 40 cycles of 1 minute at 95ºC,
2 minutes at 37°C, 2 minutes at 72°C and a final elongation step of 10 minutes at 72°C. All
amplification reactions were performed in a Doppio thermocycler (VWR).
2.2.3. Polyacrylamide Gel
To separate the RAP-PCR amplification products the samples were resolved in
6% polyacrylamide Novex TBE Gels (Invitrogen, Life Technologies) for 3h 30min at 60V in
1X TBE running buffer. In each well were applied 8 µl of sample, 2 µl of sample buffer and 2 µl
of 20X GelRed (Biotium). 5 µl of 1 Kb Plus DNA ladder (Invitrogen, Life Technologies) was used

17
to normalize all the gels. Gel images were acquired in ImageMaster VDS DE 230 VAC
(Pharmacia Biotech) using LISCAP image capture software.
2.2.4. Amplicon isolation and reamplification
The polyacrylamide gels were analyzed visually by comparing each condition to its respective
control in order to select the differential amplification products to be excised from the gel.
Differential amplicons, i.e. amplification products present in the environmental condition but
absent in the control, were excised from the gel using a sterile scalpel. The excised gel slices
were immersed in 100 µl of Tris-EDTA (TE) buffer and kept at 4°C until further use.
To reamplify the excised amplicons a PCR reaction was performed in a Doppio thermocycler
(VWR). Each reaction mix consisted in 1X Reaction Buffer, 2.5 mM MgCl2 (NZYTech),
0.2 mM dNTPs (VWR), 2 µM of the corresponding primer, 1 U Taq (NZYTech), 1 µl of the
amplicon eluted in TE buffer and ultrapure water to a total volume of 25 µl. Each reaction was
incubated for 5 minutes at 95°C, followed by 35 cycles of 1 minute at 95ºC, 1 minutes at 55°C,
1 minutes at 72°C and a final elongation step of 10 minutes at 72°C. The amplification products
were visualized on 1.2% agarose gels TBE 0.5X run for 1h 30m at 90 V to confirm a successful
reamplification.
2.2.5. Cloning and sequencing
Two differential amplicons were selected for each strain, LN11 and QSE123, and condition
under analysis. After reamplification these DNA fragments were cloned in NZYStar competent
E. coli cells (NZYTech) using the TA Cloning Kit (Invitrogen, Life Technologies) according to the
manufacturer instructions.
After selecting transformants by the standard criteria white/blue colonies on LB, supplemented
with 100 µg/ml ampicillin, 20 µg/ml X-Gal and 20 µg/ml IPTG, the insertion of the fragment was
further confirmed by PCR amplification, using primers T7 and M13R, direct for the vector
(pCR2.1). PCR amplifications used 2 µl of DNA obtained by boiling (pick 1 colony with a sterile
tip, solubilized it in 50 µl of TE with 0.1% Tween 20, heat at 100°C for 10 minutes, kept on ice
for 2 minutes and centrifuged for 2 minutes at 14000 rpm), 1X Reaction Buffer, 2 mM MgCl2
(NZYTech), 0.2 mM dNTPs (VWR), 0.5 µM of primers T7 (5’-TAATACGACTCACTATAGGG-3’) and
M13R (5’- CAGGAAACAGCTATGAC -3’) (STABvida) and 1 U Taq (NZYTech) in a total volume of
25 µl. Each reaction was incubated for 5 minutes at 95°C, followed by 25 cycles of 30 seconds
at 95ºC, 30 seconds at 55°C, 30 seconds at 72°C and a final elongation step of 10 minutes at
72°C.
Whenever PCR confirmed the correct insertion of the DNA fragment the corresponding clone
(E. coli harboring plasmid pCR2.1 with the insert) was grown in 1 ml LB broth supplemented
with 100 µg/ml ampicillin overnight at 37 ºC and 200 rpm. The plasmids were extracted and
purified with Spin Plasmid mini kit two (Invisorb) according to manufacturer instructions. The
2 µl of each plasmid were visualized in 1.2% agarose gels to confirm the extraction efficiency

18
and plasmidic DNA was sent to STABvida (Portugal) for nucleotide sequencing using primers
T7 and M13R.
2.2.6. Data analysis
To validate the methodology used we performed 10% biological and technical replicates.
Biological replicates consisted in selecting a combination of strains/conditions (e.g. QSE123
grown in BHI supplemented with 1%BB and LN11 in 2YT supplemented with blood in
anaerobiosis, urine and respective control) and repeating the entire procedure, from growth and
RNA isolation until separation of the amplicons on polyacrilamide gels. For the technical
replicates we repeated the RAP-PCR using treated RNA from previously prepared samples.
The analysis of RAP-PCR profiles was achieved by visual comparison of the patterns obtained
after growth under the environmental conditions and respective controls, in order to identify
differential bands.
To identify the differentially expressed genes, the nucleotide sequence of the cloned amplicons
was compared to NCBI Nucleotide Online database.
2.3. Proteomic approach
2.3.1. Protein extraction and quantification
For protein extraction, each pellet was washed with ultrapure water and resuspended in 200 µl
of extraction buffer: 7 M Urea, 2 M Thiourea, 1% Dithiothreitol (DTT), 2% CHAPS (Invitrogen)
and Complete Mini Protease Inhibitor Cocktail -1 tablet for each 10 ml of extraction buffer-
(Roche Applied Science). Cells were disrupted by sonication, 5 times 30 seconds impulses at
0.3 cycle and 90% power in the ultrasonic homogenizer SONOPULS HD 2070 MS 72
(BANDELIN). The extracts were in an orbital shaker for 1 hour at room temperature and
centrifuged at 15000 rpm and 4°C for 15 minutes to pellet insoluble components. The
supernatant, which constituted the total protein extract, was transferred to a new tube and kept
at -20ºC. Before use, all extracts were thawed for 30 minutes at room temperature with gentle
shaking.
For protein quantification we used Pierce 660nm Protein Assay (ThermoScientific). The assay
consisted in mixing 60 µl of Pierce Reagent with 4µl of the protein extract diluted in ultrapure
water. After 5 minutes at room temperature, the absorbance was measured at a wavelength of
660nm in the NanoDrop c2000 (ThermoScientific). A calibration curve, to which all samples
were compared, was obtained using the Albumin Standard Pre-Diluted Set (ThermoScientific).
2.3.2. One-Dimensional Gel Electrophoresis (1DE)
The whole-cell protein extracts were analyzed by SDS-PAGE in NuPAGE® Novex 4-12% Bis-
Tris Midi Gels (Invitrogen). A total amount of 12 µg of protein was mixed with 2X SDS-PAGE

19
sample buffer in a total volume of 20 µl. For each gel 5 µl of Novex® Sharp Unstained Protein
Standard were applied. The gel ran for 1h 45 min at 125 V in 1X MOPS SDS Running Buffer
(Invitrogen). Gels were stained with SimplyBlue Stainer (Invitrogen, Life Technologies)
according to the manufacturer microwave protocol.
In order to analyze protein content of the media under study, samples from the media BHI,
sheep’s blood, skim milk and horse serum were also applied in a SDS-PAGE.
2.3.3. Two-Dimensional Gel Electrophoresis (2DE)
Isoelectric focusing (IEF) was performed according to the ZOOM IPGRunner (Invitrogen)
protocol in Immobilized pH gradient (IPG) strips with a broad pH range (pH 3-10 nonlinear strip;
Invitrogen). A total of 15 µg of protein was mixed with 155 µl of rehydration buffer (8 M Urea,
2% CHAPS, 0.5% ampholytes pH 3-10, 0.002% bromophenol blue and 20mM DTT) and applied
in the strips, rehydration step took 14 hours. After rehydration the IEF run was immediately
performed in four steps: 20 min at 200V, 15 min at 450V, 15 min at 750V and 4 h at 2000V.
Subsequently the strip was equilibrated in 5 ml of Equilibrating Buffer (1X NuPAGE® LDS
Sample Buffer and NuPAGE® Sample Reducing Agent 1X) for 15 minutes at room temperature
and kept at -80ºC overnight.
Before advancing to the second dimension the strip was unfreezed and re-equilibrated in
equilibration buffer for 15 minutes at room temperature. The second dimension was performed
in NuPAGE® Novex 4-12% Bis-Tris ZOOM® Gels (Invitrogen) in a XCell SureLock™ Mini-Cell
with 1X MOPS SDS Running Buffer (Invitrogen). For each gel 5 µl Novex® Sharp Unstained
Protein Standard (Invitrogen) was used. The run was for 45 min at 200V. The gels were stained
with the Silver Staining Kit Protein (Invitrogen, Life Technologies) according to the manufacturer
instructions.
2.3.4. Data analysis
The 1DE/2DE images were acquired using a HP Officejet 4500 multifunction printer.
The BioNumerics software (version 6.6, Applied Maths) was used to analyze SDS-PAGE
protein profiles (1DE). Dendrograms were constructed using the Pearson (r) correlation
coefficient and the agglomeration method UPGMA.
For 2DE the analysis was visual and consisted on comparing the spots obtained each isolate in
order to identify differentially expressed proteins. For each protein extract three replicas of 2DE
were performed, only the spots present in the three gel replicas were considered for analysis.

20
3. Results and Discussion
In this study, in order to understand which environmental cues induce differential expressed
genes/proteins in food and clinical isolates, we used a series of media simulating colonization
(skim milk with 0%, 2.5%, 5.0% and 6.5% NaCl) and infection sites (urine, BHI,
BHI + 1% bovine bile, horse serum and 2YT supplemented with 10% sheep’s blood).
We grew LN11, QSE123 (dairy isolates) and V583 (human clinical isolate) in these media to
study their gene expression triggered by environmental cues.
Shepard and Gilmore (2002) demonstrated that, enterococci modulate their gene expression
throughout their life cycle and that in serum and urine virulence genes are down-regulated from
log to stationary phase. To isolate the RNA and proteins being differentially expressed in both
phases, in this work we collected the cell pellets in late log phase as it was performed in
Carlos et al. (2009) work. The late log phase is the moment when the enterococcal isolate
reaches the highest O.D. value.
In Carlos et al. (2009) work all the growth curves for these strains and media were determined
except for BHI supplemented with 1% Bovine Bile (BB), skim milk, 2YT supplemented with 10%
sheep’s blood, horse serum and its control 2YT pH 7.7. So, the aforementioned growth curves
were determined in the present work for LN11, QSE123 and V583 using the conditions
previously described for the Microbiology Workstation Bioscreen C® (ThermoLabSystems),
results presented in Figure 1.
Figure 1 - Growth curves from LN11 (—), QSE123 (—) and V583 (—) grown in two media simulating
infection (horse serum and BHI + 1%BB) and serum control medium (2YT pH 7.7) representing the mean values from the three replicas. x axis indicates time (h) and y axis O.D. (wideband: 420 nm–580 nm).
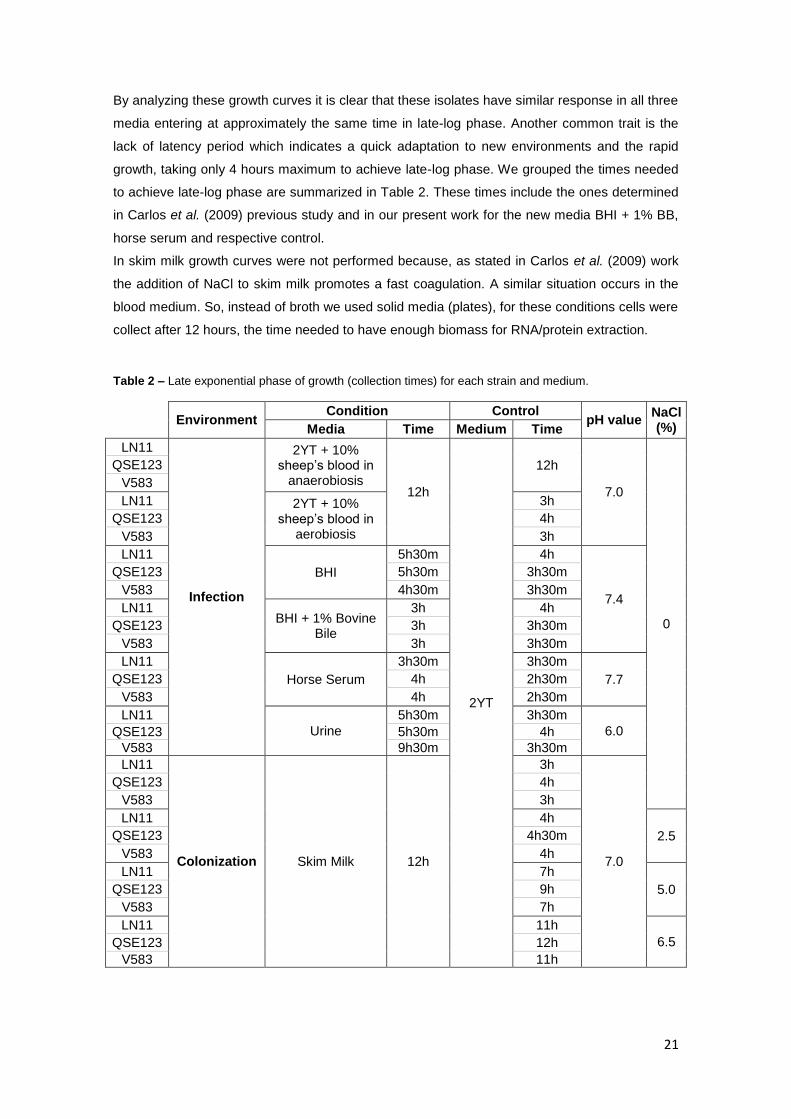
21
By analyzing these growth curves it is clear that these isolates have similar response in all three
media entering at approximately the same time in late-log phase. Another common trait is the
lack of latency period which indicates a quick adaptation to new environments and the rapid
growth, taking only 4 hours maximum to achieve late-log phase. We grouped the times needed
to achieve late-log phase are summarized in Table 2. These times include the ones determined
in Carlos et al. (2009) previous study and in our present work for the new media BHI + 1% BB,
horse serum and respective control.
In skim milk growth curves were not performed because, as stated in Carlos et al. (2009) work
the addition of NaCl to skim milk promotes a fast coagulation. A similar situation occurs in the
blood medium. So, instead of broth we used solid media (plates), for these conditions cells were
collect after 12 hours, the time needed to have enough biomass for RNA/protein extraction.
Table 2 – Late exponential phase of growth (collection times) for each strain and medium.
Environment Condition Control
pH value NaCl (%) Media Time Medium Time
LN11
Infection
2YT + 10% sheep’s blood in
anaerobiosis 12h
2YT
12h
7.0
0
QSE123
V583
LN11 2YT + 10% sheep’s blood in
aerobiosis
3h
QSE123 4h
V583 3h
LN11
BHI
5h30m 4h
7.4
QSE123 5h30m 3h30m
V583 4h30m 3h30m
LN11 BHI + 1% Bovine
Bile
3h 4h
QSE123 3h 3h30m
V583 3h 3h30m
LN11
Horse Serum
3h30m 3h30m
7.7 QSE123 4h 2h30m
V583 4h 2h30m
LN11
Urine
5h30m 3h30m
6.0 QSE123 5h30m 4h
V583 9h30m 3h30m
LN11
Colonization Skim Milk 12h
3h
7.0
QSE123 4h
V583 3h
LN11 4h
2.5 QSE123 4h30m
V583 4h
LN11 7h
5.0 QSE123 9h
V583 7h
LN11 11h
6.5 QSE123 12h
V583 11h
22
Looking at the growth curves in horse serum (Figure 1), compared to rabbit serum
(ΔAmax<0.15) used previously in Carlos et al. (2009), enterococci show lower O.D. values
(ΔAmax<0.08) possibly indicating the rapid use of the few nutrients in this medium. This is the
media in which they take more time to reach late-log phase from these three media in analysis.
These differences may be due to, not only, different nutritional composition but also to the pH
value. Rabbit serum has a pH value of is 7.0 and horse serum pH 7.7. It is possible that this
difference in pH value may affect both growth behavior and gene expression, as demonstrated
in a previous work in which higher pH values in 2YT decreased enterococcal virulence-related
genes expression (Carlos et al., 2010).
LN11 grown in the horse serum control condition, 2YT pH 7.7, had a similar though different
response in comparison to QSE123 and V583. QSE123 shows the higher O.D. value
(ΔAmax=0.55) and a growth kinetic similar to V583. LN11 has a longer stationary phase but the
same maximum O.D. value as V583 (ΔAmax=0.50) indicating a longer resistance to nutrition
depletion in higher pH values.
In Carlos et al. (2009) the growth curves from these three isolates grown in BHI were
determined and the highest O.D. value (ΔAmax=0.67) was similar to the one (ΔAmax=0.62) in
BHI supplemented with 1% BB growth curves in this study, indicating that growth was not
significantly affected by the addition of bovine bile. In Solheim et al. (2007) work, they also
determined the V583 growth curve for BHI with and without bile at various concentrations.
Consistently with our work they found that V583 had similar growth rates in those conditions
and that 1%BB slightly decreased the final cell densities comparing to BHI. This reflects that
1% BB does not compromise enterococcal growth and that both food and clinical isolates can
tolerate bile levels within the range from 0.2 to 2.0% found in human intestine. It is plausible to
assume that these isolates could reach the intestine and integrate the gastrointestinal
microbiota through oral ingestion, which is likely to happen with food isolates.
Once again it is clear that enterococci, regardless of the origin have the ability to adapt and
grow in media simulating infection sites which adds to their pathogenicity potential.
To advance to the transcriptome and proteome analyses the isolates were grown in all
conditions and respective controls up to the late log phase when cells were collected, one pellet
for each analysis.
3.1. Transcriptome Analysis
In the present study LN11 and QSE123 were grown in different environments in order to
evaluate their differential gene expression in response to distinct environmental cues. To study
the mRNA (transcriptome) from genes being differentially expressed in each condition we
collected cells grown to late log phase, or after 12 hours for plate media.
RNA was extracted using trizol reagent. In this method not only RNA is extracted but also some
DNA remains. It is extremely important to completely remove this DNA because the cDNA
synthesis reaction does not distinguish RNA template from DNA template; if not removed, the

23
presence of DNA produces false positives. So, when performing a PCR reaction with primers
pA and 907R and the treated RNA we expect no amplification.
A treatment with DNase I usually solves the problem of DNA contaminating RNA however, in
our samples the amount of DNA was high so, the conventional treatment was not fully efficient.
Taking this in consideration the amount of treated RNA was diminished to a minimum of
2 µg/5U DNAse I and the treatment time was increased from 30 minutes to 1h 20m. These
measures were sufficient to clean the RNA sample from DNA and when the PCR with primers
pA and 907R was repeated there was no amplification.
Having the treated-RNA cDNA was synthesized using five arbitrary primers: (GTG)5, M13,
OPC15, OPC19 and pH in independent reactions and the amplification products were
separated in polyacrylamide gels. The objective was to obtain different RAP-PCR profiles using
RNA from LN11 grown in different growth conditions and to understand which primer produced
more differential amplification products in the conditions under analysis. For this preliminary
analysis we only considered 7 conditions: BHI, sheep’s blood in aerobiosis, urine and skim milk
with 0%, 2.5%, 5.0% and 6.5% NaCl (and respective controls) versus five arbitrary primers.
We compared the profile obtained for each condition with its respective control and found that
there were bands common to both profiles which can be explained by the amplification of
ribosomal RNA and mRNA of housekeeping genes present in every sample. Bands that were
differentially expressed in the growth conditions, i.e., present in the condition but absent in the
respective control were selected. Some bands were more intense than others which might
indicate subtle differences in gene expression.
Table 3 resumes the number of differentially expressed bands found for each condition/primer.
The primer with the highest number of differential bands for the 7 conditions was OPC19 with a
total of 45 differential bands. For these conditions and primers an average of 21 differential
bands were observed.
Table 3 - Number of differential bands from RAP-PCR profiles using RNA from LN11 grown in seven distinct conditions and five arbitrary primers.
Environment Media NaCl (%)
Arbitrary primers
(GTG)5 M13 OPC15 OPC19 pH
Infection
BHI
0 2 4 2 0
Urine 2 3 3 6 4
2YT + 10% Sheep blood, aerobiosis
0 2 4 5 5
Colonization Skim Milk
0 2 2 2 10 3
2.5 3 1 0 9 2
5.0 3 1 1 9 1
6.5 5 2 2 4 1
Total number of differential bands 15 13 16 45 16
Total number of bands 95 67 37 83 53

24
In general, all RAP-PCR reactions, independently of the primer used, had differential
amplification products however, if we consider the primers (GTG)5, OPC15 and pH, some
conditions did not have any differential band (marked with gray in Table 3). Though with primer
M13 there are differential bands in all conditions they represent only 19% (13/67) of total
number of bands compared to 54% (45/83) with primer OPC19. Given the number of bands and
their distribution throughout the conditions of interest the primer chosen to continue this analysis
was OPC19. Therefore RAP-PCR using RNA from QSE123 were performed using only the
primer OPC19.
RAP-profiles for RNA extracted from LN11 and QSE123 grown in urine, skim milk and
respective controls are represented in Figure 2. By comparing LN11 and QSE123 profiles we
can see that their profiles are completely different, showing that these two enterococci have a
distinct response to these environments. To better evaluate this differential expression we
compared the percentage of differential bands in each profile.
Figure 2 – RAP-PCR profiles in polyacrylamide gel using primer OPC19 and RNA extracted from LN11 (A)
and QSE123 (B) grown in urine, skim milk (S.M.) 0% NaCl and respective controls. Differentially expressed genes are marked with a red line.
In QSE123 we selected 15 differential expressed amplicons, about 18% (15/82) of the total
number of bands in the seven conditions, less than in LN11 where we had 45 which
represented 54% (45/83) of the bands. Comparing by colonization/infection media, in QSE123
47% (7/15) of the differential bands were induced by growth in colonization environments (skim
milk) while in LN11 this corresponded to 71% (32/45) of the bands. These results suggest that
in these growth conditions LN11 modulates gene expression more than in infection-like media.
This is no surprise since LN11 was isolated from milk and is probably highly adapted to this
environment expressing all the machinery needed to survive in this media.
There is a similar percentage of differential bands found for QSE123 grown in media related to
colonization and infection sites, 47% (7/15) and 53% (8/15) respectively, which may indicate its
similar adaptability to both environments. In Carlos et al. (2010) work then comparing virulence
genes expression in both colonization/infection media a similar conclusion was taken. It was

25
stated that QSE123 is able to adapt and activate virulence gene expression despite the growth
condition, especially because virulence factors, namely cytolysin genes, were up-regulated by
infection media (serum and urine), skim milk at 37°C and 2YT with NaCl at 30 and 37°C.
Considering QSE123 virulence-gene expression and its adaptability to all growth conditions
here tested, all these results contribute to evidence this strain’s potential for being pathogenic.
Looking back at Figure 2, in LN11 RAP-profiles in urine and skim milk 0% NaCl differential
bands represent 55% (6/11) and 56% (10/18) of the total number of bands in the profile,
respectively. Since differential bands are selected by comparison of the condition RAP-pattern
with the corresponding control, this seems to indicate an ability of LN11 to modulate gene
expression in response to cues present in the environments under analysis. However, the
strongest response for LN11 was in skim milk with 5.0% NaCl. About 69% (9/13) of the
RAP-profile was constituted by differential bands. This may be due to the increase in NaCl
concentration although in skim milk, with 6.5% NaCl, this percentage is the lowest for all
colonization media, about 50%(4/8). In Carlos et al. (2010) work using these isolates they found
that expressions levels seemed to be unaffected by the increase of NaCl. A hypothesis is that
slightly lower NaCl concentrations, up to 5.0%, induce a larger number of genes related to
stress and osmotic response mechanisms. Skim milk 6.5% NaCl has the maximum salt
concentration tolerated by enterococci which may block expression of unnecessary genes due
to a state of resistance to high osmotic pressure.
The lowest differential band percentages were observed in LN11 grown in BHI and sheep’s
blood (33% and 45% respectively). The lower percentage in blood can be due to the fact that
the media only had 10% of blood. In Vebø et al. (2009) work they performed a microarray using
the clinical isolate V583 grown in 2YT supplemented with blood and only in blood. They found
that there were merely 148 significantly regulated genes in comparison to 549 when V583 grew
in 100% blood, which may explain our results. Another important factor to remember is that
LN11 growth in this medium was in plate and cells were not collected in late log phase as in the
other media. The same applies to skim milk plates. It is important to remember that these
results are not directly comparable to the ones in broth media.
In QSE123, RAP-profile for urine showed 31% (4/13) differential bands respectively. Urine was
the medium with higher percentage of differential bands from all conditions. Similarly to LN11,
this is the infection media that induces more differentially expressed genes. This shows a
superior ability of these food isolates to respond and to adapt to urine.
As stated before, urinary tract infections is one of the most common associated enterococcal
infections. Previous works concluded that urine usually induced more virulence gene expression,
such as the operon cyl, esp and gelE, which are important virulence determinants in the
Enterococcus genus (Shepard and Gilmore, 2002; Carlos et al., 2010).
In Vebø et al. (2010) work, a microarray based transcription analysis with pathogenic and
probiotic isolates grown in urine, they were not able to identify pathogen specific genes but
found that there was overall similarity between the transcriptional responses of pathogenic and
non-pathogenic strains. Taken this into account, further attention should be given in the future to
the gene expression response of commensal isolates grown in urine to evaluate if

26
environmental cues in this condition trigger the expression of novel virulence-related genes
contributing to a higher pathogenicity potential.
Lastly, QSE123 grown in skim milk shows an opposite response to LN11, with the lowest
percentage in 5.0% NaCl (7%) (1/14), followed by skim milk 2.5% with 10% (1/10), skim milk 0%
with 18%(3/7), and the highest in skim milk 6.5% NaCl with 20%(2/10) of differential bands.
Overall, there are few differentially expressed genes in skim milk in comparison to LN11.
QSE123 seems to demonstrate in general a weaker response to environmental cues since it
has the lowest percentages of differential bands per condition (<31%) which is lower than the
found in LN11 grown in BHI (33%), the lowest percentage in the latter isolate.
One of our goals was to identify which genes were differentially expressed and in which
conditions. To do that we needed to sequence those previously identified differential bands.
To sequence these genes we had to clone them but first, the excised differential bands were
reamplified. To reamplify them, the same PCR program as the one in RAP-PCR was not
suitable since the result was a profile with several amplicons. This is probably due to multiple
sites recognized by the primer OPC19 in the original product, resulting in new smaller
amplification products with various sizes. There were too many bands for cloning so, in order to
decrease that amount preferably to one band correspondent to the original amplicon, we
increased the annealing temperature and decreased the quantity of MgCl2 in the reaction.
These measures were performed in order to increase the specificity of the primer connection.
However, we could not increase the annealing temperature too much because then no
amplification reaction occurred. The limit was set on 55°C and the result was still a profile but
with much less bands and still containing the original sized band. The bands in the profile were
never superior in size to the original. We chose to reamplify at least two differential genes from
each condition, whenever possible.
In RAP-PCR, when the differential amplicons were produced we used primer OPC19 for both
first and second cDNA strand. If we sequenced directly the reamplified product, the primer
would anneal at the both ends of the sequence and probably even in other random sites in the
middle, making it impossible to sequence. For that reason we inserted the reamplified amplicon
in a plasmidic vector. We transformed E. coli cells and screened the clones which had the insert.
We confirmed by PCR using vector-directed primers if the insert was present and extracted the
plasmid for sequence.
We sequenced 25 DNA fragments and compared their sequences with NCBI Nucleotide Online
database. It was not possible to identify 52% (13/25) of the fragments which suggests that these
might be completely novel molecules. We were able to identify 48% (13/25) fragments, half from
each dairy isolate. From the fragments identified about 42% (5/13) were identified as 16S rRNA
gene and 17% (2/13) as 23S rRNA. Since these two genes are housekeeping genes they
should be presented in both RAP-profiles from enterococci grown in the environmental condition
and respective controls. One possible explanation is that the differential bands were close
together to the ribosomal bands. When excising the bands from the gel we may have took a
small part of the amplicons from 16S rRNA or 23S rRNA which are high abundance RNAs in the
transcriptome and were reamplified previously to the cloning step.
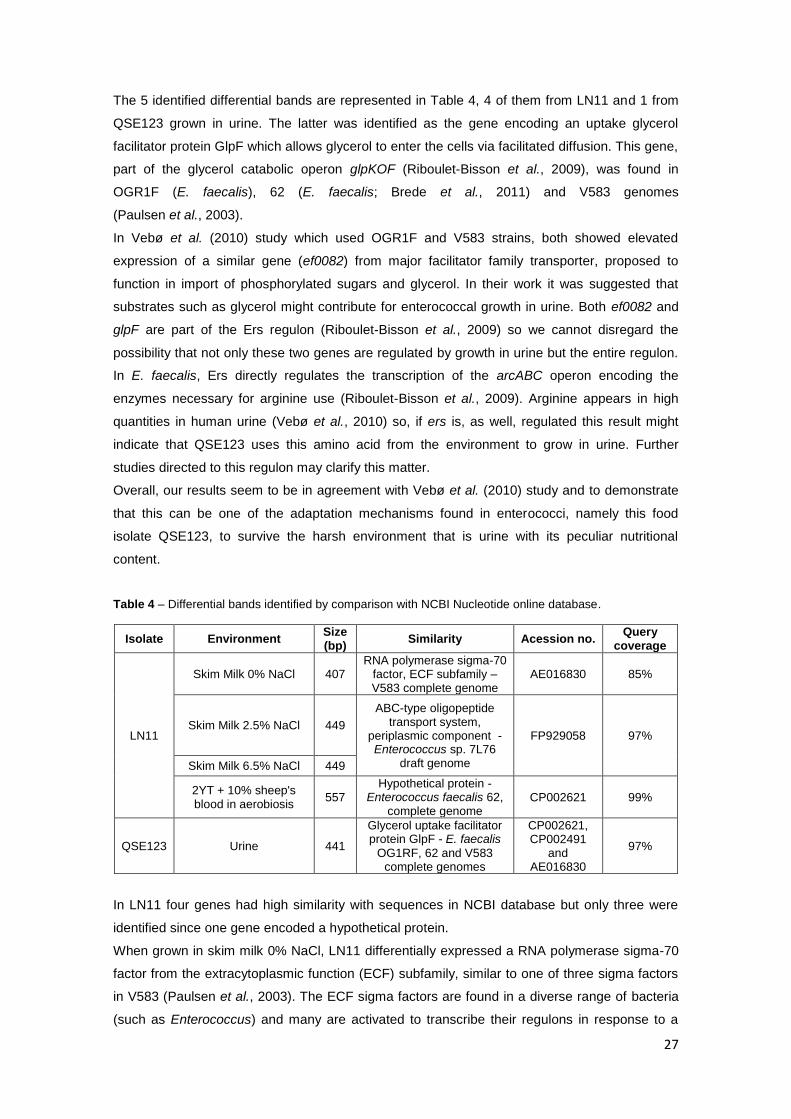
27
The 5 identified differential bands are represented in Table 4, 4 of them from LN11 and 1 from
QSE123 grown in urine. The latter was identified as the gene encoding an uptake glycerol
facilitator protein GlpF which allows glycerol to enter the cells via facilitated diffusion. This gene,
part of the glycerol catabolic operon glpKOF (Riboulet-Bisson et al., 2009), was found in
OGR1F (E. faecalis), 62 (E. faecalis; Brede et al., 2011) and V583 genomes
(Paulsen et al., 2003).
In Vebø et al. (2010) study which used OGR1F and V583 strains, both showed elevated
expression of a similar gene (ef0082) from major facilitator family transporter, proposed to
function in import of phosphorylated sugars and glycerol. In their work it was suggested that
substrates such as glycerol might contribute for enterococcal growth in urine. Both ef0082 and
glpF are part of the Ers regulon (Riboulet-Bisson et al., 2009) so we cannot disregard the
possibility that not only these two genes are regulated by growth in urine but the entire regulon.
In E. faecalis, Ers directly regulates the transcription of the arcABC operon encoding the
enzymes necessary for arginine use (Riboulet-Bisson et al., 2009). Arginine appears in high
quantities in human urine (Vebø et al., 2010) so, if ers is, as well, regulated this result might
indicate that QSE123 uses this amino acid from the environment to grow in urine. Further
studies directed to this regulon may clarify this matter.
Overall, our results seem to be in agreement with Vebø et al. (2010) study and to demonstrate
that this can be one of the adaptation mechanisms found in enterococci, namely this food
isolate QSE123, to survive the harsh environment that is urine with its peculiar nutritional
content.
Table 4 – Differential bands identified by comparison with NCBI Nucleotide online database.
Isolate Environment Size (bp)
Similarity Acession no. Query
coverage
LN11
Skim Milk 0% NaCl 407 RNA polymerase sigma-70
factor, ECF subfamily – V583 complete genome
AE016830 85%
Skim Milk 2.5% NaCl 449
ABC-type oligopeptide transport system,
periplasmic component - Enterococcus sp. 7L76
draft genome
FP929058 97%
Skim Milk 6.5% NaCl 449
2YT + 10% sheep's blood in aerobiosis
557 Hypothetical protein -
Enterococcus faecalis 62, complete genome
CP002621 99%
QSE123 Urine 441
Glycerol uptake facilitator protein GlpF - E. faecalis
OG1RF, 62 and V583 complete genomes
CP002621, CP002491
and AE016830
97%
In LN11 four genes had high similarity with sequences in NCBI database but only three were
identified since one gene encoded a hypothetical protein.
When grown in skim milk 0% NaCl, LN11 differentially expressed a RNA polymerase sigma-70
factor from the extracytoplasmic function (ECF) subfamily, similar to one of three sigma factors
in V583 (Paulsen et al., 2003). The ECF sigma factors are found in a diverse range of bacteria
(such as Enterococcus) and many are activated to transcribe their regulons in response to a
28
change in environmental conditions. For example in Bacillus subtilis, a putative sigma-70 factor
SigX, has been reported to contribute in survival at high temperature (Yoshimura et al., 2004).
In general, these proteins include a transmembranar protein with an extracytoplasmic sensory
domain and an intracellular inhibitory domain functioning as an anti-sigma factor that binds and
inhibits the sigma factor (Yoshimura et al., 2004). This demonstrates that in enterococci, though
few sigma factors have been identified (Paulsen et al., 2003), proteins such as this one may
have an important role in adaptation to new environments, since they usually have an
autoregulation mechanism (Yoshimura et al., 2004). In LN11 grown in skim milk the regulation
of this gene may induce other regulons responsible for environmental adaptation, explaining
why this was the condition with highest percentage of differentially expressed genes in this dairy
isolate.
The final two fragments identified corresponded to the same gene sequence, ABC-type
oligopeptide transport system found in the periplasm. This sequence was similar to one found in
Enterococcus sp. 7L76 draft genome though a similar one exists in OGR1F (CP002621), 62
(CP002491) and V583 (AE016830) genome.
This gene was differentially expressed in LN11 RAP-profile when grown in skim milk with 2.5%
and 6.5% NaCl, demonstrating that it might be a generally up-regulated gene when in media
with certain osmotic stress (due to high salt concentration).
In Vebø et al. (2009) and Vebø et al. (2010) microarray-based studies in V583 grown in blood
and urine respectively, oligopeptide ABC transporters (EF0907, EF3110-06 and EF0909-12)
were up-regulated while amino acid importer genes were down-regulated. The up-regulation of
oligopeptide ABC transporters seems to be a response to the lack of certain amino acids,
therefore, part of an adaptation mechanism. In LN11 this mechanism may be responding to
certain nutritional needs due to high protein turnover or elevated gene modulation in response
to osmotic stress found in this media. This would be in accordance to the high differentially
expressed genes in this media.
Overall, gene sequence identification showed some of the mechanisms and regulons that are
induced by both commensal and infection-like conditions, revealing the type of machinery
available in enterococci to respond to stress environmental factors.
What we conclude from this analysis is that, in general, gene expression is triggered by
environmental cues from all conditions in both food isolates. QSE123 is less susceptible to
these signals expressing fewer differential genes. For LN11 on the other hand, more than half of
the genes in the RAP-profiles are differentially, indicating a high susceptibility to environmental
cues. From the infection-like media studied, urine was the one in which both isolates showed a
more pronounced modulation of gene expression.
Dairy enterococci seem to modulate gene expression accordingly to the growth environment,
expressing important genes related to stress/adaptation mechanisms which suggest the
pathogenicity potential of food isolates, raising special awareness regarding the food safety of
products harboring enterococci.
29
3.2. Proteome Analysis
We analyzed the transcriptome to find differentially expressed genes in response to
environmental cues in food isolates. In a separate but complementary analysis we wanted to
see which proteins were being differentially expressed in LN11 and QSE123 and in which
growth condition that occurred. To analyze the proteome, we extracted the proteins from the
cells grown until the late log phase in the different conditions under analysis in this study: BHI,
BHI supplemented with 1% BB, urine, horse serum, skim milk with 0%, 2.5%, 5% and 6.5%
NaCl. We also extract proteins from their respective controls. The main goal was to compare
differentially expressed proteins in 1D electrophoresis (SDS-PAGE) and then in 2D
electrophoresis (2DE).
Protein extraction in enterococci can be performed by incubating the cells in lysozyme similar to
how we extracted RNA. Though a simple method, lysozyme is itself a protein and it is usually
used at a high concentration for cell lysis. This results in a large thick band in a SDS-PAGE or a
large spot in a 2DE gel which masks surrounding proteins. In order to avoid this outcome and
allow disruption of the cells, instead of an enzymatic process, it was used a mechanic approach
based on ultrasounds.
This process had not been previously optimized and therefore a series of variables were tested
in six protocols inspired in previous reports of proteome studies (Heim et al., 2002; Bøhle et al.,
2010; Wang et al., 2010) and applied to LN11 cells after growth in BHI. Two protocols consisted
in 5 or 10 rounds of 15 seconds of sonication with 0.7 cycles at 50% power. In two other
experiments we sonicated for 10 seconds with 0.5 cycles at 35 or 90%. The fifth protocol
consisted in sonicating for 5 minutes, 0.7 cycles at 30% power. The sixth and final sonication
protocol (5 rounds of 30 seconds with 0.3 cycles and 90% power) was chosen since it was the
one that showed a more efficient cell disruption after the one with 5 minutes. We chose not to
do 5 minutes of sonication because there was overheating, which is problematic due to
extraction buffer constitution.
To achieve a good solubilization of the proteins the extraction buffer has urea and thiourea.
When working with proteins and urea one of the main concerns is carbamylation that occurs
when there is urea decomposition. One of the urea breakdown products is iso-cyanate that
modifies lysine residues in the proteins changing their isoelectric point (Righetti, 2006). High
temperatures (above 37°C) promote urea degradation; this is why we should avoid overheating.
In media such as skim milk, urine and serum there was a lower cellular growth compared to BHI
and 2YT with or without sheep’s blood. This was clearly visible when looking at the size of the
cell pellets. The protein concentrations obtained were very small, less than 300 ng/µl, not
enough for future applications. To surpass this problem two measures were taken: increase the
amount of media inoculated to have more biomass and decrease the extraction buffer volume to
increase protein concentration. When quantifying the samples for each strain their protein
content varied greatly, probably due to differences in biomass quantity. The amount of protein in
extracts from LN11 and QSE123 grown in all conditions and controls ranged from 786 to

30
8074.7ng/µl. This protocol allowed extracting in average 2377 ng/µl. Overall, the methodology
was successful and efficient.
One dimensional electrophoresis was performed both for LN11 and QSE123 whole-cell protein
extracts. We can see in Figure 3 one of the dendrograms constructed with SDS-PAGE profiles
from both isolates grown in all conditions. Controls were not included.
Analyzing the dendrogram we can see that protein profiles from the same isolate show a high
similarity and are grouped together in two clusters (LN11 cluster with 92% similarity; QSE123
cluster with 89%), except for cells grown in horse serum and QSE123 grown in skim milk 0%
NaCl. In Carlos (2008) work dendrograms constructed with SDS-PAGE profiles from clinical and
food isolates grown in BHI, urine, rabbit serum, 2YT (with various pH values and NaCl
concentrations) there were also similarity values superior to 80%.
Figure 3 – Dendrogram based on whole-cell protein profiles from LN11 and QSE123 (marked by black
thick line) grown in media simulating colonization and infection sites. Dendrogram constructed using the Pearson correlation coefficient and the agglomeration method UPGMA.
This reflects the low resolution power in SDS-PAGE to detect differential expressed proteins
because adaptation to different conditions translates in subtle changes in the proteome.
The profiles in horse serum are clearly different from the ones seen in each strain grown in the
other conditions under analysis, the reason why they are not included in the clusters. However,
there are similarities between LN11 and QSE123 horse serum profiles, namely three thick
bands around ~70kDa, ~55 kDa and ~25 kDa (marked with *). These same bands were present
in the horse serum protein profile. Besides serum, skim milk and sheep’s blood have high
protein content which was detected by SDS-PAGE using a sample of each media. Since BHI is

31
also a complex media it was included in the gel but did not show any visible protein. One
possible explanation for the high abundance of serum proteins in the isolates profiles is that the
pellet washes with PBS were not enough to remove the serum remains attached to the cells.
A similar phenomenon may be occurring in skim silk 0% NaCl extract from QSE123 which
appears out of the cluster with only 82% similarity to other profiles. When comparing the other
skim milk profiles and respective controls for QSE123 (data not shown) they form two respective
clusters with 92% similarity. For skim milk 0% NaCl there is only 80% similarity. This difference
may be due to overexpression of a protein represented by a thick ~32 kDa band in this profile.
This band appears in the other skim milk profiles though with lower intensity. One hypothesis is
that this band corresponds to a differential protein due to growth in skim milk and this protein
synthesis may be inhibited by increasing concentrations of NaCl (Figure 4). Carlos et al. (2010)
concluded that increasing NaCl concentrations had a reduced effect in expression levels of
virulence factors, so osmotic stress can be one of the main causes in this case.
Figure 4 – Differential expressed protein (marked by arrow) in protein profile from QSE123 cells grown in
skim milk (S.M) with distinct NaCl concentrations which is absent in their respective controls. Band has approximately ~32 kDa.
When comparing specifically infection media profiles (except for horse serum since its profile is
altered by proteins in the medium), in both food isolates there were two subgroups, broth media
(BHI and urine) and plate media (sheep’s blood in aerobiosis and anaerobiosis). Considering
the colonization conditions in this analysis, for QSE123 isolate, infection plate media profiles
were more similar to skim milk profiles (91%) than to BHI and urine (89%). This may indicate
that growth in solid media induces a similar response modulating gene expression in order to
colonize this kind of environment. In LN11 the similarity among media simulating infection and
colonization sites is quite high (97%) demonstrating a generalized response do environmental
cues.
Overall, BHI (with and without BB) and urine produced the most distinct responses in both LN11
and QSE123, since within their respective clusters they had the lower similarity values. These
media represent stressful conditions for enterococcal growth. Bøhle et al. (2010) showed that in
response to bovine bile E. faecalis regulated proteins from 9 distinct functional groups. It
included mainly proteins involved in fatty acids metabolism, essential to cope with higher levels
of bile. LN11 has the most distinct BHI+1%BB profile, which may be explained by the
expression of such proteins that surely are necessary to the survival in a bile environment such
as the intestine.
Considering infection media, there is a uniform profile between them and their respective
controls in LN11. The greatest differences were detected in QSE123 grown in urine where we
32
can see two differentially expressed protein bands (marked with arrows in Figure 3). We
compared dendrograms constructed with LN11, QSE123 and V583 urine profiles from this study
and from Carlos (2008) study which used a different extraction method based on the use of
lysozyme. Both works are in agreement since in the two dendrograms (data not shown) LN11
grown in urine profile has a higher similarity to V583 profile (88%) than to QSE123 (82%).
Carlos (2008) stated that, besides serum and 2YT with high salt concentrations, urine was the
one that registered more differential proteins in comparison to its control. For these three
isolates using the profiles in Carlos (2008) work there is only 65% similarity between urine and
respective controls. Taking into account these differences in expression profiles and the
differences seen in QSE123 grown in urine we decided to select urine as the condition to be
further studied by two-dimensional electrophoresis (2DE).
Urine is a stressful environment and is with no surprise that in Vebø et al. (2010) microarray-
based study genes related to stress mechanism, cell envelope modifications, and trace metal
acquisition were found to be strongly regulated. Environmental stress cues are probably
responsible for this strong modulation seen in urine profiles.
To better understand the relation between cues in urine and protein regulation and to see if it
was a common response in both clinical and food isolates we performed 2DE for LN11,
QSE123 and V583 grown in this condition. We also tried to identify novel expressed proteins
regulated by environmental signals in urine.
In Figure 5 we can see the 2DE gel results for all three isolates. Up to date this is the first 2DE
based study in Enterococcus with urine as growth condition.
In previous 2DE studies IPG strips with pH 4-7 were used (Heim et al., 2002; Bøhle et al., 2010;
Radhouani et al., 2010; Wang et al., 2010) but in this work we used IPG strips covering pH area
from 3 to 10. Though clearly most proteins are in the pH area from 4 to 7 others can be found in
the basic end of the strip (Figure 5). These strips give us a general view of the whole proteome.
Before progressing in gel analysis some technical considerations should be appointed. These
gels were stained with silver nitrate which is more sensible (the staining kit used in this work has
a sensitivity of 0.2-0.6 ng per band), therefore good for identifying possibly differentially
regulated low abundance proteins. However, silver stains also have a limited dynamic range
which may difficult spots intensity comparison.
Another thing to consider is the horizontal streaking that can be seen in the gels. Streaking is
one of the most common problems that occur in 2DE and is usually due to poor protein
solubilization (Görg et al., 2000). The extraction buffer used in this study contains many
components that help solubilization, such as urea, thiourea and CHAPS, and this step takes
place at room temperature. Since the samples are stored at -80°C one important step that had
to be introduced was to thaw the proteins extracts in gentle shaking for at least half an hour to
re-solubilize the proteins before use. Otherwise we would not be able to re-solubilize the
proteins again. Another step added before use was a brief centrifugation to pellet unsolubilized
proteins that may still prevail.
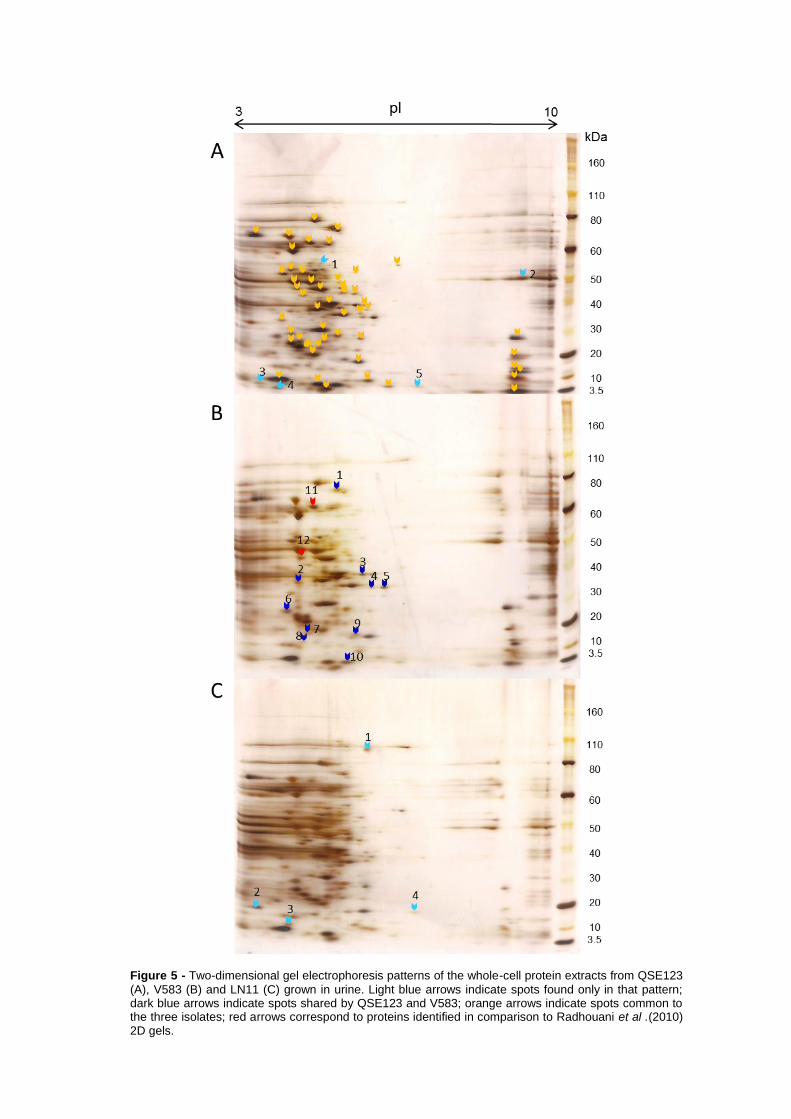
33
Figure 5 - Two-dimensional gel electrophoresis patterns of the whole-cell protein extracts from QSE123
(A), V583 (B) and LN11 (C) grown in urine. Light blue arrows indicate spots found only in that pattern; dark blue arrows indicate spots shared by QSE123 and V583; orange arrows indicate spots common to the three isolates; red arrows correspond to proteins identified in comparison to Radhouani et al .(2010) 2D gels.

34
In addition, we found that the extra IEF time (from 30 minutes according to manufacturer
instructions to the established 4 hours ) improved protein focusing and that increasing the
protein amount to from 8 to a final 15 µg increased the number of spots visible, since there are
proteins with low abundance which we want do visualize in the 2DE gel. The horizontal
streaking in the basic end could be due to DTT depletion (a reducing agent) resulting in
reoxidation of free cysteines to disulphides in proteins, decreasing protein solubility in the
alkaline gradient of the strip during IEF (Righetti, 2006). This may result in protein spots that are
actually artifacts.
Further changes should be considered to enhance 2DE gel quality and decrease the amount of
streaking for an improved view and gel analysis.
Comparing the urine SDS-PAGE profiles and the 2DE gels from LN11 and QSE123 it is clear
that 2D gels have a much better protein resolution. We can see much more proteins since
besides separating them by molecular mass we separated by isoelectric point.
Looking at the gels we can see that most of the proteins occur in the acidic end (pH 3-7).
To access the differential expression in urine we compared the number of protein spots found in
each isolate 2DE gel. Spots were only considered if they appeared in every replica.
A total of 59 spots were marked: 68% (40/59) were shared by all three isolates (Figure 5, gel A,
orange arrows) and 32% (19/59) were differentially expressed. From those differentially
expressed proteins, about half (10) were shared by QSE123 and V583 (gel B, dark blue arrows).
8% (5/59) of the spots appeared only in QSE123 2DE gel and 7% (4/59) only in LN11 (gel A
and C respectively, marked with light blue arrows).
Differentially express proteins common to QSE123 and V583 may indicate similar responses of
a dairy and a clinical enterococci to urine, suggesting once again the versatility of enterococci to
adapt to harsh environments regardless of their origin. In this preliminary analysis in V583 gel
does not appear to be any spot unique to this strain. This may indicate that V583, in comparison
to QSE123 has a similar but reduced response to urine which translates in less differentially
expressed proteins.
2DE analysis points to a different outcome than SDS-PAGE analysis that grouped closer
together V583 and LN11 instead of QSE123. This is certainly due to the higher resolution in
2DE. However, if we consider Carlos et al. (2009) results, in which the comparison of growth
curves demonstrated that V583 and QSE123 have a very similar response to growth in different
environments including urine, it is possible that these two isolates have actually a similar
adaptability to this condition.
Looking with more attention to these common spots, their relative amount is different in some of
them such as in spots 1 and 9 marked in V583 gel (gel B) that are smaller than their
corresponding spot in QSE123 (gel A). These proteins may be under a regulation mechanism
resulting in different expression levels which shows that gene modulation is strain-specific.
Urine is a medium with a peculiar nutritional nature and a stressful environment and that is why
the isolates grown in this condition have low growth rates and cellular densities, as described in
Carlos et al. (2009) work. Vebø et al. (2010) showed that besides stress related genes,
determinants involved in transport and biosynthesis are differentially regulated. Proteins from

35
these functional groups are essential for enterococci to be able to use the low amount of
nutrients available and synthesize the ones that are lacking. These differential proteins that we
detected can be a response to the nutritional needs which should be according to the
characteristics of each strain, explaining the distinct protein amounts.
We also should consider in this analyses virulence proteins since urinary tract infections are the
infections most frequently associated to enterococci. The study of virulence gene expression by
Carlos et al. (2010) showed that in LN11 growth in urine led to the down-regulation of the cyl
operon and esp. However, in QSE123 cyl genes were up-regulated. Shepard and Gilmore
(2002) work had a similar result. They showed that MMH594, a clinical isolate, up-regulates
several virulence genes (among them cyl operon and esp as well) when grown in urine. The
absence of some differential proteins shared by LN11 and QSE123 can be due to opposite
responses such as the one observed for the cyl operon.
In this study, not only we wanted to identify differentially expressed genes but also the proteins
regulated by environmental cues. We tried to compare proteins expressed in urine with proteins
found in 2D gels from previous studies.
In Radhouani et al. (2010) study E. durans isolates were exposed to vancomycin, a last resort
antibiotic. Comparing the gels in their work with ours it seemed to be two common proteins. We
marked in Figure 5 those two proteins with red arrows (gel B) which are common to all three
isolates. In their work the authors identified through mass spectrometry some of the proteins in
the 2DE gels. These two were identified as proteins putatively involved in protein synthesis. In
Radhouani et al. (2010) study this type of proteins represented about 8% of the spots
characterized. It is an essential function in the cell system so these proteins are expected to be
present in all three gels. Also stressful environments such as the one under drug pressure or
urine probably induce protein synthesis of several other proteins related to stress mechanisms,
explaining why these proteins are differentially expressed.
One protein present in both QSE123 and V583 2DE gels, marked as spot 10 (Figure 5, Gel B),
appears with high abundance in these isolates but is completely absent in LN11 (Figure 6). This
spot stands out because other spots shared only by QSE123 and V583 seem to correspond to
low abundance proteins (small spots) while this one is highly expressed. It would be interesting
to identify this protein to infer about its putative function and to see if it participates in some of
the mechanisms previously discussed that are triggered by growth in urine.
Figure 6 - Differentially expressed protein, present in QSE123 (marked by arrow) and V583 2D
electrophoresis protein patterns but absent in LN11.
Overall, our results point to a high adaptability from dairy isolates to growth environmental
conditions regardless of being colonization/infection like conditions which suggests the
pathogenicity potential of food isolates. A specific response was seen in QSE123 which induces
36
a ~32kDa protein when grown in skim milk that seems to be down-regulated by increasing NaCl
concentrations. LN11 profiles had high similarity values between them indicating that this dairy
isolate equally adapts to all conditions.
However, by comparing SDS-PAGE profiles from food and clinical isolates grown in urine
showed that this condition most induced differential protein expression. To further analyze how
cues in this infection-like medium affected dairy and clinical isolates protein expression, in 2DE
gels we showed that QSE123 and V583 shared half of the differential proteins, pointing towards
similar responses of a dairy and a clinical enterococci to urine and suggesting once again the
versatility of enterococci to adapt to harsh and infection-related environments.
3.3. Integrative Analysis
To better understand differential expression from food isolates in response do distinct growth
environments we analyzed their transcriptome and proteome. Though two completely separate
approaches their results complement each other and an integrative analysis of the results is
needed. In this analysis we want to understand which conditions modulated gene/protein
expression, see if they were the same in transcriptome/proteome analyses, which ones were
expressed and how food isolates responded when we used the two different approaches.
In the present study we used colonization/infection-like media in order to assess dairy isolates
pathogenicity. We found that both dairy and clinical isolates had a high adaptability to different
environments, always responding by modulating their gene expression (confirmed with present
transcriptomic and proteomic results).
Data pointed to the strong effect of urine in gene expression in comparison to other media
simulating infection sites. This medium was already regarded in Carlos et al. (2010) work as the
one that caused the most significant expression changes. Those changes were also well
described in a microarray based study in probiotic and clinical strains (Vebø et al., 2010) and
now further demonstrated by RAP-PCR, SDS-PAGE and 2DE in our work in food isolates.
In RAP-PCR profiles the infection-like medium with more differentially expressed genes was
urine and the analyses of the proteome show that proteins are the true reflection of gene
expression. This because, when comparing SDS-PAGE profiles from both Carlos (2008) and
our works urine was also the condition that induced more differentially expressed proteins,
reflecting transcriptomic results. Furthermore, the glycerol uptake facilitator gene sequence
regulated by QSE123 grown in this medium pointed to a high adaptability to this harsh
environment.
Considering that enterococci up-regulate virulence genes such as esp, efaAfs and operon cyl in
this condition (Shepard, 2002; Carlos et al., 2010), genes found in the dairy isolates in this study,
all results seem to suggest potential pathogenicity of food isolates.
We concluded once more that urine is the infection-like medium that had environmental cues
which modulates more genes/proteins, probably most of them related to stress and adaptability
mechanisms.
37
One of the main points we concluded from both analyses was that enterococci have a high
ability to stand stressful environments. Growth in BHI supplemented with 1% bovine bile
showed that food and clinical isolates can have a similar growth kinetic demonstrating that they
equally tolerate bile, a common stress factor that microorganisms encounter in the
gastrointestinal tract. Protein profiles showed that this medium induced a differential expression
similar to urine. Giard et al. (2001) studied the stress proteome in E. faecalis in order to identify
important molecules that take part in this machinery which the sole role is to keep cell
homeostasis. As expected they identified heat-shock proteins and general stress proteins which
were regulated by stress conditions such as bile salts, acid pH and NaCl.
Most of the conditions in analysis in this work have one of these stress factors. Acidic pH is
found in urine, which has normally a pH value around 6. Acidic environments are also
associated to increase in virulence gene expression. In Carlos et al. (2010) work they showed
that and increase in pH values decrease virulence expression. For example, in human urine pH
values can range from 4.5 to 8 and in vegetarians it tends to be acidic. So, due to the lower pH
value genes like the adhesin esp may be expressed in urine posing the risk of initiating a urinary
tract infection.
One of the other major stress factors we analyzed was NaCl. Skim milk media with distinct NaCl
concentrations were tested. Overall in LN11, there was a strong and similar response in all skim
milk media, characterized by high similarity values between SDS-PAGE profiles and large
percentage of differentially expressed genes compared to QSE123. Furthermore, LN11 grown
in skim milk under osmotic stress (2.5% and 6.5% NaCl) expressed an oligopeptide ABC-type
transporter enabling the usage of these small peptides retrieved from the environment,
representing LN11 high adaptability to different environments with distinct nutritional
compositions. This elevated modulation of gene expression in this dairy isolate may be due to a
sigma-70 factor from the ECF subfamily, a differentially expressed gene identified in LN11
grown in skim milk (0% NaCl), which is involved in the regulation of several regulons. Once
again both analyzes were in accordance.
In QSE123 SDS-PAGE profile we detected a protein that was differentially expressed in skim
milk and that was down-regulated by increasing NaCl concentrations which may indicate a
response to osmotic stress.
In conclusion, both RAP-PCR and 1DE/2DE profiles showed that all conditions modulated
gene/protein expression. Urine was the one which provoked the most pronounced response
with high percentages of differential bands and protein spots. Overall, isolates in this study have
a high tolerance to stress factors which are found in the conditions in analysis responding
accordingly by inducing the expression of genes and proteins that take part in stress/adaptation
mechanisms. Three of these differentially expressed genes were identified and showed some of
the potential mechanisms involved and triggered by cues in the environment. It is possible that
these cues lead to a switch from a commensal to a pathogenic lifestyle but that can only be
ascertain by further studies, still needed to finalize our integrative analysis. This includes
knockout of the differential expressed genes and functionality studies in vivo. Unfortunately it
was not possible to identify many differentially expressed genes/proteins so we still cannot

38
conclude if these molecules can help us differentiate pathogenic from safe non-pathogenic
enterococci to be safely used in food products and probiotics.

39
4. Conclusions and Future Perspectives
Enterococci are known for their role in the organoleptic characteristic of food products but also
for their appearance in healthcare associated infections as opportunistic pathogens. Previous
studies had, as main goal, the comparison of food and clinical isolates in terms of virulence
genes, antibiotic resistance, adaptability to several growth environments and gene expression
profiles. Overall they concluded that these characteristics were widely spread among
enterococci regardless of their origin and that they were mainly strain specific (Semedo et al.,
2003a,b; Lopes et al., 2005 and 2006; Pimentel et al., 2007; Carlos, 2008; Semedo-Lemsaddek,
Barreto-Crespo and Tenreiro, 2009; Carlos et al. 2010).
The aim of this study was to understand enterococcal pathogenicity mechanisms and identify
the environmental cues that may lead to a switch from a commensal to a pathogenic lifestyle,
through two complementary approaches: transcriptome and proteome analysis.
In order to address this issue we compared differential gene expression in dairy isolates, LN11
and QSE123, and clinical isolate V583 grown in distinct environments simulating colonization
sites (milk with distinct NaCl concentrations) and infection sites (BHI, serum, bovine bile, blood
and urine).
The overall results indicate that enterococcal food isolates have the ability to respond to the
growth conditions under analysis and modulate gene expression accordingly.
Analysis of the transcriptome through RAP-PCR showed that, in general, gene expression is
triggered by environmental cues from all conditions in both food isolates. LN11 was more
susceptible to these signals than QSE123, especially in skim milk media, demonstrating its high
adaptability to both infection media and its environment of origin, milk. In this food isolate two
differentially expressed genes in response to skim milk were identified, encoding RNA
polymerase sigma-70 factor from the extracytoplasmic function subfamily and an oligopeptide
ABC-type transport system from the periplasm, two proteins involved in important adaptation
mechanisms. This shows that in dairy enterococci there are distinct transcriptional profiles and
mechanisms to respond to environmental cues.
Urinary tract infections are the most common infections caused by enterococci; therefore, urine
was used as an infection-like condition. QSE123 grown in this condition differentially expressed
a gene encoding a glycerol uptake facilitator protein GlpF. This result demonstrates that one
possible substrate for enterococcal growth in urine is glycerol and that this isolate can adapt to
specific nutritional needs in this type of harsh environments. From all conditions simulating
infection sites this was the one that induced more differential genes in both isolates, suggesting
the pathogenicity potential of food isolates.
Proteome analysis further supported these conclusions. LN11 SDS-PAGE profiles showed high
similarity values among them indicating that it can similarly adapt to all conditions. In general,
protein profiles demonstrated that these dairy isolates responded equally to all growth
conditions.
We detected some differentially expressed proteins in QSE123, two due to growth in urine and
a ~32kDa protein induced by growth in skim milk. The latter seems to be down-regulated by

40
increasing NaCl concentrations, suggesting an osmotic regulation mechanism in this isolate.
Further identification of this protein may clarify which mechanism in response to osmotic stress
is triggered by growth in this media.
Both analyses pointed towards important cues in urine that triggered differential expression in
these food isolates. To further assess their pathogenicity potential we analyzed this condition
through 2D electrophoresis and found that QSE123 and V583 shared half of the differential
proteins. As previously stated, there is a common behavior between food and clinical isolates.
Food isolates expressed unique proteins that were not found in the clinical isolate, once again
demonstrating unique expression profiles in food enterococci. Identification of these proteins will
enable us to understand which signals in urine trigger this response.
In our study we tried to clarify the role of environmental cues in the pathogenicity potential of
food isolates. It seems that the lifestyle adopted by Enterococcus is related to the response and
adaptability of each isolate to distinct environments, rather than its origin. The differences
between an enterococcal pathogen and an apparently safe food strain are still unclear so further
studies to identify more molecules that were induced by environmental cues are crucial.
New studies to identify those differentially expressed molecules (genes/proteins) will be based
on global transcriptome analysis by DNA microarrays and 2D electrophoresis (using different
growth conditions other than urine) complementing the data collected in this study.
Other future perspectives contemplate the identification of novel differentially expressed genes
(possibly virulence factors) and evaluation of their contribute for pathogenicity potential of food
enterococci, using knock-out technology and animals as an in vivo model for enterococcal
infection. Only then we will be able to understand the complex relation between host and
pathogen in order to extrapolate for human hosts and reliably assess for the food safety of
products harboring enterococci.
41
5. Bibliographic references
1. Aakra, A., Vebø, H., Snipen, L., Hirt, H., Aastveit, A., Kapur, V., Dunny, G., Murray, B.E.
and Nes, I.F. (2005). Transcriptional response of Enterococcus faecalis V583 to
erythromycin. Antimicrobial Agents and Chemotherapy 49(6), 2246–2259.
2. Aakra, A., Vebø, H., Indahl, U., Snipen, L., Gjerstad, O., Lunde,M. and Nes, I.F. (2010).
The Response of Enterococcus faecalis V583 to Chloramphenicol Treatment.
International Journal of Microbiology, Published online: doi: 10.1155/2010/483048.
3. Alves, P.I., Martins M.P., Semedo T., Figueiredo-Marques J.J., Tenreiro R. and
Barreto-Crespo M.T., (2004). Comparison of phenotypic and genotypic taxonomic
methods for the identification of dairy enterococci. Antonie van Leeuwenhoek 85, 237–
252.
4. Benson, N.R., Wong, R.M. and McClelland, M. (2000). Analysis of the SOS response in
Salmonella enterica serovar typhimurium using RNA fingerprinting by arbitrarily primed
PCR. Journal of Bacteriology 182(12), 3490-3497.
5. Bøhle, L.A., Færgestad, E.M., Veiseth-Kent, E., Steinmoen, H., Nes, I.F., Eijsink, V.G.H.
and Mathiesen, G. (2010). Identification of proteins related to the stress response in
Enterococcus faecalis V583 caused by bovine bile. Proteome Science 8(37), 1-12.
6. Bonora, M.G., Solbiati, M., Stepan, E., Zorzi, A., Luzzani, A., Catania, M.R. and
Fontana R. (2006). Emergence of Linezolid Resistance in the Vancomycin-Resistant
Enterococcus faecium Multilocus Sequence Typing C1 Epidemic Lineage. Journal of
Clinical Microbiology 44(3), 1153–1155.
7. Brede, D.A., Snipen, L.G., Ussery, D.W., Nederbragt, A.J., and Nes, I.E. (2011).
Complete Genome Sequence of the Commensal Enterococcus faecalis 62, Isolated
from a Healthy Norwegian Infant. Journal of Bacteriology 193(9), 2377–2378.
8. Buydens, P. and Debeuckelaere, S., (1996). Efficacy of SF 68 in the treatment of acute
diarrhea. A placebo-controlled trial. Scandinavian Journal of Gastroenterology 31,
887-891.
9. Carlos, A.R. (2008). Análise da expressão génica em estirpes de Enterococcus como
resposta a diferentes condições ambientais. M.S. thesis, University of Lisbon, Lisbon.
10. Carlos, A.R. , Santos J., Semedo-Lemsaddek, T. , Barreto-Crespo M.T. and Tenreiro,
R., (2009). Enterococci from artisanal dairy products show high levels of adaptability.
International Journal of Food Microbiology 129, 194–199.
11. Carlos, A.R. , Semedo-Lemsaddek, T. , Barreto-Crespo M.T. and Tenreiro, R., (2010).
Transcriptional analysis of virulence-related genes in enterococci from distinct origins
Journal of Applied Microbiology 108, 1563–1575.
12. Devriese, L.A., Vancanneyt, M., Descheemaeker, P., Baele, M., Van Landuyt, H.W.,
Gordts, B., Butaye, P., Swings, J. and Haesebrouck, F. (2002). Differentiation and
identification of Enterococcus durans, E. hirae and E. villorum. Journal of Applied
Microbiology 92(5), 821-827.

42
13. ECDC, 2010 Annual Epidemiological Report on Communicable Diseases in Europe.
European Centre for Disease Prevention and Control, 171-178.
14. Falkow, S. (2004). Molecular Koch’s postulates applied to bacterial pathogenicity — a
personal recollection 15 years later. Nature Reviews Microbiology 2, 67-72.
15. Fisher, K. and Phillips, C., (2009). The ecology epidemiology and virulence of
Enterococcus. Microbiology 155, 1749–1757.
16. Fredericks, D.N. and Relman, D.A. (1996), Sequence-based identification of microbial
pathogens: a reconsideration of Koch's postulates. Clinical Microbiology Reviews 9(1),
18-33.
17. Garsin, D.A. and Willems, R.J. (2010). Insights into the biofilm lifestyle of enterococci.
Virulence. 1(4), 219-21.
18. Gaspar, F., Teixeira, N., Rigottier-Gois, L., Marujo, P., Nielsen-LeRoux, C., Crespo,
M.T.B., Lopes, M.F.S and Serror, P. (2009). Virulence of Enterococcus faecalis dairy
strains in an insect model: the role of fsrB and gelE. Microbiology 155, 3564–3571.
19. Giard, J.C., Hartke, A., Flahaut, S., Boutibonnes, P. and Auffray, Y. (1996) Glucose
starvation response in Enterococcus faecalis JH2-2: survival and protein analysis.
Research in Microbiology 148(1), 27-35.
20. Giard, J.C., Laplace, J.M., Rincé, A., Pichereau, V., Benachour, A., Leboeuf, C.,
Flahaut, S., Auffray, Y. and Hartke, A. (2001). The stress proteome of Enterococcus
faecalis. Electrophoresis 22(14), 2947-2954.
21. Giraffa, G., Olivari, A.M., and Neviani, E. (2000). Isolation of vancomycin-resistant
Enterococcus faecium from Italian cheeses. Food Microbiology 17, 671–677.
22. Giraffa, G., (2003). Functionality of enterococci in dairy products. International Journal
of Food Microbiology 88, 215– 222.
23. Gomez, L.A., Hendrickx, A.P., Willems, R.J, Top, J., Sava I., Huebner, J., Witte, W. and
Werner, G. (2011). Intra- and Interspecies Genomic Transfer of the Enterococcus
faecalis Pathogenicity Island. PLoS One 6(4), e16720.
24. Gonzales, R.D., Schreckenberger, P.C., Graham, M.B., Kelkar S., DenBesten, K. and
Quinn, J.P. (2001) Infections due to vancomycin-resistant Enterococcus faecium
resistant to linezolid. Lancet 357, 1179.
25. Görg, A., Obermaier, C., Boguth, G., Harder, A., Scheibe, B., Wildgruber, R. and Weiss,
W. (2000). The current state of two-dimensional electrophoresis with immobilized pH
gradients. Electrophoresis 21(6), 1037-1053.
26. Haas, W., Shepard, B.D. and Gilmore, M.S. (2002). Two-component regulator of
Enterococcus faecalis cytolysin responds to quorum-sensing autoinduction. Nature
415(6867), 84-87.
27. Hallgren, A., Claesson, C., Saeedi, B., Monstein, H.J., Hanbergerb, H. and Nilssona,
L.E. (2009). Molecular detection of aggregation substance, enterococcal surface protein,
and cytolysin genes and in vitro adhesion to urinary catheters of Enterococcus faecalis
and E. faecium of clinical origin. International Journal of Medical Microbiology 299,
323-332.
43
28. Hanin, A., Sava, I., Bao, Y., Huebner, J., Hartke, A., Auffray, Y. and Sauvageot, N.
(2010). Screening of in vivo activated genes in Enterococcus faecalis during insect and
mouse infections and growth in urine. PLoS One 5(7), e11879.
29. Heim, S., Lleo, M.M., Bonato, B., Guzman,C.A., and Canepari P. (2002). The Viable but
Nonculturable State and Starvation Are Different Stress Responses of Enterococcus
faecalis, as Determined by Proteome Analysis. Journal of Bacteriology 184(23), 6739–
6745.
30. Hew, C.M., Korakli, M. and Vogel, R.F. (2007). Expression of virulence-related genes
by Enterococcus faecalis in response to different environments. Systematic and Applied
Microbiology 30, 257–267.
31. Issaq, J.H. and Veenstra, D.T. (2008). Two-dimensional polyacrylamide gel
electrophoresis (2D-PAGE): advances and perspectives, BioTechniques 44, 697-700.
32. Kuhn, I., Iversen, A., Burman, L.G., Olsson-Liljequist, B., Franklin, A., Finn, M.,
Aarestrup, F., Seyfarth, A.M., Blanch, A.R., Vilanova, X., Taylor, H., Caplin, J., Moreno,
M.A., Dominguez, L., Herrero, I.A. and Möllby, R. (2003). Comparison of enterococcal
populations in animals, humans, and the environment - a European study. International
Journal of Food Microbiology 88, 133– 145.
33. Le Breton, Y., Muller, C., Auffray, Y. and Rincé, A. (2007). New insights into the
Enterococcus faecalis CroRS two-component system obtained using a
differential-display random arbitrarily primed PCR approach. Applied and Environmental
Microbiology 73(11), 3738–3741.
34. Leavis, H., Top, J., Shankar, N., Borgen, K., Bonten, M., van Embden, J. and Willems,
R.J. (2004). A novel putative enterococcal pathogenicity island linked to the esp
virulence gene of Enterococcus faecium and associated with epidemicity. Journal of
Bacteriology 186(3), 672-682.
35. Lopes, M.F.S., Pereira, C.I., Rodrigues, F.M.S., Martins, M.P., Mimoso, M.C., Barros
TC, Figueiredo Marques, J.J., Tenreiro, R.P., Almeida, J.S., Barreto Crespo, M.T.
(1999). Registered designation of origin areas of fermented food products defined by
microbial phenotypes and artificial neural networks. Applied and Environmental
Microbiology 65, 4484–4489.
36. Lopes, M.F.S., Ribeiro, T., Abrantes, M., Figueiredo Marques, J.J., Tenreiro, R. and
Crespo M.T. (2005). Antimicrobial resistance profiles of dairy and clinical isolates and
type strains of enterococci. International Journal of Food Microbiology 103, 191–198.
37. Lopes, M.F.S., Simões, A.P., Tenreiro, R., Marques, J.J. and Crespo, M.T (2006).
Activity and expression of a virulence factor, gelatinase, in dairy enterococci.
International Journal of Food Microbiology 112(3), 208-214.
38. Mannu, L., Paba, A., Daga, E., Comunian, R., Zanetti, S., Duprè, I. and Sechi, L.A.
(2003). Comparison of the incidence of virulence determinants and antibiotic resistance
between Enterococcus faecium strains of dairy, animal and clinical origin. International
Journal of Food Microbiology 88(2-3), 291-304.

44
39. Martín-Platero, A.M., Valdivia, E., Maqueda, M. and Martínez-Bueno, M. (2009)
Characterization and safety evaluation of enterococci isolated from Spanish goats' milk
cheeses. International Journal of Food Microbiology 132(1), 24-32.
40. Mercenier, A., Pavan, S. and Pot, B. (2002). Probiotics as Biotherapeutic Agents:
Present Knowledge and Future Prospects. Current Pharmaceutical Design 8, 99-110.
41. Moellering, Jr., R.C., (1992). Emergence of Enterococcus as a Significant Pathogen.
Clinical Infectious Diseases 14, 1173-1178.
42. Mohamed, J.A. and Huang, D.B. (2007). Biofilm formation by enterococci. Journal of
Medical Microbiology 56, 1581–1588.
43. Moreno, M.R., Sarantinopoulos, P., Tsakalidou, E.,and De Vuyst, L. (2006). The role
and application of enterococci in food and health. International Journal of Food
Microbiology 106, 1 – 24.
44. Nallapareddy, S.R., Wenxiang, H., Weinstock and G.M., Murray, B.E. (2005). Molecular
characterization of a widespread, pathogenic, and antibiotic resistance-receptive
Enterococcus faecalis lineage and dissemination of its putative pathogenicity island.
Journal of Bacteriology 187(16), 5709–5718.
45. Ogier, J.C. and Serror, P. (2008). Safety assessment of dairy microorganisms: The
Enterococcus genus. International Journal of Food Microbiology 126, 291–301.
46. Palmer, K.L., Carniol, K., Manson, J.M., Heiman, D., Shea, T., Young, S., Zeng, Q.,
Gevers, D., Feldgarden, M., Birren, B., and Gilmore, M.S. (2010). High-Quality Draft
Genome Sequences of 28 Enterococcus sp. Isolates. Journal of Bacteriology 192(9),
2469-2470.
47. Paulsen, I.T., Banerjei, L., Myers, G.S.A., Nelson, K.E., Seshadri, R., Read, T.D., Fouts,
D.E., Eisen, J.A., Gill, S.R., Heidelberg, J.F., Tettelin, H., Dodson, R.J., Umayam, L.,
Brinkac, L., Beanan, M., Daugherty, S., DeBoy, R.T., Durkin, S., Kolonay, J., Madupu,
R., Nelson, W., Vamathevan, J., Tran, B., Upton, J., Hansen, T., Shetty, J., Khouri, H.,
Utterback, T., Radune, D., Ketchum, K.A., Dougherty, B.A. and Fraser C.M., (2003).
Role of Mobile DNA in the Evolution of Vancomycin-Resistant Enterococcus faecalis.
Science 299, 2071-2074.
48. Pillar, C.M. and Gilmore, M.S. (2004). Enterococcal virulence-pathogenicity island of
E. faecalis. Frontiers in Bioscience 9, 2335-2346.
49. Pimentel, L.L., Semedo, T., Tenreiro, R., Crespo, M.T., Pintado, M.M. and Malcata, F.X.
(2007). Assessment of safety of enterococci isolated throughout traditional Terrincho
cheesemaking: virulence factors and antibiotic susceptibility. Journal of Food Protection
70(9), 2161–2167.
50. Poh, C.H., Oh, H.M.L. and Tan, A.L. (2006). Epidemiology and clinical outcome of
enterococcal bacteraemia in an acute care hospital. Journal of Infection 52, 383–386.
51. Radhouani, H., Poeta, P., Pinto, L., Miranda, J., Coelho, C., Carvalho, C., Rodrigues, J.,
López, M., Torres, C., Vitorino, R., Domingues, P. and Igrejas, G. (2010). Proteomic
characterization of vanA-containing Enterococcus recovered from Seagulls at the
Berlengas Natural Reserve, W Portugal. Proteome Science 8(48), 1-12.

45
52. Reyes-Jara, A., Latorre, M., López, G., Bourgogne A., Murray, B.E., Cambiazo V. and
González, M. (2010). Genome-wide transcriptome analysis of the adaptive response of
Enterococcus faecalis to copper exposure. Biometals 23, 1105–1112.
53. Riboulet-Bisson, E., Hartke, A., Auffray, Y. and Giard, J.C. (2009). Ers controls glycerol
metabolism in Enterococcus faecalis. Current Microbiology 58(3), 201-204.
54. Righetti, P.G. (2006). Real and imaginary artifacts in proteome analysis via two-
dimensional maps. Journal of Chromatography B 841, 14–22.
55. Savas L., Guvel S., Onlen Y., Savas N. and Duran N. (2006). Nosocomial Urinary Tract
Infections: Micro-organisms, Antibiotic Sensitivities and Risk Factors. The West Indian
medical journal 55(3), 188-193.
56. Schleifer, K.H. and Kilpper-Balz, R. (1984). Transfer of Streptococcus faecalis and
Streptococcus faecium to the genus Enterococcus nom. rev. as Enterococcus faecalis
comb. nov. and Enterococcus faecium comb. nov. International Journal of Systematic
Bacteriology 34, 31–34.
57. Semedo, T., Santos, M.A., Martins, P., Lopes, M.F., Figueiredo-Marques, J.J., Tenreiro,
R. and Barreto-Crespo, M.T. (2003a) Comparative study using type strains and clinical
and food isolates to examine hemolytic activity and occurrence of cyl operon in
enterococci. Journal of Clinical Microbiology 41, 2569–2576.
58. Semedo, T., Santos, M.A., Lopes, M.F., Figueiredo Marques, J.J., Barreto Crespo, M.T.
and Tenreiro R. (2003b). Virulence factors in food, clinical and reference Enterococci: A
common trait in the genus? Systematic and Applied Microbiology 26, 13-22.
59. Semedo-Lemsaddek, T. , Barreto-Crespo, M.T., and Tenreiro, R. (2009). Occurrence of
Putative Pathogenicity Islands in Enterococci from Distinct Species and of Differing
Origins. Applied and Environmental Microbiology 75, 7271–7274.
60. Semedo-Lemsaddek, T. and Mato, R.. (2011). Chapter 9 Pathogenesis and Virulence
In: Semedo-Lemsaddek, T., Barreto-Crespo, M.T. and Tenreiro R. (Ed.) Enterococcus
and Safety. Nova Science Publishers, Inc, in press.
61. Shankar, N., Baghdayan, A.S. and Gilmore, M.S (2002). Modulation of virulence within
a pathogenicity island in vancomycin-resistant Enterococcus faecalis. Nature 417(6890),
746-750.
62. Shanks, O.C., Santo Domingo, J.W. and Graham, J.E. (2006). Use of competitive DNA
hybridization to identify differences in the genomes of bacteria. Journal of
Microbiological Methods 66, 321–330.
63. Shepard, B.D. and Gilmore, M.S. (1999). Identification of Aerobically and Anaerobically
Induced Genes in Enterococcus faecalis by Random Arbitrarily Primed PCR. Applied
and Environmental Microbiology 65(4),1470–1476.
64. Shepard, B.D. and Gilmore, M.S. (2002). Differential expression of virulence-related
genes in Enterococcus faecalis in response to biological cues in serum and urine.
Infection and Immunity 70(8), 4344-4352.
46
65. Solheim, M., Aakra, A., Vebø, H., Snipen, L. and Nes, I.F. (2007) Transcriptional
Responses of Enterococcus faecalis V583 to Bovine Bile and Sodium Dodecyl Sulfate.
Applied and Environmental Microbiology 73, 5767–5774.
66. Sood, S., Malhotra M., Das B.K. and Kapil A. (2008). Enterococcal infections &
antimicrobial resistance. Indian Journal of Medicine Research 128(2), 111-21.
67. Van Schaik, W., Top, J., Riley, D.R., Boekhorst, J., Vrijenhoek, J.E., Schapendonk,
C.M., Hendrickx, A.P., Nijman, I.J., Bonten, M.J., Tettelin, H. and Willems, R.J. (2010).
Pyrosequencing-based comparative genome analysis of the nosocomial pathogen
Enterococcus faecium and identification of a large transferable pathogenicity island.
BMC Genomics 11, 239.
68. Vebø, H.C., Snipen, L., Nes, I.F. and Brede D.A. (2009). The transcriptome of the
nosocomial pathogen Enterococcus faecalis V583 reveals adaptive responses to
growth in blood. PLoS One 4(11), e7660.
69. Vebø, H.C, Solheim, M., Snipen, L., Nes, I.F. and Brede D.A. (2010). Comparative
genomic analysis of pathogenic and probiotic Enterococcus faecalis isolates, and their
transcriptional responses to growth in human urine. PLoS One 5(8), e12489.
70. Wang, X., He, X., Jiang, Z., Wang, J., Chen, X., Liu, D., Wang, F., Guo, Y., Zhao, J., Liu,
F., Huang, L. and Yuan J. (2010). Proteomic Analysis of the Enterococcus faecalis
V583 Strain and Clinical Isolate V309 under Vancomycin Treatment. Journal of
Proteome Research 9, 1772–1785.
71. Woodford, N. and Livermore, D.M. (2009). Infections caused by Gram-positive bacteria
a review of the global challenge. Journal of Infection 59(S1), S4–S16.
72. Yoshimura, M., Asai, K., Sadaie, Y. and Yoshikawa, H. (2004). Interaction of Bacillus
subtilis extracytoplasmic function (ECF) sigma factors with the N-terminal regions of
their potential anti-sigma factors. Microbiology 150(3), 591-599.