Embed Size (px)
Citation preview
DIFFERENTIAL EXPRESSION OF SMALL RNAS IN SOYBEAN
BY
EDHILVIA JOSEFINA CAMPOS VELASQUEZ
THESIS
Submitted in partial fulfillment of the requirements
for the degree of Master of Science in Crop Sciences
in the Graduate College of the
University of Illinois at Urbana-Champaign, 2011
Urbana, Illinois
Adviser:
Professor Lila Vodkin
ii
ABSTRACT
Small RNAs are non-protein coding RNAs that regulate gene expression in plants
primarily by cleaving mRNA. Two major classes of small non-coding RNAs are
microRNAs (miRNAs) and short interfering RNAs (siRNAs) of 21-24 nucleotides. I
selected some small RNAs that show tissue specificity based on results from high-
throughput sequencing for further investigation. I optimized the protocols for small RNA
isolation and blotting. Purified RNAs from multiple tissues such as immature seed coats
and cotyledons, germinated cotyledons, unifoliates, shoot tips, stems, and roots were used
to examine differential expression. The RNA blots were probed with the 5’ end-labeled
oligonucleotides that would complement the sequence of the small RNAs. One dramatic
example is represented by the endogenous tissue-specific siRNAs that are present only in
the immature seed coats of soybean varieties with yellow seed coats (Tuteja et al., 2009)
and that target chalcone synthase mRNAs for down-regulation leading to absence of
pigment in the seed coats. In addition, several other novel miRNAs and siRNAs were
shown to be expressed differentially in seed coats versus cotyledon including highly
abundant small RNAs with over 100,000 sequences per million total sequence reads.
iii
ACKNOWLEDGEMENTS
This work would have not been possible without the dedicated support by my
advisor Dr. Lila Vodkin, without her assistance, kind patience and guidance I would not
have not accomplished my graduate studies. I will be truly indebted to her and I am
thankful to have the chance to have been a member of her laboratory. I will always
cherish my experiences in her company. I would like to thank present and past members
of the Vodkin laboratory, Sarah Jones, Gracia Zabala, Jinu Jacob, Navneet Kaur, Brian
Cho, Lindsay Freeberg, Orlando Gonzalez, Matt Hunt, and many of the undergraduate
lab assistants over the years, without their advice/ help I would have not being able to
succeed. I want to thank the members of my committee, Dr. Stephen Moose and Dr. Kris
Lambert for their assistance. This project was supported by United Soybean Board and
Illinois Soybean Association and CRI program of University of Illinois.
I would like to thank my parents Xiomara and José, sister Ana Sophia, for their
love and encouragement, without their support I would have not completed this degree; I
dedicate this thesis to them. I also would like to thank my American family Art and
Annie Farlow for their love and words of encouragement, my friends at the Keck Center
for allowing me to visit at all times and place a smile on my face, especially Alvaro
Hernandez for his invaluable counsel, my friends Sarah and Joshua Stewman for their
constant encouragement, Stephanie Rousonelos for supporting me at all stages of my
project and for her wonderful friendship, and finally my family in Venezuela, specially
Asdrubal, Belkis, and Belkys for their love in spite of the distance.
iv
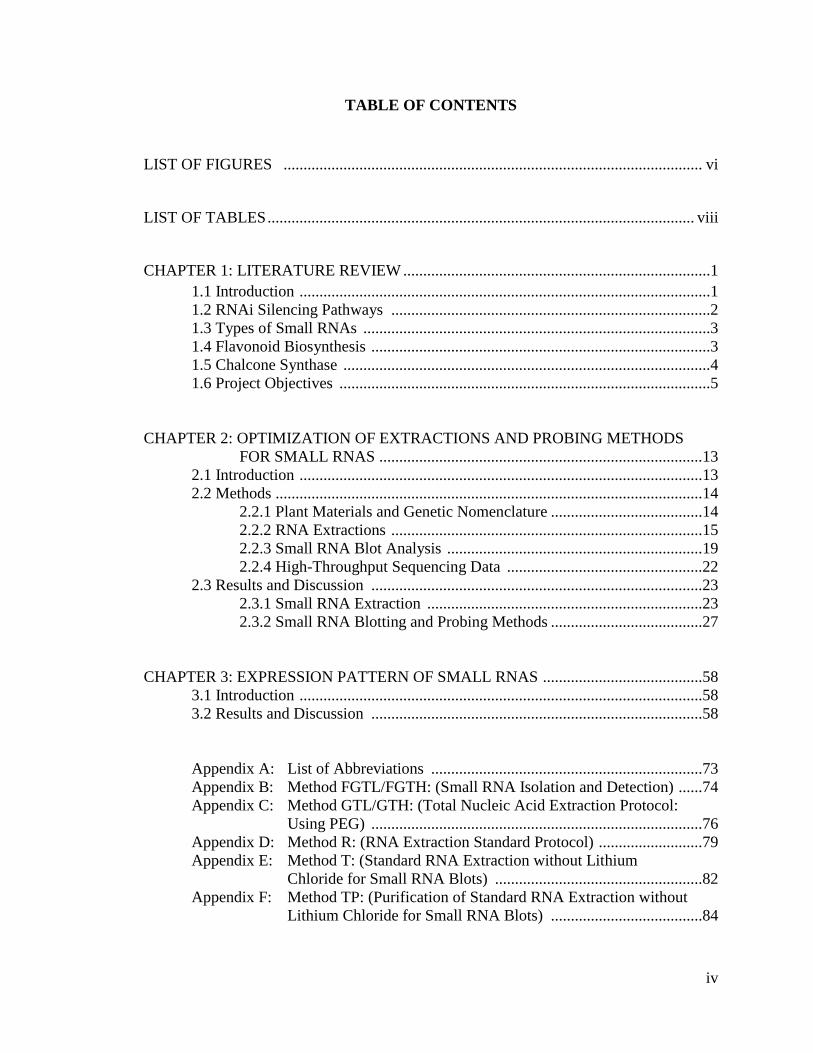
TABLE OF CONTENTS
LIST OF FIGURES ......................................................................................................... vi
LIST OF TABLES ........................................................................................................... viii
CHAPTER 1: LITERATURE REVIEW .............................................................................1
1.1 Introduction .......................................................................................................1
1.2 RNAi Silencing Pathways ................................................................................2
1.3 Types of Small RNAs .......................................................................................3
1.4 Flavonoid Biosynthesis .....................................................................................3
1.5 Chalcone Synthase ............................................................................................4
1.6 Project Objectives .............................................................................................5
CHAPTER 2: OPTIMIZATION OF EXTRACTIONS AND PROBING METHODS
FOR SMALL RNAS .................................................................................13
2.1 Introduction .....................................................................................................13
2.2 Methods ...........................................................................................................14
2.2.1 Plant Materials and Genetic Nomenclature ......................................14
2.2.2 RNA Extractions ..............................................................................15
2.2.3 Small RNA Blot Analysis ................................................................19
2.2.4 High-Throughput Sequencing Data .................................................22
2.3 Results and Discussion ...................................................................................23
2.3.1 Small RNA Extraction .....................................................................23
2.3.2 Small RNA Blotting and Probing Methods ......................................27
CHAPTER 3: EXPRESSION PATTERN OF SMALL RNAS ........................................58
3.1 Introduction .....................................................................................................58
3.2 Results and Discussion ...................................................................................58
Appendix A: List of Abbreviations ....................................................................73
Appendix B: Method FGTL/FGTH: (Small RNA Isolation and Detection) ......74
Appendix C: Method GTL/GTH: (Total Nucleic Acid Extraction Protocol:
Using PEG) ...................................................................................76
Appendix D: Method R: (RNA Extraction Standard Protocol) ..........................79
Appendix E: Method T: (Standard RNA Extraction without Lithium
Chloride for Small RNA Blots) ....................................................82
Appendix F: Method TP: (Purification of Standard RNA Extraction without
Lithium Chloride for Small RNA Blots) ......................................84
v
Appendix G: Method V: (Modified RNA Extraction Method with PVPP and
Lithium Chloride) .........................................................................86
Appendix H: Method VT: (Modified RNA Extraction Method with no
Lithium Chloride) .........................................................................89
Appendix I: Method VTP: (Purified Modified RNA Extraction Method
with no Lithium Chloride) ............................................................92
Appendix J: RNA Extraction Buffers ...............................................................94
Appendix K: Small RNA Blot Analysis .............................................................96
Appendix L: 5’ End Labeling Gamma Radiolabeled Oligo ..............................107
Appendix M: Radioactive Labeling of DNA by Random Primer Reaction ......109
Appendix N: Hydrolysis of In Vitro Transcribed Probe ...................................110
Appendix O: Northern Pre-hybridization Solution ...........................................111
Appendix P: Baulcombe Pre-hybridization Solution .......................................112
Appendix Q: Phosphate Pre-hybridization Solution .........................................113
LITERATURE CITED ....................................................................................................114
vi
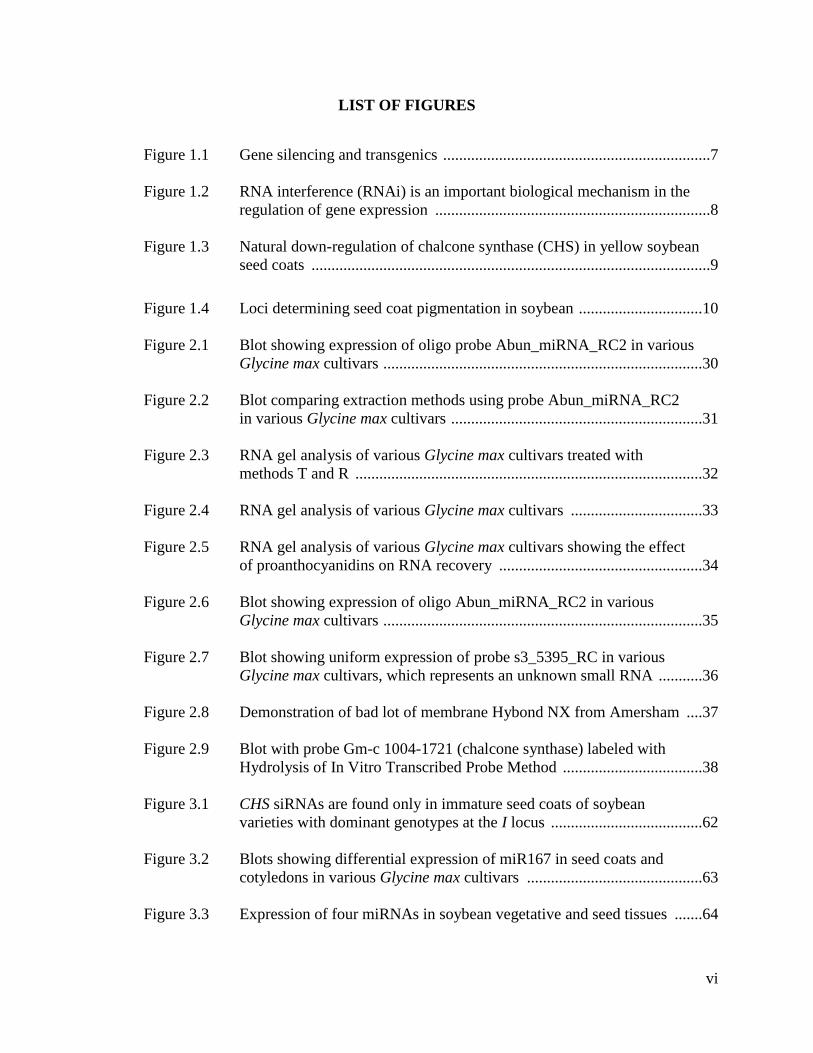
LIST OF FIGURES
Figure 1.1 Gene silencing and transgenics ...................................................................7
Figure 1.2 RNA interference (RNAi) is an important biological mechanism in the
regulation of gene expression .....................................................................8
Figure 1.3 Natural down-regulation of chalcone synthase (CHS) in yellow soybean
seed coats ....................................................................................................9
Figure 1.4 Loci determining seed coat pigmentation in soybean ...............................10
Figure 2.1 Blot showing expression of oligo probe Abun_miRNA_RC2 in various
Glycine max cultivars ................................................................................30
Figure 2.2 Blot comparing extraction methods using probe Abun_miRNA_RC2
in various Glycine max cultivars ...............................................................31
Figure 2.3 RNA gel analysis of various Glycine max cultivars treated with
methods T and R .......................................................................................32
Figure 2.4 RNA gel analysis of various Glycine max cultivars .................................33
Figure 2.5 RNA gel analysis of various Glycine max cultivars showing the effect
of proanthocyanidins on RNA recovery ...................................................34
Figure 2.6 Blot showing expression of oligo Abun_miRNA_RC2 in various
Glycine max cultivars ................................................................................35
Figure 2.7 Blot showing uniform expression of probe s3_5395_RC in various
Glycine max cultivars, which represents an unknown small RNA ...........36
Figure 2.8 Demonstration of bad lot of membrane Hybond NX from Amersham ....37
Figure 2.9 Blot with probe Gm-c 1004-1721 (chalcone synthase) labeled with
Hydrolysis of In Vitro Transcribed Probe Method ...................................38
Figure 3.1 CHS siRNAs are found only in immature seed coats of soybean
varieties with dominant genotypes at the I locus ......................................62
Figure 3.2 Blots showing differential expression of miR167 in seed coats and
cotyledons in various Glycine max cultivars ............................................63
Figure 3.3 Expression of four miRNAs in soybean vegetative and seed tissues .......64
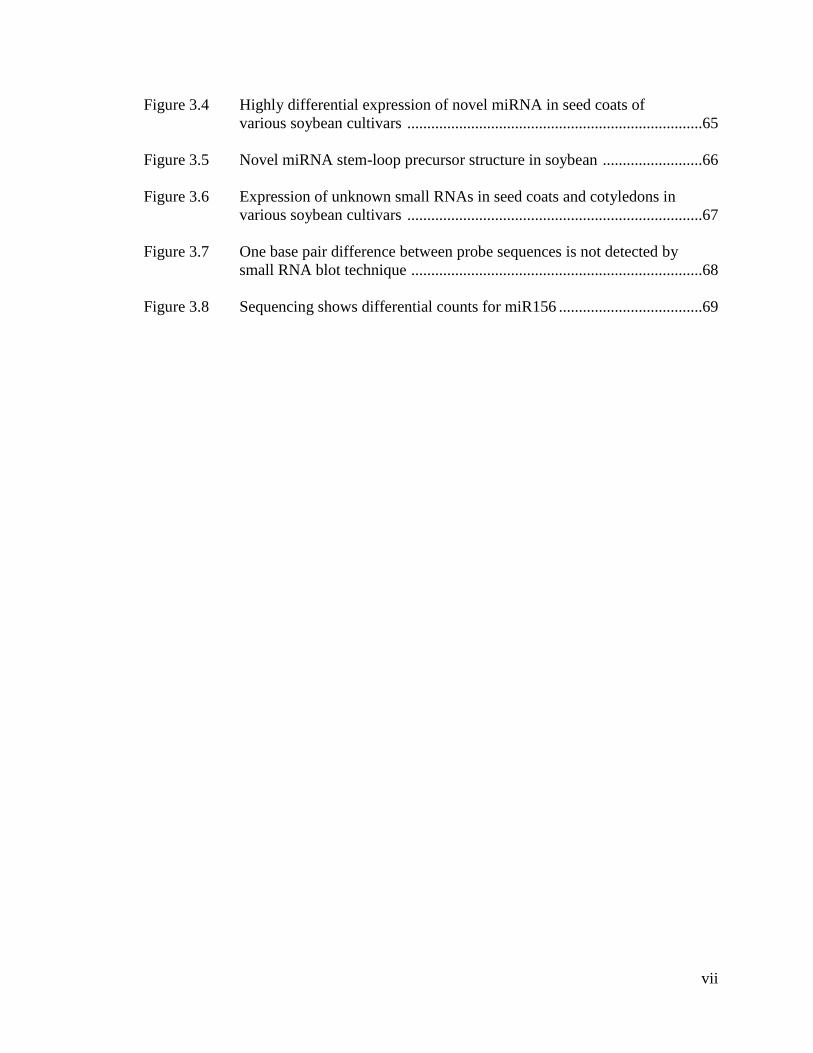
vii
Figure 3.4 Highly differential expression of novel miRNA in seed coats of
various soybean cultivars ..........................................................................65
Figure 3.5 Novel miRNA stem-loop precursor structure in soybean .........................66
Figure 3.6 Expression of unknown small RNAs in seed coats and cotyledons in
various soybean cultivars ..........................................................................67
Figure 3.7 One base pair difference between probe sequences is not detected by
small RNA blot technique .........................................................................68
Figure 3.8 Sequencing shows differential counts for miR156 ....................................69
viii
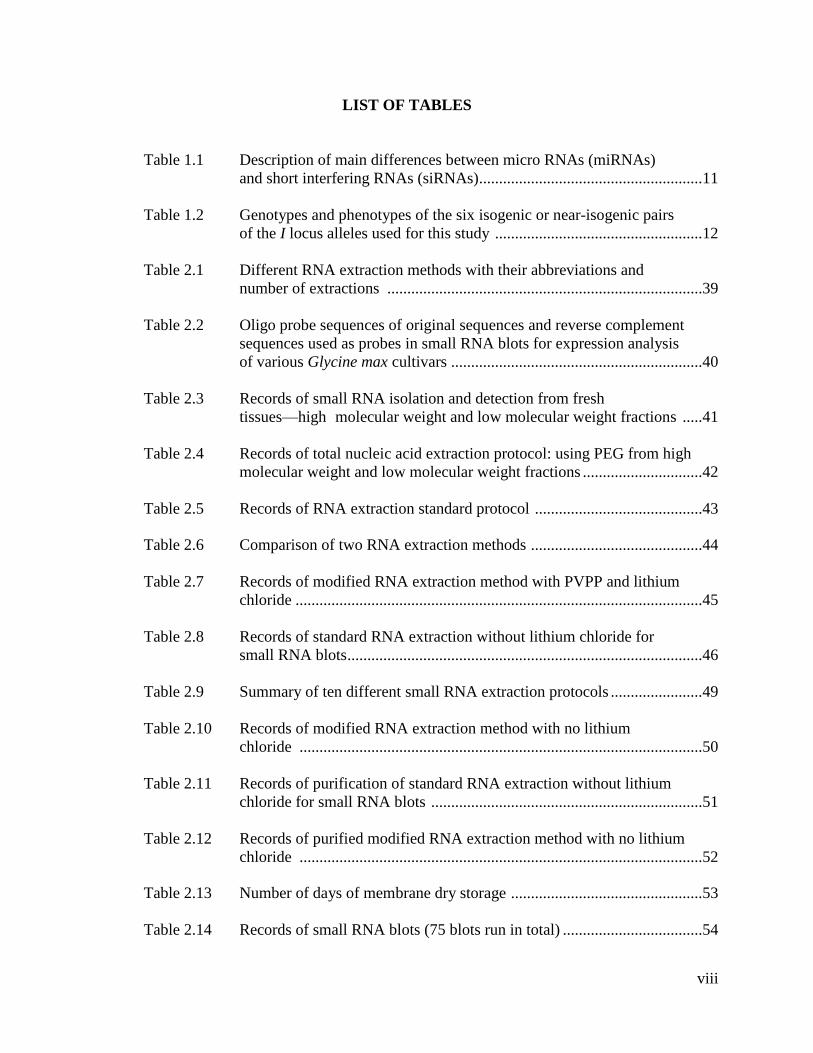
LIST OF TABLES
Table 1.1 Description of main differences between micro RNAs (miRNAs)
and short interfering RNAs (siRNAs)........................................................11
Table 1.2 Genotypes and phenotypes of the six isogenic or near-isogenic pairs
of the I locus alleles used for this study ....................................................12
Table 2.1 Different RNA extraction methods with their abbreviations and
number of extractions ...............................................................................39
Table 2.2 Oligo probe sequences of original sequences and reverse complement
sequences used as probes in small RNA blots for expression analysis
of various Glycine max cultivars ...............................................................40
Table 2.3 Records of small RNA isolation and detection from fresh
tissues—high molecular weight and low molecular weight fractions .....41
Table 2.4 Records of total nucleic acid extraction protocol: using PEG from high
molecular weight and low molecular weight fractions ..............................42
Table 2.5 Records of RNA extraction standard protocol ..........................................43
Table 2.6 Comparison of two RNA extraction methods ...........................................44
Table 2.7 Records of modified RNA extraction method with PVPP and lithium
chloride ......................................................................................................45
Table 2.8 Records of standard RNA extraction without lithium chloride for
small RNA blots .........................................................................................46
Table 2.9 Summary of ten different small RNA extraction protocols .......................49
Table 2.10 Records of modified RNA extraction method with no lithium
chloride .....................................................................................................50
Table 2.11 Records of purification of standard RNA extraction without lithium
chloride for small RNA blots ....................................................................51
Table 2.12 Records of purified modified RNA extraction method with no lithium
chloride .....................................................................................................52
Table 2.13 Number of days of membrane dry storage ................................................53
Table 2.14 Records of small RNA blots (75 blots run in total) ...................................54
ix
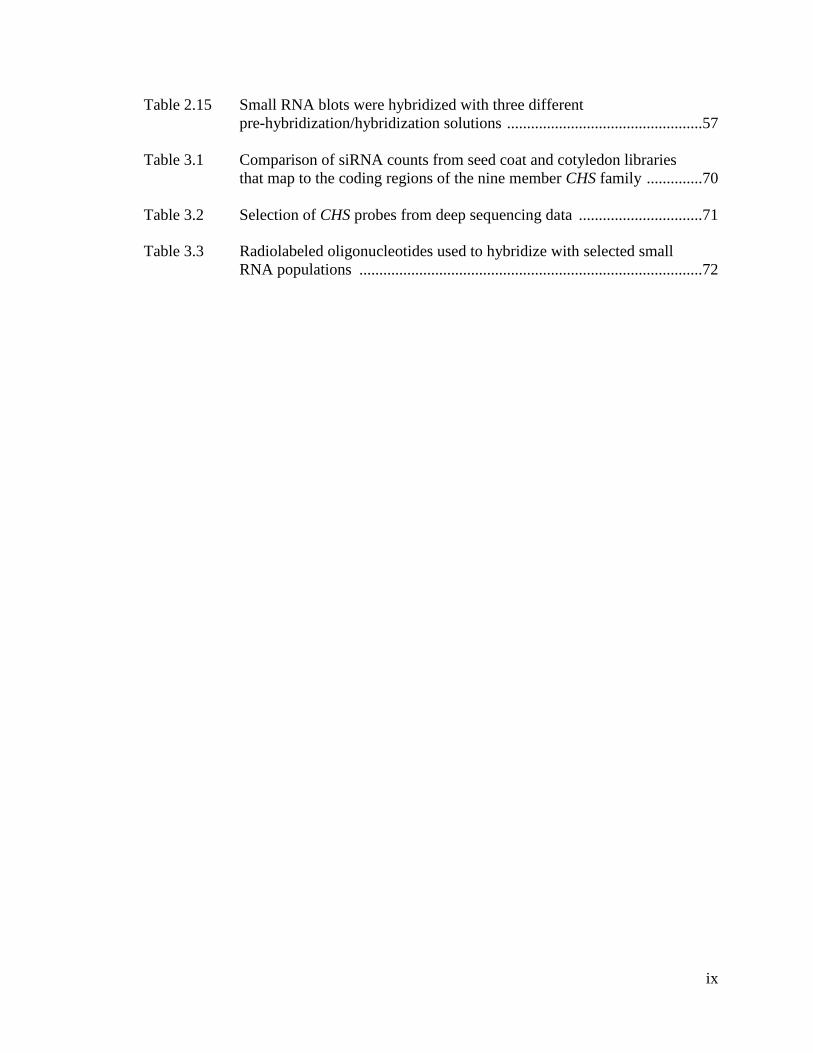
Table 2.15 Small RNA blots were hybridized with three different
pre-hybridization/hybridization solutions .................................................57
Table 3.1 Comparison of siRNA counts from seed coat and cotyledon libraries
that map to the coding regions of the nine member CHS family ..............70
Table 3.2 Selection of CHS probes from deep sequencing data ...............................71
Table 3.3 Radiolabeled oligonucleotides used to hybridize with selected small
RNA populations ......................................................................................72
1
CHAPTER 1
Literature Review
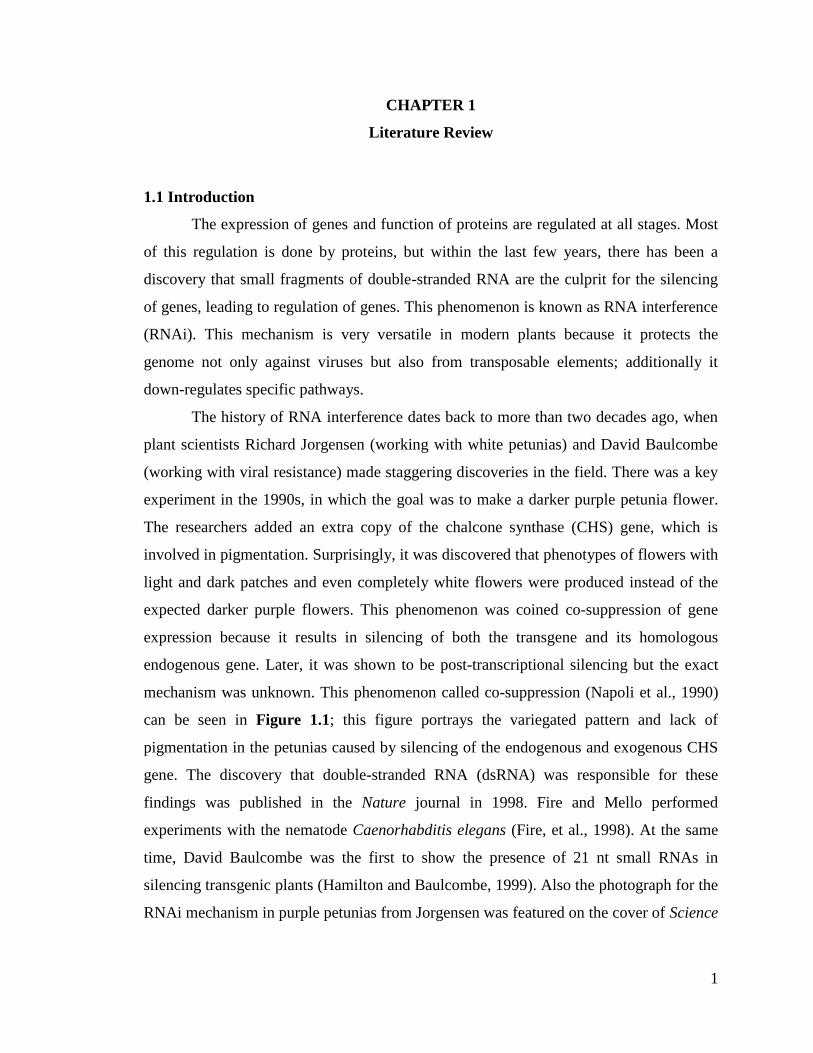
1.1 Introduction
The expression of genes and function of proteins are regulated at all stages. Most
of this regulation is done by proteins, but within the last few years, there has been a
discovery that small fragments of double-stranded RNA are the culprit for the silencing
of genes, leading to regulation of genes. This phenomenon is known as RNA interference
(RNAi). This mechanism is very versatile in modern plants because it protects the
genome not only against viruses but also from transposable elements; additionally it
down-regulates specific pathways.
The history of RNA interference dates back to more than two decades ago, when
plant scientists Richard Jorgensen (working with white petunias) and David Baulcombe
(working with viral resistance) made staggering discoveries in the field. There was a key
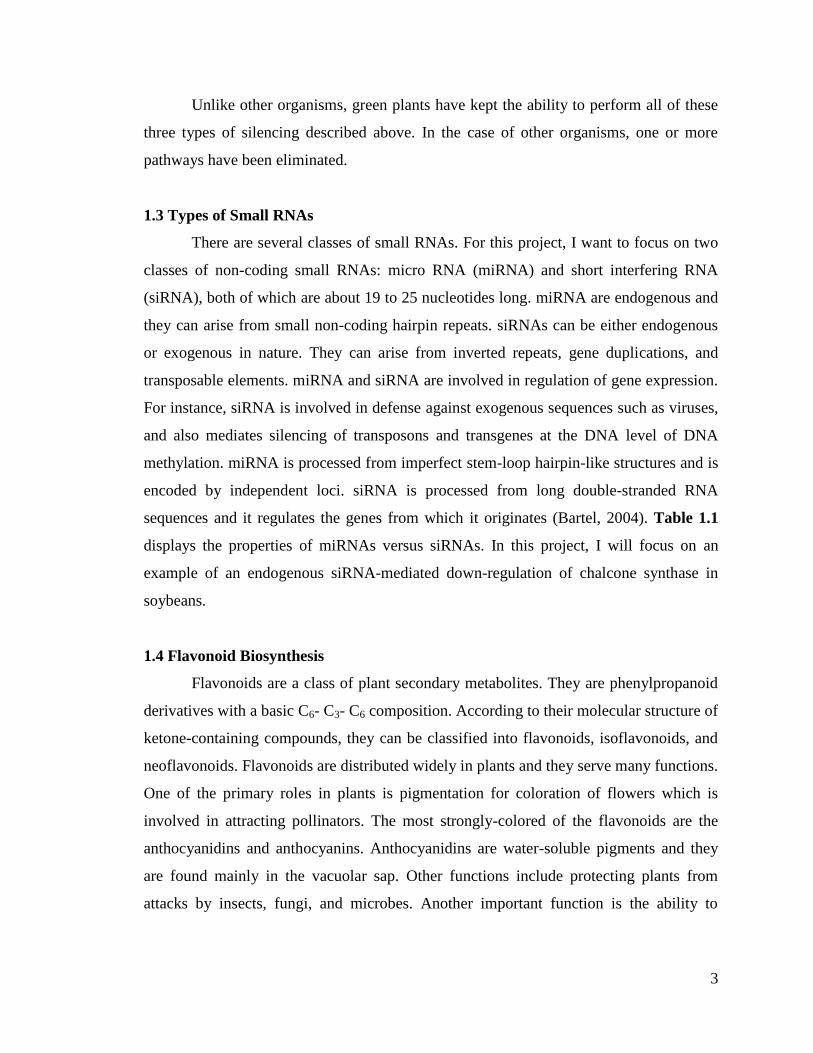
experiment in the 1990s, in which the goal was to make a darker purple petunia flower.
The researchers added an extra copy of the chalcone synthase (CHS) gene, which is
involved in pigmentation. Surprisingly, it was discovered that phenotypes of flowers with
light and dark patches and even completely white flowers were produced instead of the
expected darker purple flowers. This phenomenon was coined co-suppression of gene
expression because it results in silencing of both the transgene and its homologous
endogenous gene. Later, it was shown to be post-transcriptional silencing but the exact
mechanism was unknown. This phenomenon called co-suppression (Napoli et al., 1990)
can be seen in Figure 1.1; this figure portrays the variegated pattern and lack of
pigmentation in the petunias caused by silencing of the endogenous and exogenous CHS
gene. The discovery that double-stranded RNA (dsRNA) was responsible for these
findings was published in the Nature journal in 1998. Fire and Mello performed
experiments with the nematode Caenorhabditis elegans (Fire, et al., 1998). At the same
time, David Baulcombe was the first to show the presence of 21 nt small RNAs in
silencing transgenic plants (Hamilton and Baulcombe, 1999). Also the photograph for the
RNAi mechanism in purple petunias from Jorgensen was featured on the cover of Science
2
in September of 2004 (Jorgensen, 2004). A detailed illustration of the RNAi mechanism
can be seen in Figure 1.2.
1.2 RNAi Silencing Pathways
There are different pathways of RNA silencing. For example, in plants this was
described by David Baulcombe in Nature, 2004. In all of these pathways, there is the
involvement of a double-stranded RNA (dsRNA) cleavage by the enzyme Dicer (with
RNA III domain) which produces fragments of nucleotides ranging in size from 21 to 26
nt. The resulting RNA fragments are noted as micro RNAs (miRNAs) and short
interfering RNAs (siRNAs).
The first pathway, for silencing by siRNA, occurs in the cytoplasm of plant cells.
This pathway is operative in cases in which a plant has been infected with a virus, and the
piece of dsRNA is a possible replicated intermediate or a secondary structure feature of a
viral RNA (single-stranded). In the example of DNA viruses in plants, the formation of
dsRNA is caused by the annealing of the overlap of complementary transcripts. Other
examples of plant silencing by transgenes are most likely a result of RNA silencing in the
cytoplasm of cells.
The second pathway, for silencing by miRNA, occurs by the inactivation of
endogenous messenger RNAs. There is a negative regulation of gene expression by
miRNAs base pairing to the targeted mRNAs, causing either the cleavage of RNA or the
halt of translation of proteins. Like siRNAs, miRNAs consist of RNAs of nucleotides of
21 to 24 bases in length created by the cleavage of a precursor by Dicer. miRNAs are
created from an RNA precursor which consists of inverted repeats with a certain degree
of regions that are double-stranded, and they target the single-stranded mRNA that is
complementary to it.
The third pathway for silencing in plants occurs by the methylation of DNA and
the arrest of transcription. The directed methylation of DNA by siRNA is associated with
the modification of histones. The protection of the genome against transposons is an
example of a key role for RNA silencing at the level of chromatin.
3
Unlike other organisms, green plants have kept the ability to perform all of these
three types of silencing described above. In the case of other organisms, one or more
pathways have been eliminated.
1.3 Types of Small RNAs
There are several classes of small RNAs. For this project, I want to focus on two
classes of non-coding small RNAs: micro RNA (miRNA) and short interfering RNA
(siRNA), both of which are about 19 to 25 nucleotides long. miRNA are endogenous and
they can arise from small non-coding hairpin repeats. siRNAs can be either endogenous
or exogenous in nature. They can arise from inverted repeats, gene duplications, and
transposable elements. miRNA and siRNA are involved in regulation of gene expression.
For instance, siRNA is involved in defense against exogenous sequences such as viruses,
and also mediates silencing of transposons and transgenes at the DNA level of DNA
methylation. miRNA is processed from imperfect stem-loop hairpin-like structures and is
encoded by independent loci. siRNA is processed from long double-stranded RNA
sequences and it regulates the genes from which it originates (Bartel, 2004). Table 1.1
displays the properties of miRNAs versus siRNAs. In this project, I will focus on an
example of an endogenous siRNA-mediated down-regulation of chalcone synthase in
soybeans.
1.4 Flavonoid Biosynthesis
Flavonoids are a class of plant secondary metabolites. They are phenylpropanoid
derivatives with a basic C6- C3- C6 composition. According to their molecular structure of
ketone-containing compounds, they can be classified into flavonoids, isoflavonoids, and
neoflavonoids. Flavonoids are distributed widely in plants and they serve many functions.
One of the primary roles in plants is pigmentation for coloration of flowers which is
involved in attracting pollinators. The most strongly-colored of the flavonoids are the
anthocyanidins and anthocyanins. Anthocyanidins are water-soluble pigments and they
are found mainly in the vacuolar sap. Other functions include protecting plants from
attacks by insects, fungi, and microbes. Another important function is the ability to
4
absorb UV light thus protecting the underlying leaf tissues from damage due to the
ultraviolet radiation.
Flavonoids also have a symbiotic relationship with Rhizobia (Moscatiello et al.,
2010). Flavonoids serve as signaling molecules to Rhizobia, which is able to sense these
compounds; this triggers the secretion of Nod factors which are then recognized by the
host plant (legumes), which leads to root hair deformation and many other cellular
responses. Another example of a symbiotic relationship with flavonoids is their
involvement with Bradyrhizobium, in which they function as developmental signals
(Long, 1989). Flavonoids also are a great source of antioxidants; thus they are very
important in the food industry. They are possibly involved with other health benefits such
as cancer prevention.
1.5 Chalcone Synthase
The phenylpropanoid metabolic pathway is involved in the synthesis of
flavonoids. The amino acid phenylalanine is used to produce 4-coumaroyl-CoA and this
can be combined with malonyl-CoA to produce a group of compounds called chalcones
which are the backbone of flavonoids. The key enzyme is chalcone synthase (CHS),
which catalyses the first committed step in flavonoid biosynthesis. CHS forms a 15-
carbon compound named deoxychalcone (or naringenin chalcone). CHS is a dimer of
about 82,000 daltons and it is a cytosolic enzyme. CHS is responsible for the activation
of the 3-malonyl-CoA condensation reaction with a single molecule of coumaroyl-CoA.
CHS is considered to be the rate-limiting enzyme in flavonoid biosynthesis.
There are multiple CHS genes. In soybeans, the CHS genes are very similar and
they are clustered together in some cases, suggesting that gene duplication of an ancestral
sequence gave rise to some (Koes, 1987). In the study by Ryder in 1987, there was a
suggestion that the family of multi-CHS genes has evolved because of the novel
biological systems in the family of legumes such as the fixation of nitrogen and the
synthesis of defense compounds such as isoflavonoid phytoalexins.
Among all plant species, the flavonoid pathway is universal and it is activated by
many stimuli including light, plant hormones, wounding, and nutrient availability
(Stafford, 1990). Additionally anthocyanins and flavonoids are the main pigments of
5
flowers and reproductive structures involved in pollination and seed dispersal. Because of
the multiple functions of flavonoids, the genes in this pathway must be precisely
regulated. For a long time, CHS has been known as the control point in the flavonoid
pathway since it controls the biosynthesis of the first 15-carbon compound that leads to
the synthesis of other flavonoids and anthocyanins.
The deposition of anthocyanin pigments in the vacuole of the epidermal layer of
the seed coat is controlled by the I gene. At approximately 300 mg fresh weight, there is
visible anthocyanin pigment in seed coats with the i recessive genotype. The chlorophyll
begins to degrade at this developmental stage. Additionally, seed coats with the genotype
of I or ii alleles have a yellow seed coat color instead of green because of the degradation
of chlorophyll (Buzzell, et al., 1987).
Studies in the past have demonstrated the complex molecular relationship
between the CHS multigene family and the I locus in soybeans. The steady levels of CHS
mRNA are lessened at all stages of development in the dominant I allele (yellow seed
coats) as compared to the pigmented seed coats. The levels of the CHS enzyme are seven
to ten times greater at all stages of development in pigmented seed coats with the
recessive i allele (Wang et al., 1994). This suggests that in yellow seed coats the
anthocyanin pigmentation is reduced because of the levels of mRNA which at the end
leads to the reduction of CHS activity. This is schematically represented in Figure 1.3.
In this project we work with the soybean cultivar Williams 43 which at maturity
has a yellow seed coat, the result of most CHS genes being silenced by small RNA in that
tissue. This prevents the production of anthocyanins that would otherwise darken the seed
coat (Todd and Vodkin, 1996; Tuteja et al., 2004, 2009).
1.6 Project Objectives
The three major objectives of this project are the following: to optimize small
RNA extractions and blotting; to correlate deep sequencing data results with small RNA
blotting results; and to study the expression of small RNAs in soybean. In order to
perform total RNA extractions of different soybean cultivars, I used various tissues of
young seedlings such as roots, stems, germinated cotyledons, unifoliates, and shoot tips. I
also used the seed coats and cotyledons from immature seeds. Refer to Figure 1.4 for the

6
loci determining seed coat pigmentation in soybean and Table 1.2 for the genotypes and
phenotypes of the six isogenic or near-isogenic pairs of the I locus alleles used in this
study.
7
Figure 1.1 Gene silencing and transgenics. Surprisingly, an extra copy of the CHS gene added by genetic engineering shut off
the pigmentation pathway in petunias. The flowers became variegated or white rather
than the deeper color expected. Image from van der Krol et al. Plant Cell, Vol. 2, 294,
April 1990.
Figures
8
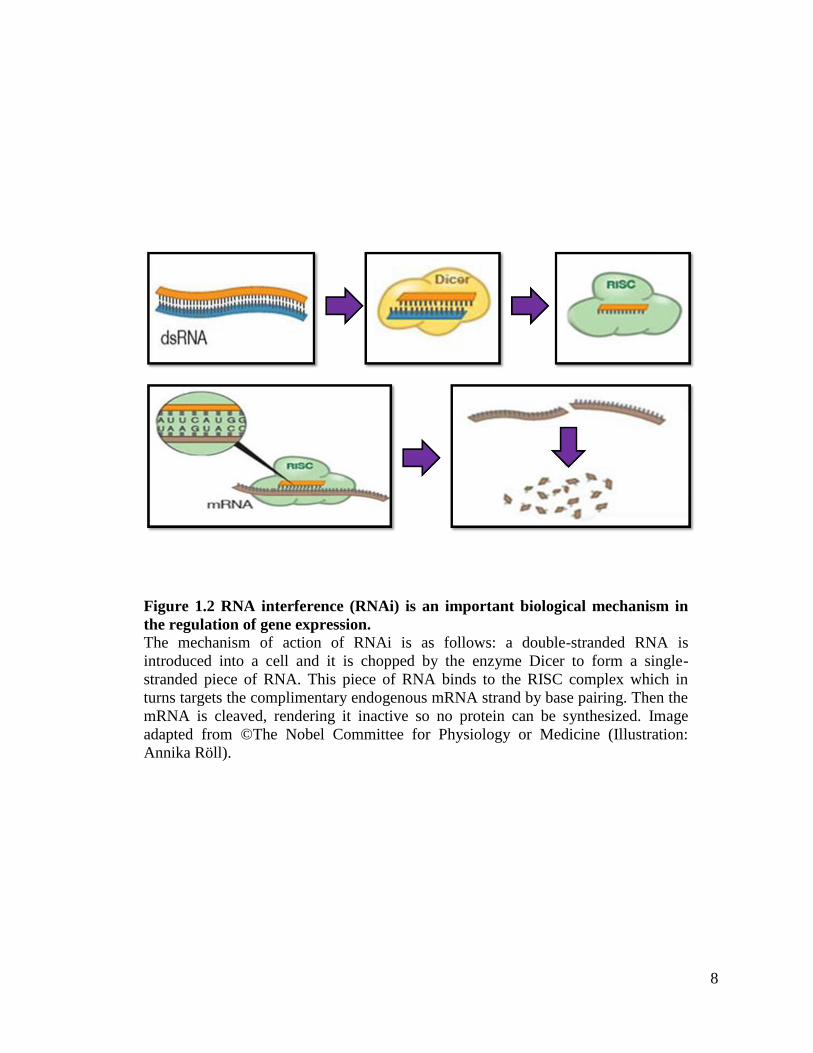
Figure 1.2 RNA interference (RNAi) is an important biological mechanism in
the regulation of gene expression. The mechanism of action of RNAi is as follows: a double-stranded RNA is
introduced into a cell and it is chopped by the enzyme Dicer to form a single-
stranded piece of RNA. This piece of RNA binds to the RISC complex which in
turns targets the complimentary endogenous mRNA strand by base pairing. Then the
mRNA is cleaved, rendering it inactive so no protein can be synthesized. Image
adapted from ©The Nobel Committee for Physiology or Medicine (Illustration:
Annika Röll).
9
Х
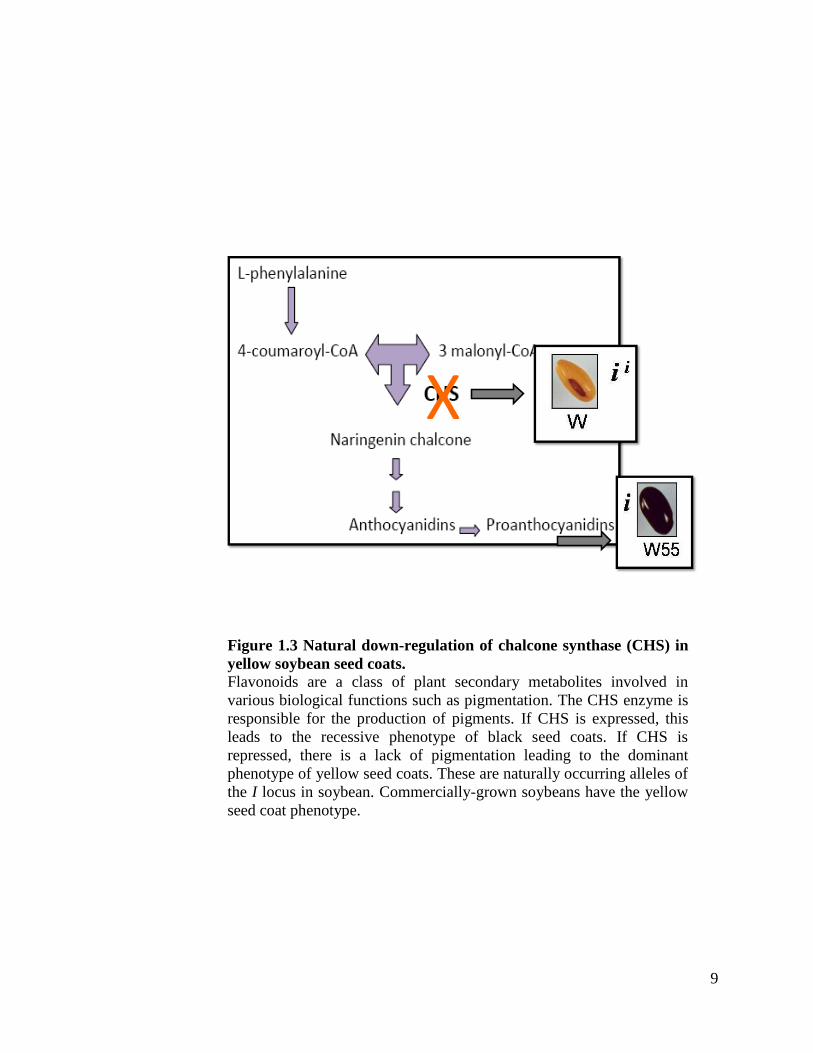
Figure 1.3 Natural down-regulation of chalcone synthase (CHS) in
yellow soybean seed coats.
Flavonoids are a class of plant secondary metabolites involved in
various biological functions such as pigmentation. The CHS enzyme is
responsible for the production of pigments. If CHS is expressed, this
leads to the recessive phenotype of black seed coats. If CHS is
repressed, there is a lack of pigmentation leading to the dominant
phenotype of yellow seed coats. These are naturally occurring alleles of
the I locus in soybean. Commercially-grown soybeans have the yellow
seed coat phenotype.
10
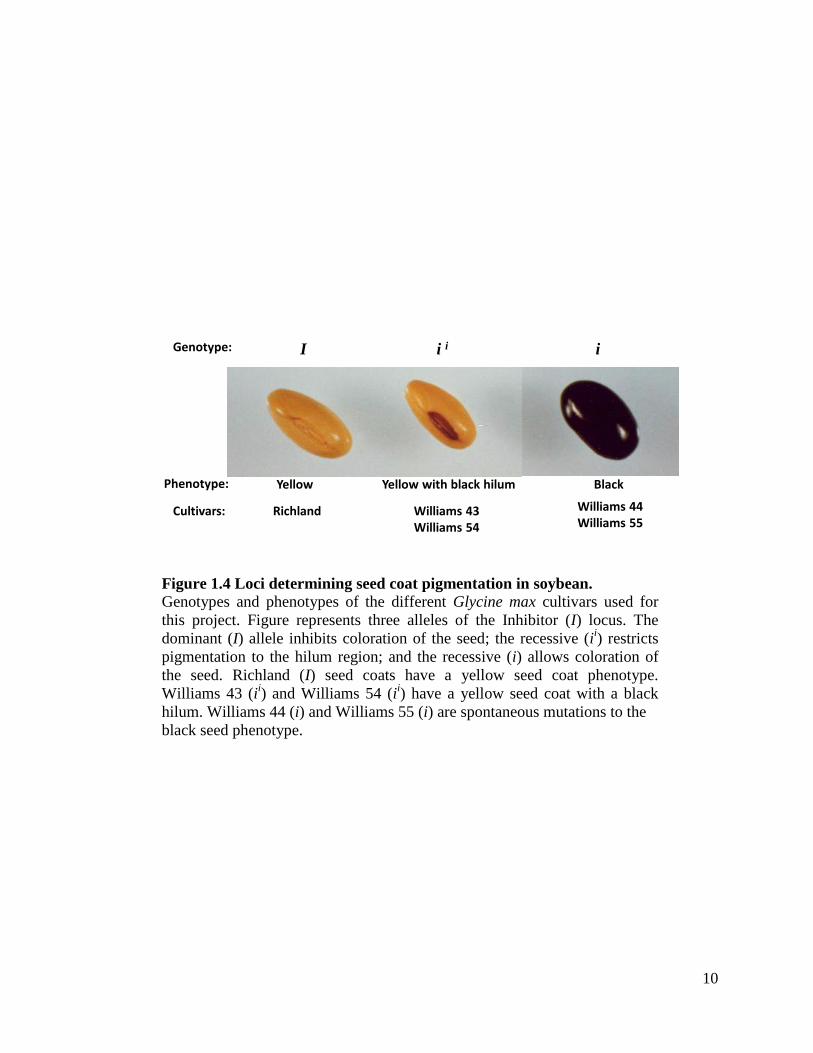
Genotype: I i i i
Yellow Yellow with black hilum Black
Richland Williams 43Williams 54
Phenotype:
Cultivars: Williams 44Williams 55
Figure 1.4 Loci determining seed coat pigmentation in soybean. Genotypes and phenotypes of the different Glycine max cultivars used for
this project. Figure represents three alleles of the Inhibitor (I) locus. The
dominant (I) allele inhibits coloration of the seed; the recessive (ii) restricts
pigmentation to the hilum region; and the recessive (i) allows coloration of
the seed. Richland (I) seed coats have a yellow seed coat phenotype.
Williams 43 (ii) and Williams 54 (i
i) have a yellow seed coat with a black
hilum. Williams 44 (i) and Williams 55 (i) are spontaneous mutations to the
black seed phenotype.
11
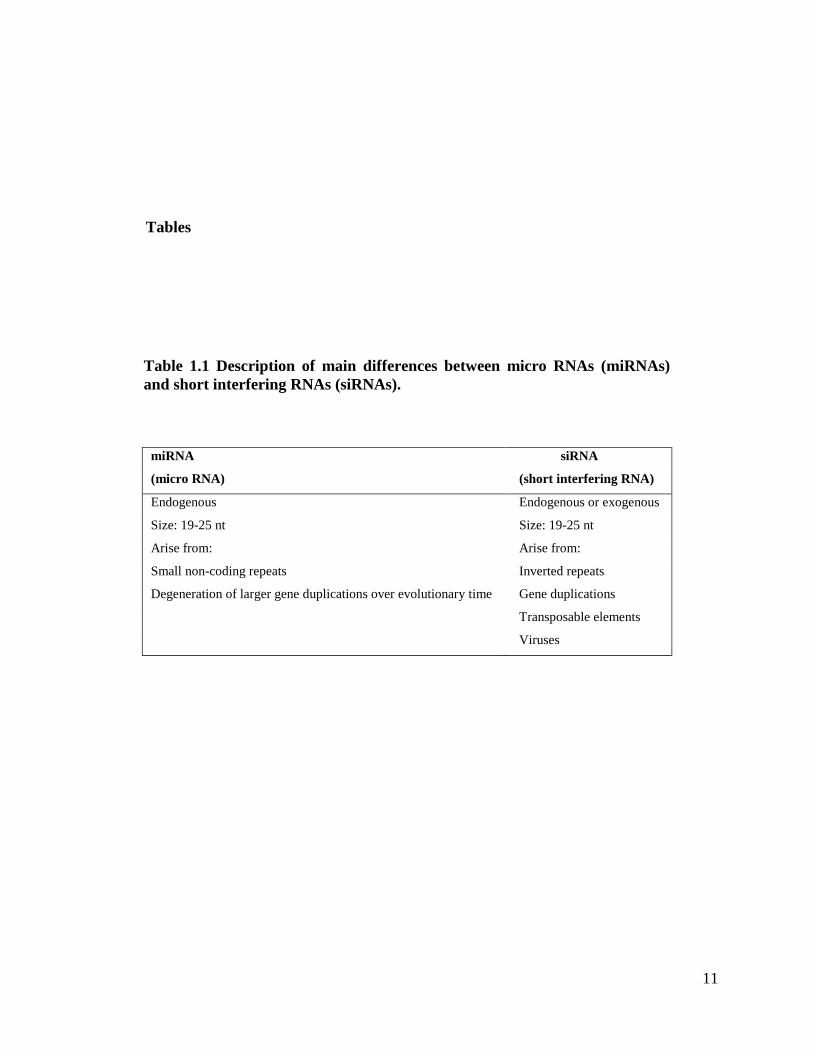
Table 1.1 Description of main differences between micro RNAs (miRNAs)
and short interfering RNAs (siRNAs).
miRNA siRNA
(micro RNA) (short interfering RNA)
Endogenous Endogenous or exogenous
Size: 19-25 nt Size: 19-25 nt
Arise from: Arise from:
Small non-coding repeats Inverted repeats
Degeneration of larger gene duplications over evolutionary time Gene duplications
Transposable elements
Viruses
Tables
12
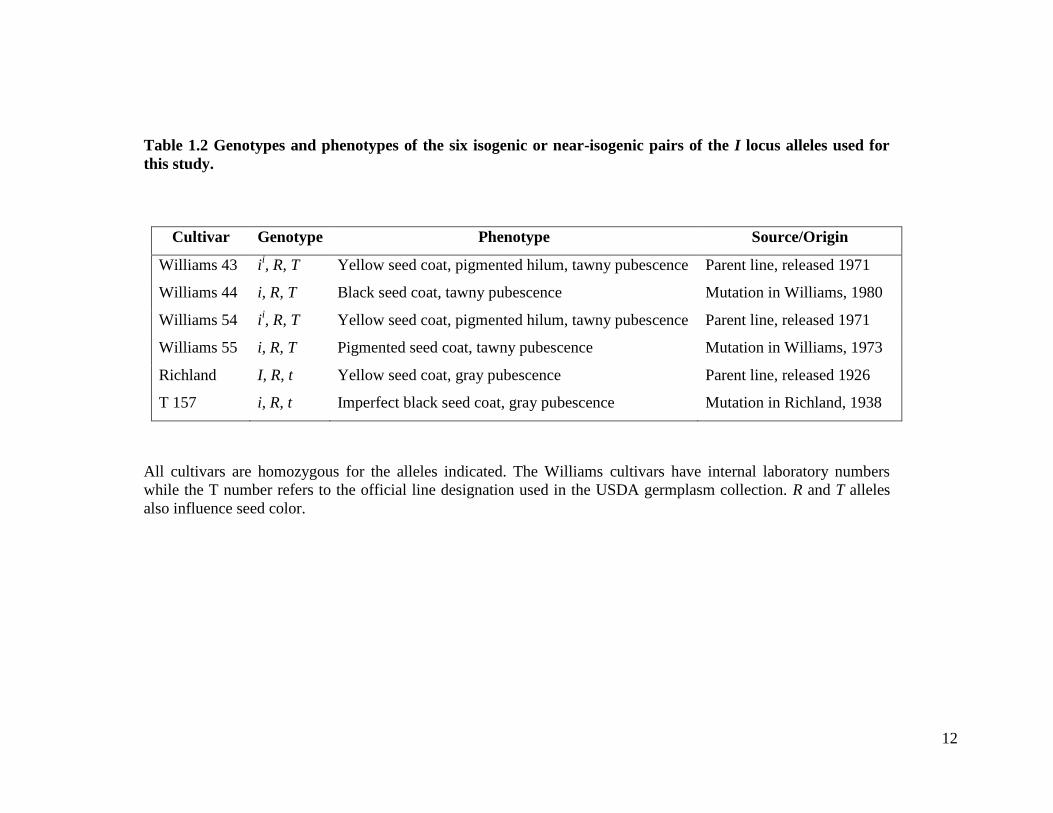
Table 1.2 Genotypes and phenotypes of the six isogenic or near-isogenic pairs of the I locus alleles used for
this study.
Cultivar Genotype Phenotype Source/Origin
Williams 43 ii, R, T Yellow seed coat, pigmented hilum, tawny pubescence Parent line, released 1971
Williams 44 i, R, T Black seed coat, tawny pubescence Mutation in Williams, 1980
Williams 54 ii, R, T Yellow seed coat, pigmented hilum, tawny pubescence Parent line, released 1971
Williams 55 i, R, T Pigmented seed coat, tawny pubescence Mutation in Williams, 1973
Richland I, R, t Yellow seed coat, gray pubescence Parent line, released 1926
T 157 i, R, t Imperfect black seed coat, gray pubescence Mutation in Richland, 1938
All cultivars are homozygous for the alleles indicated. The Williams cultivars have internal laboratory numbers
while the T number refers to the official line designation used in the USDA germplasm collection. R and T alleles
also influence seed color.
13
CHAPTER 2
Optimization of Extractions and Probing Methods for Small RNAs
2.1 Introduction
One of the main goals for my research project was to optimize a protocol to
extract small RNAs from plant tissues of various Glycine max cultivars. I performed a
total of eight extraction methods and succeeded in devising an effective protocol. In
Appendix A there is a complete list with all the abbreviations used for the different
methods.
My second goal was to develop an optimized technique to study small RNA
expression. Many techniques have been developed to examine absolute and relative
levels of gene expression (reviewed in Bartlett, 2002). Historically gene expression was
monitored by Northern analysis. Once a gene is identified, it is useful to determine the
size of the mRNA and determine if alternative nucleic acid variants of difference sizes
are present. This information can be used to estimate the size of the putative protein and
confirm DNA sequencing data. The method used to analyze RNA in this way is Northern
blot analysis, in which total RNA is run on a denaturing agarose gel and a specific target
is detected by hybridization to a labeled probe in the membrane (Ausubel et al. 2003;
Sambrook and Russell, 2001). The resulting signal is proportional to the amount of target
RNA in the RNA population. Comparing signals from two or more tissue populations
reveals relative differences in gene expression levels. The first step in Northern blot
analysis is isolating RNA from the tissue of interest. Because Northern blots distinguish
RNA by size, sample integrity influences the degree to which a signal is localized in a
single band (Lee and Costlow, 1987). In Northern blot analysis, DNA, RNA, and
oligonucleotide probes can be used, and these probes can be radiolabeled or non-
radioactively labeled. The size of the target RNA, not the probe, will determine the size
of the detected band; thus, methods that generate probes of variable lengths, such as
random-primer labeling, are suitable for probe synthesis.
In the past, small RNAs were missed in traditional agarose gels because either the
gels were run for too long—causing the small RNAs to dissipate the agarose gel, and also
this matrix does not support small RNA molecules (pore size is large in relation to
14
acrylamide gels). This problem was solved by running small RNAs in acrylamide gels
which are in high-resolution in contrast to the agarose gels. The paper by Hamilton and
Baulcombe was the first one to show the presence of the 25 nt small RNA molecules
(Hamilton, 1999).
2.2 Methods
2.2.1 Plant Materials and Genetic Nomenclature
All isolines of Glycine max (L.) Merr. used for this study are indicated in
Table 1.1. Seeds were obtained from the United States Department of Agriculture
Soybean Germplasm Collections (Department of Crop Sciences, USDA/ARS University
of Illinois, Urbana) which totals over 18,000 plant introductions. All lines are
homozygous for the loci indicated in Table 1.1. Plants were grown in the greenhouse and
tissue was harvested. For the cultivar Williams 43, shoot tips, unifoliates, germinated
cotyledons, stems, and roots were harvested from nine day old plants and frozen in liquid
nitrogen for 10 minutes and stored at -80°C until they were lyophilized. For seed coats
and immature cotyledons, pods of mature plants (Williams 44, Williams 54, Williams 55,
Richland, and T157) were harvested; seeds were then extracted from the pods and
selected by the category of fresh weight (100-200 mg) of the entire seed. Seed coats and
immature cotyledons were then dissected from the seeds and frozen in liquid nitrogen for
ten minutes. Subsequently, soybean tissues were lyophilized (Multi-dry lyophilizer, FTS
Systems, NY) and stored at -20°C until further use.
For this project, different homozygous Glycine max cultivars were used to extract
nucleic acids. Refer to Figure 1.1 and Table 1.1 for more information on the genotypes
and phenotypes used in this study. Williams 43 has the phenotype of yellow seed coat (ii)
and Williams 44 is a black seed coat (i) mutation. Williams 54 is yellow seed coat (ii) and
Williams 55 is an independent mutant line with black seed coat (i). Richland is yellow
seed coat (I) and T157 is an imperfect black seed coat (i) mutant line. Table 2.1
represents the eight different nucleic acid extraction methods used for this study and the
total number of extractions for each method. The complete protocols are found in
Appendix B through Appendix I. I used these methods to determine the most robust
15
method to use for the small RNA blotting and at the end we found that Method T was the
best suited for our small RNA blotting procedures.
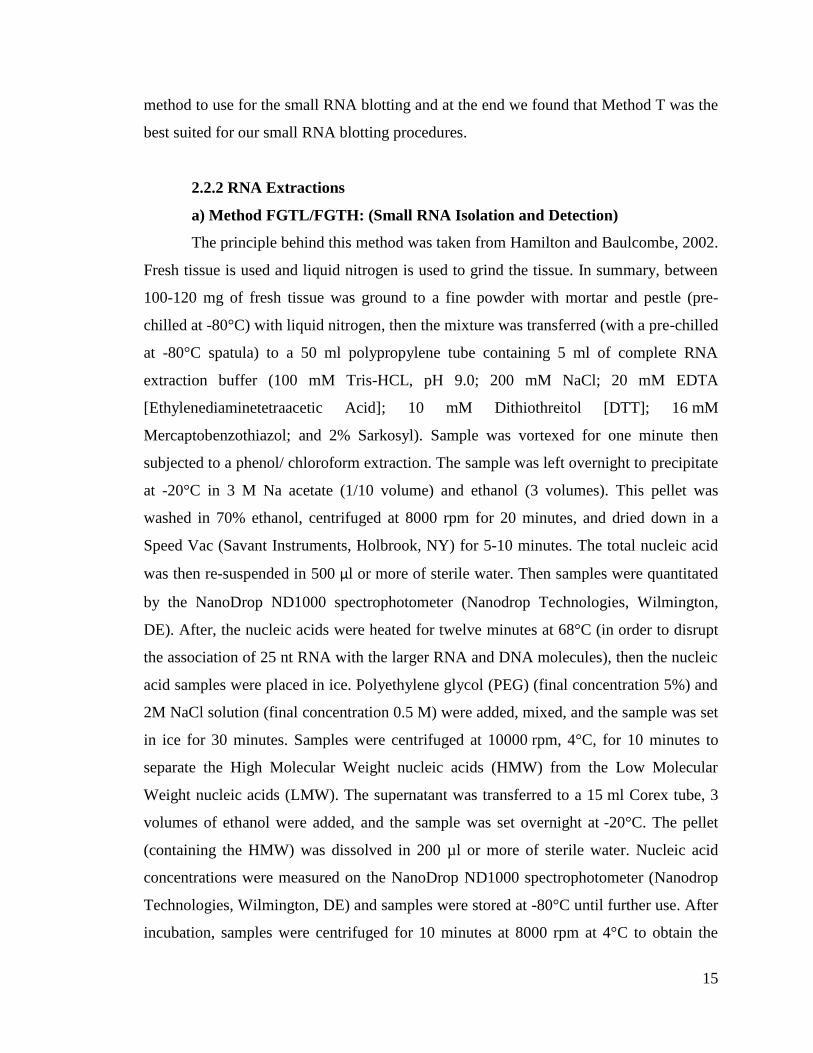
2.2.2 RNA Extractions
a) Method FGTL/FGTH: (Small RNA Isolation and Detection)
The principle behind this method was taken from Hamilton and Baulcombe, 2002.
Fresh tissue is used and liquid nitrogen is used to grind the tissue. In summary, between
100-120 mg of fresh tissue was ground to a fine powder with mortar and pestle (pre-
chilled at -80°C) with liquid nitrogen, then the mixture was transferred (with a pre-chilled
at -80°C spatula) to a 50 ml polypropylene tube containing 5 ml of complete RNA
extraction buffer (100 mM Tris-HCL, pH 9.0; 200 mM NaCl; 20 mM EDTA
[Ethylenediaminetetraacetic Acid]; 10 mM Dithiothreitol [DTT]; 16 mM
Mercaptobenzothiazol; and 2% Sarkosyl). Sample was vortexed for one minute then
subjected to a phenol/ chloroform extraction. The sample was left overnight to precipitate
at -20°C in 3 M Na acetate (1/10 volume) and ethanol (3 volumes). This pellet was
washed in 70% ethanol, centrifuged at 8000 rpm for 20 minutes, and dried down in a
Speed Vac (Savant Instruments, Holbrook, NY) for 5-10 minutes. The total nucleic acid
was then re-suspended in 500 µl or more of sterile water. Then samples were quantitated
by the NanoDrop ND1000 spectrophotometer (Nanodrop Technologies, Wilmington,
DE). After, the nucleic acids were heated for twelve minutes at 68°C (in order to disrupt
the association of 25 nt RNA with the larger RNA and DNA molecules), then the nucleic
acid samples were placed in ice. Polyethylene glycol (PEG) (final concentration 5%) and
2M NaCl solution (final concentration 0.5 M) were added, mixed, and the sample was set
in ice for 30 minutes. Samples were centrifuged at 10000 rpm, 4°C, for 10 minutes to
separate the High Molecular Weight nucleic acids (HMW) from the Low Molecular
Weight nucleic acids (LMW). The supernatant was transferred to a 15 ml Corex tube, 3
volumes of ethanol were added, and the sample was set overnight at -20°C. The pellet
(containing the HMW) was dissolved in 200 µl or more of sterile water. Nucleic acid
concentrations were measured on the NanoDrop ND1000 spectrophotometer (Nanodrop
Technologies, Wilmington, DE) and samples were stored at -80°C until further use. After
incubation, samples were centrifuged for 10 minutes at 8000 rpm at 4°C to obtain the
16
pellet with the LMW. The supernatant was decanted and the pellet was dried and re-
suspended in 200 µl or more of sterile water. Nucleic acid concentrations were measured
on the NanoDrop ND1000 spectrophotometer (Nanodrop Technologies, Wilmington,
DE) and samples were stored at -80°C until further use. Please note that the full protocol
is located in Appendix B.
b) Method GTL/GTH: (Total Nucleic Acid Extraction Protocol: Using PEG)
This method is identical to Method FGTL/FGTH as described above, except it has
been modified to use lyophilized tissue instead of fresh. GTL represents the Low
Molecular Weight nucleic acids and GTH denotes High Molecular Weight nucleic acids.
Please note that the full protocol is located in Appendix C.
c) Method R: (RNA Extraction Standard Protocol)
Total RNA was extracted from freeze dried tissue using the Vodkin laboratory
phenol/ chloroform and lithium chloride precipitation protocol based on the procedure
from McCarty, 1986, Ausubel, et al., 1987, and also Wang et al., 1994. In summary,
between 100-120 mg of lyophilized tissue was ground to a fine powder with a mortar and
pestle with sterilized sand, then 9 ml of complete RNA extraction buffer (100 mM Tris-
HCL, pH 9.0; 200 mM NaCl; 20 mM EDTA; 10 mM Dithiothreitol [DTT]; 16 mM
Mercaptobenzothiazol; and 2% Sarkosyl) was added and the ground tissue was subjected
to a phenol/chloroform extraction. This sample was left overnight at 4°C in 2 M LiCl to
selectively precipitate RNA. The supernatant was centrifuged and re-suspended in
nuclease-free water (Promega Madison, WI). Next, 3 M Na acetate (1/10 volume) and
ethanol (2 volumes) was added and the solution was incubated at -80°C for at least 30
minutes. This pellet was washed in 80% ethanol, centrifuged, and dried down in a Speed
Vac (Savant Instruments, Holbrook, NY) for 5-10 minutes. The RNA was then re-
suspended in 200 µl or more of nuclease-free water (Promega, Madison, WI). RNA
samples were quantitated by the NanoDrop ND1000 spectrophotometer (Nanodrop
Technologies, Wilmington, DE) and the integrity confirmed using agarose gel
electrophoresis (Sambrook et al., 1989). RNA was stored at -80°C until further use.
Please note that the full protocol is located in Appendix D.
17
d) Method T: (Standard RNA Extraction without Lithium Chloride for
Small RNA Blots)
This method is identical to Method R (RNA Extraction Standard Protocol) as
described above, except it has been modified to leave out lithium chloride. After the
phenol/ chloroform extraction, the supernatant is centrifuged and re-suspended in 500 µl
or more of sterile water and the protocol proceeds as above. Please note that the full
protocol is located in Appendix E.
e) Method TP: (Purification of Standard RNA Extraction without Lithium
Chloride for Small RNA Blots)
The QIAGEN RNeasy Mini Kit (QIAGEN, Valencia, CA) was used according to
the company’s instructions to remove DNA from total nucleic acid samples after
performing the RNA extraction with Method T as described above. Please note that the
full protocol is located in Appendix F.
f) Method V: (Modified RNA Extraction Method with PVPP and Lithium
Chloride)
Proanthocyanidins are present in the black seed coats of the soybean varieties of
Williams 44 and Williams 55 with i, R, T genotype. The modified RNA extraction
protocol was designed specifically to overcome the issues of proanthocyanidins binding
to the RNA (Wang and Vodkin 1994). Seed coats from the 100-200 mg weight range
were used. The seed coats were ground to a powder using a mortar, pestle, and
autoclaved sand. 0.75 g of hydrated Polyvinylpolypyrrolidone (PVPP) (Sigma, St. Louis,
MO) and 1ml of Proanthocyanidin Binding Solution (Complete Extraction Buffer [100
mM Tris-HCL, pH 9.0; 200 mM NaCl; 20 mM EDTA; 10 mM Dithiothreitol (DTT); 16
mM Mercaptobenzothiazol; and 2% Sarkosyl], 10 mg/ml Heparin; 2 mg/ml Polyproline;
and 5% Bovine Serum Albumin [BSA]) were ground with the tissue for 1 minute, then 4
ml of the Complete Extraction Buffer (100 mM Tris-HCL, pH 9.0; 200 mM NaCl; 20
mM EDTA; 10 mM DTT; 16 mM Mercaptobenzothiazol; and 2% Sarkosyl) was added
and the sample was ground for 1 minute. The samples were then transferred to a 50 ml
polypropylene tube where 100 µl of 10 mg/ml Proteinase K (Invitrogen, Carlsbad, CA)
18
was added. The tubes were incubated at 37°C with gentle shaking (80 rpm) for
20 minutes. After the incubation, the tubes were centrifuged for 10 minutes at 5000 rpm
at 4°C. The supernatant was withdrawn using a glass pipette and transferred to a 15 ml
polypropylene tube containing 4 ml of saturated phenol. The tubes were vortexed for 2
minutes and then centrifuged for 5 minutes at 5000 rpm at 4°C. After centrifugation, the
upper aqueous layer and the white interface were withdrawn using a glass pipette and
transferred to another 15 ml polypropylene tube containing 4 ml of phenol. The tubes
were then vortexed and centrifuged as before. The upper aqueous layer was again
withdrawn using a glass pipette and transferred to a 15 ml polypropylene tube containing
4 ml of Sevag (chloroform:isoamyl alcohol [24:1]). The tubes were vortexed and
centrifuged as before. Then, the upper aqueous layer was withdrawn, measured, and
transferred to an autoclaved 15 ml Corex tube. An amount of 8 M LiCl equal to one-third
of the sample volume was added to each sample (final concentration 2M LiCl) to
precipitate the RNA, leaving the DNA in solution. The samples were left at 4°C
overnight. From this point, this modified protocol continues as the standard (Method R)
RNA extraction protocol, stated previously. Please note that the full protocol is located in
Appendix G.
g) Method VT: (Modified RNA Extraction Method with no Lithium
Chloride)
This method is identical to Method V (Modified RNA Extraction Method with
PVPP and Lithium Chloride) as described above, except it has been modified to leave out
lithium chloride. After the phenol/ chloroform extraction, the supernatant is centrifuged
and re-suspended in 500 µl or more of sterile water and the protocol continues as
previously described. Please note that the full protocol is located in Appendix H.
h) Method VTP: (Purified Modified RNA Extraction Method with no
Lithium Chloride)
The QIAGEN RNeasy Mini Kit (QIAGEN, Valencia, CA) was used according to
the company’s instructions to remove DNA from total nucleic acid samples after
performing the Method VT (Modified RNA Extraction Method with no Lithium
19
Chloride) as described above. Please note that the full protocol is located in Appendix I.
A complete list of the buffers used for these RNA extraction methods are found in
Appendix J.
2.2.3 Small RNA Blot Analysis
For small RNA blot analysis, about 40 µg of total RNA was electrophoresed with
the XCell SureLock Mini Cell device (Invitrogen, Carlsbad, CA) through 15% TBE-Urea
polyacrylamide precast gel cassettes (Invitrogen, Carlsbad, CA). The RNA gels were then
blotted onto supported Hybond N or Hybond NX membranes (Amersham-GE
Healthcare, Buckinghamshire, UK) via capillary action with the Mini-Protean II device
(Bio-Rad, Richmond, CA) for 1 hour. The RNA was cross-linked to the Hybond
membranes with UV radiation by a UV-Crosslinker (Stratagene Agilent Technologies,
Santa Clara, CA). Membranes were stored dry or used right away. Pre-hybridization was
conducted in a standard Northern pre-hybridization solution containing 6X SSC (Saline
Sodium Citrate), 5X Denhart (1% Ficol Type 400, 1% PVP-360, 1% BSA, 100 ml H2O),
0.5% SDS (Sodium Dodecyl Sulfate), and 100 µg/mL denatured calf thymus DNA at
40°C for two hours or longer. 5x10⁷
cpm/µg radioactively labeled DNA probe (20-100
ng) was added to the pre-hybridization mixture of each blot and later hybridized at 40°C
overnight. Blots were washed for 15 minutes at 40°C with Wash Buffer Solution (2X
SSC, 0.2% SDS). Exposures were made at -80°C on Hyper-Film X-Ray film
(Amersham-GE Healthcare, Buckinghamshire, UK) with an intensifying screen (DuPont,
Wilmington, DE). Please refer to the full protocol located in Appendix K.
a) Probe Preparation for Small RNA Blot Analysis
DNA probes used for this study were prepared by three different methods: 5’end
labeling γ-radiolabeled oligo, radioactive labeling of DNA by random primer reaction
and hydrolysis of in vitro transcribed probe. Each method was followed by clean up with
the BioSpin 6 chromatography column (Bio-Rad, Richmond, CA); we followed the
manufacturer’s instructions. We used primarily Method 1 (5’ end labeling γ-radiolabeled
oligo). We also tried Method 2 (radioactive labeling of DNA by random primer reaction)
and Method 3 (hydrolysis of in vitro transcribed probe) a couple of times.
20
1. 5’ end Labeling γ-radiolabeled Oligo:
The oligonucleotide abun_miRNA_RC_2 was synthesized at the Keck
Center, University of Illinois Biotechnology Center; the rest of the oligos were
synthesized by IDT (Integrated DNA Technologies, Coralville, IA). Refer to Table 2.2
for more oligo information. Oligos were γ-radiolabeled using the DNA 5’ End Labeling
System (Promega, Madison, WI). About 70 ng of each DNA substrate was labeled with
[γ-32
P] ATP using T4 Polynucleotide kinase at 37°C for 10 minutes. The reaction was
stopped by heat inactivating the kinase at 68°C for 10 minutes. The unincorporated
nucleotides were removed using BioSpin 6 chromatography columns (Bio-Rad,
Richmond, CA). Please note that the full protocol is located in Appendix L.
2. Radioactive Labeling of DNA by Random Primer Reaction:
Cloned DNA (CHS7) used as a probe was grown in YT media plus
ampicillin followed by QIAPrep Miniprep kit (QIAGEN, Valencia, CA), a 1:10 dilution,
and a PCR reaction. Once the PCR reaction was finished, the substrate was purified by a
QIAGEN PCR purification kit (QIAGEN, Valencia, CA). About 200-250 ng of purified
DNA was labeled with [α-32
P] dATP by the random primer reaction method (Feinberg
and Vogelstein, 1983). Following labeling, unincorporated nucleotides were removed
using a BioSpin 6 chromatography column (Bio-Rad, Richmond, CA). Please note that
the full protocol is located in Appendix M.
3. Hydrolysis of In Vitro Transcribed Probe:
In order to perform the in vitro transcription of linearized plasmid DNA,
2 µl of DNA template (0.3 µg/µl – 0.5 µg/µl) was mixed with 5 µl of water, 2 µl
Transcription Buffer, 1 µl ATP (10 mM), 1 µl CTP (10 mM), 1 µl GTP (10 mM), 1 µl
UTP (100 µM), 5 µl Labeled UTP, and 2 µl T7 polymerase to a total final volume of 20
µl. The components were incubated at 37°C for 1 hour followed by the addition of 1 µl
DNase and incubation at 37°C for 15 minutes. Once the incubation period was finished,
1 µl of 0.5M EDTA and 80 µl of water were added. BioSpin 6 chromatography columns
(Bio-Rad, Richmond, CA) were utilized to clean up the reaction. Following the clean up,
300 µl of carbonate buffer ingredients were added to the components and incubated at
21
60°C for 2 to 3 hours. Finally, after the incubation step 20 µl of 3M NaOAc (pH 5.0) was
added. Please note that the full protocol is located in Appendix N.
b) Pre-hybridization Step
For this study we tested three different pre-hybridization buffers. Hybaid bottles
(containing blots and pre-hybridization solution) were placed in the rotary oven (Thermo
Fisher Scientific, Waltham, MA) set at 40°C for about 2 hours.
1. Northern Pre-hybridization Solution:
We used the standard pre-hybridization buffer solution used for a Northern
blot (100 µg/ml calf thymus DNA, 6X SSC, 10 mM EDTA, 0.5% SDS, 5X Denhardts
solution) with our blots and we pre-hybridized for about 2 hours (see Appendix O for
complete protocol). This became our regular pre-hybridization solution.
2. Baulcombe Pre-hybridization Solution:
This solution contains 100 µg/ml calf thymus DNA, 2X SSC, 0.3 M NaCl,
7% SDS, 5X Denhardts solution, and 50% Formamide. It was used to pre-hybridize with
our blots for about 2 hours (see Appendix P for complete protocol).
3. Phosphate Pre-hybridization Solution:
This solution contains 100 µg/ml calf thymus DNA, 50 mM
[Na2HPO4•7H2O / NaH2PO4], 0.3 M NaCl, 7% SDS, 5X Denhardts solution, and 50%
Formamide. It also was used to pre-hybridize with our blots for about 2 hours (see
Appendix Q for complete protocol).
c) Hybridization Step
After the pre-hybridization step is the hybridization of the nucleic acid with the
labeled probe of choice. The probe addition is a critical step in this procedure. We
denature the labeled probe at 68°C for 10 minutes, then briefly centrifuge and cool at
room temperature for 5 minutes before adding it to the hybridization solution containing
the blot (complete protocol in Appendix K). It is important to avoid placing the probe
22
directly on the blots, as this will cause excessive background. We use Hybaid
hybridization bottles (Thermo Fisher Scientific, Waltham, MA). The probe may be added
to the hybridization solution while the bottle is in a vertical position. Then Hybaid bottles
were placed in the rotary oven set at 40°C for overnight incubation. Hybaid bottles are a
major advantage to this approach because it allows the usage of low volumes of
hybridization buffer (in our case 12 ml) and therefore minimal probe volumes (around
100 µl). This is achieved because fluid is able to move continually over the membrane. It
is important also to avoid bubbles-air bubbles block the transfer of nucleic acid to the
membrane. Also, the same consideration should be taken during the pre-hybridization
step as well. We use a glass rod to smooth out bubbles from the membranes.
d) Wash and Exposure
Blots were washed for 15 minutes at 40°C with Wash Buffer Solution (2X SSC,
0.2% SDS); refer to Appendix K for complete protocol. The final step in the small RNA
blotting procedure is detecting the hybridization signal. We used Hyper-Film
(Amersham-GE Healthcare, Buckinghamshire, UK) and we do one overnight exposure
with a screen; depending on the result we removed the screen and exposed for additional
time. We placed our cassettes in the -80°C before exposure. More details about this
procedure can be seen in Appendix K.
2.2.4 High-Throughput Sequencing Data
For this project we used data from high-throughput RNA sequencing using
Illumina Sequence-by-Synthesis Technology as described in Tuteja et al., 2009. Briefly,
2.5 to 5 µg of the purified low molecular weight RNA fraction of each sample was
provided to Illumina, which subsequent to quality checks, was separated on 15%
polyacrylamide gels containing 7M urea in TBE buffer (45 mM Tris-borate, pH 8.0; and
1.0 mM EDTA). A gel slice containing RNAs of 15 to 35 nucleotides was excised and
eluted. Gel-purified small RNAs were ligated to the 3’ adapter (5’-
TCGTATGCCGTCTTCTGCTTG-3’), and the small RNA libraries were sequenced
using the Illumina Genetic Analyzer. Sequence information was extracted from the image
files with the Illumina Firecrest and Bustard applications. 3 million to 12 million reads
23
per small RNA population from each tissue were generated; there were a total of fourteen
libraries sequenced. For this project, we mainly focused on seven libraries: Williams 43
seed coat, Williams 55 seed coat, Richland seed coat, Williams 43 immature cotyledon,
Williams 43 germinated cotyledon, and Williams 43 stem.
In collaboration with the laboratory of Dr. Matt Hudson at the University of
Illinois, the raw sequence reads were processed computationally to remove adapter
sequences. From this pool of processed sequences, unique signatures representing at least
five reads within each library were identified and selected for further analyses.
Normalization of the total counts of individual signatures was made based on three
million raw reads.
BLASTn searches to the Sanger miRNA miRBase database
(http://microrna.sanger.ac.uk/) found relatively few of these sequences with matches to
currently known and curated miRNAs, indicating that many represent siRNAs or
previously unknown miRNAs. For this master’s project we focus on some CHS siRNAs
found in different tissues and genotypes that are active physiologically to effect a change
in the plant pigment phenotype (Tuteja et al., 2009); some known miRNAs; and some
unknown small RNAs. The sequence data was used to design the oligos for blots
(Table 2.2).
2.3 Results and Discussion
2.3.1 Small RNA Extraction
One of my main goals for my master’s project was to optimize a protocol for
small RNA extraction that would be efficient, cost effective, and easy to perform.
Eventually this small RNA extraction method was used for the blotting procedure. In our
laboratory we began with a modified version (Tuteja et al., 2004, Tuteja et al., 2009) of
the widely used procedure developed by Hamilton et al., 2002 that uses polyethylene
glycol (PEG) to preserve and enrich for small RNAs. Here this method is designated
FGTH and FGTL. Method FGTH denotes the high molecular weight fraction precipitated
from PEG and FGTL is the low molecular weight fraction. Small RNAs are found in the
low molecular weight fraction (FGTL). This is the only method that used fresh tissue
instead of lyophilized; it required liquid nitrogen to grind tissues. I did a total of
24
four extractions. Table 2.3 shows samples extracted with Method FGTH with total
nucleic acid concentrations from 0.64 µg/µl to 2.88 µg/µl. Table 2.3 also shows samples
extracted with Method FGTL with total nucleic acid concentrations from 0.39 µg/µl to
1.51 µg/µl. We tested two samples extracted with Method FGTL (because of the low
molecular weight nucleic acids) and we obtained a signal in one of the two blots. While I
made a few extractions with this procedure, my goal was to simplify it and make it more
like our standard method to extract mRNA. The Baulcombe method works well but it is
complicated to perform and cumbersome. We still needed to devise a method to extract
these low molecular weight nucleic acids that would not be as rigorous to perform in our
laboratory.
Next we wanted to determine if we could use lyophilized tissue instead of fresh
tissue. We tested a method with freeze dried tissue and PEG precipitation, denoted as
Method GTH and GTL. This method is almost identical to FGTH and FGTL but fresh
tissue is not used, avoiding the usage of liquid nitrogen to grind tissues. We found that
lyophilized tissue works as well as fresh. I did a total of six extractions. Table 2.4 shows
samples extracted with Method GTH with total nucleic acid concentrations from
0.25 µg/µl to 0.98 µg/µl and samples extracted with Method GTL with total nucleic acids
concentrations from 0.32 µg/µl to 2.99 µg/µl.
Next, we followed with Method R, which is our standard total RNA extraction
method developed at the Vodkin laboratory. Method R is an organic extraction procedure
(phenol:chloroform) which contains lithium chloride and 3M sodium acetate. Lyophilized
tissue is used instead of fresh. I performed twenty-four extractions with this method (refer
to Table 2.5 for more details about the results from this procedure). Although various
literature sources suggested that LiCl does not precipitate RNA fragments less than 200
nucleotides in size (Wallace, 1987), which includes the category of small RNAs, we
found that in one of our blots small RNAs were detected (as shown in Figure 2.1). We
obtained one signal in one blot out of three for Williams 43 (yellow seed coat variety)
with probe abun_miRNA_RC2. Regardless of this result we decided to follow these
published reports and avoided LiCl. We modified the Method R to leave out LiCl; this
new protocol was coined Method T (which stands for total nucleic acids—RNA plus
DNA). In the end, we wanted to modify the Method R protocol as minimally as possible.
25
Table 2.6 summarizes the details of both methods. In the experiments with Method R,
nucleic acid concentrations ranged from 0.73 µg/µl to 27.3 µg/µl; refer to Table 2.5.
Method V is our standard RNA extraction method with black seed coats and it
contains lithium chloride (LiCl), polyvinylpolypyrrolidone (PVPP), proanthocyanidin
solution, and proteinase K. Lyophilized tissue is used instead of fresh. This protocol was
specifically designed for the soybean varieties with black seed coat (i) such as
Williams 44, Williams 55, and T157, which produce procyanidins (tannins) which
interfere with the nucleic acid purification; thus, it is necessary to bind these compounds.
Our laboratory devised a protocol to overcome this issue (Wang and Vodkin, 1994). The
compound PVPP absorbs polyphenols from these plant tissues. The proanthocyanidin
binding solution contains heparin, polyproline, and bovine serum album (BSA); heparin
is an RNase inhibitor, and polyproline and BSA bind to proanthocyanidins. Proteinase K
removes traces of the BSA protein. A total of twelve extractions were done with this
method for RNA extraction. Table 2.7 shows samples extracted with this method with
total nucleic acid concentrations from 0.07 µg/µl to 4.42 µg/µl.
Method T does not contain LiCl and it precipitates total nucleic acids and small
RNAs. I performed a total of 108 extractions using this protocol and we obtained signals
in the majority of our small RNA blots. Lyophilized or fresh tissue can be used and no
further purification by RNeasy Mini Kit (QIAGEN, Valencia, CA) was necessary.
Figure 2.2 defines a pivotal result that led us to discover that Method T was best suited to
use for the extraction of small RNAs for our blotting procedure. In this figure we see that
a sample extracted using Method T is the only sample that gives a clear signal, in contrast
to the other three methods used to extract samples. In the experiments with Method T,
lyophilized tissue as old as seven years (stored at -20°C) was used and it resulted in good
yields. Table 2.8 shows samples extracted with Method T with nucleic acid
concentrations ranging from 0.2 µg/µl to 3.9 µg/µl.
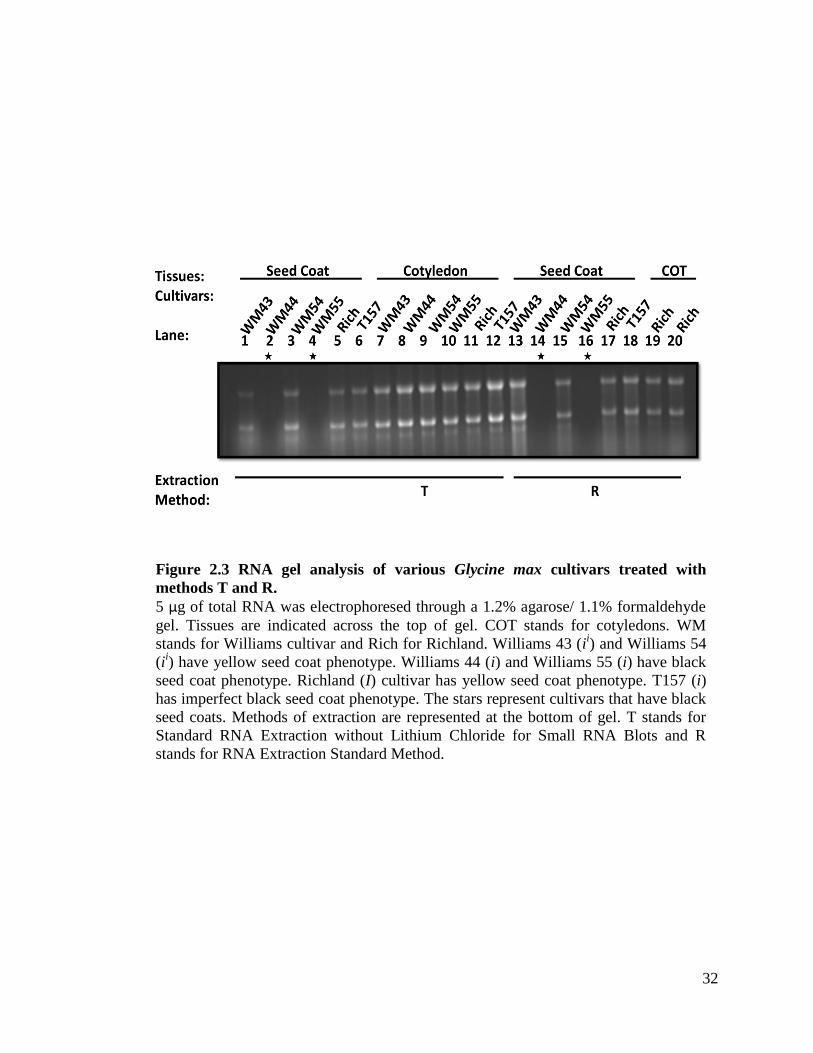
It is important to note that RNA extracted from Williams 55 black seed coats with
Method T does not show in an agarose gel picture. This can be seen in Figures 2.3, 2.4,
and 2.5. In Figure 2.3 note lanes 4 and 16 with a star on the top; also, the Williams 44
seed coat does not show expression because it is phenotypically identical to Williams 55
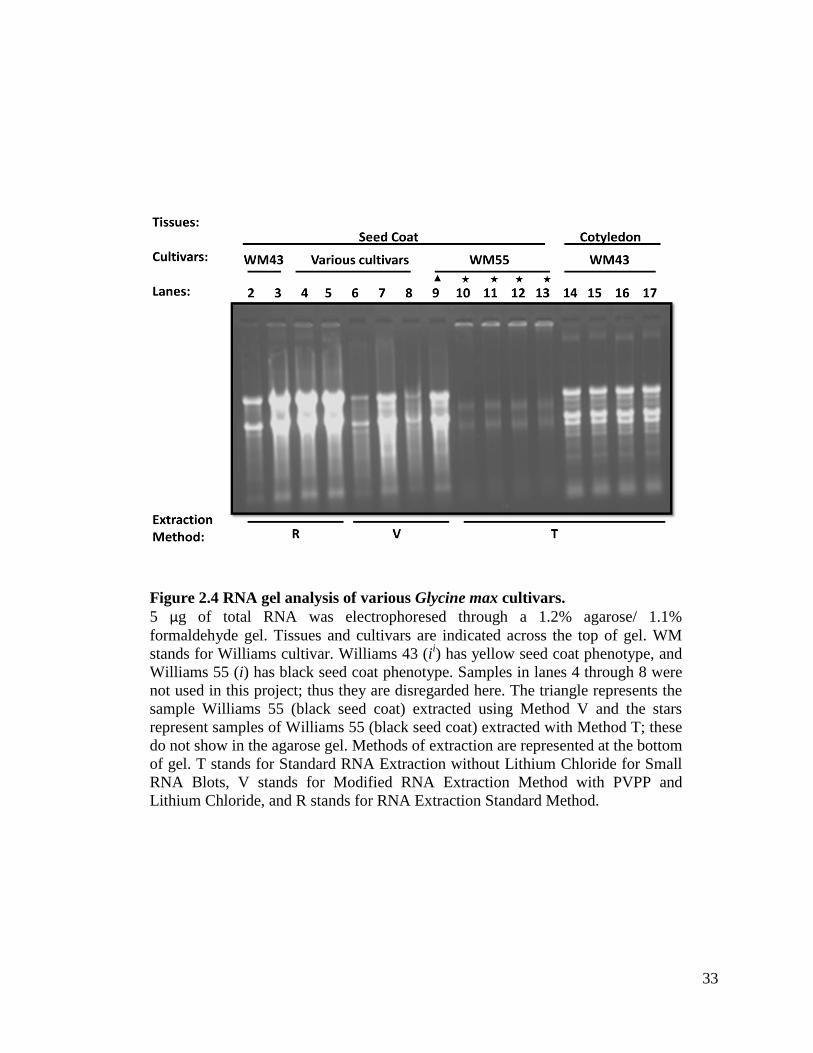
(lanes 2 and 14). Figure 2.4 shows Williams 55 seed coats in lanes 10 through 13
26
(denoted with a star) extracted with Method T; these do not show in an agarose gel
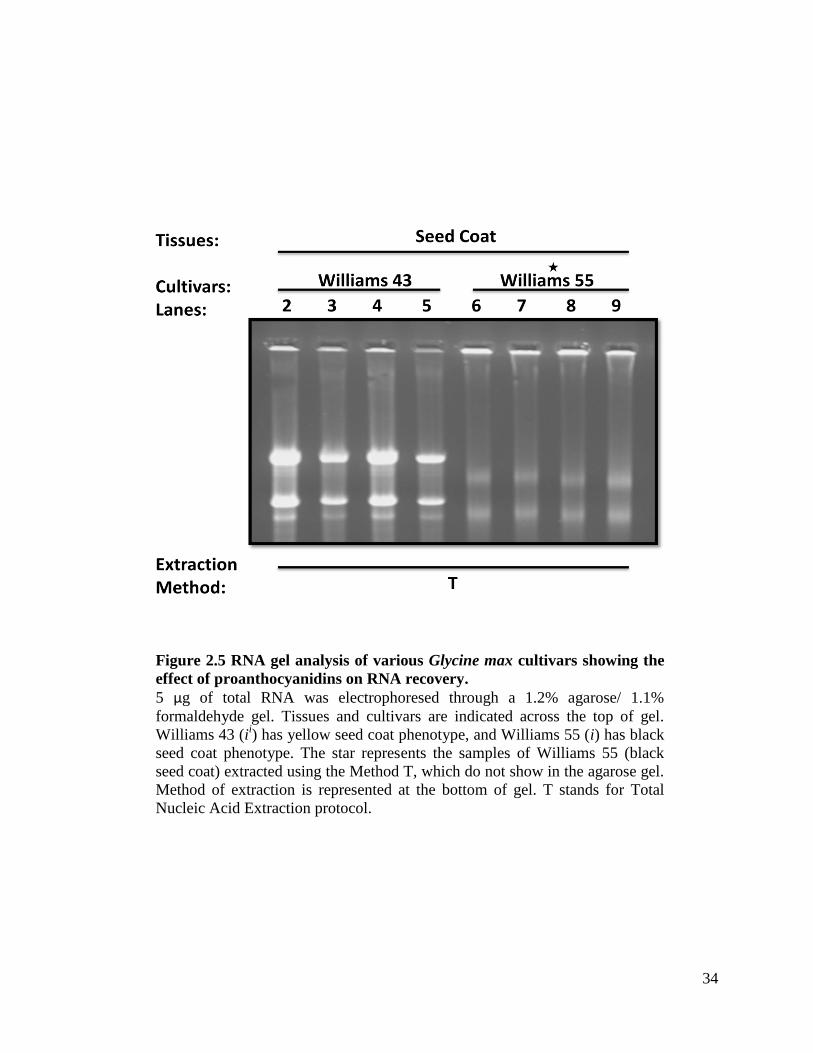
picture. Figure 2.5 also shows Williams 55 seed coats in lanes 6 through 9 (denoted with
a star) extracted with Method T that does not show in an agarose gel picture. Surprisingly
even though Method T is not effective in isolating mRNA from black seed coats (i) such
as Williams 55 (because this method does not use PVPP, proteinase K, and
proanthocyanidin binding solution), it is effective in extracting small RNAs for the small
RNA blotting procedure. These tissues show in our small RNA blots. Please refer to
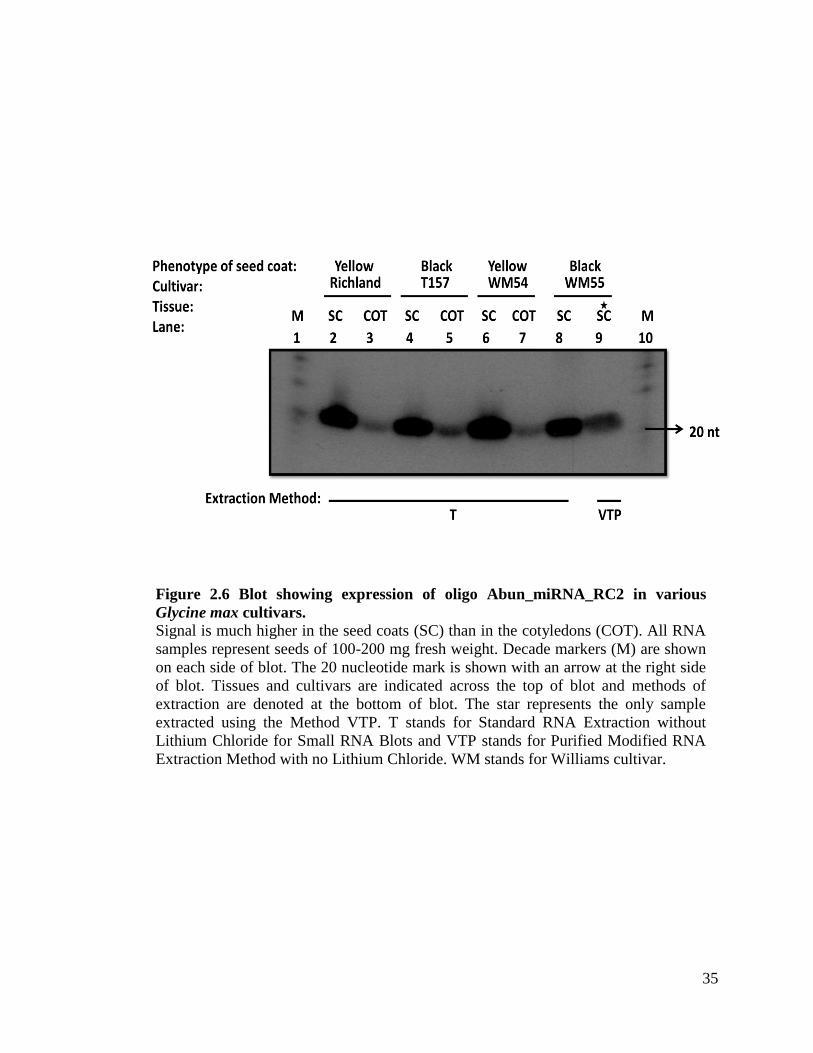
Figure 2.6 and Figure 2.7 for more details. Since Method T is effective in extracting
small RNAs from the black seed coat varieties, it is not necessary to use Methods VT or
VTP (refer to Figure 2.6). Table 2.9 depicts the various chemicals utilized for each
extraction procedure. Note that Method T contains the least chemicals and it is effective
in extracting small RNAs.
Method VT is a modified version of Method V and it does not contain LiCl;
everything else remains the same in the procedure. Lyophilized tissue is used instead of
fresh. I performed four extractions with this method. Table 2.10 shows samples extracted
with this method with total nucleic acid concentrations from 0.70 µg/µl to 1.21 µg/µl. I
tested all four samples in our small RNA blots and this method did not give us any signal.
Interestingly, in our blots we saw that there was a distortion in the gel caused by this
method. We speculate that this is caused by the addition of PVPP (Figure 2.2 depicts this
phenomenon). In the blot shown, lanes four through seven contain samples extracted
using this method and we see a curvature in the top of gel. We do not need to use Method
VT because Method T worked fine with varieties with black seed coats.
Method TP is a version of Method T in which the RNA is further purified using
QIAGEN columns. I purified twelve samples from Method T. Table 2.11 shows samples
extracted with this method with total nucleic acid concentrations from 0.17 µg/µl to
3.35 µg/µl. We obtained signal in our small RNA blots with this method, but since
Method T worked very well and it eliminated the expense and time consumption of using
the purification kit by QIAGEN, we did not continue to use Method TP for our small
RNA blots. Figure 2.7 exemplifies that samples extracted with Method T work just as
well as a sample extracted with Method TP.
27
Method VTP is a version of Method VT in which the RNA is further purified
using QIAGEN columns. I did two purifications for each sample with this procedure.
Table 2.12 shows samples extracted with this method with total nucleic acid
concentrations from 0.33 µg/µl to 0.87 µg/µl. This method only gave us signal in one blot
out of four probed with abun_miRNA_RC2. Figure 2.6 clearly illustrates the advantages
of Method T against Method VTP. In this figure we see the results of a blot of samples
extracted using Method T versus Method VTP. There were a total of seven samples done
with Method T and one sample done with Method VTP. Method T works for black seed
coats and no purification is necessary; thus there is no need for Method VTP.
In summary, Method T is very advantageous overall because it does not require
the usage of the following chemicals: liquid nitrogen to grind tissues (as in Method
FGTH and FGTL); PEG (as in Methods GTH, GTL, FGTH, and FGTL);
proanthocyanidin binding solution, PVPP, and proteinase K (as in Methods V, VT, and
VTP). Further purification is not required and there is no need to use fresh tissue. Method
T is also useful in extracting small RNAs from the black seed coat soybean varieties even
though it is not effective for extracting high molecular weight mRNAs from the black
seed coats.
2.3.2 Small RNA Blotting and Probing Methods
Once my goal was met to optimize a successful method to extract small RNAs
(Method T), this method was utilized for our small RNA blotting procedure. The small
RNA blotting procedure entails size-fractioning small RNAs using denaturing pre-cast
polyacrylamide gels which contain the denaturant urea, instead of agarose gels. The
polyacrylamide gels retain small RNAs which would run off the agarose gels. The
electrophoresis transfer is done in one hour, as opposed to the eight to twelve hours
needed for capillary transfer in a traditional Northern. This is followed by blotting the
small RNAs to a membrane.
We used Hybond N and Hybond NX (neutral nylon) membranes from Amersham.
Hybond NX was developed to give a clearer background than Hybond N. In our
experiments we started using Hybond NX and it gave us good results. However, during
the middle of our project, we encountered a bad lot of these membranes and we switched
28
to Hybond N (refer to Figure 2.8 for more details). Overall Hybond N gave us positive
results. Another test we performed was to utilize a nitrocellulose membrane (as with a
Northern procedure) instead of the Hybond membranes. There was no hybridization of
small RNAs to the nitrocellulose membrane; thus a nitrocellulose membrane is not
effective in this procedure. Nucleic acids were fixed to the membrane by UV crosslinking
(Stratagene) and stored dry or used right away. In our experiments we tested storing the
membranes dry prior to the hybridization step and we obtained good signals even after
165 days of storage (refer to Table 2.13 for more information).
The next step is probe labeling, followed by clean up of the unincorporated
nucleotides using a BioSpin 6 chromatography column (Bio-Rad, Richmond, CA). We
tested omitting this step of clean up with the chromatography column and we obtained a
black background (figure not shown); thus we concluded that this is an essential step in
the blotting analysis. We performed a total of three labeling procedures and our standard
was 5’end labeling γ-radiolabeled oligo (Method 1). Method 2 (radioactive labeling of
DNA by random primer reaction) is a standard procedure in a Northern blot analysis; we
tried this method with our small RNA blot analysis and it resulted in black background
(figure not shown). Thus, we only tested this method once (Table 2.14 contains more
information about this procedure). Method 3 (hydrolysis of in vitro transcribed probe) is a
reliable procedure; however, it is cumbersome to perform because the hydrolysis step is
lengthy and susceptible to variation. This method also gives a lot of top background in a
small RNA blot (Figure 2.9), and this background could potentially interfere with the
results of the blots. Method 1 (5’ end labeling γ-radiolabeled oligo) is our method of
choice for this project. It is shorter than the other methods, and it was very dependable.
We obtained positive results in all seventy-five small RNA blots (refer to Table 2.14 for
additional information). Also this method does not give us top background in a small
RNA blot as does Method 3. Method 1 is useful if the sequence of the oligo is known;
however if this is not the case then Method 3 should be used instead.
The step in the blotting procedure after fixing nucleic acid to the membrane is
pre-hybridization. In our lab we used the standard pre-hybridization solution used for a
Northern. We also tested two different pre-hybridization buffers (refer to Table 2.15 for
more information). The first pre-hybridization solution was a pre-hybridization buffer
29
(Baulcombe-type) specific for nylon membranes; it was used in five blots with positive
results in all. The second solution was a phosphate pre-hybridization solution for small
RNA blots; it was used two times with positive results. Even though both pre-
hybridization buffers worked well, they do take a lot of time to make and our goal was to
make our blotting procedure as close to the Northern blotting procedure as possible.
Thus, we tested the standard Northern pre-hybridization buffer and this worked very well
for our small RNA blots. After the hybridization step the blots were washed for 15
minutes at 40°C and exposed overnight with an enhancer screen.
In summary, I developed a robust protocol for small RNA extraction and blotting.
Freeze dried tissue could be used instead of fresh tissue and the small RNA extraction
methods was only minimally different from the method for standard mRNA extraction in
that LiCl precipitation was omitted. Procedures for separating the small RNAs on
acrylamide gels and transferring them to Hybond membranes were optimized. The blots
could be used immediately or stored for long periods before probing with gamma 32
P
labeled oligonucleotide probes representing various small RNAs. In addition, I found
that small RNAs were less susceptible to precipitation by the proanthocyanidin
compounds present in the pigmented seed coats, than are the larger mRNAs from the
pigmented seed coats. As will be shown in Chapter 3, the methods allowed for
verification of deep sequencing data obtained from small RNA libraries.
30
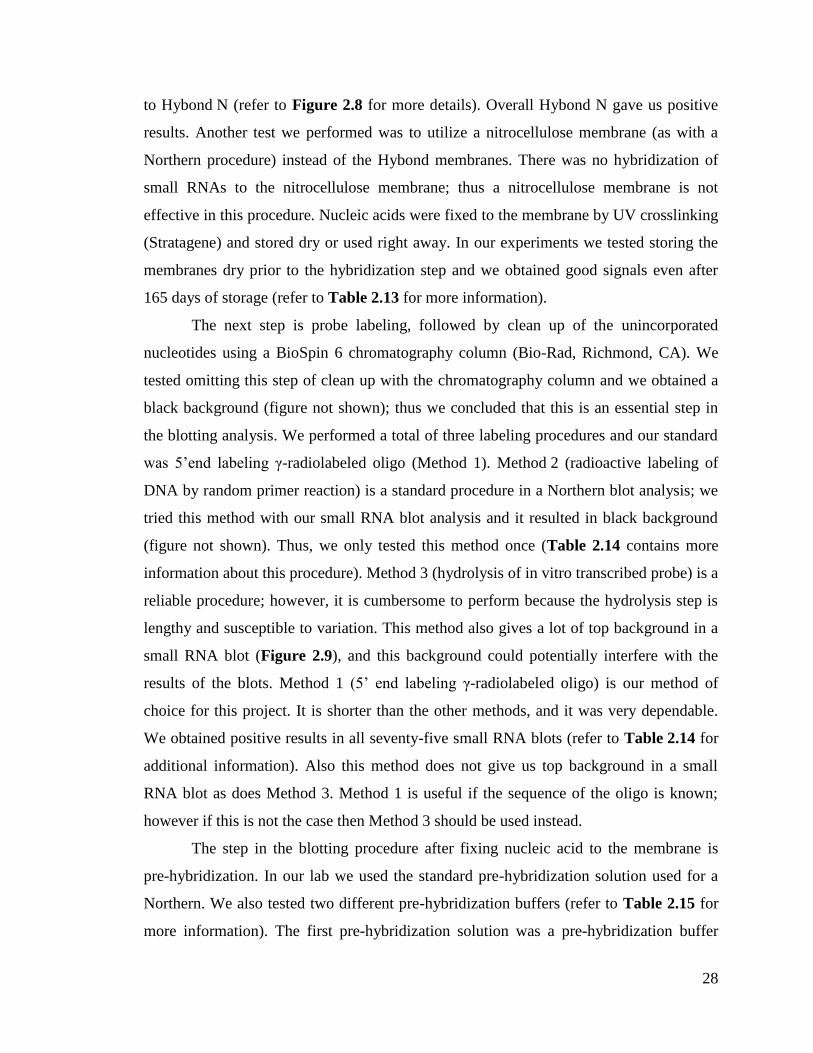
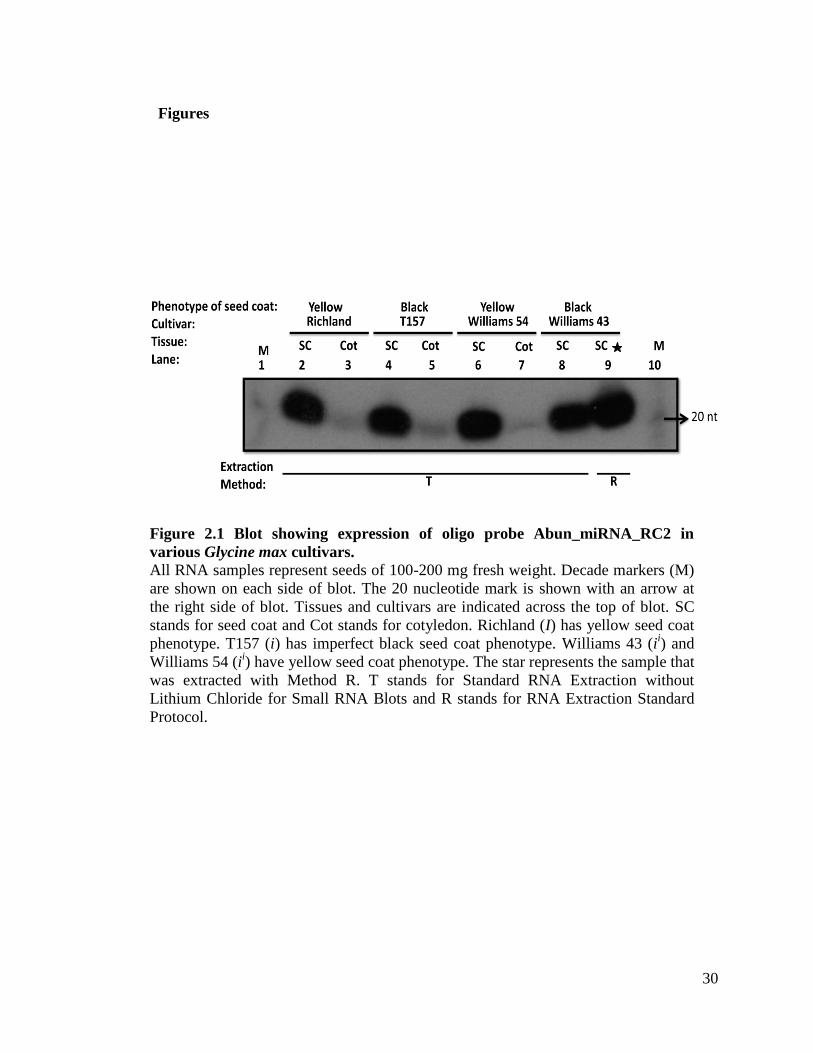
Figure 2.1 Blot showing expression of oligo probe Abun_miRNA_RC2 in
various Glycine max cultivars. All RNA samples represent seeds of 100-200 mg fresh weight. Decade markers (M)
are shown on each side of blot. The 20 nucleotide mark is shown with an arrow at
the right side of blot. Tissues and cultivars are indicated across the top of blot. SC
stands for seed coat and Cot stands for cotyledon. Richland (I) has yellow seed coat
phenotype. T157 (i) has imperfect black seed coat phenotype. Williams 43 (ii) and
Williams 54 (ii) have yellow seed coat phenotype. The star represents the sample that
was extracted with Method R. T stands for Standard RNA Extraction without
Lithium Chloride for Small RNA Blots and R stands for RNA Extraction Standard
Protocol.
Figures
31
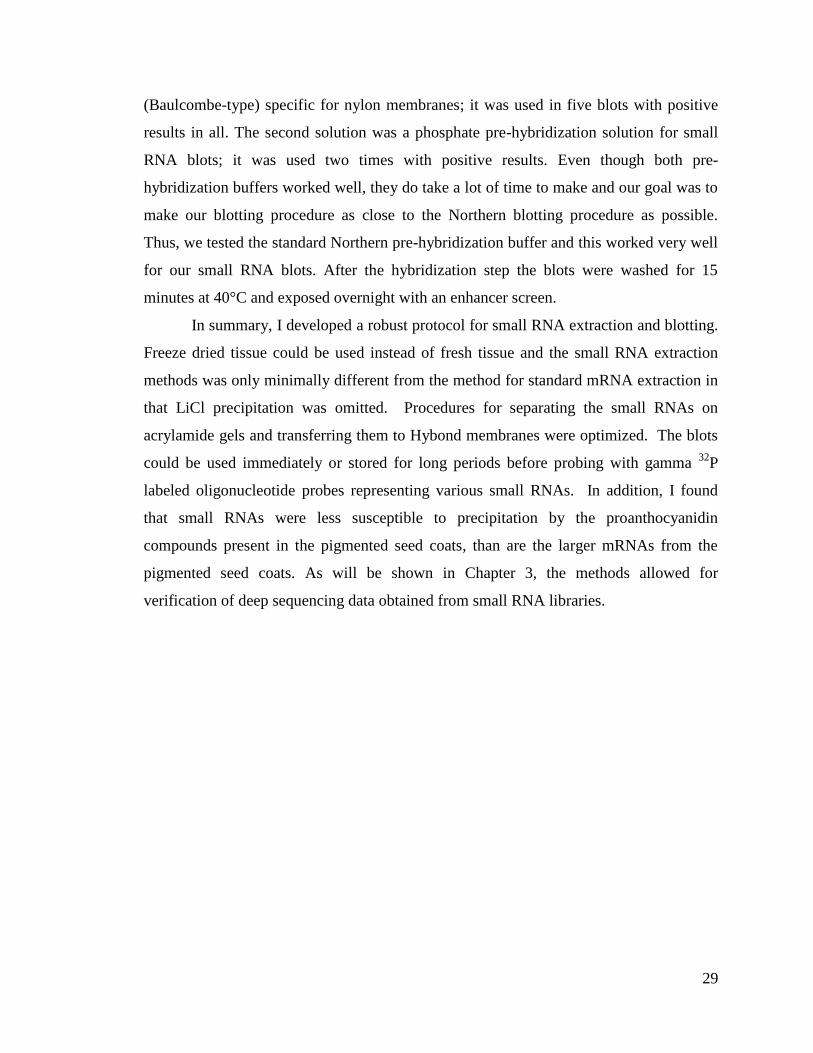
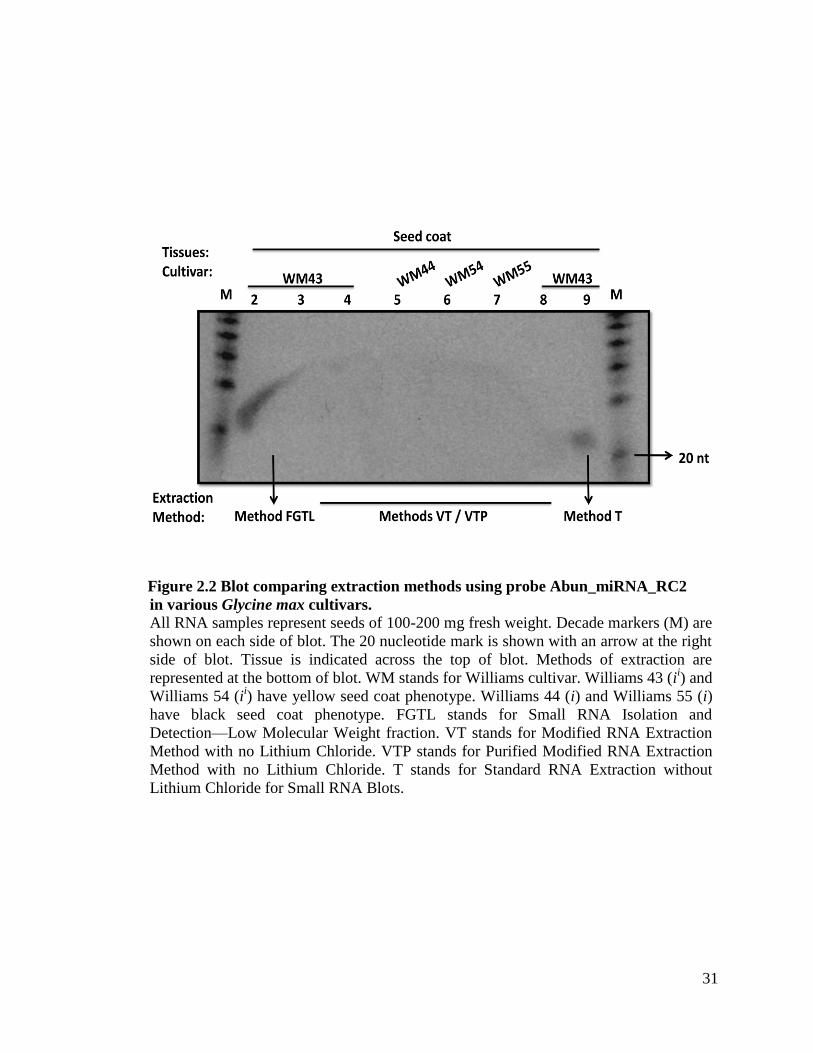
Figure 2.2 Blot comparing extraction methods using probe Abun_miRNA_RC2
in various Glycine max cultivars.
All RNA samples represent seeds of 100-200 mg fresh weight. Decade markers (M) are
shown on each side of blot. The 20 nucleotide mark is shown with an arrow at the right
side of blot. Tissue is indicated across the top of blot. Methods of extraction are
represented at the bottom of blot. WM stands for Williams cultivar. Williams 43 (ii) and
Williams 54 (ii) have yellow seed coat phenotype. Williams 44 (i) and Williams 55 (i)
have black seed coat phenotype. FGTL stands for Small RNA Isolation and
Detection—Low Molecular Weight fraction. VT stands for Modified RNA Extraction
Method with no Lithium Chloride. VTP stands for Purified Modified RNA Extraction
Method with no Lithium Chloride. T stands for Standard RNA Extraction without
Lithium Chloride for Small RNA Blots.
32
Figure 2.3 RNA gel analysis of various Glycine max cultivars treated with
methods T and R.
5 µg of total RNA was electrophoresed through a 1.2% agarose/ 1.1% formaldehyde
gel. Tissues are indicated across the top of gel. COT stands for cotyledons. WM
stands for Williams cultivar and Rich for Richland. Williams 43 (ii) and Williams 54
(ii) have yellow seed coat phenotype. Williams 44 (i) and Williams 55 (i) have black
seed coat phenotype. Richland (I) cultivar has yellow seed coat phenotype. T157 (i)
has imperfect black seed coat phenotype. The stars represent cultivars that have black
seed coats. Methods of extraction are represented at the bottom of gel. T stands for
Standard RNA Extraction without Lithium Chloride for Small RNA Blots and R
stands for RNA Extraction Standard Method.
33
Figure 2.4 RNA gel analysis of various Glycine max cultivars.
5 µg of total RNA was electrophoresed through a 1.2% agarose/ 1.1%
formaldehyde gel. Tissues and cultivars are indicated across the top of gel. WM
stands for Williams cultivar. Williams 43 (ii) has yellow seed coat phenotype, and
Williams 55 (i) has black seed coat phenotype. Samples in lanes 4 through 8 were
not used in this project; thus they are disregarded here. The triangle represents the
sample Williams 55 (black seed coat) extracted using Method V and the stars
represent samples of Williams 55 (black seed coat) extracted with Method T; these
do not show in the agarose gel. Methods of extraction are represented at the bottom
of gel. T stands for Standard RNA Extraction without Lithium Chloride for Small
RNA Blots, V stands for Modified RNA Extraction Method with PVPP and
Lithium Chloride, and R stands for RNA Extraction Standard Method.
34
Figure 2.5 RNA gel analysis of various Glycine max cultivars showing the
effect of proanthocyanidins on RNA recovery.
5 µg of total RNA was electrophoresed through a 1.2% agarose/ 1.1%
formaldehyde gel. Tissues and cultivars are indicated across the top of gel.
Williams 43 (ii) has yellow seed coat phenotype, and Williams 55 (i) has black
seed coat phenotype. The star represents the samples of Williams 55 (black
seed coat) extracted using the Method T, which do not show in the agarose gel.
Method of extraction is represented at the bottom of gel. T stands for Total
Nucleic Acid Extraction protocol.
35
Figure 2.6 Blot showing expression of oligo Abun_miRNA_RC2 in various
Glycine max cultivars. Signal is much higher in the seed coats (SC) than in the cotyledons (COT). All RNA
samples represent seeds of 100-200 mg fresh weight. Decade markers (M) are shown
on each side of blot. The 20 nucleotide mark is shown with an arrow at the right side
of blot. Tissues and cultivars are indicated across the top of blot and methods of
extraction are denoted at the bottom of blot. The star represents the only sample
extracted using the Method VTP. T stands for Standard RNA Extraction without
Lithium Chloride for Small RNA Blots and VTP stands for Purified Modified RNA
Extraction Method with no Lithium Chloride. WM stands for Williams cultivar.
36
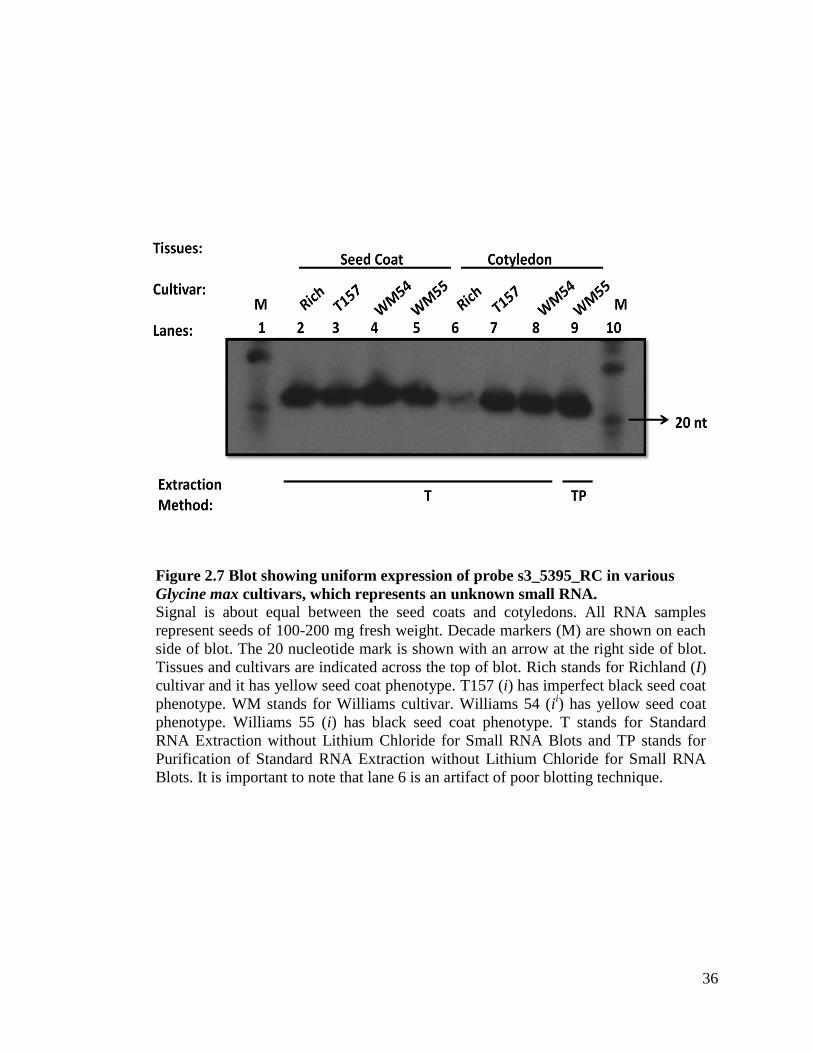
Figure 2.7 Blot showing uniform expression of probe s3_5395_RC in various
Glycine max cultivars, which represents an unknown small RNA. Signal is about equal between the seed coats and cotyledons. All RNA samples
represent seeds of 100-200 mg fresh weight. Decade markers (M) are shown on each
side of blot. The 20 nucleotide mark is shown with an arrow at the right side of blot.
Tissues and cultivars are indicated across the top of blot. Rich stands for Richland (I)
cultivar and it has yellow seed coat phenotype. T157 (i) has imperfect black seed coat
phenotype. WM stands for Williams cultivar. Williams 54 (ii) has yellow seed coat
phenotype. Williams 55 (i) has black seed coat phenotype. T stands for Standard
RNA Extraction without Lithium Chloride for Small RNA Blots and TP stands for
Purification of Standard RNA Extraction without Lithium Chloride for Small RNA
Blots. It is important to note that lane 6 is an artifact of poor blotting technique.
37
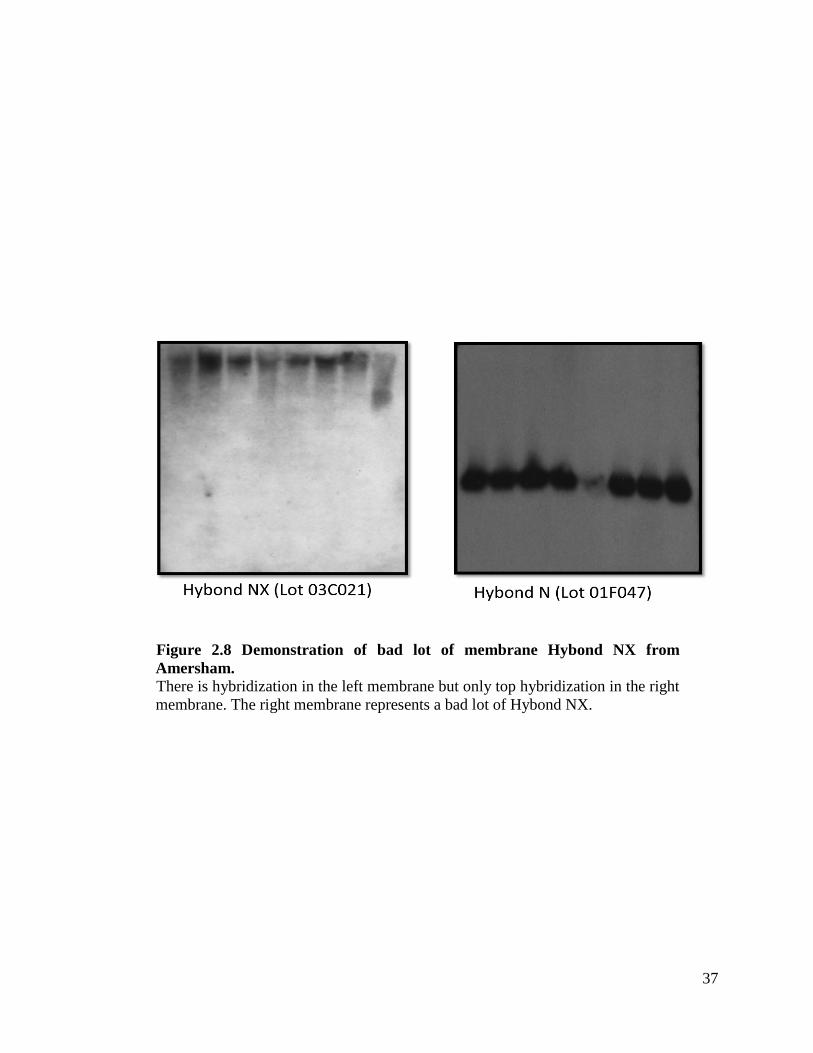
Figure 2.8 Demonstration of bad lot of membrane Hybond NX from
Amersham. There is hybridization in the left membrane but only top hybridization in the right
membrane. The right membrane represents a bad lot of Hybond NX.
38
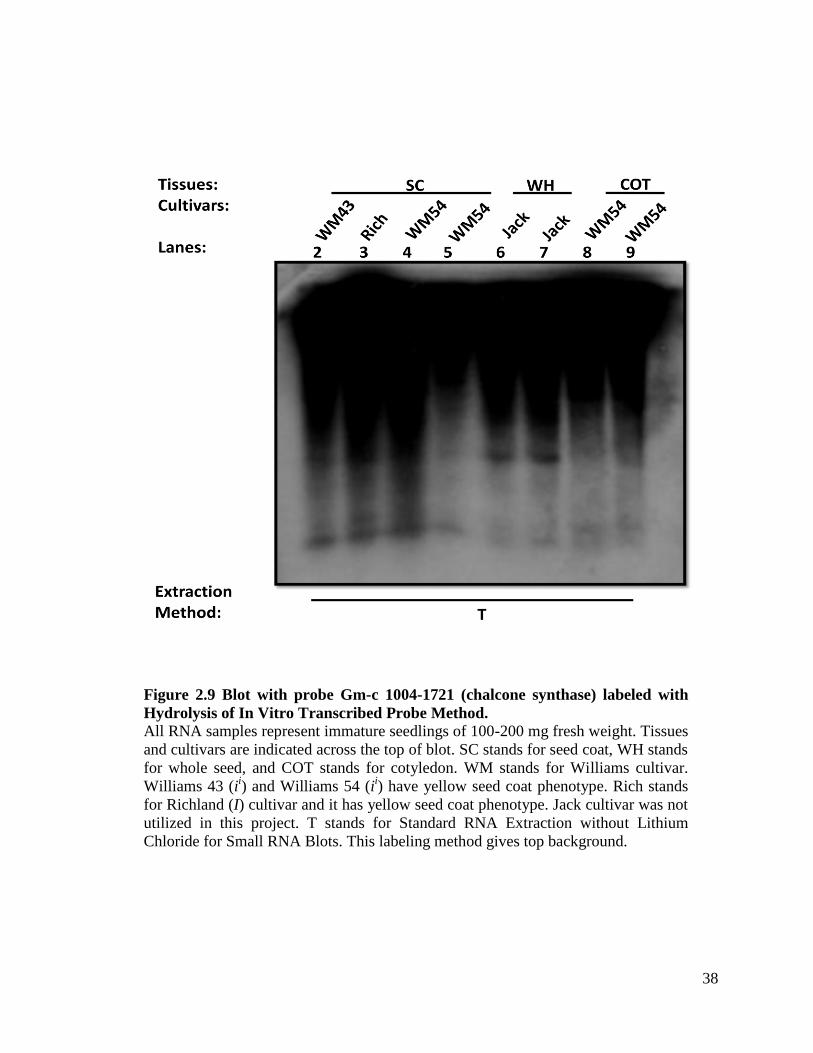
Figure 2.9 Blot with probe Gm-c 1004-1721 (chalcone synthase) labeled with
Hydrolysis of In Vitro Transcribed Probe Method.
All RNA samples represent immature seedlings of 100-200 mg fresh weight. Tissues
and cultivars are indicated across the top of blot. SC stands for seed coat, WH stands
for whole seed, and COT stands for cotyledon. WM stands for Williams cultivar.
Williams 43 (ii) and Williams 54 (i
i) have yellow seed coat phenotype. Rich stands
for Richland (I) cultivar and it has yellow seed coat phenotype. Jack cultivar was not
utilized in this project. T stands for Standard RNA Extraction without Lithium
Chloride for Small RNA Blots. This labeling method gives top background.
39
Tables
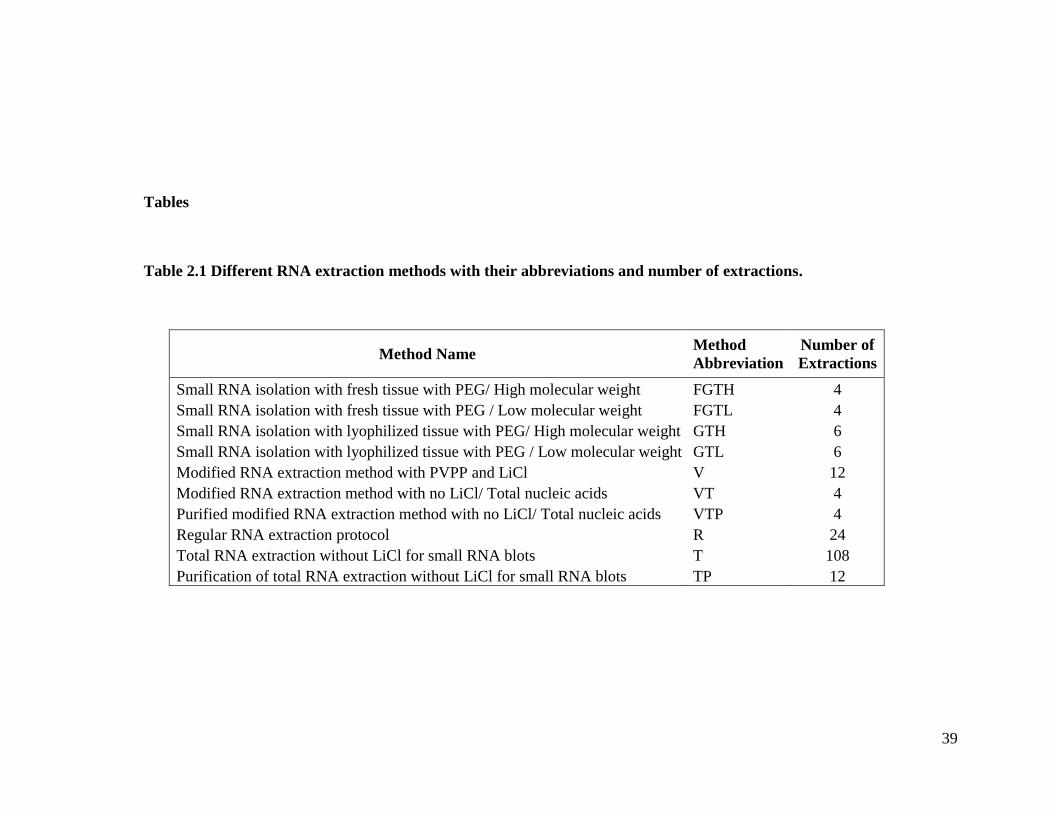
Table 2.1 Different RNA extraction methods with their abbreviations and number of extractions.
Method Name Method
Abbreviation
Number of
Extractions
Small RNA isolation with fresh tissue with PEG/ High molecular weight FGTH 4
Small RNA isolation with fresh tissue with PEG / Low molecular weight FGTL 4
Small RNA isolation with lyophilized tissue with PEG/ High molecular weight GTH 6
Small RNA isolation with lyophilized tissue with PEG / Low molecular weight GTL 6
Modified RNA extraction method with PVPP and LiCl V 12
Modified RNA extraction method with no LiCl/ Total nucleic acids VT 4
Purified modified RNA extraction method with no LiCl/ Total nucleic acids VTP 4
Regular RNA extraction protocol R 24
Total RNA extraction without LiCl for small RNA blots T 108
Purification of total RNA extraction without LiCl for small RNA blots TP 12
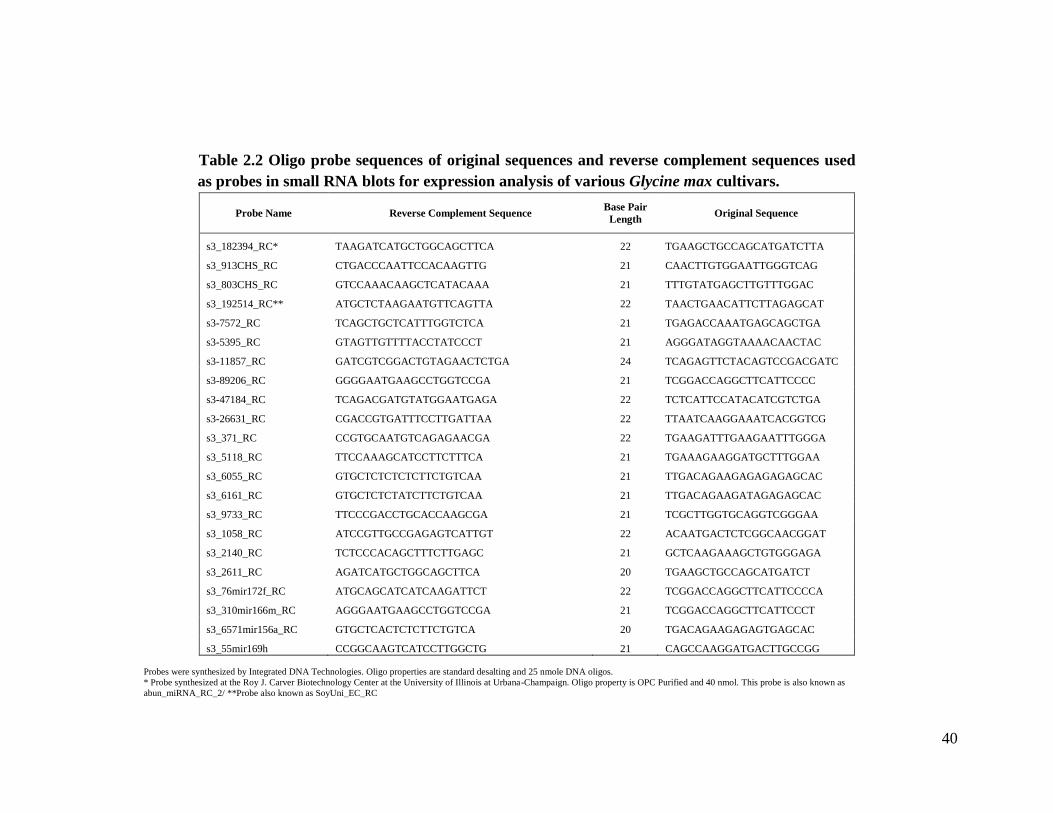
40
Table 2.2 Oligo probe sequences of original sequences and reverse complement sequences used
as probes in small RNA blots for expression analysis of various Glycine max cultivars.
Probe Name Reverse Complement Sequence Base Pair
Length Original Sequence
s3_182394_RC* TAAGATCATGCTGGCAGCTTCA 22 TGAAGCTGCCAGCATGATCTTA
s3_913CHS_RC CTGACCCAATTCCACAAGTTG 21 CAACTTGTGGAATTGGGTCAG
s3_803CHS_RC GTCCAAACAAGCTCATACAAA 21 TTTGTATGAGCTTGTTTGGAC
s3_192514_RC** ATGCTCTAAGAATGTTCAGTTA 22 TAACTGAACATTCTTAGAGCAT
s3-7572_RC TCAGCTGCTCATTTGGTCTCA 21 TGAGACCAAATGAGCAGCTGA
s3-5395_RC GTAGTTGTTTTACCTATCCCT 21 AGGGATAGGTAAAACAACTAC
s3-11857_RC GATCGTCGGACTGTAGAACTCTGA 24 TCAGAGTTCTACAGTCCGACGATC
s3-89206_RC GGGGAATGAAGCCTGGTCCGA 21 TCGGACCAGGCTTCATTCCCC
s3-47184_RC TCAGACGATGTATGGAATGAGA 22 TCTCATTCCATACATCGTCTGA
s3-26631_RC CGACCGTGATTTCCTTGATTAA 22 TTAATCAAGGAAATCACGGTCG
s3_371_RC CCGTGCAATGTCAGAGAACGA 22 TGAAGATTTGAAGAATTTGGGA
s3_5118_RC TTCCAAAGCATCCTTCTTTCA 21 TGAAAGAAGGATGCTTTGGAA
s3_6055_RC GTGCTCTCTCTCTTCTGTCAA 21 TTGACAGAAGAGAGAGAGCAC
s3_6161_RC GTGCTCTCTATCTTCTGTCAA 21 TTGACAGAAGATAGAGAGCAC
s3_9733_RC TTCCCGACCTGCACCAAGCGA 21 TCGCTTGGTGCAGGTCGGGAA
s3_1058_RC ATCCGTTGCCGAGAGTCATTGT 22 ACAATGACTCTCGGCAACGGAT
s3_2140_RC TCTCCCACAGCTTTCTTGAGC 21 GCTCAAGAAAGCTGTGGGAGA
s3_2611_RC AGATCATGCTGGCAGCTTCA 20 TGAAGCTGCCAGCATGATCT
s3_76mir172f_RC ATGCAGCATCATCAAGATTCT 22 TCGGACCAGGCTTCATTCCCCA
s3_310mir166m_RC AGGGAATGAAGCCTGGTCCGA 21 TCGGACCAGGCTTCATTCCCT
s3_6571mir156a_RC GTGCTCACTCTCTTCTGTCA 20 TGACAGAAGAGAGTGAGCAC
s3_55mir169h CCGGCAAGTCATCCTTGGCTG 21 CAGCCAAGGATGACTTGCCGG
Probes were synthesized by Integrated DNA Technologies. Oligo properties are standard desalting and 25 nmole DNA oligos.
* Probe synthesized at the Roy J. Carver Biotechnology Center at the University of Illinois at Urbana-Champaign. Oligo property is OPC Purified and 40 nmol. This probe is also known as
abun_miRNA_RC_2/ **Probe also known as SoyUni_EC_RC
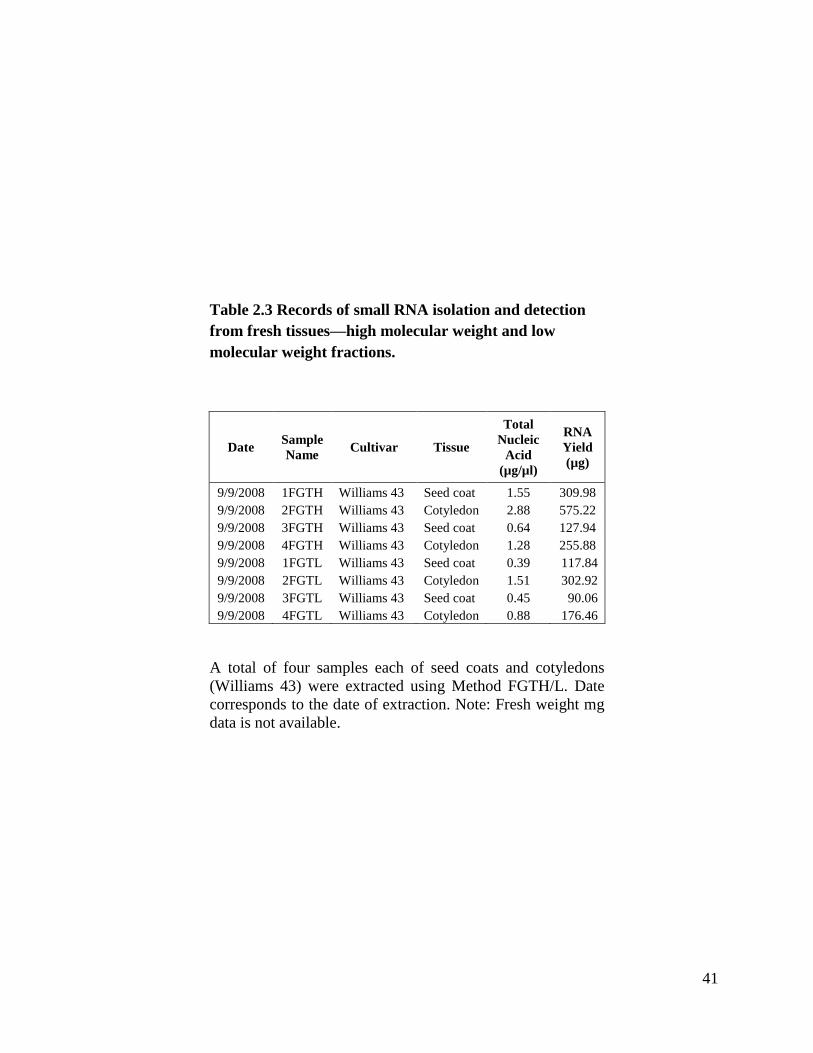
41
Table 2.3 Records of small RNA isolation and detection
from fresh tissues—high molecular weight and low
molecular weight fractions.
Date Sample
Name Cultivar Tissue
Total
Nucleic
Acid
(µg/µl)
RNA
Yield
(µg)
9/9/2008 1FGTH Williams 43 Seed coat 1.55 309.98
9/9/2008 2FGTH Williams 43 Cotyledon 2.88 575.22
9/9/2008 3FGTH Williams 43 Seed coat 0.64 127.94
9/9/2008 4FGTH Williams 43 Cotyledon 1.28 255.88
9/9/2008 1FGTL Williams 43 Seed coat 0.39 117.84
9/9/2008 2FGTL Williams 43 Cotyledon 1.51 302.92
9/9/2008 3FGTL Williams 43 Seed coat 0.45 90.06
9/9/2008 4FGTL Williams 43 Cotyledon 0.88 176.46
A total of four samples each of seed coats and cotyledons
(Williams 43) were extracted using Method FGTH/L. Date
corresponds to the date of extraction. Note: Fresh weight mg
data is not available.
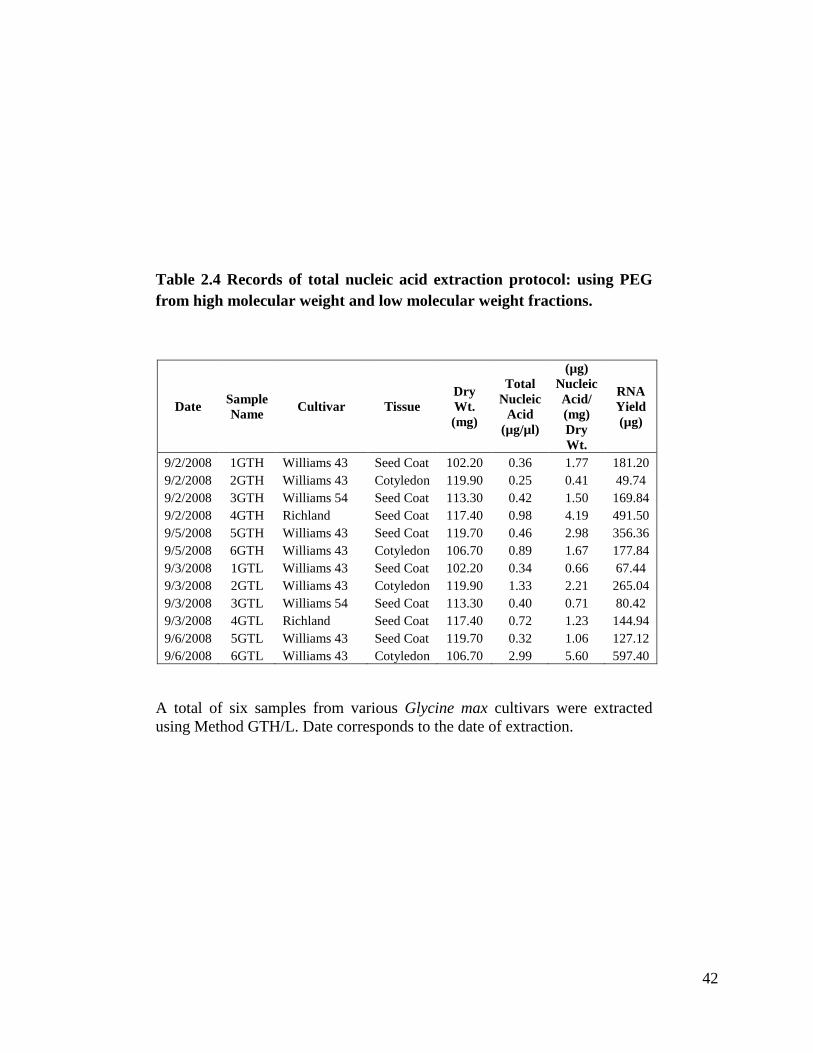
42
Table 2.4 Records of total nucleic acid extraction protocol: using PEG
from high molecular weight and low molecular weight fractions.
Date Sample
Name Cultivar Tissue
Dry
Wt.
(mg)
Total
Nucleic
Acid
(µg/µl)
(µg)
Nucleic
Acid/
(mg)
Dry
Wt.
RNA
Yield
(µg)
9/2/2008 1GTH Williams 43 Seed Coat 102.20 0.36 1.77 181.20
9/2/2008 2GTH Williams 43 Cotyledon 119.90 0.25 0.41 49.74
9/2/2008 3GTH Williams 54 Seed Coat 113.30 0.42 1.50 169.84
9/2/2008 4GTH Richland Seed Coat 117.40 0.98 4.19 491.50
9/5/2008 5GTH Williams 43 Seed Coat 119.70 0.46 2.98 356.36
9/5/2008 6GTH Williams 43 Cotyledon 106.70 0.89 1.67 177.84
9/3/2008 1GTL Williams 43 Seed Coat 102.20 0.34 0.66 67.44
9/3/2008 2GTL Williams 43 Cotyledon 119.90 1.33 2.21 265.04
9/3/2008 3GTL Williams 54 Seed Coat 113.30 0.40 0.71 80.42
9/3/2008 4GTL Richland Seed Coat 117.40 0.72 1.23 144.94
9/6/2008 5GTL Williams 43 Seed Coat 119.70 0.32 1.06 127.12
9/6/2008 6GTL Williams 43 Cotyledon 106.70 2.99 5.60 597.40
A total of six samples from various Glycine max cultivars were extracted
using Method GTH/L. Date corresponds to the date of extraction.
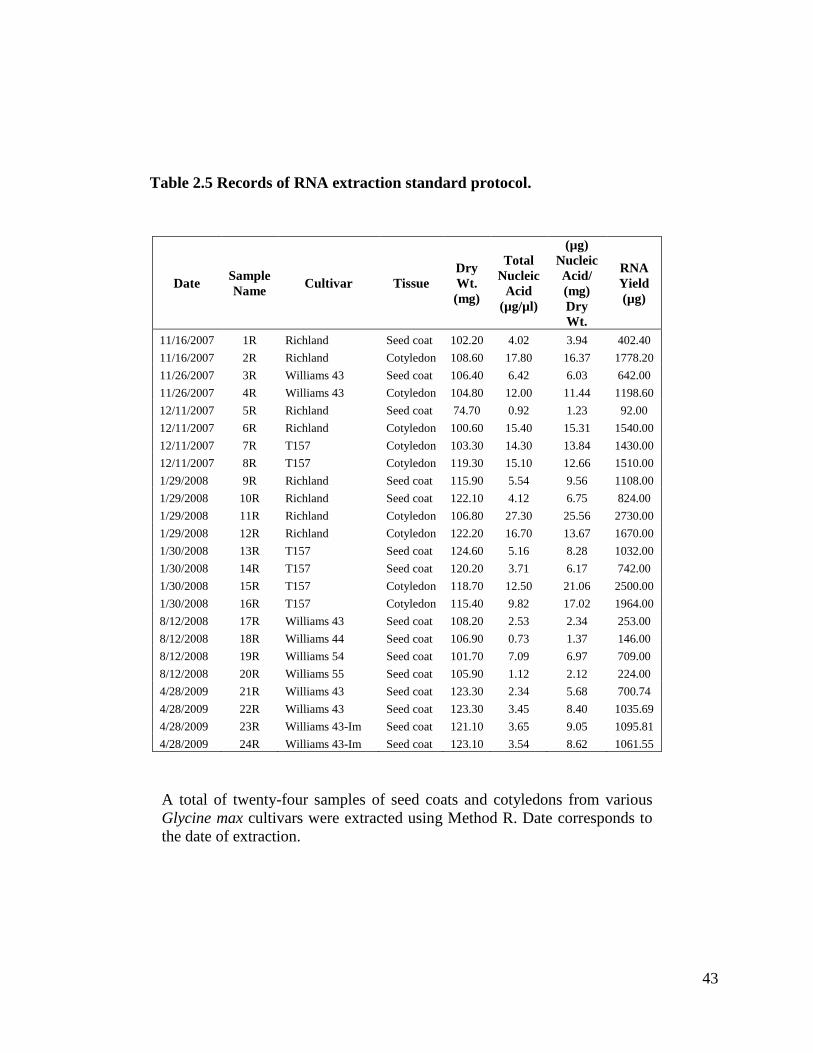
43
Table 2.5 Records of RNA extraction standard protocol.
Date Sample
Name Cultivar Tissue
Dry
Wt.
(mg)
Total
Nucleic
Acid
(µg/µl)
(µg)
Nucleic
Acid/
(mg)
Dry
Wt.
RNA
Yield
(µg)
11/16/2007 1R Richland Seed coat 102.20 4.02 3.94 402.40
11/16/2007 2R Richland Cotyledon 108.60 17.80 16.37 1778.20
11/26/2007 3R Williams 43 Seed coat 106.40 6.42 6.03 642.00
11/26/2007 4R Williams 43 Cotyledon 104.80 12.00 11.44 1198.60
12/11/2007 5R Richland Seed coat 74.70 0.92 1.23 92.00
12/11/2007 6R Richland Cotyledon 100.60 15.40 15.31 1540.00
12/11/2007 7R T157 Cotyledon 103.30 14.30 13.84 1430.00
12/11/2007 8R T157 Cotyledon 119.30 15.10 12.66 1510.00
1/29/2008 9R Richland Seed coat 115.90 5.54 9.56 1108.00
1/29/2008 10R Richland Seed coat 122.10 4.12 6.75 824.00
1/29/2008 11R Richland Cotyledon 106.80 27.30 25.56 2730.00
1/29/2008 12R Richland Cotyledon 122.20 16.70 13.67 1670.00
1/30/2008 13R T157 Seed coat 124.60 5.16 8.28 1032.00
1/30/2008 14R T157 Seed coat 120.20 3.71 6.17 742.00
1/30/2008 15R T157 Cotyledon 118.70 12.50 21.06 2500.00
1/30/2008 16R T157 Cotyledon 115.40 9.82 17.02 1964.00
8/12/2008 17R Williams 43 Seed coat 108.20 2.53 2.34 253.00
8/12/2008 18R Williams 44 Seed coat 106.90 0.73 1.37 146.00
8/12/2008 19R Williams 54 Seed coat 101.70 7.09 6.97 709.00
8/12/2008 20R Williams 55 Seed coat 105.90 1.12 2.12 224.00
4/28/2009 21R Williams 43 Seed coat 123.30 2.34 5.68 700.74
4/28/2009 22R Williams 43 Seed coat 123.30 3.45 8.40 1035.69
4/28/2009 23R Williams 43-Im Seed coat 121.10 3.65 9.05 1095.81
4/28/2009 24R Williams 43-Im Seed coat 123.10 3.54 8.62 1061.55
A total of twenty-four samples of seed coats and cotyledons from various
Glycine max cultivars were extracted using Method R. Date corresponds to
the date of extraction.
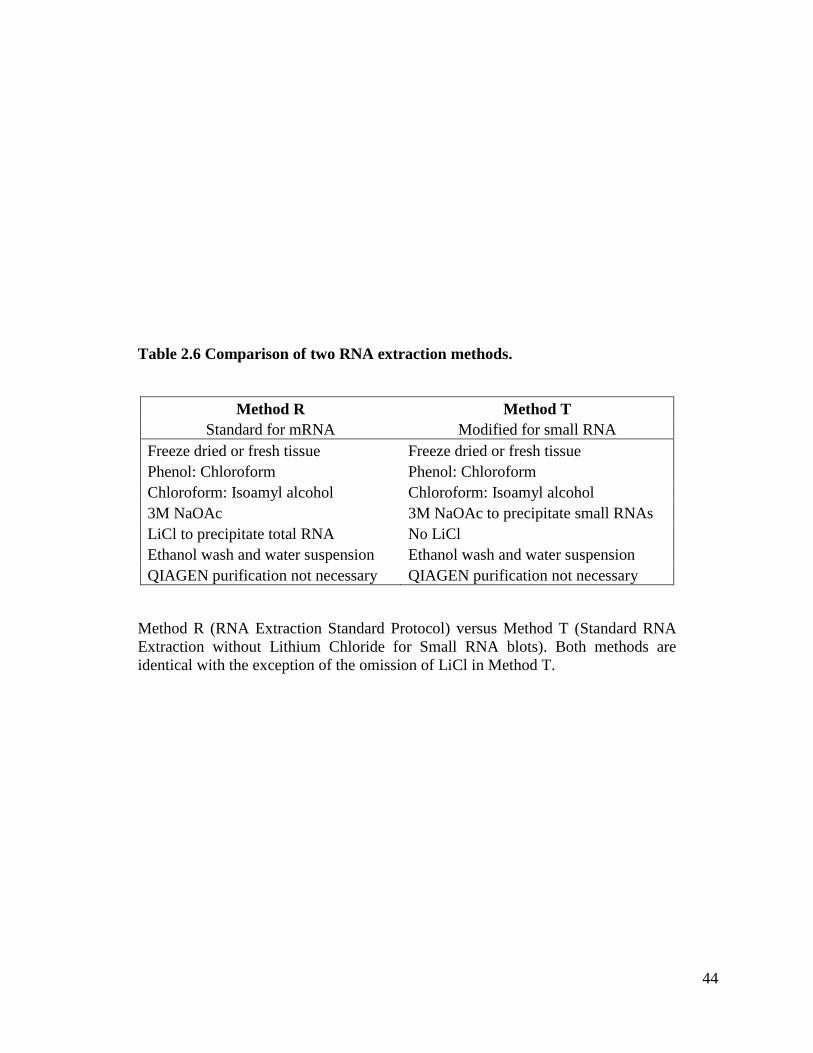
44
Table 2.6 Comparison of two RNA extraction methods.
Method R Method T
Standard for mRNA Modified for small RNA
Freeze dried or fresh tissue Freeze dried or fresh tissue
Phenol: Chloroform Phenol: Chloroform
Chloroform: Isoamyl alcohol Chloroform: Isoamyl alcohol
3M NaOAc 3M NaOAc to precipitate small RNAs
LiCl to precipitate total RNA No LiCl
Ethanol wash and water suspension Ethanol wash and water suspension
QIAGEN purification not necessary QIAGEN purification not necessary
Method R (RNA Extraction Standard Protocol) versus Method T (Standard RNA
Extraction without Lithium Chloride for Small RNA blots). Both methods are
identical with the exception of the omission of LiCl in Method T.
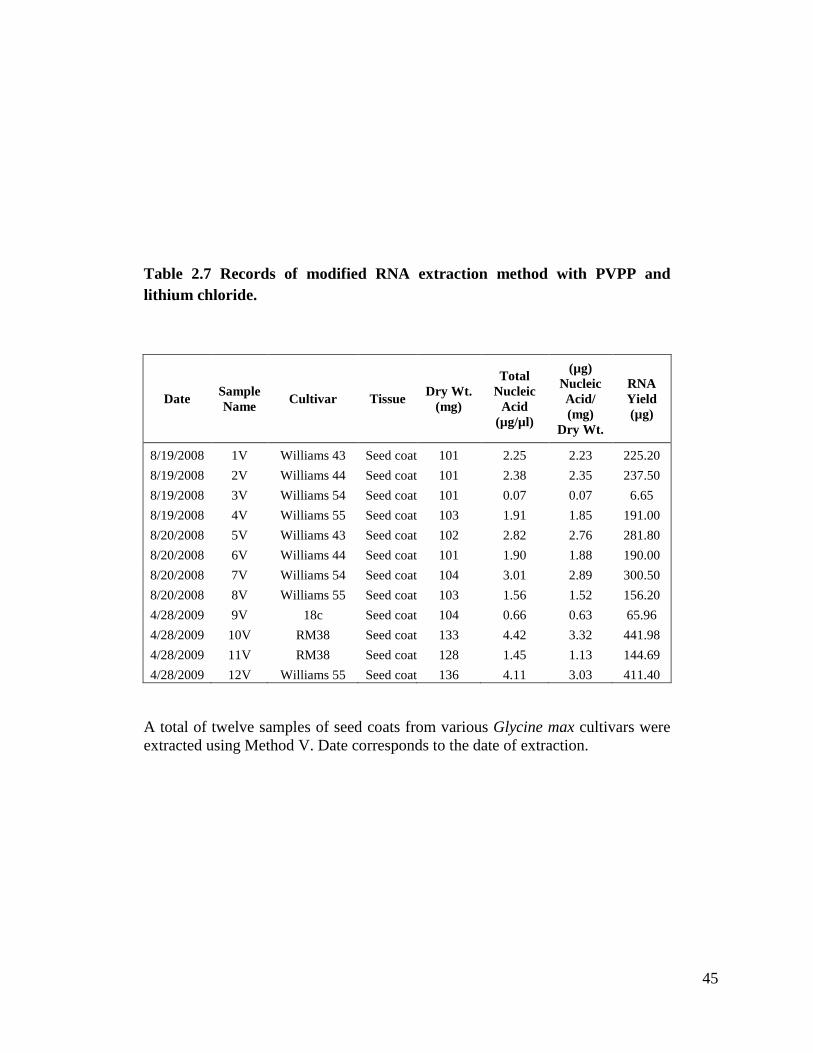
45
Table 2.7 Records of modified RNA extraction method with PVPP and
lithium chloride.
Date Sample
Name Cultivar Tissue
Dry Wt.
(mg)
Total
Nucleic
Acid
(µg/µl)
(µg)
Nucleic
Acid/
(mg)
Dry Wt.
RNA
Yield
(µg)
8/19/2008 1V Williams 43 Seed coat 101 2.25 2.23 225.20
8/19/2008 2V Williams 44 Seed coat 101 2.38 2.35 237.50
8/19/2008 3V Williams 54 Seed coat 101 0.07 0.07 6.65
8/19/2008 4V Williams 55 Seed coat 103 1.91 1.85 191.00
8/20/2008 5V Williams 43 Seed coat 102 2.82 2.76 281.80
8/20/2008 6V Williams 44 Seed coat 101 1.90 1.88 190.00
8/20/2008 7V Williams 54 Seed coat 104 3.01 2.89 300.50
8/20/2008 8V Williams 55 Seed coat 103 1.56 1.52 156.20
4/28/2009 9V 18c Seed coat 104 0.66 0.63 65.96
4/28/2009 10V RM38 Seed coat 133 4.42 3.32 441.98
4/28/2009 11V RM38 Seed coat 128 1.45 1.13 144.69
4/28/2009 12V Williams 55 Seed coat 136 4.11 3.03 411.40
A total of twelve samples of seed coats from various Glycine max cultivars were
extracted using Method V. Date corresponds to the date of extraction.
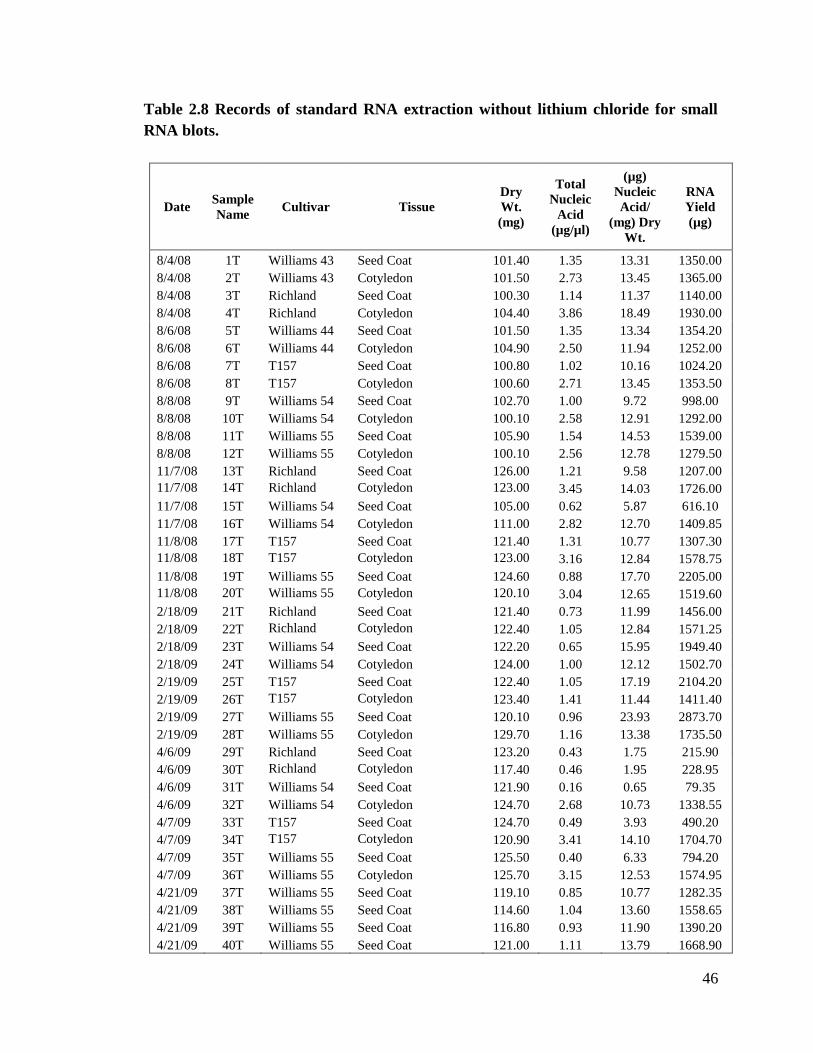
46
Table 2.8 Records of standard RNA extraction without lithium chloride for small
RNA blots.
Date Sample
Name Cultivar Tissue
Dry
Wt.
(mg)
Total
Nucleic
Acid
(µg/µl)
(µg)
Nucleic
Acid/
(mg) Dry
Wt.
RNA
Yield
(µg)
8/4/08 1T Williams 43 Seed Coat 101.40 1.35 13.31 1350.00
8/4/08 2T Williams 43 Cotyledon 101.50 2.73 13.45 1365.00
8/4/08 3T Richland Seed Coat 100.30 1.14 11.37 1140.00
8/4/08 4T Richland Cotyledon 104.40 3.86 18.49 1930.00
8/6/08 5T Williams 44 Seed Coat 101.50 1.35 13.34 1354.20
8/6/08 6T Williams 44 Cotyledon 104.90 2.50 11.94 1252.00
8/6/08 7T T157 Seed Coat 100.80 1.02 10.16 1024.20
8/6/08 8T T157 Cotyledon 100.60 2.71 13.45 1353.50
8/8/08 9T Williams 54 Seed Coat 102.70 1.00 9.72 998.00
8/8/08 10T Williams 54 Cotyledon 100.10 2.58 12.91 1292.00
8/8/08 11T Williams 55 Seed Coat 105.90 1.54 14.53 1539.00
8/8/08 12T Williams 55 Cotyledon 100.10 2.56 12.78 1279.50
11/7/08 13T Richland Seed Coat 126.00 1.21 9.58 1207.00
11/7/08 14T Richland Cotyledon 123.00 3.45 14.03 1726.00
11/7/08 15T Williams 54 Seed Coat 105.00 0.62 5.87 616.10
11/7/08 16T Williams 54 Cotyledon 111.00 2.82 12.70 1409.85
11/8/08 17T T157 Seed Coat 121.40 1.31 10.77 1307.30
11/8/08 18T T157 Cotyledon 123.00 3.16 12.84 1578.75
11/8/08 19T Williams 55 Seed Coat 124.60 0.88 17.70 2205.00
11/8/08 20T Williams 55 Cotyledon 120.10 3.04 12.65 1519.60
2/18/09 21T Richland Seed Coat 121.40 0.73 11.99 1456.00
2/18/09 22T Richland Cotyledon 122.40 1.05 12.84 1571.25
2/18/09 23T Williams 54 Seed Coat 122.20 0.65 15.95 1949.40
2/18/09 24T Williams 54 Cotyledon 124.00 1.00 12.12 1502.70
2/19/09 25T T157 Seed Coat 122.40 1.05 17.19 2104.20
2/19/09 26T T157 Cotyledon 123.40 1.41 11.44 1411.40
2/19/09 27T Williams 55 Seed Coat 120.10 0.96 23.93 2873.70
2/19/09 28T Williams 55 Cotyledon 129.70 1.16 13.38 1735.50
4/6/09 29T Richland Seed Coat 123.20 0.43 1.75 215.90
4/6/09 30T Richland Cotyledon 117.40 0.46 1.95 228.95
4/6/09 31T Williams 54 Seed Coat 121.90 0.16 0.65 79.35
4/6/09 32T Williams 54 Cotyledon 124.70 2.68 10.73 1338.55
4/7/09 33T T157 Seed Coat 124.70 0.49 3.93 490.20
4/7/09 34T T157 Cotyledon 120.90 3.41 14.10 1704.70
4/7/09 35T Williams 55 Seed Coat 125.50 0.40 6.33 794.20
4/7/09 36T Williams 55 Cotyledon 125.70 3.15 12.53 1574.95
4/21/09 37T Williams 55 Seed Coat 119.10 0.85 10.77 1282.35
4/21/09 38T Williams 55 Seed Coat 114.60 1.04 13.60 1558.65
4/21/09 39T Williams 55 Seed Coat 116.80 0.93 11.90 1390.20
4/21/09 40T Williams 55 Seed Coat 121.00 1.11 13.79 1668.90
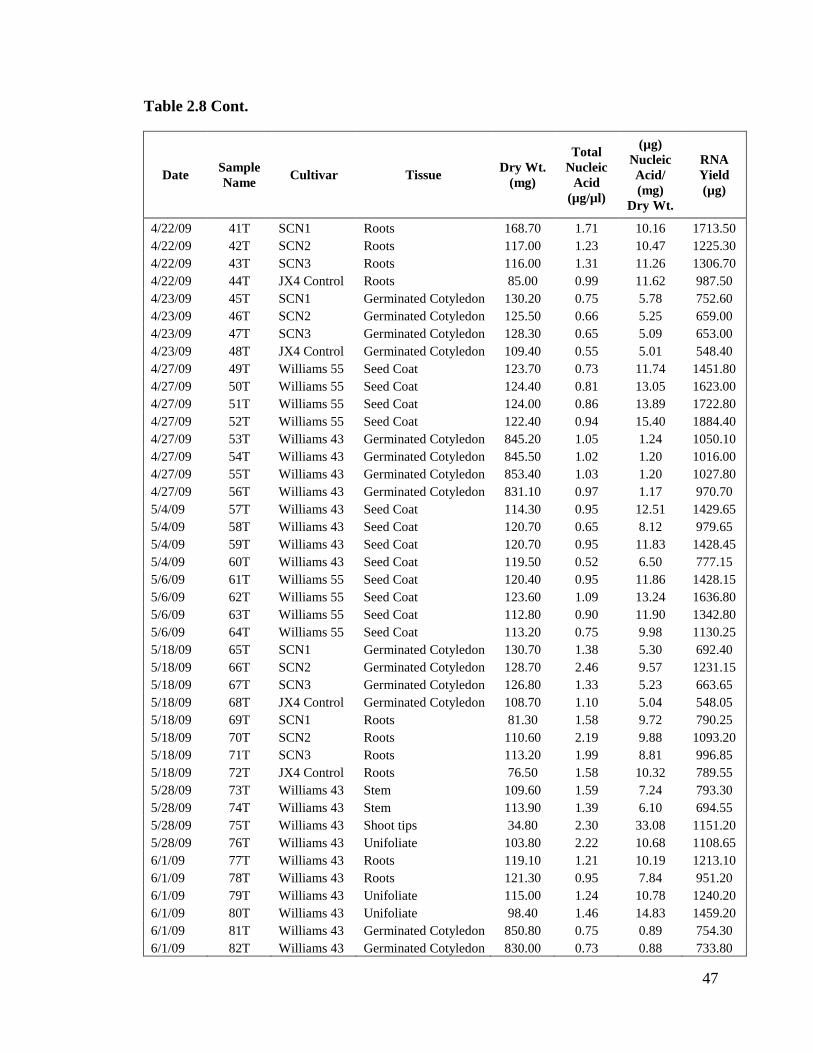
47
Table 2.8 Cont.
Date Sample
Name Cultivar Tissue
Dry Wt.
(mg)
Total
Nucleic
Acid
(µg/µl)
(µg)
Nucleic
Acid/
(mg)
Dry Wt.
RNA
Yield
(µg)
4/22/09 41T SCN1 Roots 168.70 1.71 10.16 1713.50
4/22/09 42T SCN2 Roots 117.00 1.23 10.47 1225.30
4/22/09 43T SCN3 Roots 116.00 1.31 11.26 1306.70
4/22/09 44T JX4 Control Roots 85.00 0.99 11.62 987.50
4/23/09 45T SCN1 Germinated Cotyledon 130.20 0.75 5.78 752.60
4/23/09 46T SCN2 Germinated Cotyledon 125.50 0.66 5.25 659.00
4/23/09 47T SCN3 Germinated Cotyledon 128.30 0.65 5.09 653.00
4/23/09 48T JX4 Control Germinated Cotyledon 109.40 0.55 5.01 548.40
4/27/09 49T Williams 55 Seed Coat 123.70 0.73 11.74 1451.80
4/27/09 50T Williams 55 Seed Coat 124.40 0.81 13.05 1623.00
4/27/09 51T Williams 55 Seed Coat 124.00 0.86 13.89 1722.80
4/27/09 52T Williams 55 Seed Coat 122.40 0.94 15.40 1884.40
4/27/09 53T Williams 43 Germinated Cotyledon 845.20 1.05 1.24 1050.10
4/27/09 54T Williams 43 Germinated Cotyledon 845.50 1.02 1.20 1016.00
4/27/09 55T Williams 43 Germinated Cotyledon 853.40 1.03 1.20 1027.80
4/27/09 56T Williams 43 Germinated Cotyledon 831.10 0.97 1.17 970.70
5/4/09 57T Williams 43 Seed Coat 114.30 0.95 12.51 1429.65
5/4/09 58T Williams 43 Seed Coat 120.70 0.65 8.12 979.65
5/4/09 59T Williams 43 Seed Coat 120.70 0.95 11.83 1428.45
5/4/09 60T Williams 43 Seed Coat 119.50 0.52 6.50 777.15
5/6/09 61T Williams 55 Seed Coat 120.40 0.95 11.86 1428.15
5/6/09 62T Williams 55 Seed Coat 123.60 1.09 13.24 1636.80
5/6/09 63T Williams 55 Seed Coat 112.80 0.90 11.90 1342.80
5/6/09 64T Williams 55 Seed Coat 113.20 0.75 9.98 1130.25
5/18/09 65T SCN1 Germinated Cotyledon 130.70 1.38 5.30 692.40
5/18/09 66T SCN2 Germinated Cotyledon 128.70 2.46 9.57 1231.15
5/18/09 67T SCN3 Germinated Cotyledon 126.80 1.33 5.23 663.65
5/18/09 68T JX4 Control Germinated Cotyledon 108.70 1.10 5.04 548.05
5/18/09 69T SCN1 Roots 81.30 1.58 9.72 790.25
5/18/09 70T SCN2 Roots 110.60 2.19 9.88 1093.20
5/18/09 71T SCN3 Roots 113.20 1.99 8.81 996.85
5/18/09 72T JX4 Control Roots 76.50 1.58 10.32 789.55
5/28/09 73T Williams 43 Stem 109.60 1.59 7.24 793.30
5/28/09 74T Williams 43 Stem 113.90 1.39 6.10 694.55
5/28/09 75T Williams 43 Shoot tips 34.80 2.30 33.08 1151.20
5/28/09 76T Williams 43 Unifoliate 103.80 2.22 10.68 1108.65
6/1/09 77T Williams 43 Roots 119.10 1.21 10.19 1213.10
6/1/09 78T Williams 43 Roots 121.30 0.95 7.84 951.20
6/1/09 79T Williams 43 Unifoliate 115.00 1.24 10.78 1240.20
6/1/09 80T Williams 43 Unifoliate 98.40 1.46 14.83 1459.20
6/1/09 81T Williams 43 Germinated Cotyledon 850.80 0.75 0.89 754.30
6/1/09 82T Williams 43 Germinated Cotyledon 830.00 0.73 0.88 733.80
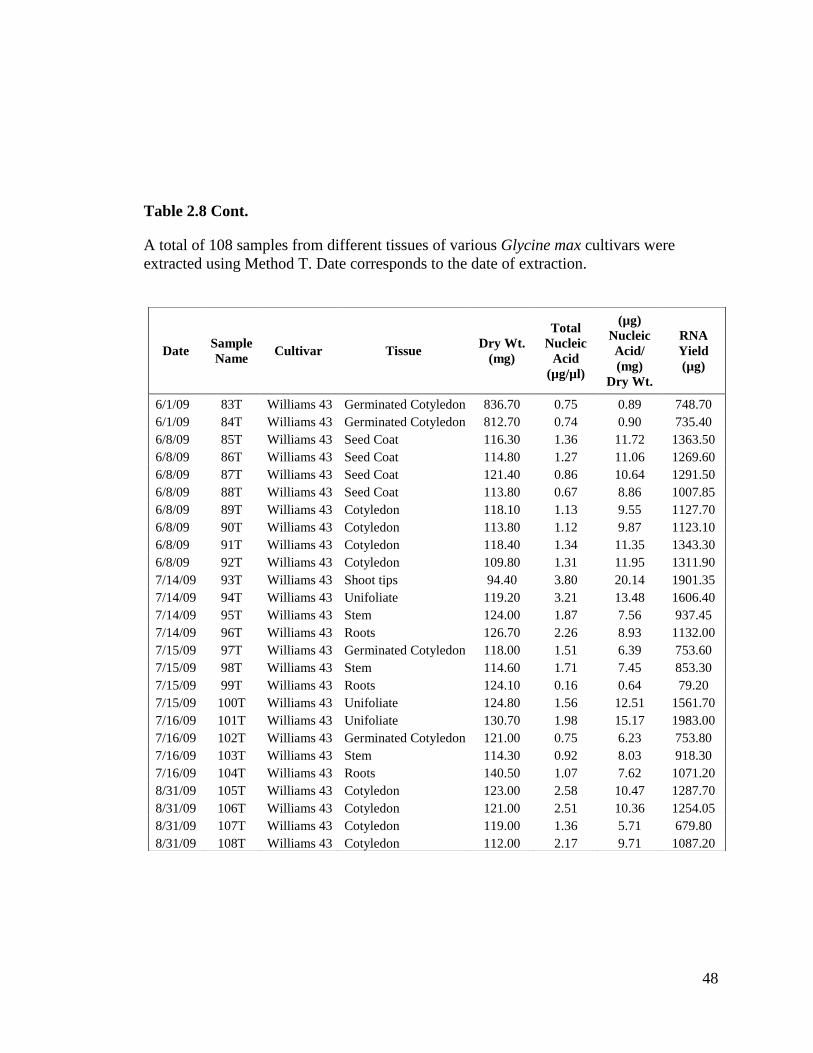
48
Table 2.8 Cont.
A total of 108 samples from different tissues of various Glycine max cultivars were
extracted using Method T. Date corresponds to the date of extraction.
Date
Sample
Name Cultivar Tissue
Dry Wt.
(mg)
Total
Nucleic
Acid
(µg/µl)
(µg)
Nucleic
Acid/
(mg)
Dry Wt.
RNA
Yield
(µg)
6/1/09 83T Williams 43 Germinated Cotyledon 836.70 0.75 0.89 748.70
6/1/09 84T Williams 43 Germinated Cotyledon 812.70 0.74 0.90 735.40
6/8/09 85T Williams 43 Seed Coat 116.30 1.36 11.72 1363.50
6/8/09 86T Williams 43 Seed Coat 114.80 1.27 11.06 1269.60
6/8/09 87T Williams 43 Seed Coat 121.40 0.86 10.64 1291.50
6/8/09 88T Williams 43 Seed Coat 113.80 0.67 8.86 1007.85
6/8/09 89T Williams 43 Cotyledon 118.10 1.13 9.55 1127.70
6/8/09 90T Williams 43 Cotyledon 113.80 1.12 9.87 1123.10
6/8/09 91T Williams 43 Cotyledon 118.40 1.34 11.35 1343.30
6/8/09 92T Williams 43 Cotyledon 109.80 1.31 11.95 1311.90
7/14/09 93T Williams 43 Shoot tips 94.40 3.80 20.14 1901.35
7/14/09 94T Williams 43 Unifoliate 119.20 3.21 13.48 1606.40
7/14/09 95T Williams 43 Stem 124.00 1.87 7.56 937.45
7/14/09 96T Williams 43 Roots 126.70 2.26 8.93 1132.00
7/15/09 97T Williams 43 Germinated Cotyledon 118.00 1.51 6.39 753.60
7/15/09 98T Williams 43 Stem 114.60 1.71 7.45 853.30
7/15/09 99T Williams 43 Roots 124.10 0.16 0.64 79.20
7/15/09 100T Williams 43 Unifoliate 124.80 1.56 12.51 1561.70
7/16/09 101T Williams 43 Unifoliate 130.70 1.98 15.17 1983.00
7/16/09 102T Williams 43 Germinated Cotyledon 121.00 0.75 6.23 753.80
7/16/09 103T Williams 43 Stem 114.30 0.92 8.03 918.30
7/16/09 104T Williams 43 Roots 140.50 1.07 7.62 1071.20
8/31/09 105T Williams 43 Cotyledon 123.00 2.58 10.47 1287.70
8/31/09 106T Williams 43 Cotyledon 121.00 2.51 10.36 1254.05
8/31/09 107T Williams 43 Cotyledon 119.00 1.36 5.71 679.80
8/31/09 108T Williams 43 Cotyledon 112.00 2.17 9.71 1087.20
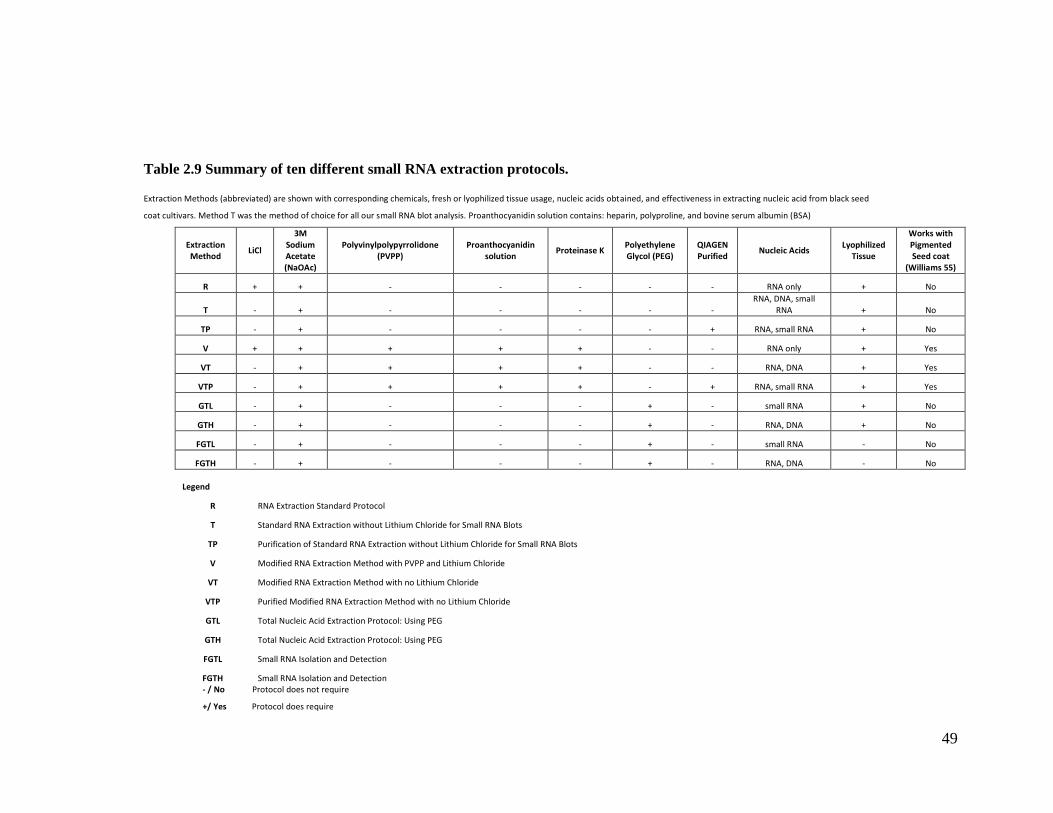
49
Table 2.9 Summary of ten different small RNA extraction protocols.
Extraction Methods (abbreviated) are shown with corresponding chemicals, fresh or lyophilized tissue usage, nucleic acids obtained, and effectiveness in extracting nucleic acid from black seed
coat cultivars. Method T was the method of choice for all our small RNA blot analysis. Proanthocyanidin solution contains: heparin, polyproline, and bovine serum albumin (BSA)
Extraction Method
LiCl
3M Sodium Acetate (NaOAc)
Polyvinylpolypyrrolidone (PVPP)
Proanthocyanidin solution
Proteinase K Polyethylene Glycol (PEG)
QIAGEN Purified
Nucleic Acids Lyophilized
Tissue
Works with Pigmented Seed coat
(Williams 55)
R + + - - - - - RNA only + No
T - + - - - - - RNA, DNA, small
RNA + No
TP - + - - - - + RNA, small RNA + No
V + + + + + - - RNA only + Yes
VT - + + + + - - RNA, DNA + Yes
VTP - + + + + - + RNA, small RNA + Yes
GTL - + - - - + - small RNA + No
GTH - + - - - + - RNA, DNA + No
FGTL - + - - - + - small RNA - No
FGTH - + - - - + - RNA, DNA - No
Legend
R RNA Extraction Standard Protocol
T Standard RNA Extraction without Lithium Chloride for Small RNA Blots
TP Purification of Standard RNA Extraction without Lithium Chloride for Small RNA Blots
V Modified RNA Extraction Method with PVPP and Lithium Chloride
VT Modified RNA Extraction Method with no Lithium Chloride
VTP Purified Modified RNA Extraction Method with no Lithium Chloride
GTL Total Nucleic Acid Extraction Protocol: Using PEG
GTH Total Nucleic Acid Extraction Protocol: Using PEG
FGTL Small RNA Isolation and Detection
FGTH Small RNA Isolation and Detection
- / No Protocol does not require
+/ Yes Protocol does require
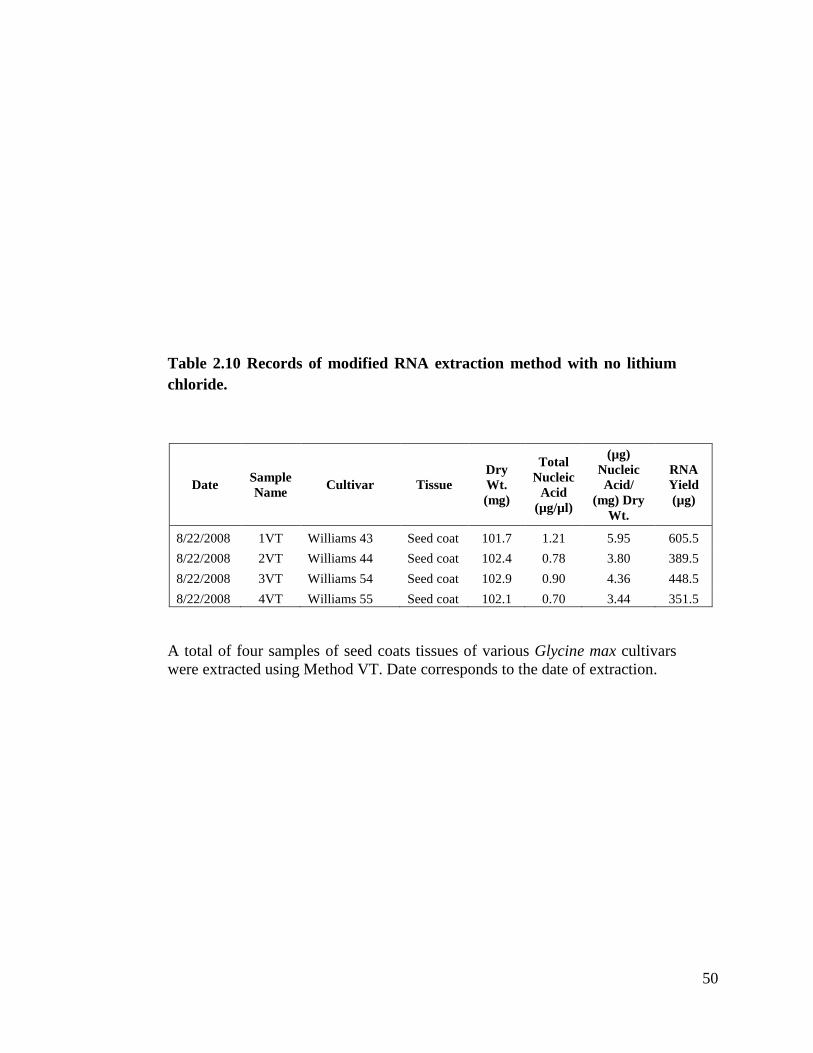
50
Table 2.10 Records of modified RNA extraction method with no lithium
chloride.
Date Sample
Name Cultivar Tissue
Dry
Wt.
(mg)
Total
Nucleic
Acid
(µg/µl)
(µg)
Nucleic
Acid/
(mg) Dry
Wt.
RNA
Yield
(µg)
8/22/2008 1VT Williams 43 Seed coat 101.7 1.21 5.95 605.5
8/22/2008 2VT Williams 44 Seed coat 102.4 0.78 3.80 389.5
8/22/2008 3VT Williams 54 Seed coat 102.9 0.90 4.36 448.5
8/22/2008 4VT Williams 55 Seed coat 102.1 0.70 3.44 351.5
A total of four samples of seed coats tissues of various Glycine max cultivars
were extracted using Method VT. Date corresponds to the date of extraction.
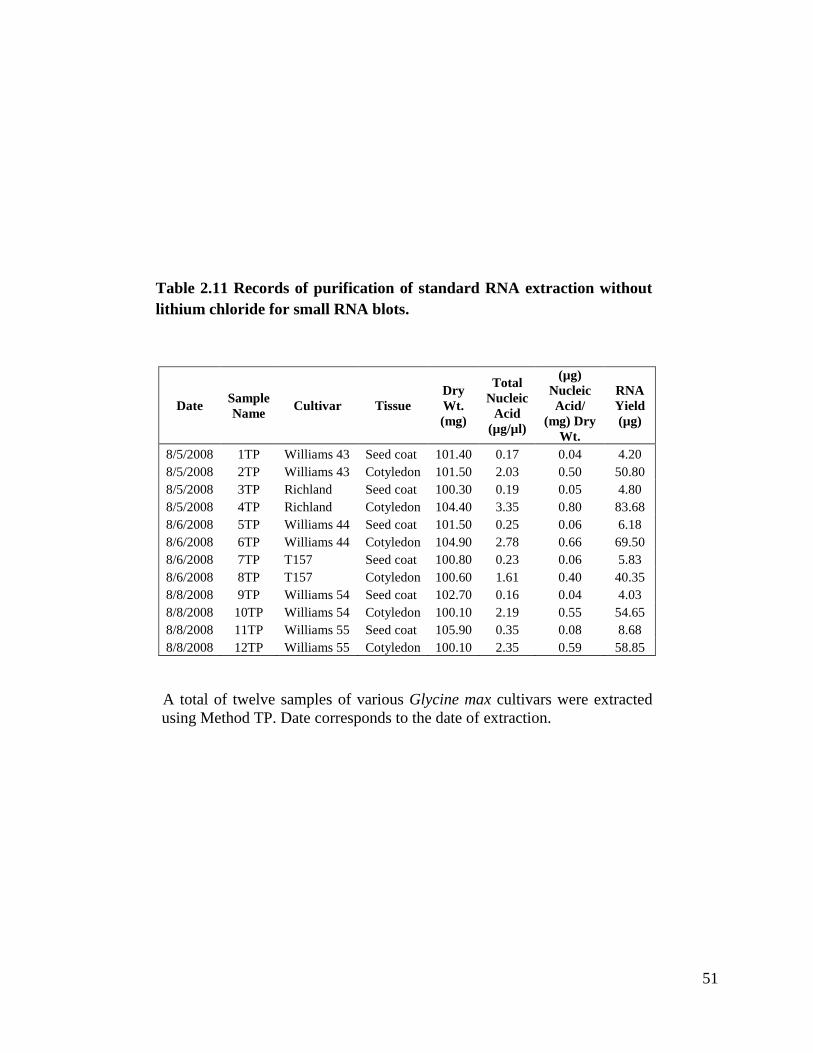
51
Table 2.11 Records of purification of standard RNA extraction without
lithium chloride for small RNA blots.
Date Sample
Name Cultivar Tissue
Dry
Wt.
(mg)
Total
Nucleic
Acid
(µg/µl)
(µg)
Nucleic
Acid/
(mg) Dry
Wt.
RNA
Yield
(µg)
8/5/2008 1TP Williams 43 Seed coat 101.40 0.17 0.04 4.20
8/5/2008 2TP Williams 43 Cotyledon 101.50 2.03 0.50 50.80
8/5/2008 3TP Richland Seed coat 100.30 0.19 0.05 4.80
8/5/2008 4TP Richland Cotyledon 104.40 3.35 0.80 83.68
8/6/2008 5TP Williams 44 Seed coat 101.50 0.25 0.06 6.18
8/6/2008 6TP Williams 44 Cotyledon 104.90 2.78 0.66 69.50
8/6/2008 7TP T157 Seed coat 100.80 0.23 0.06 5.83
8/6/2008 8TP T157 Cotyledon 100.60 1.61 0.40 40.35
8/8/2008 9TP Williams 54 Seed coat 102.70 0.16 0.04 4.03
8/8/2008 10TP Williams 54 Cotyledon 100.10 2.19 0.55 54.65
8/8/2008 11TP Williams 55 Seed coat 105.90 0.35 0.08 8.68
8/8/2008 12TP Williams 55 Cotyledon 100.10 2.35 0.59 58.85
A total of twelve samples of various Glycine max cultivars were extracted
using Method TP. Date corresponds to the date of extraction.
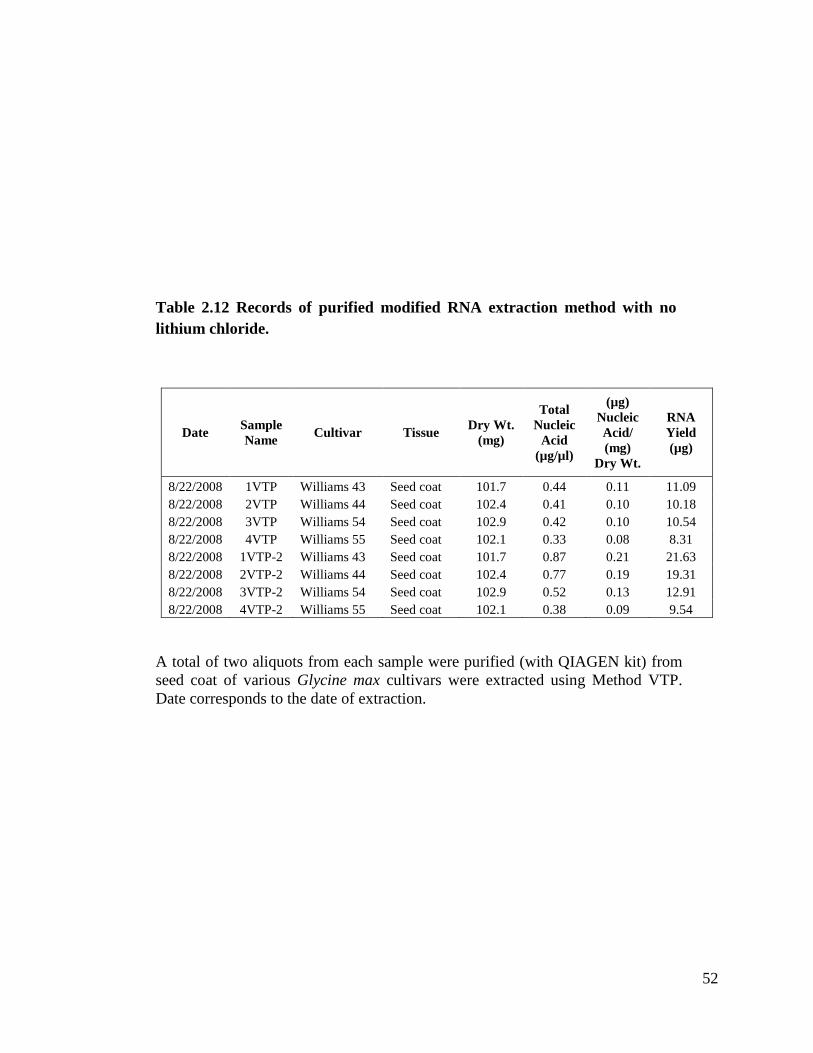
52
Table 2.12 Records of purified modified RNA extraction method with no
lithium chloride.
Date Sample
Name Cultivar Tissue
Dry Wt.
(mg)
Total
Nucleic
Acid
(µg/µl)
(µg)
Nucleic
Acid/
(mg)
Dry Wt.
RNA
Yield
(µg)
8/22/2008 1VTP Williams 43 Seed coat 101.7 0.44 0.11 11.09
8/22/2008 2VTP Williams 44 Seed coat 102.4 0.41 0.10 10.18
8/22/2008 3VTP Williams 54 Seed coat 102.9 0.42 0.10 10.54
8/22/2008 4VTP Williams 55 Seed coat 102.1 0.33 0.08 8.31
8/22/2008 1VTP-2 Williams 43 Seed coat 101.7 0.87 0.21 21.63
8/22/2008 2VTP-2 Williams 44 Seed coat 102.4 0.77 0.19 19.31
8/22/2008 3VTP-2 Williams 54 Seed coat 102.9 0.52 0.13 12.91
8/22/2008 4VTP-2 Williams 55 Seed coat 102.1 0.38 0.09 9.54
A total of two aliquots from each sample were purified (with QIAGEN kit) from
seed coat of various Glycine max cultivars were extracted using Method VTP.
Date corresponds to the date of extraction.
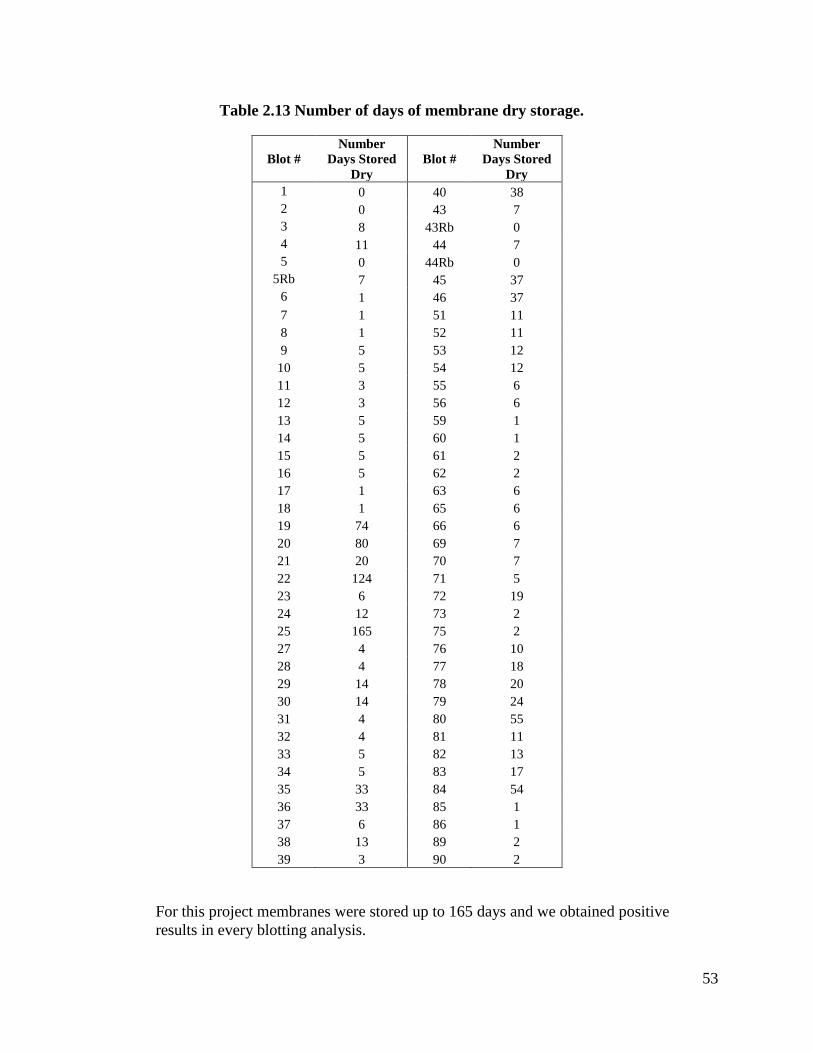
53
Table 2.13 Number of days of membrane dry storage.
Blot #
Number
Days Stored
Dry
Blot #
Number
Days Stored
Dry
1 0 40 38
2 0 43 7
3 8 43Rb 0
4 11 44 7
5 0 44Rb 0
5Rb 7 45 37
6 1 46 37
7 1 51 11
8 1 52 11
9 5 53 12
10 5 54 12
11 3 55 6
12 3 56 6
13 5 59 1
14 5 60 1
15 5 61 2
16 5 62 2
17 1 63 6
18 1 65 6
19 74 66 6
20 80 69 7
21 20 70 7
22 124 71 5
23 6 72 19
24 12 73 2
25 165 75 2
27 4 76 10
28 4 77 18
29 14 78 20
30 14 79 24
31 4 80 55
32 4 81 11
33 5 82 13
34 5 83 17
35 33 84 54
36 33 85 1
37 6 86 1
38 13 89 2
39 3 90 2
For this project membranes were stored up to 165 days and we obtained positive
results in every blotting analysis.
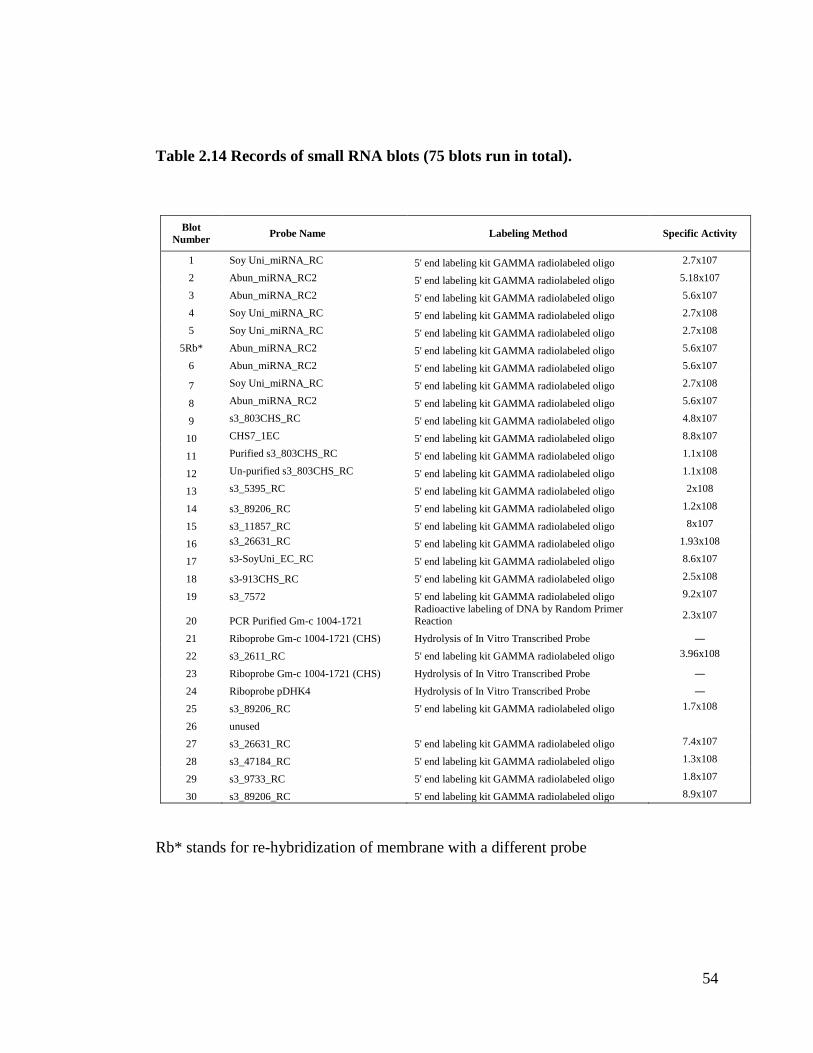
54
Table 2.14 Records of small RNA blots (75 blots run in total).
Blot
Number Probe Name Labeling Method Specific Activity
1 Soy Uni_miRNA_RC 5' end labeling kit GAMMA radiolabeled oligo 2.7x10⁷
2 Abun_miRNA_RC2 5' end labeling kit GAMMA radiolabeled oligo 5.18x10⁷
3 Abun_miRNA_RC2 5' end labeling kit GAMMA radiolabeled oligo 5.6x10⁷
4 Soy Uni_miRNA_RC 5' end labeling kit GAMMA radiolabeled oligo 2.7x10⁸
5 Soy Uni_miRNA_RC 5' end labeling kit GAMMA radiolabeled oligo 2.7x10⁸
5Rb* Abun_miRNA_RC2 5' end labeling kit GAMMA radiolabeled oligo 5.6x10⁷
6 Abun_miRNA_RC2 5' end labeling kit GAMMA radiolabeled oligo 5.6x10⁷
7 Soy Uni_miRNA_RC 5' end labeling kit GAMMA radiolabeled oligo 2.7x10⁸
8 Abun_miRNA_RC2 5' end labeling kit GAMMA radiolabeled oligo 5.6x10⁷
9 s3_803CHS_RC 5' end labeling kit GAMMA radiolabeled oligo 4.8x10⁷
10 CHS7_1EC 5' end labeling kit GAMMA radiolabeled oligo 8.8x10⁷
11 Purified s3_803CHS_RC 5' end labeling kit GAMMA radiolabeled oligo 1.1x10⁸
12 Un-purified s3_803CHS_RC 5' end labeling kit GAMMA radiolabeled oligo 1.1x10⁸
13 s3_5395_RC 5' end labeling kit GAMMA radiolabeled oligo 2x10⁸
14 s3_89206_RC 5' end labeling kit GAMMA radiolabeled oligo 1.2x10⁸
15 s3_11857_RC 5' end labeling kit GAMMA radiolabeled oligo 8x10⁷
16 s3_26631_RC 5' end labeling kit GAMMA radiolabeled oligo 1.93x10⁸
17 s3-SoyUni_EC_RC 5' end labeling kit GAMMA radiolabeled oligo 8.6x10⁷
18 s3-913CHS_RC 5' end labeling kit GAMMA radiolabeled oligo 2.5x10⁸
19 s3_7572 5' end labeling kit GAMMA radiolabeled oligo 9.2x10⁷
20 PCR Purified Gm-c 1004-1721 Radioactive labeling of DNA by Random Primer Reaction
2.3x10⁷
21 Riboprobe Gm-c 1004-1721 (CHS) Hydrolysis of In Vitro Transcribed Probe ―
22 s3_2611_RC 5' end labeling kit GAMMA radiolabeled oligo 3.96x10⁸
23 Riboprobe Gm-c 1004-1721 (CHS) Hydrolysis of In Vitro Transcribed Probe ―
24 Riboprobe pDHK4 Hydrolysis of In Vitro Transcribed Probe ―
25 s3_89206_RC 5' end labeling kit GAMMA radiolabeled oligo 1.7x10⁸
26 unused
27 s3_26631_RC 5' end labeling kit GAMMA radiolabeled oligo 7.4x10⁷
28 s3_47184_RC 5' end labeling kit GAMMA radiolabeled oligo 1.3x10⁸
29 s3_9733_RC 5' end labeling kit GAMMA radiolabeled oligo 1.8x10⁷
30 s3_89206_RC 5' end labeling kit GAMMA radiolabeled oligo 8.9x10⁷
Rb* stands for re-hybridization of membrane with a different probe
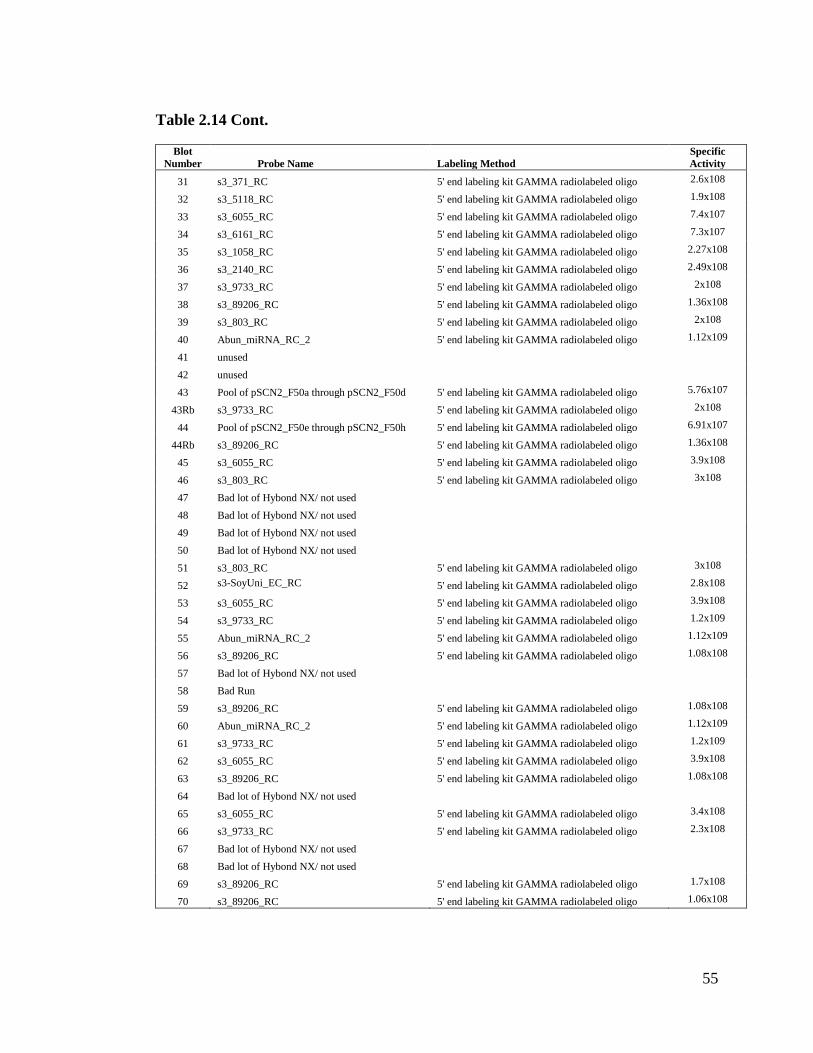
55
Table 2.14 Cont.
Blot
Number Probe Name Labeling Method
Specific
Activity
31 s3_371_RC 5' end labeling kit GAMMA radiolabeled oligo 2.6x10⁸
32 s3_5118_RC 5' end labeling kit GAMMA radiolabeled oligo 1.9x10⁸
33 s3_6055_RC 5' end labeling kit GAMMA radiolabeled oligo 7.4x10⁷
34 s3_6161_RC 5' end labeling kit GAMMA radiolabeled oligo 7.3x10⁷
35 s3_1058_RC 5' end labeling kit GAMMA radiolabeled oligo 2.27x10⁸
36 s3_2140_RC 5' end labeling kit GAMMA radiolabeled oligo 2.49x10⁸
37 s3_9733_RC 5' end labeling kit GAMMA radiolabeled oligo 2x10⁸
38 s3_89206_RC 5' end labeling kit GAMMA radiolabeled oligo 1.36x10⁸
39 s3_803_RC 5' end labeling kit GAMMA radiolabeled oligo 2x10⁸
40 Abun_miRNA_RC_2 5' end labeling kit GAMMA radiolabeled oligo 1.12x10⁹
41 unused
42 unused
43 Pool of pSCN2_F50a through pSCN2_F50d 5' end labeling kit GAMMA radiolabeled oligo 5.76x10⁷
43Rb s3_9733_RC 5' end labeling kit GAMMA radiolabeled oligo 2x10⁸
44 Pool of pSCN2_F50e through pSCN2_F50h 5' end labeling kit GAMMA radiolabeled oligo 6.91x10⁷
44Rb s3_89206_RC 5' end labeling kit GAMMA radiolabeled oligo 1.36x10⁸
45 s3_6055_RC 5' end labeling kit GAMMA radiolabeled oligo 3.9x10⁸
46 s3_803_RC 5' end labeling kit GAMMA radiolabeled oligo 3x10⁸
47 Bad lot of Hybond NX/ not used
48 Bad lot of Hybond NX/ not used
49 Bad lot of Hybond NX/ not used
50 Bad lot of Hybond NX/ not used
51 s3_803_RC 5' end labeling kit GAMMA radiolabeled oligo 3x10⁸
52 s3-SoyUni_EC_RC 5' end labeling kit GAMMA radiolabeled oligo 2.8x10⁸
53 s3_6055_RC 5' end labeling kit GAMMA radiolabeled oligo 3.9x10⁸
54 s3_9733_RC 5' end labeling kit GAMMA radiolabeled oligo 1.2x10⁹
55 Abun_miRNA_RC_2 5' end labeling kit GAMMA radiolabeled oligo 1.12x10⁹
56 s3_89206_RC 5' end labeling kit GAMMA radiolabeled oligo 1.08x10⁸
57 Bad lot of Hybond NX/ not used
58 Bad Run
59 s3_89206_RC 5' end labeling kit GAMMA radiolabeled oligo 1.08x10⁸
60 Abun_miRNA_RC_2 5' end labeling kit GAMMA radiolabeled oligo 1.12x10⁹
61 s3_9733_RC 5' end labeling kit GAMMA radiolabeled oligo 1.2x10⁹
62 s3_6055_RC 5' end labeling kit GAMMA radiolabeled oligo 3.9x10⁸
63 s3_89206_RC 5' end labeling kit GAMMA radiolabeled oligo 1.08x10⁸
64 Bad lot of Hybond NX/ not used
65 s3_6055_RC 5' end labeling kit GAMMA radiolabeled oligo 3.4x10⁸
66 s3_9733_RC 5' end labeling kit GAMMA radiolabeled oligo 2.3x10⁸
67 Bad lot of Hybond NX/ not used
68 Bad lot of Hybond NX/ not used
69 s3_89206_RC 5' end labeling kit GAMMA radiolabeled oligo 1.7x10⁸
70 s3_89206_RC 5' end labeling kit GAMMA radiolabeled oligo 1.06x10⁸
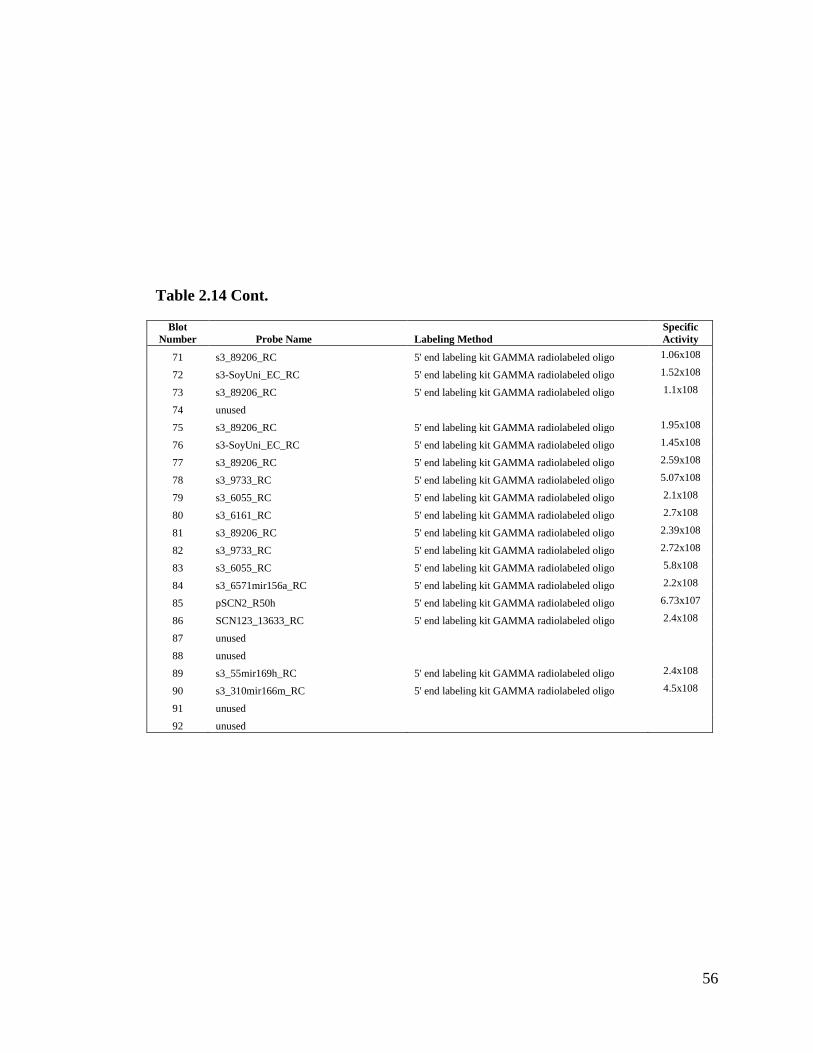
56
Table 2.14 Cont.
Blot
Number Probe Name Labeling Method
Specific
Activity
71 s3_89206_RC 5' end labeling kit GAMMA radiolabeled oligo 1.06x10⁸
72 s3-SoyUni_EC_RC 5' end labeling kit GAMMA radiolabeled oligo 1.52x10⁸
73 s3_89206_RC 5' end labeling kit GAMMA radiolabeled oligo 1.1x10⁸
74 unused
75 s3_89206_RC 5' end labeling kit GAMMA radiolabeled oligo 1.95x10⁸
76 s3-SoyUni_EC_RC 5' end labeling kit GAMMA radiolabeled oligo 1.45x10⁸
77 s3_89206_RC 5' end labeling kit GAMMA radiolabeled oligo 2.59x10⁸
78 s3_9733_RC 5' end labeling kit GAMMA radiolabeled oligo 5.07x10⁸
79 s3_6055_RC 5' end labeling kit GAMMA radiolabeled oligo 2.1x10⁸
80 s3_6161_RC 5' end labeling kit GAMMA radiolabeled oligo 2.7x10⁸
81 s3_89206_RC 5' end labeling kit GAMMA radiolabeled oligo 2.39x10⁸
82 s3_9733_RC 5' end labeling kit GAMMA radiolabeled oligo 2.72x10⁸
83 s3_6055_RC 5' end labeling kit GAMMA radiolabeled oligo 5.8x10⁸
84 s3_6571mir156a_RC 5' end labeling kit GAMMA radiolabeled oligo 2.2x10⁸
85 pSCN2_R50h 5' end labeling kit GAMMA radiolabeled oligo 6.73x10⁷
86 SCN123_13633_RC 5' end labeling kit GAMMA radiolabeled oligo 2.4x10⁸
87 unused
88 unused
89 s3_55mir169h_RC 5' end labeling kit GAMMA radiolabeled oligo 2.4x10⁸
90 s3_310mir166m_RC 5' end labeling kit GAMMA radiolabeled oligo 4.5x10⁸
91 unused
92 unused
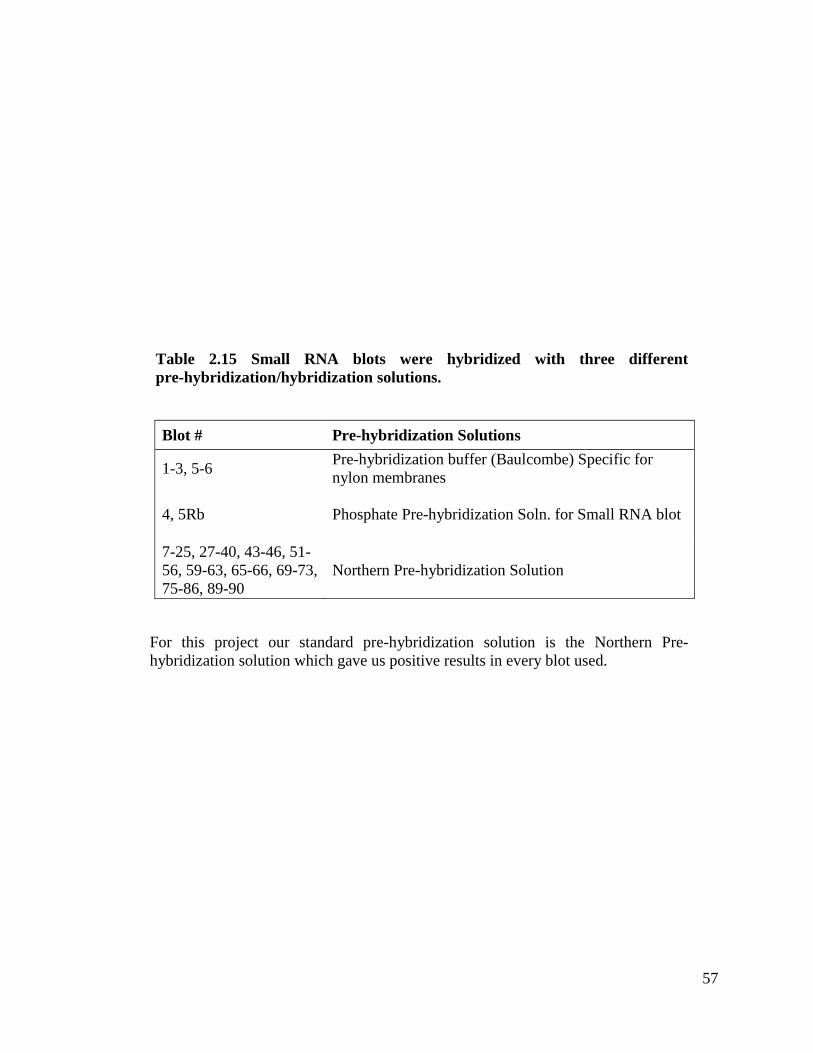
57
Table 2.15 Small RNA blots were hybridized with three different
pre-hybridization/hybridization solutions.
Blot # Pre-hybridization Solutions
1-3, 5-6 Pre-hybridization buffer (Baulcombe) Specific for
nylon membranes
4, 5Rb
Phosphate Pre-hybridization Soln. for Small RNA blot
7-25, 27-40, 43-46, 51-
56, 59-63, 65-66, 69-73,
75-86, 89-90
Northern Pre-hybridization Solution
For this project our standard pre-hybridization solution is the Northern Pre-
hybridization solution which gave us positive results in every blot used.
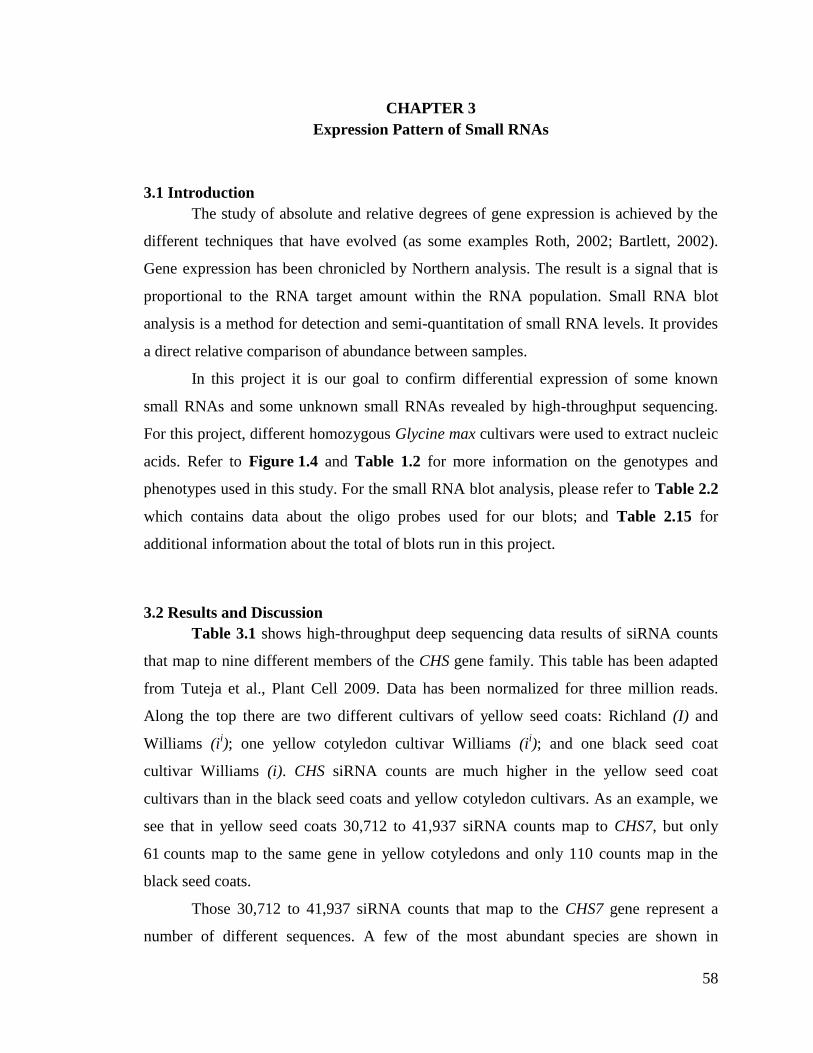
58
CHAPTER 3
Expression Pattern of Small RNAs
3.1 Introduction
The study of absolute and relative degrees of gene expression is achieved by the
different techniques that have evolved (as some examples Roth, 2002; Bartlett, 2002).
Gene expression has been chronicled by Northern analysis. The result is a signal that is
proportional to the RNA target amount within the RNA population. Small RNA blot
analysis is a method for detection and semi-quantitation of small RNA levels. It provides
a direct relative comparison of abundance between samples.
In this project it is our goal to confirm differential expression of some known
small RNAs and some unknown small RNAs revealed by high-throughput sequencing.
For this project, different homozygous Glycine max cultivars were used to extract nucleic
acids. Refer to Figure 1.4 and Table 1.2 for more information on the genotypes and
phenotypes used in this study. For the small RNA blot analysis, please refer to Table 2.2
which contains data about the oligo probes used for our blots; and Table 2.15 for
additional information about the total of blots run in this project.
3.2 Results and Discussion
Table 3.1 shows high-throughput deep sequencing data results of siRNA counts
that map to nine different members of the CHS gene family. This table has been adapted
from Tuteja et al., Plant Cell 2009. Data has been normalized for three million reads.
Along the top there are two different cultivars of yellow seed coats: Richland (I) and
Williams (ii); one yellow cotyledon cultivar Williams (i
i); and one black seed coat
cultivar Williams (i). CHS siRNA counts are much higher in the yellow seed coat
cultivars than in the black seed coats and yellow cotyledon cultivars. As an example, we
see that in yellow seed coats 30,712 to 41,937 siRNA counts map to CHS7, but only
61 counts map to the same gene in yellow cotyledons and only 110 counts map in the
black seed coats.
Those 30,712 to 41,937 siRNA counts that map to the CHS7 gene represent a
number of different sequences. A few of the most abundant species are shown in
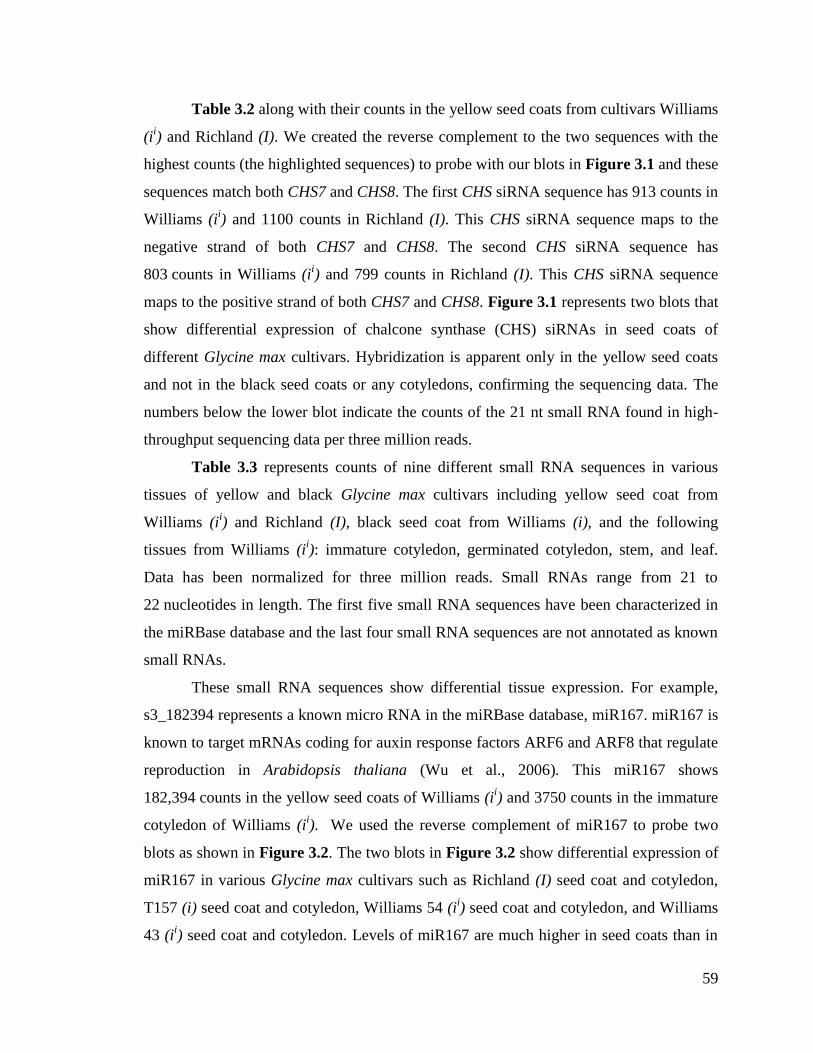
59
Table 3.2 along with their counts in the yellow seed coats from cultivars Williams
(ii) and Richland (I). We created the reverse complement to the two sequences with the
highest counts (the highlighted sequences) to probe with our blots in Figure 3.1 and these
sequences match both CHS7 and CHS8. The first CHS siRNA sequence has 913 counts in
Williams (ii) and 1100 counts in Richland (I). This CHS siRNA sequence maps to the
negative strand of both CHS7 and CHS8. The second CHS siRNA sequence has
803 counts in Williams (ii) and 799 counts in Richland (I). This CHS siRNA sequence
maps to the positive strand of both CHS7 and CHS8. Figure 3.1 represents two blots that
show differential expression of chalcone synthase (CHS) siRNAs in seed coats of
different Glycine max cultivars. Hybridization is apparent only in the yellow seed coats
and not in the black seed coats or any cotyledons, confirming the sequencing data. The
numbers below the lower blot indicate the counts of the 21 nt small RNA found in high-
throughput sequencing data per three million reads.
Table 3.3 represents counts of nine different small RNA sequences in various
tissues of yellow and black Glycine max cultivars including yellow seed coat from
Williams (ii) and Richland (I), black seed coat from Williams (i), and the following
tissues from Williams (ii): immature cotyledon, germinated cotyledon, stem, and leaf.
Data has been normalized for three million reads. Small RNAs range from 21 to
22 nucleotides in length. The first five small RNA sequences have been characterized in
the miRBase database and the last four small RNA sequences are not annotated as known
small RNAs.
These small RNA sequences show differential tissue expression. For example,
s3_182394 represents a known micro RNA in the miRBase database, miR167. miR167 is
known to target mRNAs coding for auxin response factors ARF6 and ARF8 that regulate
reproduction in Arabidopsis thaliana (Wu et al., 2006). This miR167 shows
182,394 counts in the yellow seed coats of Williams (ii) and 3750 counts in the immature
cotyledon of Williams (ii). We used the reverse complement of miR167 to probe two
blots as shown in Figure 3.2. The two blots in Figure 3.2 show differential expression of
miR167 in various Glycine max cultivars such as Richland (I) seed coat and cotyledon,
T157 (i) seed coat and cotyledon, Williams 54 (ii) seed coat and cotyledon, and Williams
43 (ii) seed coat and cotyledon. Levels of miR167 are much higher in seed coats than in
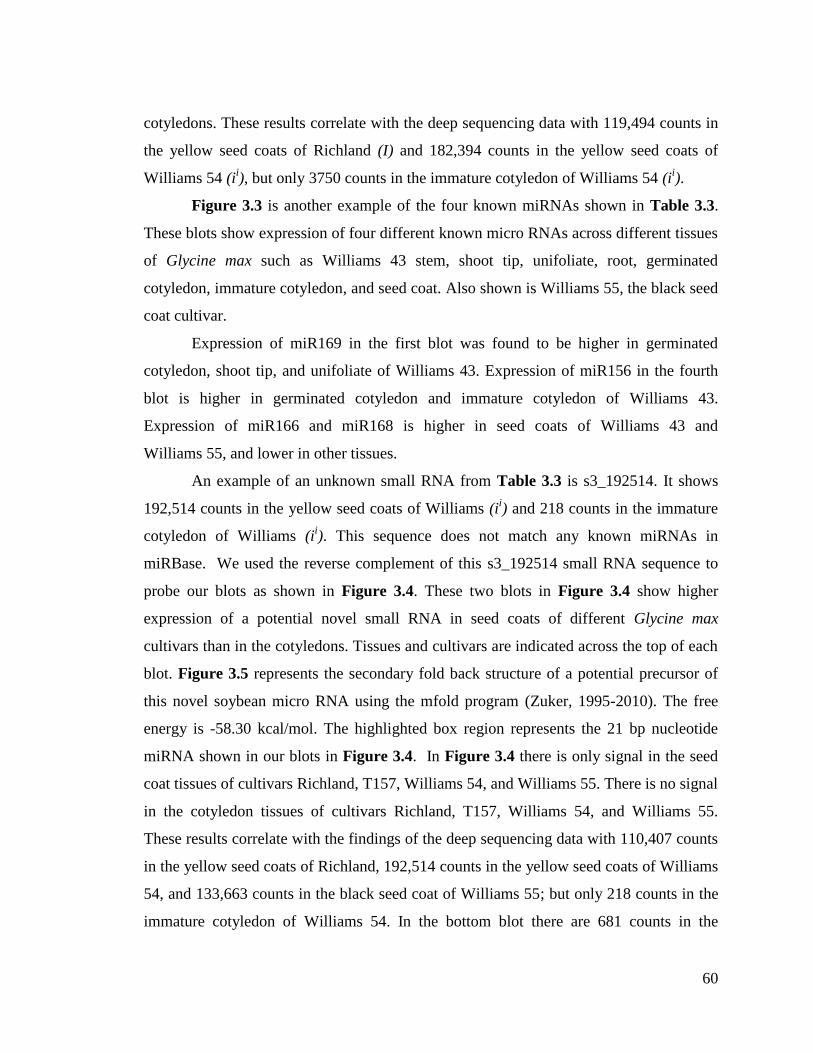
60
cotyledons. These results correlate with the deep sequencing data with 119,494 counts in
the yellow seed coats of Richland (I) and 182,394 counts in the yellow seed coats of
Williams 54 (ii), but only 3750 counts in the immature cotyledon of Williams 54 (i
i).
Figure 3.3 is another example of the four known miRNAs shown in Table 3.3.
These blots show expression of four different known micro RNAs across different tissues
of Glycine max such as Williams 43 stem, shoot tip, unifoliate, root, germinated
cotyledon, immature cotyledon, and seed coat. Also shown is Williams 55, the black seed
coat cultivar.
Expression of miR169 in the first blot was found to be higher in germinated
cotyledon, shoot tip, and unifoliate of Williams 43. Expression of miR156 in the fourth
blot is higher in germinated cotyledon and immature cotyledon of Williams 43.
Expression of miR166 and miR168 is higher in seed coats of Williams 43 and
Williams 55, and lower in other tissues.
An example of an unknown small RNA from Table 3.3 is s3_192514. It shows
192,514 counts in the yellow seed coats of Williams (ii) and 218 counts in the immature
cotyledon of Williams (ii). This sequence does not match any known miRNAs in
miRBase. We used the reverse complement of this s3_192514 small RNA sequence to
probe our blots as shown in Figure 3.4. These two blots in Figure 3.4 show higher
expression of a potential novel small RNA in seed coats of different Glycine max
cultivars than in the cotyledons. Tissues and cultivars are indicated across the top of each
blot. Figure 3.5 represents the secondary fold back structure of a potential precursor of
this novel soybean micro RNA using the mfold program (Zuker, 1995-2010). The free
energy is -58.30 kcal/mol. The highlighted box region represents the 21 bp nucleotide
miRNA shown in our blots in Figure 3.4. In Figure 3.4 there is only signal in the seed
coat tissues of cultivars Richland, T157, Williams 54, and Williams 55. There is no signal
in the cotyledon tissues of cultivars Richland, T157, Williams 54, and Williams 55.
These results correlate with the findings of the deep sequencing data with 110,407 counts
in the yellow seed coats of Richland, 192,514 counts in the yellow seed coats of Williams
54, and 133,663 counts in the black seed coat of Williams 55; but only 218 counts in the
immature cotyledon of Williams 54. In the bottom blot there are 681 counts in the
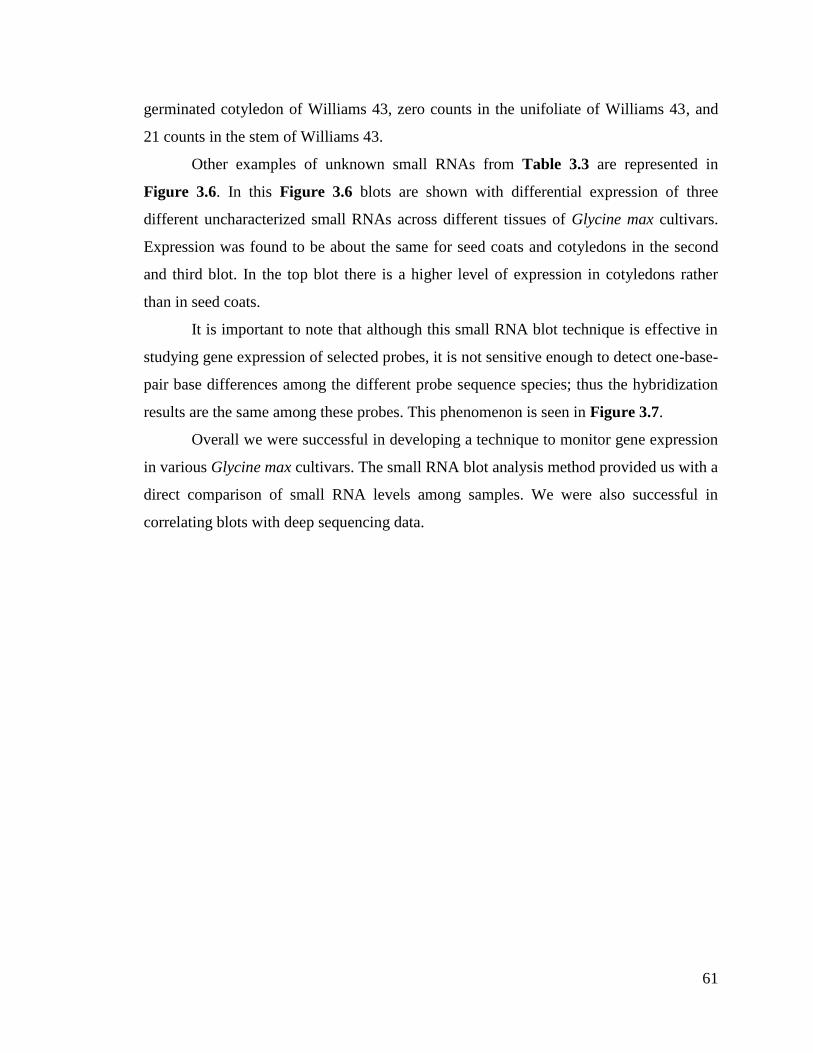
61
germinated cotyledon of Williams 43, zero counts in the unifoliate of Williams 43, and
21 counts in the stem of Williams 43.
Other examples of unknown small RNAs from Table 3.3 are represented in
Figure 3.6. In this Figure 3.6 blots are shown with differential expression of three
different uncharacterized small RNAs across different tissues of Glycine max cultivars.
Expression was found to be about the same for seed coats and cotyledons in the second
and third blot. In the top blot there is a higher level of expression in cotyledons rather
than in seed coats.
It is important to note that although this small RNA blot technique is effective in
studying gene expression of selected probes, it is not sensitive enough to detect one-base-
pair base differences among the different probe sequence species; thus the hybridization
results are the same among these probes. This phenomenon is seen in Figure 3.7.
Overall we were successful in developing a technique to monitor gene expression
in various Glycine max cultivars. The small RNA blot analysis method provided us with a
direct comparison of small RNA levels among samples. We were also successful in
correlating blots with deep sequencing data.
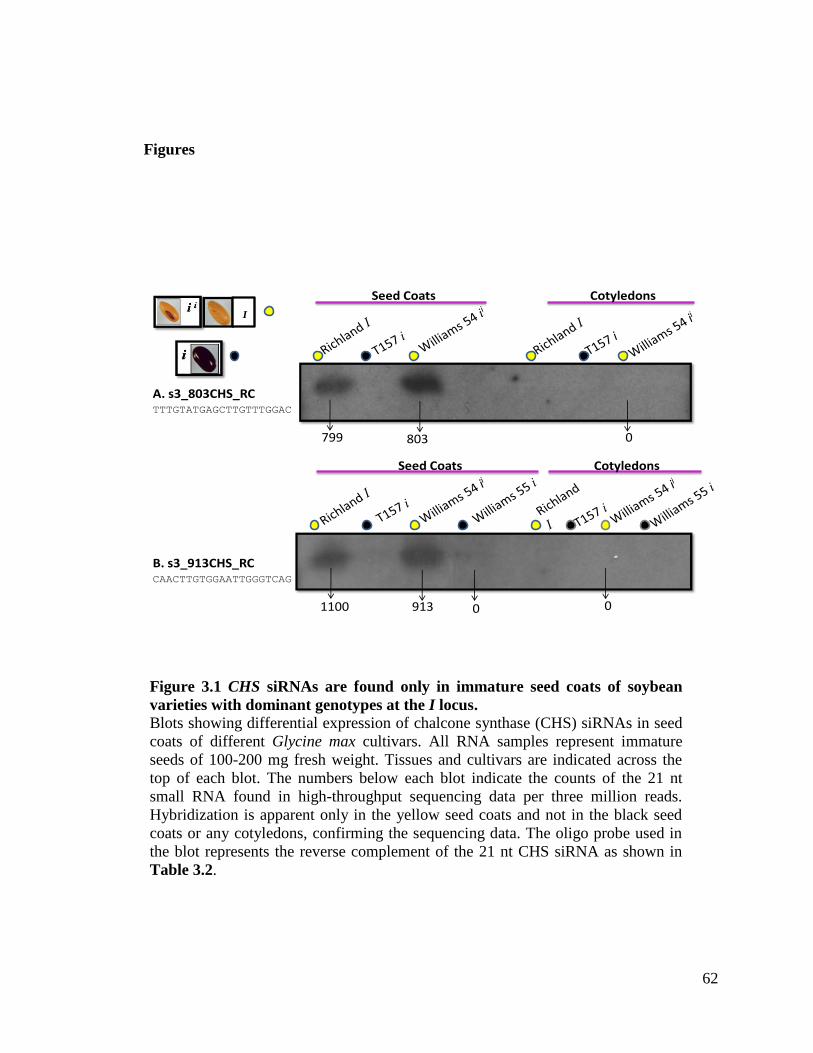
62
Figures
1100 913
CotyledonsSeed Coats
A. s3_803CHS_RC
799 803
CotyledonsSeed Coats
B. s3_913CHS_RCCAACTTGTGGAATTGGGTCAG
TTTGTATGAGCTTGTTTGGAC
0
00
I
Figure 3.1 CHS siRNAs are found only in immature seed coats of soybean
varieties with dominant genotypes at the I locus.
Blots showing differential expression of chalcone synthase (CHS) siRNAs in seed
coats of different Glycine max cultivars. All RNA samples represent immature
seeds of 100-200 mg fresh weight. Tissues and cultivars are indicated across the
top of each blot. The numbers below each blot indicate the counts of the 21 nt
small RNA found in high-throughput sequencing data per three million reads.
Hybridization is apparent only in the yellow seed coats and not in the black seed
coats or any cotyledons, confirming the sequencing data. The oligo probe used in
the blot represents the reverse complement of the 21 nt CHS siRNA as shown in
Table 3.2.
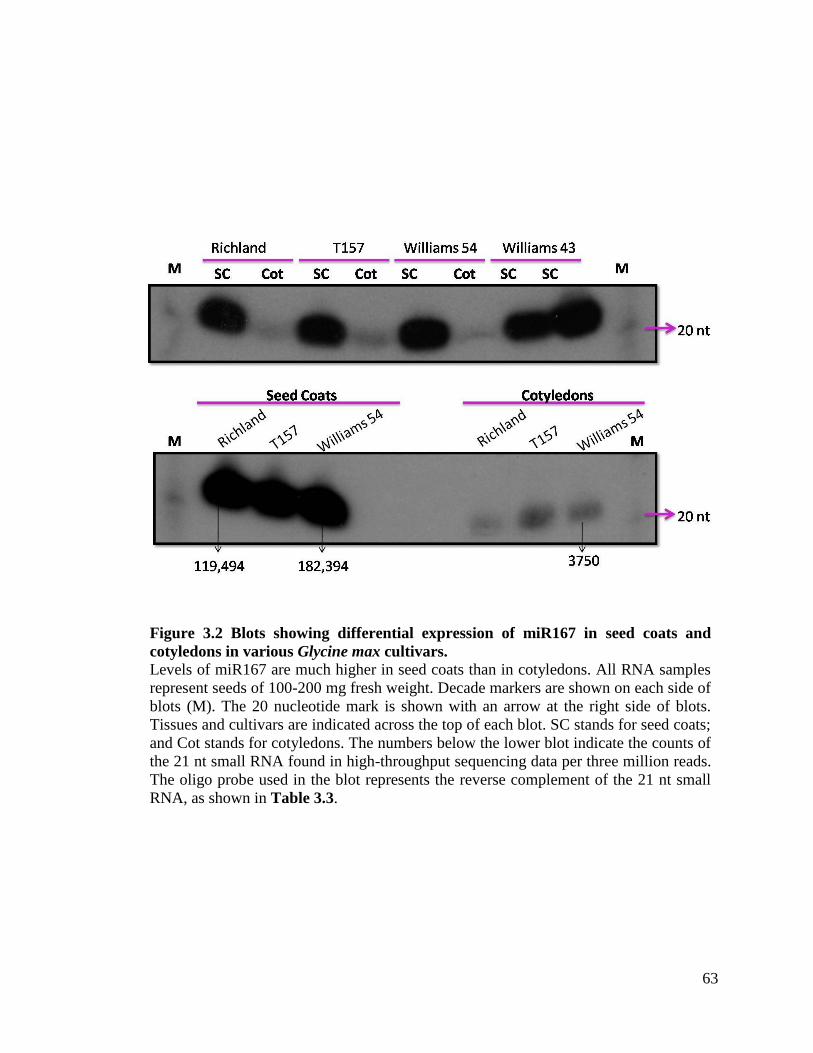
63
Figure 3.2 Blots showing differential expression of miR167 in seed coats and
cotyledons in various Glycine max cultivars. Levels of miR167 are much higher in seed coats than in cotyledons. All RNA samples
represent seeds of 100-200 mg fresh weight. Decade markers are shown on each side of
blots (M). The 20 nucleotide mark is shown with an arrow at the right side of blots.
Tissues and cultivars are indicated across the top of each blot. SC stands for seed coats;
and Cot stands for cotyledons. The numbers below the lower blot indicate the counts of
the 21 nt small RNA found in high-throughput sequencing data per three million reads.
The oligo probe used in the blot represents the reverse complement of the 21 nt small
RNA, as shown in Table 3.3.
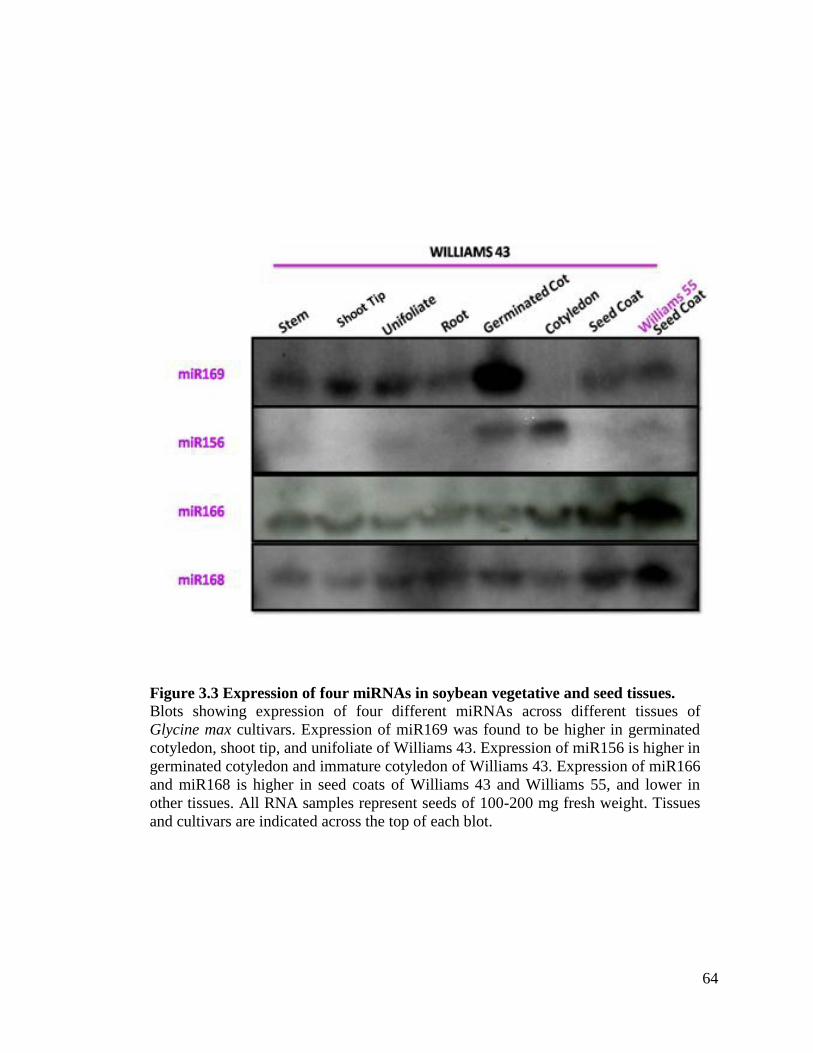
64
Figure 3.3 Expression of four miRNAs in soybean vegetative and seed tissues.
Blots showing expression of four different miRNAs across different tissues of
Glycine max cultivars. Expression of miR169 was found to be higher in germinated
cotyledon, shoot tip, and unifoliate of Williams 43. Expression of miR156 is higher in
germinated cotyledon and immature cotyledon of Williams 43. Expression of miR166
and miR168 is higher in seed coats of Williams 43 and Williams 55, and lower in
other tissues. All RNA samples represent seeds of 100-200 mg fresh weight. Tissues
and cultivars are indicated across the top of each blot.
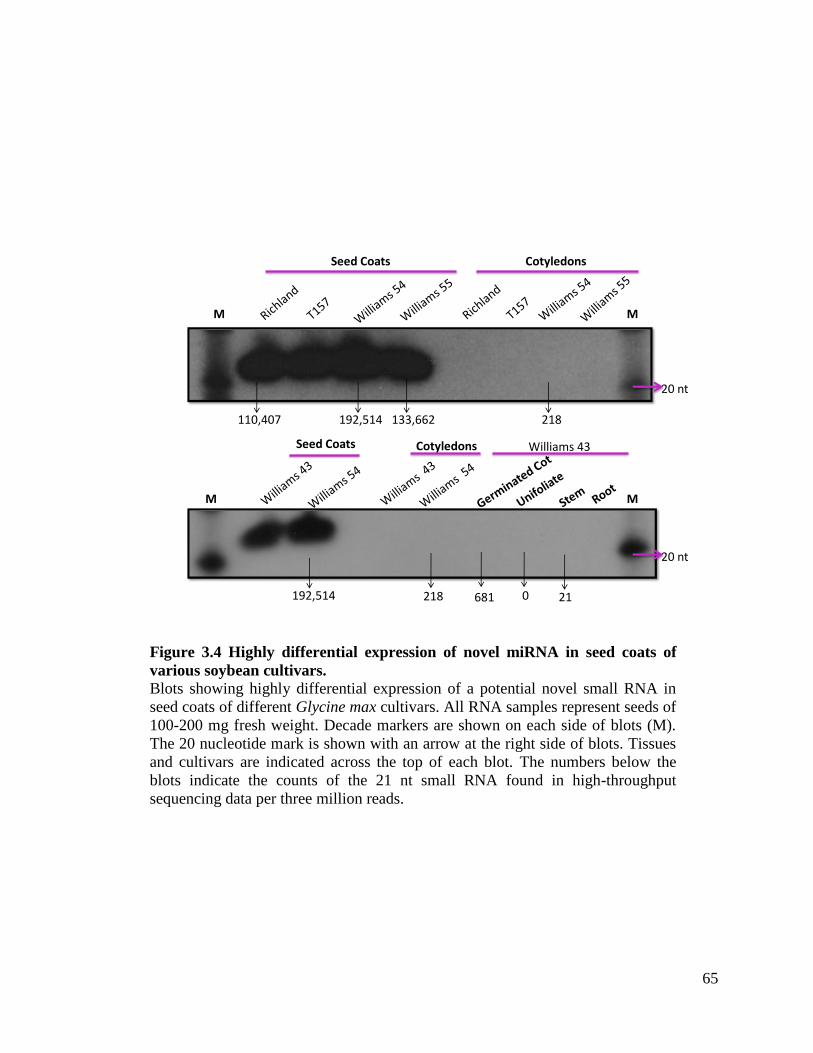
65
CotyledonsSeed Coats
M M
20 nt
20 nt
Seed Coats
M M
Cotyledons Williams 43
192,514
192,514
110,407 218133,662
218 681 210
Figure 3.4 Highly differential expression of novel miRNA in seed coats of
various soybean cultivars. Blots showing highly differential expression of a potential novel small RNA in
seed coats of different Glycine max cultivars. All RNA samples represent seeds of
100-200 mg fresh weight. Decade markers are shown on each side of blots (M).
The 20 nucleotide mark is shown with an arrow at the right side of blots. Tissues
and cultivars are indicated across the top of each blot. The numbers below the
blots indicate the counts of the 21 nt small RNA found in high-throughput
sequencing data per three million reads.
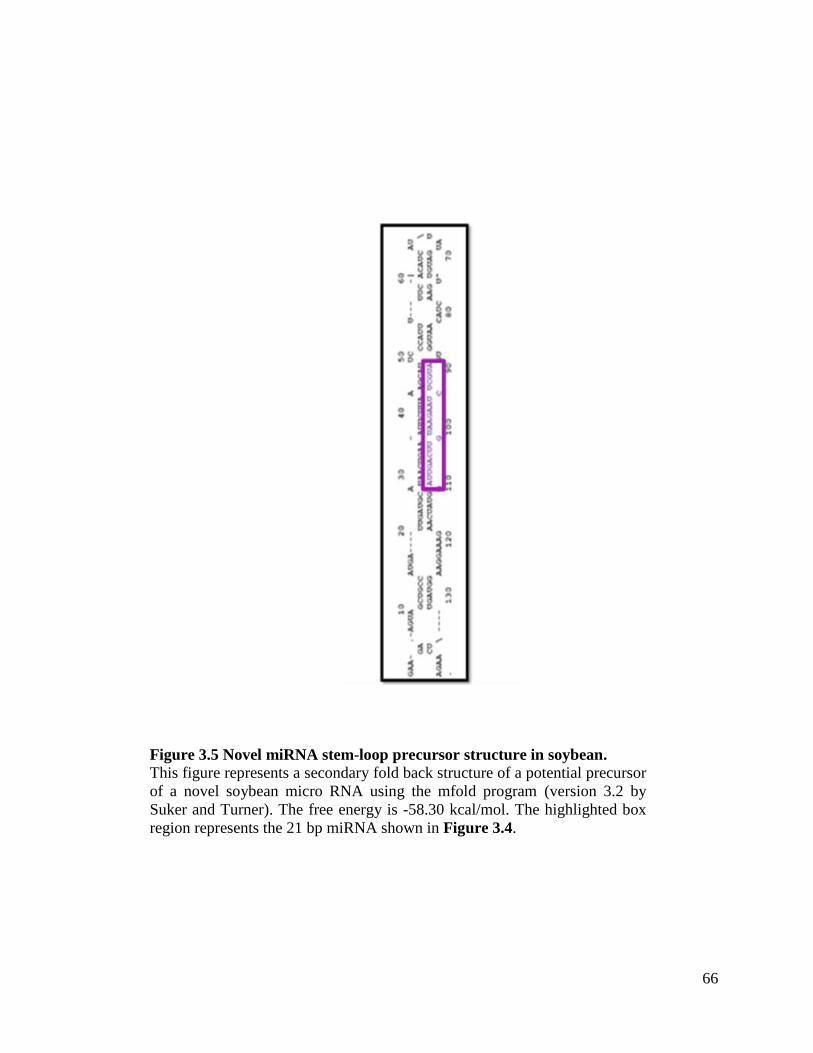
66
Figure 3.5 Novel miRNA stem-loop precursor structure in soybean. This figure represents a secondary fold back structure of a potential precursor
of a novel soybean micro RNA using the mfold program (version 3.2 by
Suker and Turner). The free energy is -58.30 kcal/mol. The highlighted box
region represents the 21 bp miRNA shown in Figure 3.4.
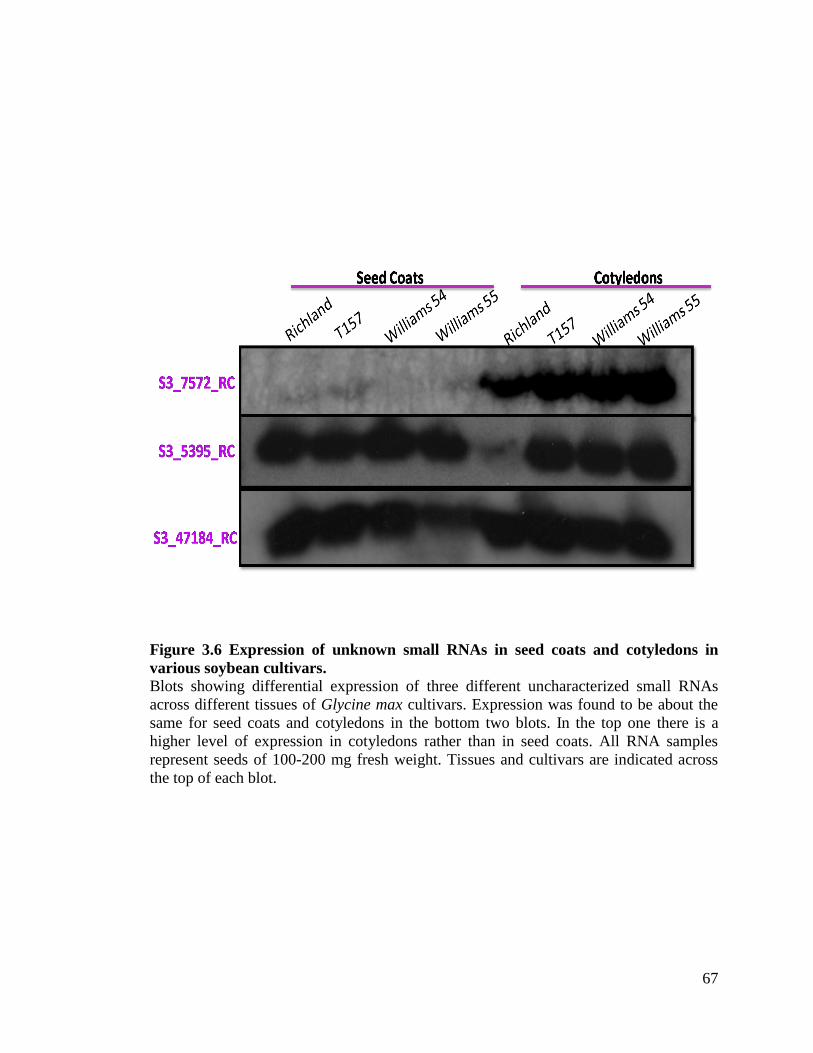
67
Figure 3.6 Expression of unknown small RNAs in seed coats and cotyledons in
various soybean cultivars.
Blots showing differential expression of three different uncharacterized small RNAs
across different tissues of Glycine max cultivars. Expression was found to be about the
same for seed coats and cotyledons in the bottom two blots. In the top one there is a
higher level of expression in cotyledons rather than in seed coats. All RNA samples
represent seeds of 100-200 mg fresh weight. Tissues and cultivars are indicated across
the top of each blot.
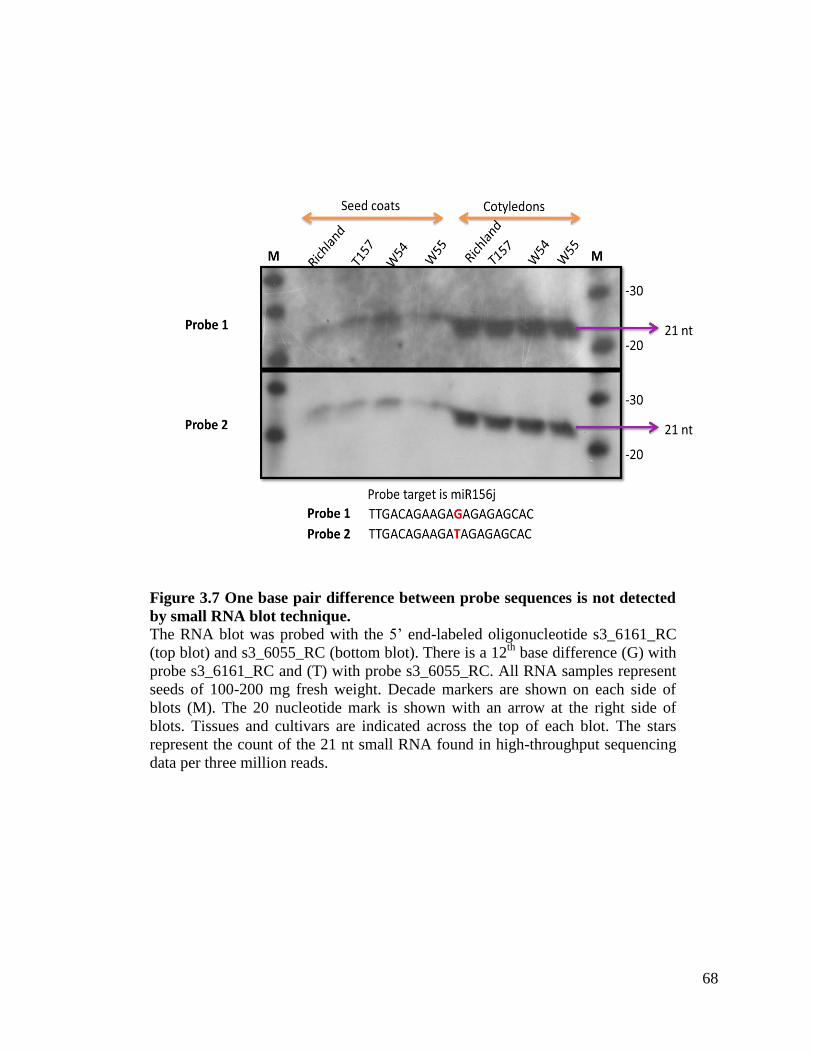
68
Figure 3.7 One base pair difference between probe sequences is not detected
by small RNA blot technique. The RNA blot was probed with the 5’ end-labeled oligonucleotide s3_6161_RC
(top blot) and s3_6055_RC (bottom blot). There is a 12th
base difference (G) with
probe s3_6161_RC and (T) with probe s3_6055_RC. All RNA samples represent
seeds of 100-200 mg fresh weight. Decade markers are shown on each side of
blots (M). The 20 nucleotide mark is shown with an arrow at the right side of
blots. Tissues and cultivars are indicated across the top of each blot. The stars
represent the count of the 21 nt small RNA found in high-throughput sequencing
data per three million reads.
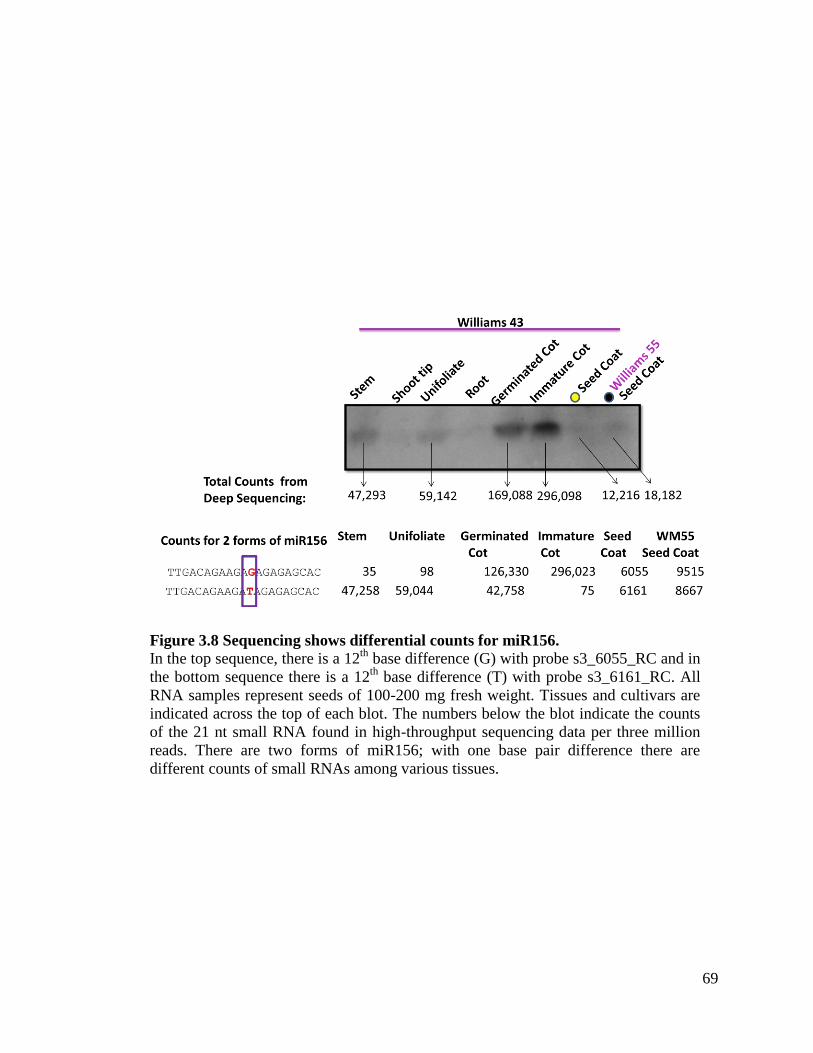
69
Figure 3.8 Sequencing shows differential counts for miR156. In the top sequence, there is a 12
th base difference (G) with probe s3_6055_RC and in
the bottom sequence there is a 12th
base difference (T) with probe s3_6161_RC. All
RNA samples represent seeds of 100-200 mg fresh weight. Tissues and cultivars are
indicated across the top of each blot. The numbers below the blot indicate the counts
of the 21 nt small RNA found in high-throughput sequencing data per three million
reads. There are two forms of miR156; with one base pair difference there are
different counts of small RNAs among various tissues.
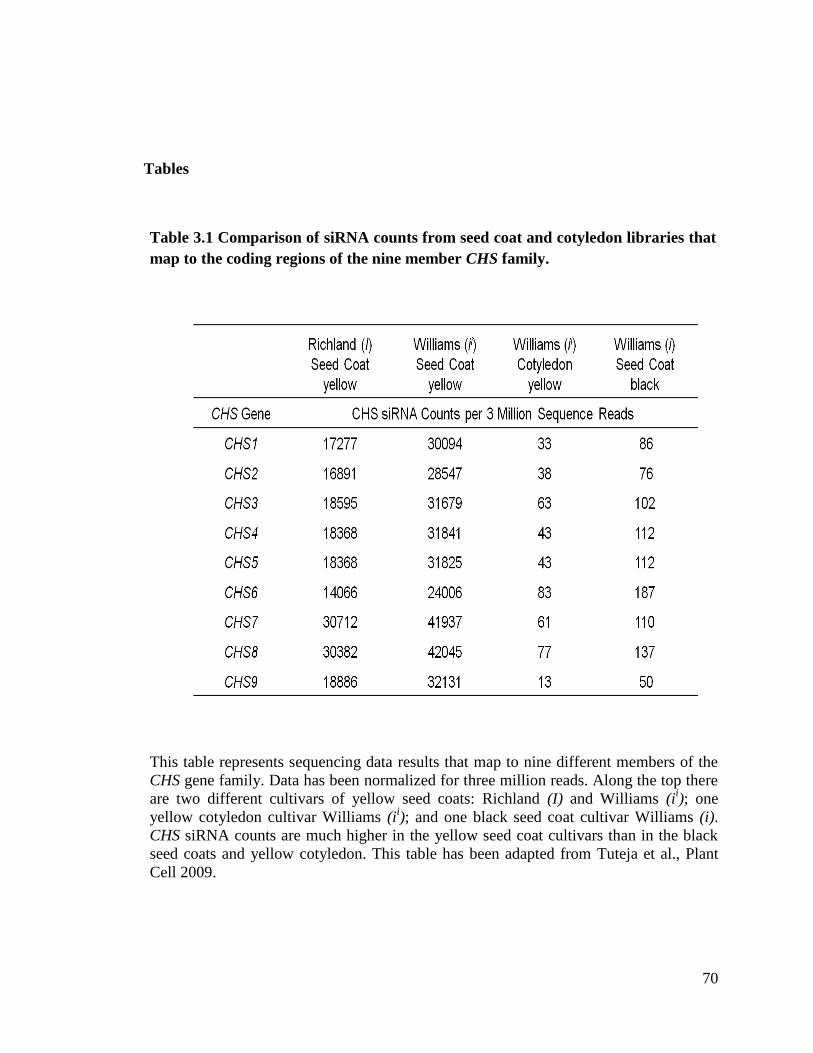
70
Tables
Table 3.1 Comparison of siRNA counts from seed coat and cotyledon libraries that
map to the coding regions of the nine member CHS family.
This table represents sequencing data results that map to nine different members of the
CHS gene family. Data has been normalized for three million reads. Along the top there
are two different cultivars of yellow seed coats: Richland (I) and Williams (ii); one
yellow cotyledon cultivar Williams (ii); and one black seed coat cultivar Williams (i).
CHS siRNA counts are much higher in the yellow seed coat cultivars than in the black
seed coats and yellow cotyledon. This table has been adapted from Tuteja et al., Plant
Cell 2009.
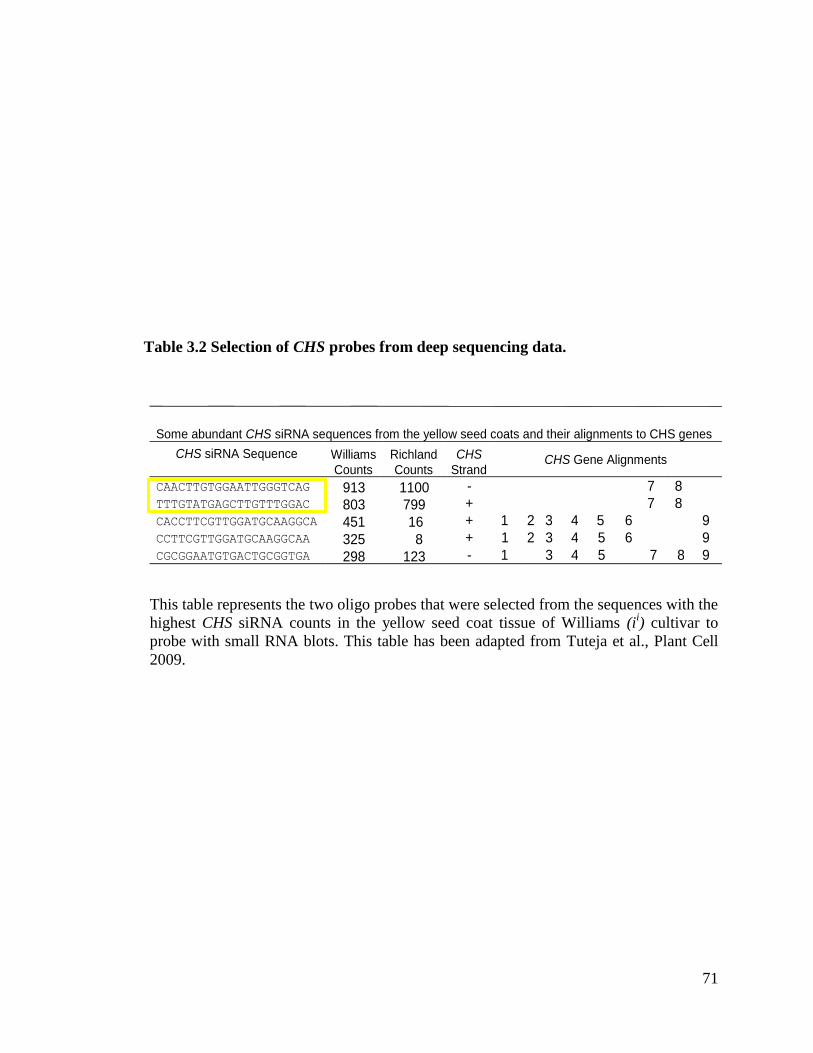
71
Table 3.2 Selection of CHS probes from deep sequencing data.
This table represents the two oligo probes that were selected from the sequences with the
highest CHS siRNA counts in the yellow seed coat tissue of Williams (ii) cultivar to
probe with small RNA blots. This table has been adapted from Tuteja et al., Plant Cell
2009.
Some abundant CHS siRNA sequences from the yellow seed coats and their alignments to CHS genes CHS siRNA Sequence
Williams Counts
Richland Counts
CHS Strand
CHS Gene Alignments
CAACTTGTGGAATTGGGTCAG 913 1100 - 7 8 TTTGTATGAGCTTGTTTGGAC 803 799 + 7 8 CACCTTCGTTGGATGCAAGGCA 451 16 + 1 2 3 4 5
6 9 CCTTCGTTGGATGCAAGGCAA 325 8 + 1 2 3 4 5 6 9 CGCGGAATGTGACTGCGGTGA 298 123 - 1 3 4 5 7 8 9
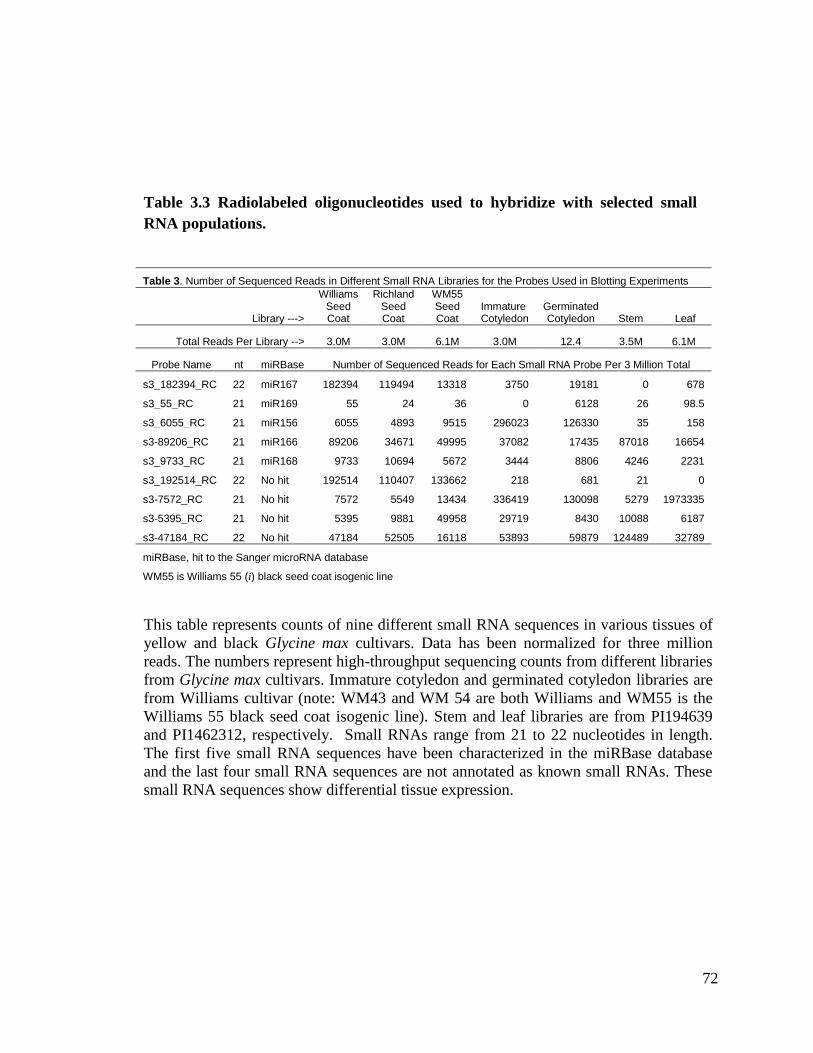
72
Table 3.3 Radiolabeled oligonucleotides used to hybridize with selected small
RNA populations.
Table 3. Number of Sequenced Reads in Different Small RNA Libraries for the Probes Used in Blotting Experiments
Library --->
Williams Seed Coat
Richland Seed Coat
WM55 Seed Coat
Immature Cotyledon
Germinated Cotyledon Stem Leaf
Total Reads Per Library --> 3.0M 3.0M 6.1M 3.0M 12.4 3.5M 6.1M
Probe Name nt miRBase Number of Sequenced Reads for Each Small RNA Probe Per 3 Million Total
s3_182394_RC 22 miR167 182394 119494 13318 3750 19181 0 678
s3_55_RC 21 miR169 55 24 36 0 6128 26 98.5
s3_6055_RC 21 miR156 6055 4893 9515 296023 126330 35 158
s3-89206_RC 21 miR166 89206 34671 49995 37082 17435 87018 16654
s3_9733_RC 21 miR168 9733 10694 5672 3444 8806 4246 2231
s3_192514_RC 22 No hit 192514 110407 133662 218 681 21 0
s3-7572_RC 21 No hit 7572 5549 13434 336419 130098 5279 1973335
s3-5395_RC 21 No hit 5395 9881 49958 29719 8430 10088 6187
s3-47184_RC 22 No hit 47184 52505 16118 53893 59879 124489 32789
miRBase, hit to the Sanger microRNA database
WM55 is Williams 55 (i) black seed coat isogenic line
This table represents counts of nine different small RNA sequences in various tissues of
yellow and black Glycine max cultivars. Data has been normalized for three million
reads. The numbers represent high-throughput sequencing counts from different libraries
from Glycine max cultivars. Immature cotyledon and germinated cotyledon libraries are
from Williams cultivar (note: WM43 and WM 54 are both Williams and WM55 is the
Williams 55 black seed coat isogenic line). Stem and leaf libraries are from PI194639
and PI1462312, respectively. Small RNAs range from 21 to 22 nucleotides in length.
The first five small RNA sequences have been characterized in the miRBase database
and the last four small RNA sequences are not annotated as known small RNAs. These
small RNA sequences show differential tissue expression.
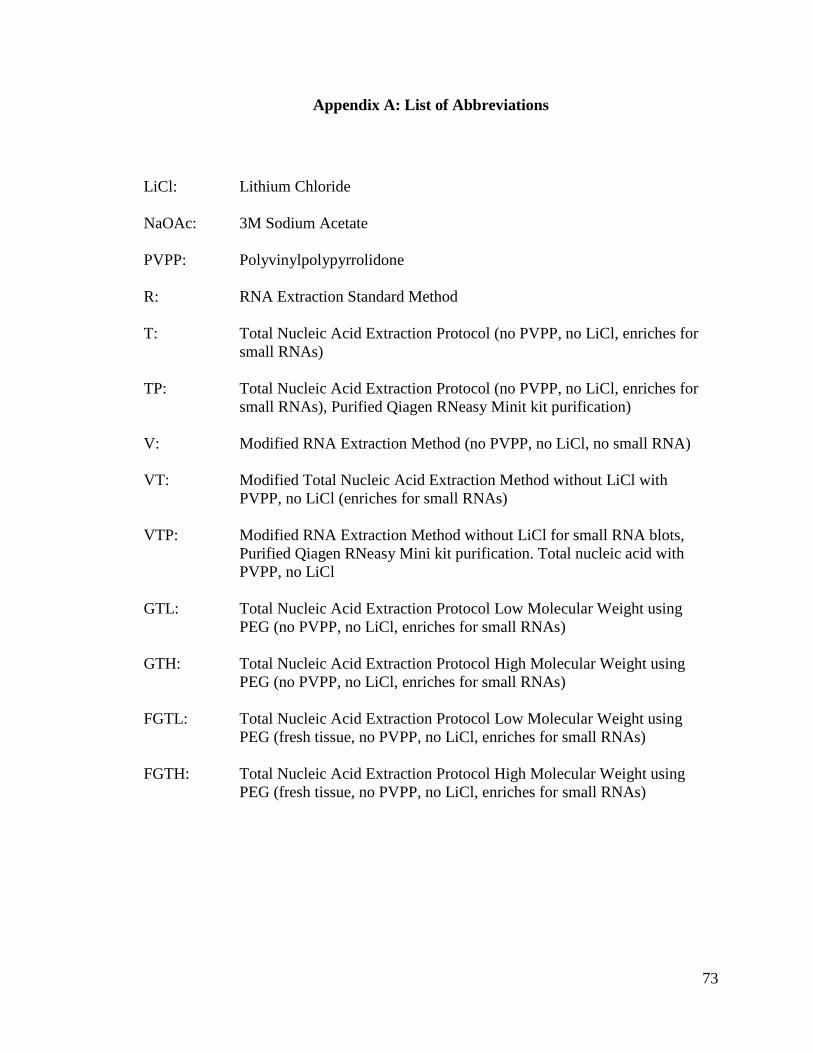
73
Appendix A: List of Abbreviations
LiCl: Lithium Chloride
NaOAc: 3M Sodium Acetate
PVPP: Polyvinylpolypyrrolidone
R: RNA Extraction Standard Method
T: Total Nucleic Acid Extraction Protocol (no PVPP, no LiCl, enriches for
small RNAs)
TP: Total Nucleic Acid Extraction Protocol (no PVPP, no LiCl, enriches for
small RNAs), Purified Qiagen RNeasy Minit kit purification)
V: Modified RNA Extraction Method (no PVPP, no LiCl, no small RNA)
VT: Modified Total Nucleic Acid Extraction Method without LiCl with
PVPP, no LiCl (enriches for small RNAs)
VTP: Modified RNA Extraction Method without LiCl for small RNA blots,
Purified Qiagen RNeasy Mini kit purification. Total nucleic acid with
PVPP, no LiCl
GTL: Total Nucleic Acid Extraction Protocol Low Molecular Weight using
PEG (no PVPP, no LiCl, enriches for small RNAs)
GTH: Total Nucleic Acid Extraction Protocol High Molecular Weight using
PEG (no PVPP, no LiCl, enriches for small RNAs)
FGTL: Total Nucleic Acid Extraction Protocol Low Molecular Weight using
PEG (fresh tissue, no PVPP, no LiCl, enriches for small RNAs)
FGTH: Total Nucleic Acid Extraction Protocol High Molecular Weight using
PEG (fresh tissue, no PVPP, no LiCl, enriches for small RNAs)
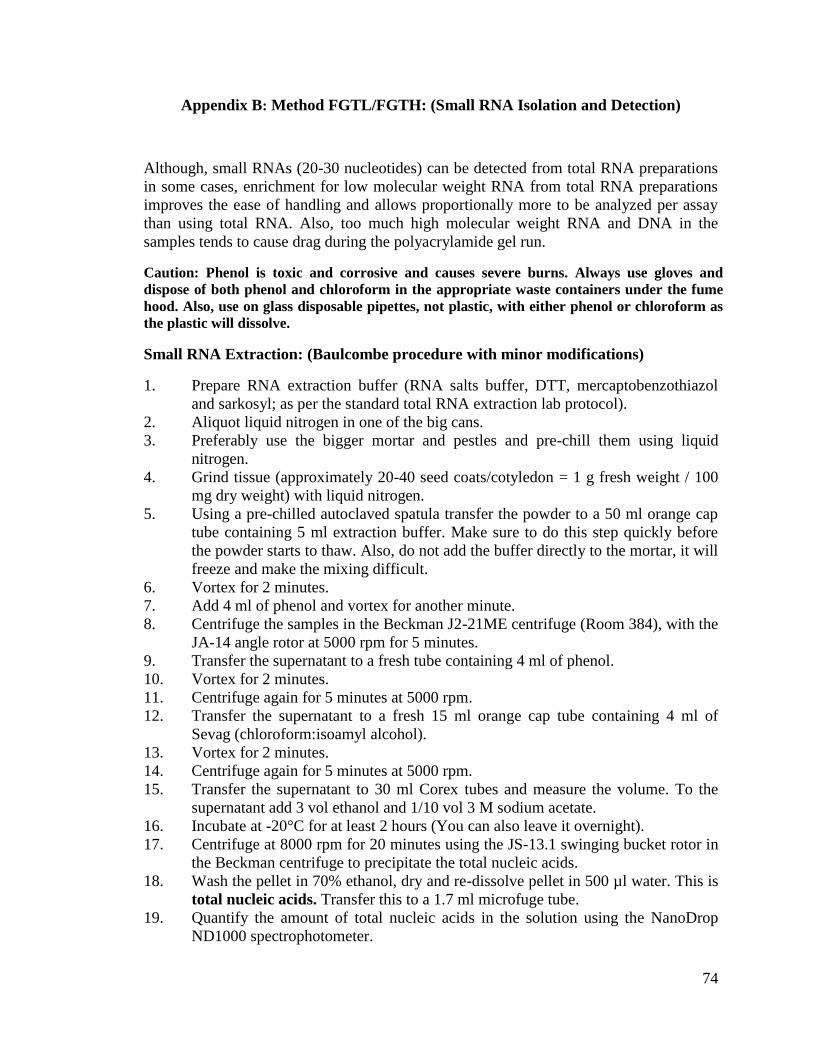
74
Appendix B: Method FGTL/FGTH: (Small RNA Isolation and Detection)
Although, small RNAs (20-30 nucleotides) can be detected from total RNA preparations
in some cases, enrichment for low molecular weight RNA from total RNA preparations
improves the ease of handling and allows proportionally more to be analyzed per assay
than using total RNA. Also, too much high molecular weight RNA and DNA in the
samples tends to cause drag during the polyacrylamide gel run.
Caution: Phenol is toxic and corrosive and causes severe burns. Always use gloves and
dispose of both phenol and chloroform in the appropriate waste containers under the fume
hood. Also, use on glass disposable pipettes, not plastic, with either phenol or chloroform as
the plastic will dissolve.
Small RNA Extraction: (Baulcombe procedure with minor modifications)
1. Prepare RNA extraction buffer (RNA salts buffer, DTT, mercaptobenzothiazol
and sarkosyl; as per the standard total RNA extraction lab protocol).
2. Aliquot liquid nitrogen in one of the big cans.
3. Preferably use the bigger mortar and pestles and pre-chill them using liquid
nitrogen.
4. Grind tissue (approximately 20-40 seed coats/cotyledon = 1 g fresh weight / 100
mg dry weight) with liquid nitrogen.
5. Using a pre-chilled autoclaved spatula transfer the powder to a 50 ml orange cap
tube containing 5 ml extraction buffer. Make sure to do this step quickly before
the powder starts to thaw. Also, do not add the buffer directly to the mortar, it will
freeze and make the mixing difficult.
6. Vortex for 2 minutes.
7. Add 4 ml of phenol and vortex for another minute.
8. Centrifuge the samples in the Beckman J2-21ME centrifuge (Room 384), with the
JA-14 angle rotor at 5000 rpm for 5 minutes.
9. Transfer the supernatant to a fresh tube containing 4 ml of phenol.
10. Vortex for 2 minutes.
11. Centrifuge again for 5 minutes at 5000 rpm.
12. Transfer the supernatant to a fresh 15 ml orange cap tube containing 4 ml of
Sevag (chloroform:isoamyl alcohol).
13. Vortex for 2 minutes.
14. Centrifuge again for 5 minutes at 5000 rpm.
15. Transfer the supernatant to 30 ml Corex tubes and measure the volume. To the
supernatant add 3 vol ethanol and 1/10 vol 3 M sodium acetate.
16. Incubate at -20°C for at least 2 hours (You can also leave it overnight).
17. Centrifuge at 8000 rpm for 20 minutes using the JS-13.1 swinging bucket rotor in
the Beckman centrifuge to precipitate the total nucleic acids.
18. Wash the pellet in 70% ethanol, dry and re-dissolve pellet in 500 µl water. This is
total nucleic acids. Transfer this to a 1.7 ml microfuge tube.
19. Quantify the amount of total nucleic acids in the solution using the NanoDrop
ND1000 spectrophotometer.
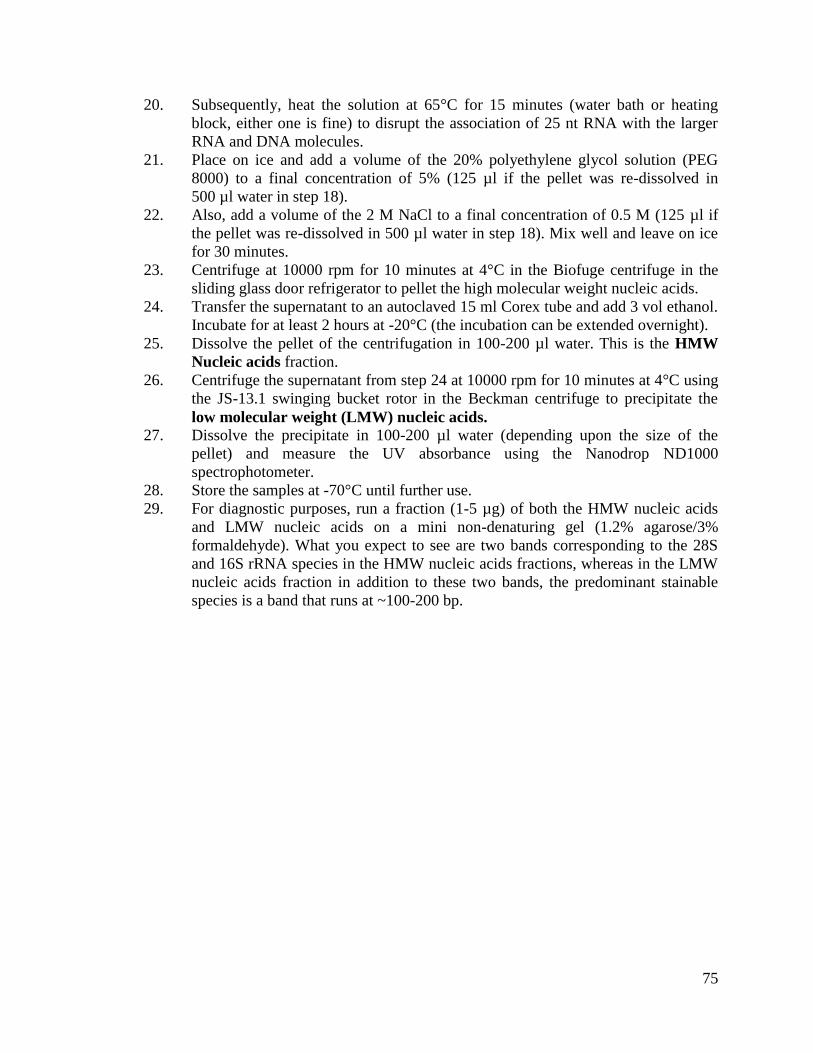
75
20. Subsequently, heat the solution at 65°C for 15 minutes (water bath or heating
block, either one is fine) to disrupt the association of 25 nt RNA with the larger
RNA and DNA molecules.
21. Place on ice and add a volume of the 20% polyethylene glycol solution (PEG
8000) to a final concentration of 5% (125 µl if the pellet was re-dissolved in
500 µl water in step 18).
22. Also, add a volume of the 2 M NaCl to a final concentration of 0.5 M (125 µl if
the pellet was re-dissolved in 500 µl water in step 18). Mix well and leave on ice
for 30 minutes.
23. Centrifuge at 10000 rpm for 10 minutes at 4°C in the Biofuge centrifuge in the
sliding glass door refrigerator to pellet the high molecular weight nucleic acids.
24. Transfer the supernatant to an autoclaved 15 ml Corex tube and add 3 vol ethanol.
Incubate for at least 2 hours at -20°C (the incubation can be extended overnight).
25. Dissolve the pellet of the centrifugation in 100-200 µl water. This is the HMW
Nucleic acids fraction.
26. Centrifuge the supernatant from step 24 at 10000 rpm for 10 minutes at 4°C using
the JS-13.1 swinging bucket rotor in the Beckman centrifuge to precipitate the
low molecular weight (LMW) nucleic acids.
27. Dissolve the precipitate in 100-200 µl water (depending upon the size of the
pellet) and measure the UV absorbance using the Nanodrop ND1000
spectrophotometer.
28. Store the samples at -70°C until further use.
29. For diagnostic purposes, run a fraction (1-5 µg) of both the HMW nucleic acids
and LMW nucleic acids on a mini non-denaturing gel (1.2% agarose/3%
formaldehyde). What you expect to see are two bands corresponding to the 28S
and 16S rRNA species in the HMW nucleic acids fractions, whereas in the LMW
nucleic acids fraction in addition to these two bands, the predominant stainable
species is a band that runs at ~100-200 bp.
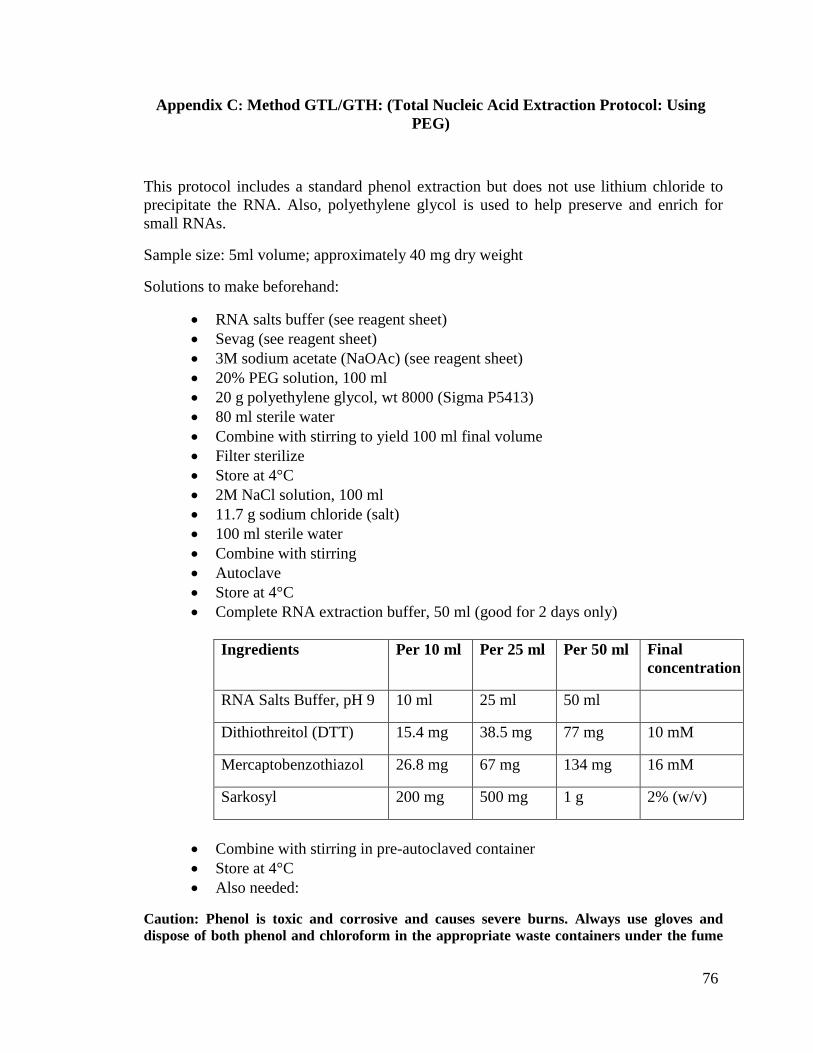
76
Appendix C: Method GTL/GTH: (Total Nucleic Acid Extraction Protocol: Using
PEG)
This protocol includes a standard phenol extraction but does not use lithium chloride to
precipitate the RNA. Also, polyethylene glycol is used to help preserve and enrich for
small RNAs.
Sample size: 5ml volume; approximately 40 mg dry weight
Solutions to make beforehand:
RNA salts buffer (see reagent sheet)
Sevag (see reagent sheet)
3M sodium acetate (NaOAc) (see reagent sheet)
20% PEG solution, 100 ml
20 g polyethylene glycol, wt 8000 (Sigma P5413)
80 ml sterile water
Combine with stirring to yield 100 ml final volume
Filter sterilize
Store at 4°C
2M NaCl solution, 100 ml
11.7 g sodium chloride (salt)
100 ml sterile water
Combine with stirring
Autoclave
Store at 4°C
Complete RNA extraction buffer, 50 ml (good for 2 days only)
Ingredients Per 10 ml Per 25 ml Per 50 ml Final
concentration
RNA Salts Buffer, pH 9 10 ml 25 ml 50 ml
Dithiothreitol (DTT) 15.4 mg 38.5 mg 77 mg 10 mM
Mercaptobenzothiazol 26.8 mg 67 mg 134 mg 16 mM
Sarkosyl 200 mg 500 mg 1 g 2% (w/v)
Combine with stirring in pre-autoclaved container
Store at 4°C
Also needed:
Caution: Phenol is toxic and corrosive and causes severe burns. Always use gloves and
dispose of both phenol and chloroform in the appropriate waste containers under the fume
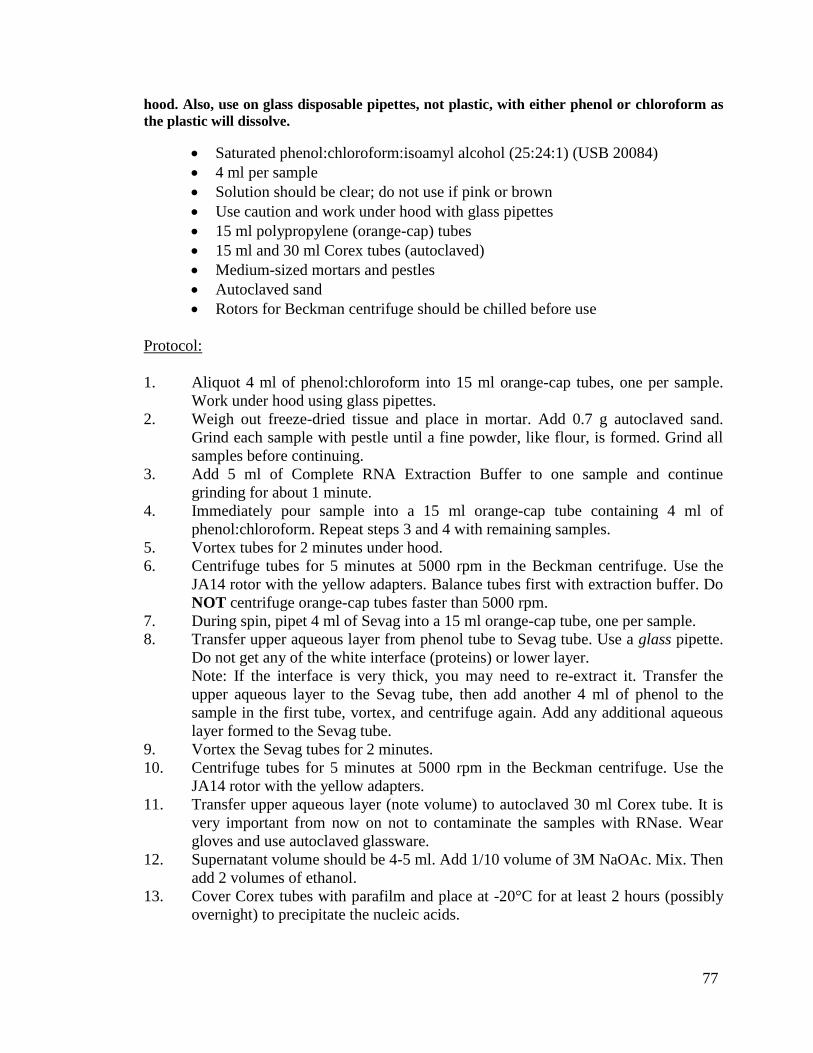
77
hood. Also, use on glass disposable pipettes, not plastic, with either phenol or chloroform as
the plastic will dissolve.
Saturated phenol:chloroform:isoamyl alcohol (25:24:1) (USB 20084)
4 ml per sample
Solution should be clear; do not use if pink or brown
Use caution and work under hood with glass pipettes
15 ml polypropylene (orange-cap) tubes
15 ml and 30 ml Corex tubes (autoclaved)
Medium-sized mortars and pestles
Autoclaved sand
Rotors for Beckman centrifuge should be chilled before use
Protocol:
1. Aliquot 4 ml of phenol:chloroform into 15 ml orange-cap tubes, one per sample.
Work under hood using glass pipettes.
2. Weigh out freeze-dried tissue and place in mortar. Add 0.7 g autoclaved sand.
Grind each sample with pestle until a fine powder, like flour, is formed. Grind all
samples before continuing.
3. Add 5 ml of Complete RNA Extraction Buffer to one sample and continue
grinding for about 1 minute.
4. Immediately pour sample into a 15 ml orange-cap tube containing 4 ml of
phenol:chloroform. Repeat steps 3 and 4 with remaining samples.
5. Vortex tubes for 2 minutes under hood.
6. Centrifuge tubes for 5 minutes at 5000 rpm in the Beckman centrifuge. Use the
JA14 rotor with the yellow adapters. Balance tubes first with extraction buffer. Do
NOT centrifuge orange-cap tubes faster than 5000 rpm.
7. During spin, pipet 4 ml of Sevag into a 15 ml orange-cap tube, one per sample.
8. Transfer upper aqueous layer from phenol tube to Sevag tube. Use a glass pipette.
Do not get any of the white interface (proteins) or lower layer.
Note: If the interface is very thick, you may need to re-extract it. Transfer the
upper aqueous layer to the Sevag tube, then add another 4 ml of phenol to the
sample in the first tube, vortex, and centrifuge again. Add any additional aqueous
layer formed to the Sevag tube.
9. Vortex the Sevag tubes for 2 minutes.
10. Centrifuge tubes for 5 minutes at 5000 rpm in the Beckman centrifuge. Use the
JA14 rotor with the yellow adapters.
11. Transfer upper aqueous layer (note volume) to autoclaved 30 ml Corex tube. It is
very important from now on not to contaminate the samples with RNase. Wear
gloves and use autoclaved glassware.
12. Supernatant volume should be 4-5 ml. Add 1/10 volume of 3M NaOAc. Mix. Then
add 2 volumes of ethanol.
13. Cover Corex tubes with parafilm and place at -20°C for at least 2 hours (possibly
overnight) to precipitate the nucleic acids.
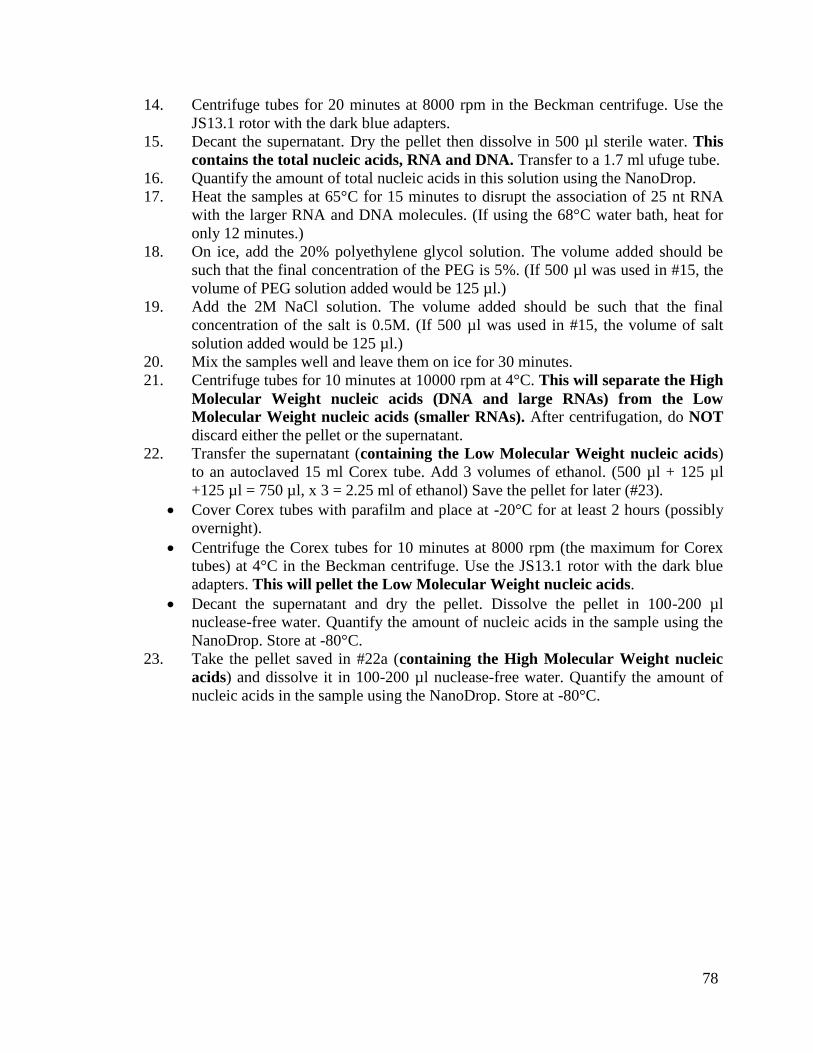
78
14. Centrifuge tubes for 20 minutes at 8000 rpm in the Beckman centrifuge. Use the
JS13.1 rotor with the dark blue adapters.
15. Decant the supernatant. Dry the pellet then dissolve in 500 µl sterile water. This
contains the total nucleic acids, RNA and DNA. Transfer to a 1.7 ml ufuge tube.
16. Quantify the amount of total nucleic acids in this solution using the NanoDrop.
17. Heat the samples at 65°C for 15 minutes to disrupt the association of 25 nt RNA
with the larger RNA and DNA molecules. (If using the 68°C water bath, heat for
only 12 minutes.)
18. On ice, add the 20% polyethylene glycol solution. The volume added should be
such that the final concentration of the PEG is 5%. (If 500 µl was used in #15, the
volume of PEG solution added would be 125 µl.)
19. Add the 2M NaCl solution. The volume added should be such that the final
concentration of the salt is 0.5M. (If 500 µl was used in #15, the volume of salt
solution added would be 125 µl.)
20. Mix the samples well and leave them on ice for 30 minutes.
21. Centrifuge tubes for 10 minutes at 10000 rpm at 4°C. This will separate the High
Molecular Weight nucleic acids (DNA and large RNAs) from the Low
Molecular Weight nucleic acids (smaller RNAs). After centrifugation, do NOT
discard either the pellet or the supernatant.
22. Transfer the supernatant (containing the Low Molecular Weight nucleic acids)
to an autoclaved 15 ml Corex tube. Add 3 volumes of ethanol. (500 µl + 125 µl
+125 µl = 750 µl, x 3 = 2.25 ml of ethanol) Save the pellet for later (#23).
Cover Corex tubes with parafilm and place at -20°C for at least 2 hours (possibly
overnight).
Centrifuge the Corex tubes for 10 minutes at 8000 rpm (the maximum for Corex
tubes) at 4°C in the Beckman centrifuge. Use the JS13.1 rotor with the dark blue
adapters. This will pellet the Low Molecular Weight nucleic acids.
Decant the supernatant and dry the pellet. Dissolve the pellet in 100-200 µl
nuclease-free water. Quantify the amount of nucleic acids in the sample using the
NanoDrop. Store at -80°C.
23. Take the pellet saved in #22a (containing the High Molecular Weight nucleic
acids) and dissolve it in 100-200 µl nuclease-free water. Quantify the amount of
nucleic acids in the sample using the NanoDrop. Store at -80°C.
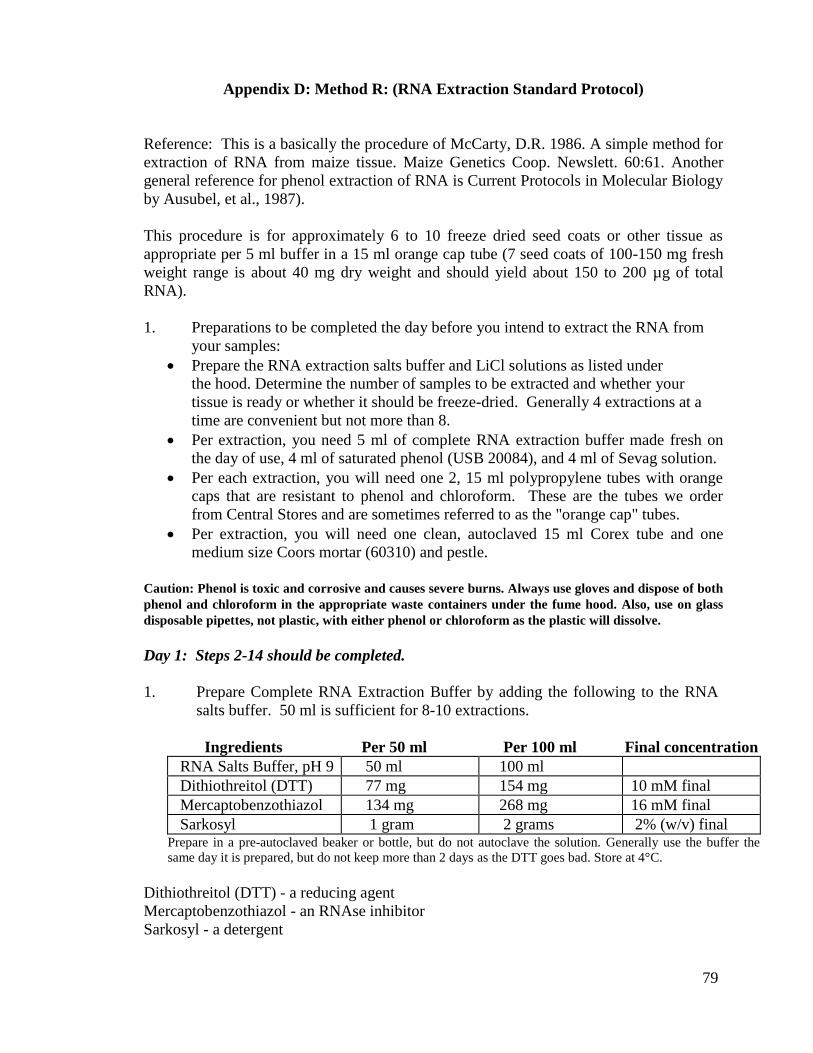
79
Appendix D: Method R: (RNA Extraction Standard Protocol)
Reference: This is a basically the procedure of McCarty, D.R. 1986. A simple method for
extraction of RNA from maize tissue. Maize Genetics Coop. Newslett. 60:61. Another
general reference for phenol extraction of RNA is Current Protocols in Molecular Biology
by Ausubel, et al., 1987).
This procedure is for approximately 6 to 10 freeze dried seed coats or other tissue as
appropriate per 5 ml buffer in a 15 ml orange cap tube (7 seed coats of 100-150 mg fresh
weight range is about 40 mg dry weight and should yield about 150 to 200 µg of total
RNA).
1. Preparations to be completed the day before you intend to extract the RNA from
your samples:
Prepare the RNA extraction salts buffer and LiCl solutions as listed under
the hood. Determine the number of samples to be extracted and whether your
tissue is ready or whether it should be freeze-dried. Generally 4 extractions at a
time are convenient but not more than 8.
Per extraction, you need 5 ml of complete RNA extraction buffer made fresh on
the day of use, 4 ml of saturated phenol (USB 20084), and 4 ml of Sevag solution.
Per each extraction, you will need one 2, 15 ml polypropylene tubes with orange
caps that are resistant to phenol and chloroform. These are the tubes we order
from Central Stores and are sometimes referred to as the "orange cap" tubes.
Per extraction, you will need one clean, autoclaved 15 ml Corex tube and one
medium size Coors mortar (60310) and pestle.
Caution: Phenol is toxic and corrosive and causes severe burns. Always use gloves and dispose of both
phenol and chloroform in the appropriate waste containers under the fume hood. Also, use on glass
disposable pipettes, not plastic, with either phenol or chloroform as the plastic will dissolve.
Day 1: Steps 2-14 should be completed.
1. Prepare Complete RNA Extraction Buffer by adding the following to the RNA
salts buffer. 50 ml is sufficient for 8-10 extractions.
Ingredients Per 50 ml Per 100 ml Final concentration
RNA Salts Buffer, pH 9 50 ml 100 ml
Dithiothreitol (DTT) 77 mg 154 mg 10 mM final
Mercaptobenzothiazol 134 mg 268 mg 16 mM final
Sarkosyl 1 gram 2 grams 2% (w/v) final Prepare in a pre-autoclaved beaker or bottle, but do not autoclave the solution. Generally use the buffer the
same day it is prepared, but do not keep more than 2 days as the DTT goes bad. Store at 4°C.
Dithiothreitol (DTT) - a reducing agent
Mercaptobenzothiazol - an RNAse inhibitor
Sarkosyl - a detergent
80
2. Per extraction, aliquot 4 ml of the saturated USB phenol:chloroform: isoamyl
alcohol (25:24:1) into each of the required number of 15 ml polypropylene
orange cap tubes under the fume hood. Be sure the phenol: chloroform is clear
and good quality. If it is pink or brown, do not use it.
3. Count and weigh the freeze dried seed coats or tissue. Grind freeze dried tissue in
a medium mortar (Coors 60310) and pestle with about 0.7 g of autoclaved sand
until a fine powder is formed. Grind all of the samples and set aside. (Freeze dried
tissue is best, but if not dried, freeze the tissue in liquid nitrogen and grind it to a
fine powder.)
5. Add 5 ml of the complete RNA buffer (from step 2) to the sample and continue to
grind well for about 1 minute.
6. Immediately pour the sample into a 15 ml polypropylene orange cap tube
containing 4 ml of saturated phenol.
7. Cap the tube and vortex vigorously for 2 minutes.
8. Centrifuge for 5 minutes in the IEC clinical centrifuge (room 388) at full speed
with pre-chilled adapters. Alternatively, centrifuge in the large JA14 angle rotor
with the yellow adapters. Balance the tubes, use extraction buffer to balance if
needed. Do not centrifuge any faster than 5000 rpm as the conical tubes are
not made for high speeds.)
9. While the sample is centrifuging, pipet 4 ml of saturated Sevag
(chloroform:isoamyl alcohol) into new 15 ml orange cap tubes and label one for
each sample.
10. An interface of precipitated proteins will form between the organic and the
aqueous layers. Using a 10 ml glass pipette that is resistant to phenol, carefully
withdraw the upper aqueous layer down to but not including the thick white
interface.
(Note: If the interface is very thick, then you made need to withdraw the aqueous
layer including part of the interface and re-extract with phenol one more time
before going on to the Sevag step. This is a judgment call. But do not forget to do
the Sevag step as the chloroform is needed to remove the phenol from the
sample).
11. Place the supernatant into the new 15 ml tube containing 4 ml of saturated Sevag
(chloroform:isoamyl alcohol). Vortex for at least 2 minutes.
12. Centrifuge as before at 5000 rpm for 5 minutes in the clinical centrifuge or the
angle JA14 with the yellow adapters.
13. Carefully remove the upper aqueous layer, measure volume, and place into an
autoclaved 15 ml Corex tube. It is very important from now on not to
contaminate the samples with RNAse. Wear gloves and use autoclaved
glassware. 14. Add 1/3 volume of 8 M LiCl (about 1.3 to 1.6 ml) so that the final concentration
is 2M lithium chloride. Mix well and leave overnight (15-20 hours) in the
refrigerator at 4°C. The 2M LiCl will precipitate the RNAs selectively, leaving
most of the DNA in solution.
Day 2: Steps 15-22
15. Centrifuge at 8000 rpm for 15 minutes to precipitate the RNA. The swinging
bucket JS13 rotor is best to use as the RNA will be at the bottom of the tube
81
instead of on the sides. (Balance the tubes with 2M LiCl if needed).
16. Decant the supernatant gently to be sure the pellet adheres to the bottom of the
tube. Drain liquid well onto a Kimwipe. Optional: Add 2 M LiCl to rinse the
pellet and sides of the tube. Centrifuge for 10 minutes at 8000 rpm. Drain the
supernatant from the pellet as before.
17. Add 0.5 ml of sterile water to the pellet and re-dissolve the pellet. Keep on ice
and minimize time to prevent degradation. Remember, wear gloves, do not
contaminate.
18. Transfer the re-dissolved pellet to a 1.5 ml eppendorf tube. Add 50 µl (1/10 vol)
of 3M Na acetate, mix, and 1 ml (2 vol) of ethanol and precipitate the RNA at
-80°C for about 30 minutes.
19. Spin, wash, and dry the pellet: This means centrifuge at 12000 rpm in the
microfuge at 4°C, decant the supernatant gently; wash the pellet by adding 1 ml
80% ethanol and decant gently (if you disturb the pellet, re-centrifuge before
decanting the supernatant); dry the pellet in the Savant for about 5 minutes.
20. Re-suspend the pellet in about 100 µl or more depending on the size of the pellet.
Keep on ice. Take duplicate scans and OD260 readings using a 1/500 dilution
(2 µl per 1 ml H20). 1 OD260 unit of RNA = 40 µg so calculate concentration:
(A260 x dilution factor x 40)/ 1000 = µg/µl. The dilution factor in this case is
500. Adjust the sample to the desired concentration and rescan if needed. If you
need to load 10 µg per lane for a gel, then adjust the concentration to about 2 µg/µl.
21. Minimize the amount of time that the RNA is on ice. Store the RNA frozen at
-80°C (-20°C is not good enough for storage, the RNA may degrade). Also, you
can store large amounts of RNA as ethanol precipitate at -20°C for long term
storage until needed. But you will have to spin, wash and dry, and recalculate
concentrations each time.
22. Check the quality of the RNA by electrophoresis on a formaldehyde-agarose gel.
The 18S and 25S rRNAs should be intact.
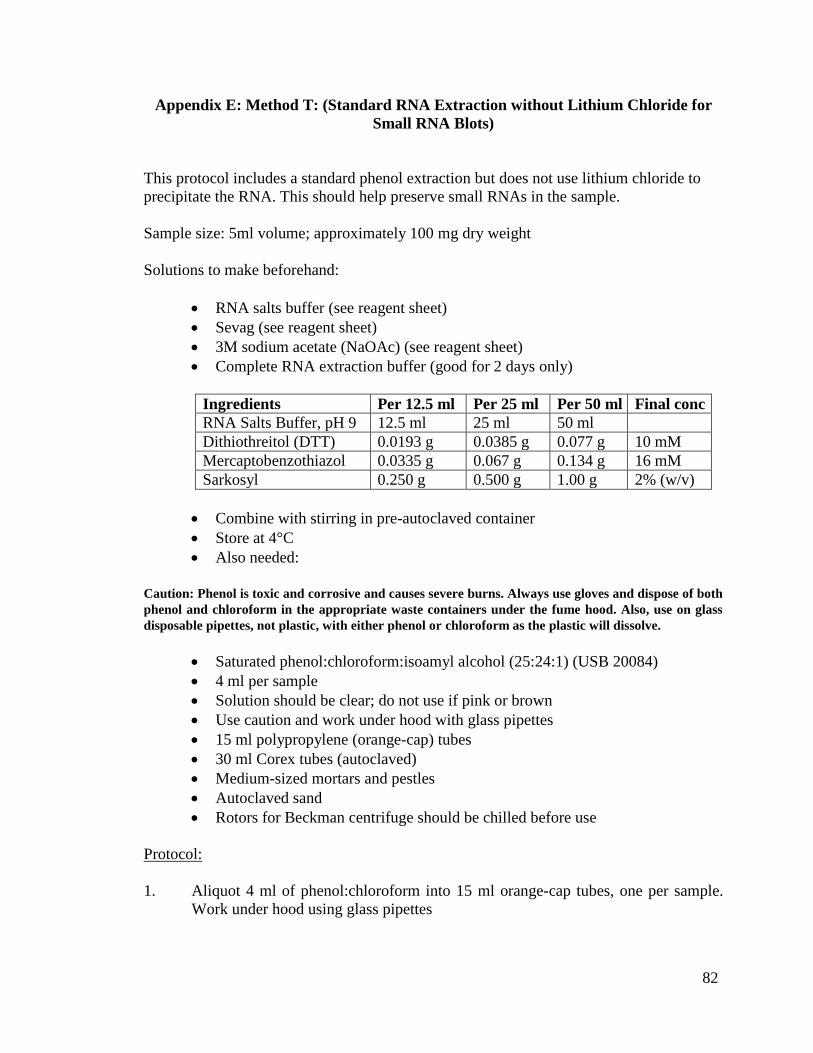
82
Appendix E: Method T: (Standard RNA Extraction without Lithium Chloride for
Small RNA Blots)
This protocol includes a standard phenol extraction but does not use lithium chloride to
precipitate the RNA. This should help preserve small RNAs in the sample.
Sample size: 5ml volume; approximately 100 mg dry weight
Solutions to make beforehand:
RNA salts buffer (see reagent sheet)
Sevag (see reagent sheet)
3M sodium acetate (NaOAc) (see reagent sheet)
Complete RNA extraction buffer (good for 2 days only)
Ingredients Per 12.5 ml Per 25 ml Per 50 ml Final conc
RNA Salts Buffer, pH 9 12.5 ml 25 ml 50 ml
Dithiothreitol (DTT) 0.0193 g 0.0385 g 0.077 g 10 mM
Mercaptobenzothiazol 0.0335 g 0.067 g 0.134 g 16 mM
Sarkosyl 0.250 g 0.500 g 1.00 g 2% (w/v)
Combine with stirring in pre-autoclaved container
Store at 4°C
Also needed:
Caution: Phenol is toxic and corrosive and causes severe burns. Always use gloves and dispose of both
phenol and chloroform in the appropriate waste containers under the fume hood. Also, use on glass
disposable pipettes, not plastic, with either phenol or chloroform as the plastic will dissolve.
Saturated phenol:chloroform:isoamyl alcohol (25:24:1) (USB 20084)
4 ml per sample
Solution should be clear; do not use if pink or brown
Use caution and work under hood with glass pipettes
15 ml polypropylene (orange-cap) tubes
30 ml Corex tubes (autoclaved)
Medium-sized mortars and pestles
Autoclaved sand
Rotors for Beckman centrifuge should be chilled before use
Protocol:
1. Aliquot 4 ml of phenol:chloroform into 15 ml orange-cap tubes, one per sample.
Work under hood using glass pipettes
83
2. Weigh out freeze-dried tissue and place in mortar. Add 0.7 g autoclaved sand.
Grind each sample with pestle until a fine powder, like flour, is formed. Grind all
samples before continuing.
3. Add 5 ml of Complete RNA Extraction Buffer to one sample and continue
grinding for about 1 minute.
4. Immediately pour sample into a 15 ml orange-cap tube containing 4ml of
phenol:chloroform. Repeat steps 3 and 4 with remaining samples.
5. Vortex tubes under hood for one minute, in spurts.
6. Centrifuge tubes for 5 minutes at 5000 rpm in the Beckman centrifuge. Use the
JA14 rotor with the yellow adapters. Balance tubes first with extraction buffer. Do
NOT centrifuge orange-cap tubes faster than 5000 rpm.
7. During spin, pipet 4 ml of Sevag into a 15 ml orange-cap tube, one per sample.
8. Transfer upper aqueous layer from phenol tube to Sevag tube. Use a glass pipette.
Do not get any of the white interface (proteins) or lower layer.
Note: If the interface is very thick, the nucleic acids may be trapped in it. There are
two ways you can try to produce more aqueous layer from your sample. First,
transfer what aqueous layer you do have to the Sevag tube. Then, remove the thick
white layer and place it in a new 15ml orange-cap tube. Add more Complete RNA
Extraction Buffer (up to 5 ml), vortex lightly, and spin at 5000 rpm for 5 minutes.
You can supplement the Complete RNA Extraction Buffer with RNA Salts Buffer
if necessary.
9. Vortex the Sevag tubes under the hood for one minute, in spurts.
10. Centrifuge tubes for 5 minutes at 5000 rpm in the Beckman centrifuge. Use the
JA14 rotor with the yellow adapters. Balance with RNA Salts Buffer if necessary.
11. Transfer upper aqueous layer (note volume) to autoclaved 30 ml Corex tube. It is
very important from now on not to contaminate the samples with RNase. Wear
gloves and use autoclaved glassware.
12. Supernatant volume should be 4-5 ml. Add 1/10 volume of 3M NaOAc. Mix, as
the NaOAc is heavier than the aqueous layer. Then add 2 volumes of ethanol.
Precipitate, including DNA, carbohydrates, and other compounds, may form
immediately.
13. Cover Corex tubes with parafilm, shake firmly, and place at -20°C for at least 2
hours (possibly overnight) to precipitate the nucleic acids.
14. Centrifuge tubes for 20 minutes at 8000 rpm in the Beckman centrifuge. Use the
JS13.1 rotor with the dark blue adapters. Balance with ethanol if necessary.
15. Decant the supernatant. Dry the pellet thoroughly for at least 15 minutes. It must
be as free of ethanol as possible. Then dissolve in 500 µl sterile water. This
contains the total nucleic acids, RNA and DNA. Transfer to a 1.7 ml ufuge tube.
16. Quantify the amount of total nucleic acids in this solution using the NanoDrop.
Check on formaldehyde gel or on Experion as needed.
17. We have found that loading the “total RNA” from this method even though there
is still substantial DNA in the prep works well for small RNA blots. However, if
needed the Qiagen RNeasy Mini Kit procedure attached can be used for further
purification.
84
Appendix F: Method TP: (Purification of Standard RNA Extraction without
Lithium Chloride for Small RNA Blots)
Materials:
Qiagen RNeasy Mini Kit (#74104)
Fourth edition of manual (April 2006), p. 56, “RNA Cleanup”
This modified version of the standard Qiagen RNeasy mini cleanup protocol can be used
to remove DNA from total nucleic acid samples. The increased ethanol content helps
preserve small RNAs.
Sample size: 100 µg RNA per column (maximum)
Notes:
Buffer RLT contains a guanidine salt. It should never be mixed with bleach.
If Buffer RLT precipitates during storage, warm it to dissolve, and let cool to room
temperature before use.
Perform all steps at room temperature.
Buffer RPE is supplied as a concentrate. Before using it for the first time, add 4
volumes of ethanol.
Protocol:
1. Adjust your RNA sample to a volume of 100 µl with RNase-free water.
2. Add 350 µl Buffer RLT to sample. Mix well.
3. Add ethanol to sample. Mix well by pipetting. Do not centrifuge. The solution may
form a precipitate.
The standard cleanup protocol calls for 250 µl ethanol, for a total volume of
700 µl. This makes the solution about 36% ethanol.
Qiagen’s miRNeasy Mini Kit (#217004) calls for 525 µl ethanol added to 350 µl
of aqueous phase sample, for a total volume of 875 µl. This solution is 60%
ethanol.
Specifically for small RNAs, Qiagen technical support suggests 700 µl ethanol, for
a total volume of 1150 µl. This makes the solution about 61% ethanol.
The Exiqon miRCURY microRNA array manual suggests 1225 µl ethanol, for a
total volume of 1675 µl. This makes the solution about 73% ethanol.
On 3/11/08 it was decided that we should add 900 µl ethanol, for a total volume of
1350 µl, making the solution 67% ethanol.
4. Transfer 700 µl of the sample to an RNeasy Mini spin column placed in a 2 ml
collection tube. Close the lid and centrifuge for 15 seconds at 10000 rpm. Discard
the flow-through.
5. Repeat #4 with any remaining volume of sample, including any precipitate that has
formed. Repeat until all of sample has been added to column.
6. Add 500 µl Buffer RPE to the column. Close the lid and centrifuge for 15 seconds
at 10000 rpm. Discard the flow-through.
85
7. Add 500 µl Buffer RPE to the column again. Close the lid and centrifuge for 2
minutes at 10000 rpm to dry the column membrane and prevent ethanol carryover.
Discard flow-through.
8. Without adding any reagents, spin column again at 10000 rpm for 1 minute to
prevent ethanol carryover.
Optional: Place column in new 2 ml collection tube before spinning.
9. Place spin column in a 1.5 ml microfuge tube. Add 30-50 µl RNase-free water
directly to the column membrane. Close the lid and centrifuge for 1 minute at
10000 rpm to elute the RNA.
10. Add another 30-50 µl RNase-free water to the column, or add the eluate back to
the column. Close the lid and centrifuge for 1 minute at 10000 rpm.
Note: To get the highest possible yield, add more water to the column. To get a
more concentrated sample, add the eluate back to the column.
11. Quantify the amount of RNA in the sample using the NanoDrop. Store at -80°C.
86
Appendix G: Method V: (Modified RNA Extraction Method with PVPP and Lithium
Chloride)
Reference: Wang, C. S. and Vodkin, L. O. Plant Molecular Biology Reporter 12: 132-145 (1994). Extraction of RNA from tissues
containing high levels of procyanidins that bind RNA. The method modifies the standard protocol by using BSA and PVPP as
competitors for proanthocyanidins. In addition, another recent modification by adding polyproline to bind has been made. These
volumes are for approximately 6 to 10 freeze dried seed coats or other tissue as appropriate per 5 ml total of extraction buffer in a 15 ml
orange cap tube. (7 seed coats of 100-150 mg fresh weight range is about 40 mg dry weight and should yield about 150 to 200 µg of
total RNA).
1. Preparations to be completed the day before you intend to extract the RNA from
your samples:
Prepare the RNA extraction salts buffer and LiCl solutions as listed under
reagents. Determine the number of samples to be extracted and whether your tissue
is ready or whether it should be freeze-dried. Generally 4 extractions at a time are
convenient but not more than 8.
Per extraction, you need 5.0 ml of complete RNA extraction buffer made fresh on
the day of use, proanthocyanidin binding buffer (see below), hydrated PVPP (see
below), 8 ml of saturated phenol (USB 75829), and 4 ml of Sevag solution.
Per each extraction, you will need one 50 ml and three 15 ml polypropylene tubes
with orange caps that are resistant to phenol and chloroform. These are the tubes
we order from Central Stores #37637900 (Corning 25330) and are sometimes
referred to as the "orange cap" tubes.
Per extraction, you will need one clean, autoclaved 15 ml Corex tube and one
mortar (small size, Coors 60310 and pestle.
Day 1: Steps 2-17 should be completed.
2. Prepare Complete RNA Extraction Buffer by adding the following to the RNA
salts buffer. 50 ml is sufficient for 8-10 extractions.
Ingredients Per 50 ml Per 100 ml Check
RNA Salts Buffer 50 ml 100 ml
DTT 77 mg 154 mg 10 mM final
Mercaptobenzothiazol 134 mg 268 mg 16 mM final
Sarkosyl 1 gram 2 grams 2% (w/v) final Prepare in a pre-autoclaved beaker or bottle, but do not autoclave the solution. Generally use the buffer the same day it is prepared, but do not keep more than 2 days. Store at 4°C.
3. Prepare proanthocyanidin binding solution using complete RNA buffer made
from step 2 above. Only 1 ml is needed per sample.
Ingredients Per 5 ml Per 10 ml Check
Complete RNA Buffer 5 ml 10 ml
Heparin 50 mg 100 mg 10mg/ml final
Polyproline 10 mg 20 mg 2 mg/ml final
BSA (Sigma A4503) 0.25 gram 0.5 gram 5% (w/v) final
87
4. Hydrate about 10 g of insoluble polyvinylpolypyrrolidone (PVPP, Sigma P-6755)
powder in 100 ml of RNA salts buffer for about 2 hours and autoclave in a beaker.
Pour some into a 50 ml orange cap tube and centrifuge at 5000 rpm for 5 minutes
and decant the supernatant.
5. Count and weigh the freeze dried seed coats or tissue. Grind freeze dried tissue in
a mortar (small size Coors 60310) with about 0.7 g of autoclaved sand until a fine
powder is formed. Grind all of the samples and set aside. (Freeze dried tissue is
best, but if not dried, freeze the tissue in liquid nitrogen and grind it to a fine
powder.)
6. Add 0.75 g of the hydrated PVPP and 1 ml of the proanthocyanidin binding buffer
to the sample. Grind to a paste in the mortar with a pestle for about 1 minute.
7. Add 4 ml of the complete RNA buffer (from step 2) to the sample and continue to
grind well for about 1 minute.
8. With aid of the white spatula/stirring rods, pour the sample into a 50 ml
polypropylene orange cap tube. Add a 100 µl aliquot of 10mg/ml proteinase K
(10 mg/ml dissolved in sterile water and stored at -80°C until use) to the sample.
Incubate the sample in a 37°C incubator with gentle shaking (80 rpm) for 20
minutes. This step may not work well if there is any active RNAase activity in
your sample or the buffers do not have the inhibitors listed.
9. Centrifuge for 10 minutes in the JA17 at only 5000 rpm to pellet insoluble
materials and PVPP. You will have to leave off the orange caps as they do not fit.
Alternatively, centrifuge in the large JA14 angle rotor with the yellow adapters.
Balance the tubes, use extraction buffer to balance if needed. Do not centrifuge
any faster than 5000 as the conical tubes are not made for high speeds.)
10. During the centrifugation step, add 4 ml of saturated phenol (USB 75829) to each
15 ml polypropylene tube under the fume hood. Use a glass pipette. Be sure the
phenol: chloroform is clear and good quality. If it is pink or brown, do not use it.
Caution: phenol is toxic and corrosive and causes severe burns. Always use
gloves and dispose of both phenol and chloroform in the appropriate waste
containers under the fume hood. Also, use on glass disposable pipettes, not
plastic, with either phenol or chloroform as the plastic will dissolve 11. Carefully remove the supernatant and add it to the 15 ml tube containing phenol.
Cap the tube and vortex vigorously for 2 minutes.
12. Balance tubes (use extraction buffer if needed) and centrifuge for 5 minutes in the
clinical centrifuge with the caps on. Pre-chill the adapters.
13. An interface of precipitated proteins will form between the phenol and the
aqueous layers. Using a 10 ml glass pipette that is resistant to phenol, carefully
withdraw the upper aqueous layer down to and including the thick white interface.
Place into a new 15 ml tube containing 4 ml of saturated phenol. Vortex for at
least 2 minutes.
14. Balance tubes and centrifuge as before at 5000 rpm for 5 minutes.
15. Carefully remove the upper aqueous layer leaving behind the interface and place
into a new (15 ml) tube containing 4 ml of saturated Sevag. Vortex for 2 minutes.
Do not forget this step as the chloroform is needed to remove the phenol from the
sample.
16. Centrifuge at 5000 rpm for 5 minutes.
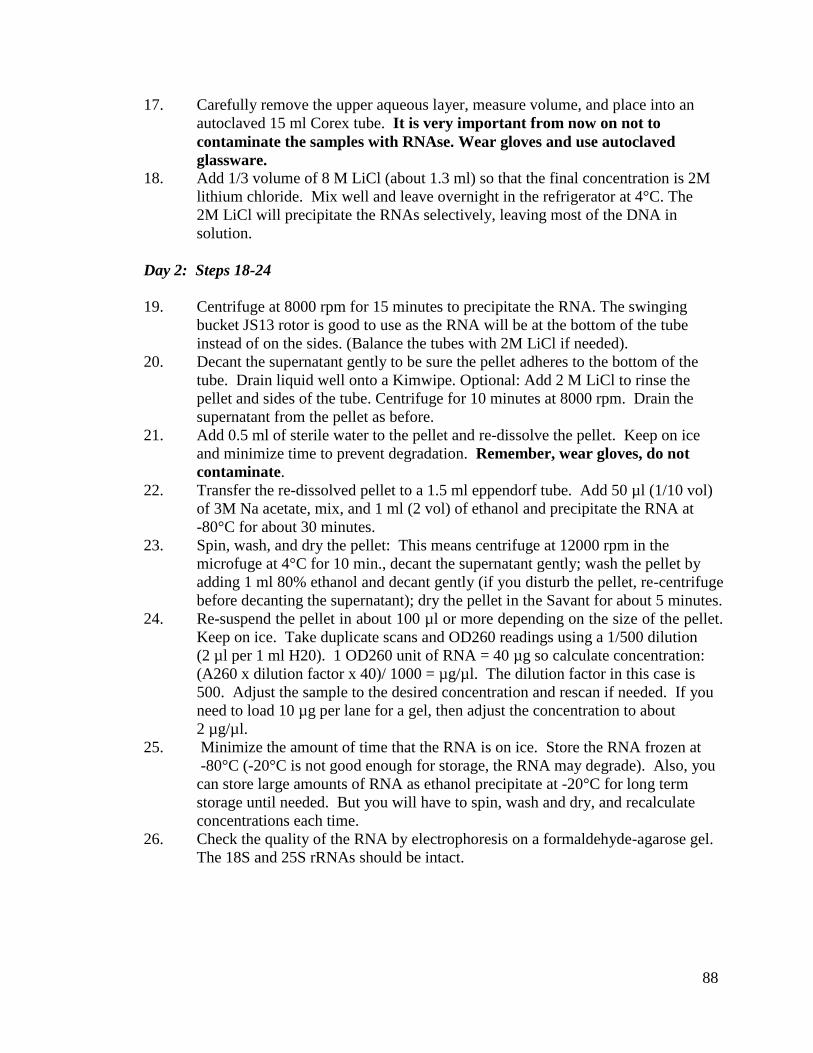
88
17. Carefully remove the upper aqueous layer, measure volume, and place into an
autoclaved 15 ml Corex tube. It is very important from now on not to
contaminate the samples with RNAse. Wear gloves and use autoclaved
glassware. 18. Add 1/3 volume of 8 M LiCl (about 1.3 ml) so that the final concentration is 2M
lithium chloride. Mix well and leave overnight in the refrigerator at 4°C. The
2M LiCl will precipitate the RNAs selectively, leaving most of the DNA in
solution.
Day 2: Steps 18-24
19. Centrifuge at 8000 rpm for 15 minutes to precipitate the RNA. The swinging
bucket JS13 rotor is good to use as the RNA will be at the bottom of the tube
instead of on the sides. (Balance the tubes with 2M LiCl if needed).
20. Decant the supernatant gently to be sure the pellet adheres to the bottom of the
tube. Drain liquid well onto a Kimwipe. Optional: Add 2 M LiCl to rinse the
pellet and sides of the tube. Centrifuge for 10 minutes at 8000 rpm. Drain the
supernatant from the pellet as before.
21. Add 0.5 ml of sterile water to the pellet and re-dissolve the pellet. Keep on ice
and minimize time to prevent degradation. Remember, wear gloves, do not
contaminate.
22. Transfer the re-dissolved pellet to a 1.5 ml eppendorf tube. Add 50 µl (1/10 vol)
of 3M Na acetate, mix, and 1 ml (2 vol) of ethanol and precipitate the RNA at
-80°C for about 30 minutes.
23. Spin, wash, and dry the pellet: This means centrifuge at 12000 rpm in the
microfuge at 4°C for 10 min., decant the supernatant gently; wash the pellet by
adding 1 ml 80% ethanol and decant gently (if you disturb the pellet, re-centrifuge
before decanting the supernatant); dry the pellet in the Savant for about 5 minutes.
24. Re-suspend the pellet in about 100 µl or more depending on the size of the pellet.
Keep on ice. Take duplicate scans and OD260 readings using a 1/500 dilution
(2 µl per 1 ml H20). 1 OD260 unit of RNA = 40 µg so calculate concentration:
(A260 x dilution factor x 40)/ 1000 = µg/µl. The dilution factor in this case is
500. Adjust the sample to the desired concentration and rescan if needed. If you
need to load 10 µg per lane for a gel, then adjust the concentration to about
2 µg/µl.
25. Minimize the amount of time that the RNA is on ice. Store the RNA frozen at
-80°C (-20°C is not good enough for storage, the RNA may degrade). Also, you
can store large amounts of RNA as ethanol precipitate at -20°C for long term
storage until needed. But you will have to spin, wash and dry, and recalculate
concentrations each time.
26. Check the quality of the RNA by electrophoresis on a formaldehyde-agarose gel.
The 18S and 25S rRNAs should be intact.
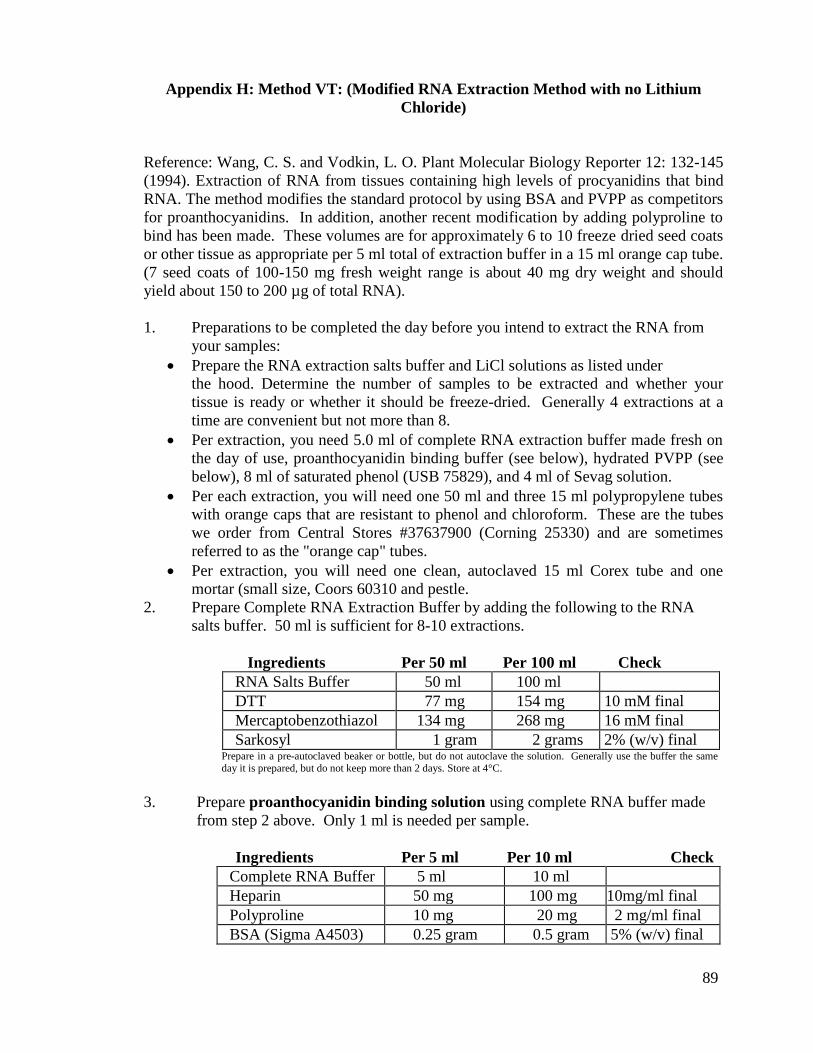
89
Appendix H: Method VT: (Modified RNA Extraction Method with no Lithium
Chloride)
Reference: Wang, C. S. and Vodkin, L. O. Plant Molecular Biology Reporter 12: 132-145
(1994). Extraction of RNA from tissues containing high levels of procyanidins that bind
RNA. The method modifies the standard protocol by using BSA and PVPP as competitors
for proanthocyanidins. In addition, another recent modification by adding polyproline to
bind has been made. These volumes are for approximately 6 to 10 freeze dried seed coats
or other tissue as appropriate per 5 ml total of extraction buffer in a 15 ml orange cap tube.
(7 seed coats of 100-150 mg fresh weight range is about 40 mg dry weight and should
yield about 150 to 200 µg of total RNA).
1. Preparations to be completed the day before you intend to extract the RNA from
your samples:
Prepare the RNA extraction salts buffer and LiCl solutions as listed under
the hood. Determine the number of samples to be extracted and whether your
tissue is ready or whether it should be freeze-dried. Generally 4 extractions at a
time are convenient but not more than 8.
Per extraction, you need 5.0 ml of complete RNA extraction buffer made fresh on
the day of use, proanthocyanidin binding buffer (see below), hydrated PVPP (see
below), 8 ml of saturated phenol (USB 75829), and 4 ml of Sevag solution.
Per each extraction, you will need one 50 ml and three 15 ml polypropylene tubes
with orange caps that are resistant to phenol and chloroform. These are the tubes
we order from Central Stores #37637900 (Corning 25330) and are sometimes
referred to as the "orange cap" tubes.
Per extraction, you will need one clean, autoclaved 15 ml Corex tube and one
mortar (small size, Coors 60310 and pestle.
2. Prepare Complete RNA Extraction Buffer by adding the following to the RNA
salts buffer. 50 ml is sufficient for 8-10 extractions.
Ingredients Per 50 ml Per 100 ml Check
RNA Salts Buffer 50 ml 100 ml
DTT 77 mg 154 mg 10 mM final
Mercaptobenzothiazol 134 mg 268 mg 16 mM final
Sarkosyl 1 gram 2 grams 2% (w/v) final Prepare in a pre-autoclaved beaker or bottle, but do not autoclave the solution. Generally use the buffer the same day it is prepared, but do not keep more than 2 days. Store at 4°C.
3. Prepare proanthocyanidin binding solution using complete RNA buffer made
from step 2 above. Only 1 ml is needed per sample.
Ingredients Per 5 ml Per 10 ml Check
Complete RNA Buffer 5 ml 10 ml
Heparin 50 mg 100 mg 10mg/ml final
Polyproline 10 mg 20 mg 2 mg/ml final
BSA (Sigma A4503) 0.25 gram 0.5 gram 5% (w/v) final
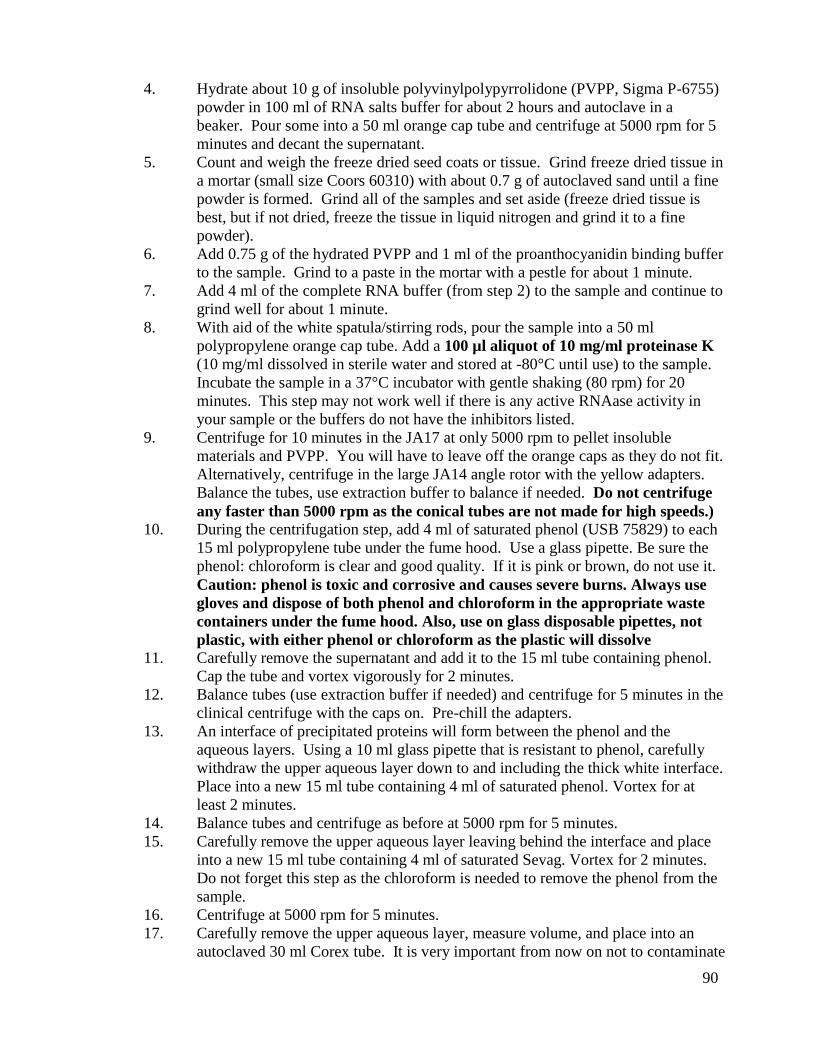
90
4. Hydrate about 10 g of insoluble polyvinylpolypyrrolidone (PVPP, Sigma P-6755)
powder in 100 ml of RNA salts buffer for about 2 hours and autoclave in a
beaker. Pour some into a 50 ml orange cap tube and centrifuge at 5000 rpm for 5
minutes and decant the supernatant.
5. Count and weigh the freeze dried seed coats or tissue. Grind freeze dried tissue in
a mortar (small size Coors 60310) with about 0.7 g of autoclaved sand until a fine
powder is formed. Grind all of the samples and set aside (freeze dried tissue is
best, but if not dried, freeze the tissue in liquid nitrogen and grind it to a fine
powder).
6. Add 0.75 g of the hydrated PVPP and 1 ml of the proanthocyanidin binding buffer
to the sample. Grind to a paste in the mortar with a pestle for about 1 minute.
7. Add 4 ml of the complete RNA buffer (from step 2) to the sample and continue to
grind well for about 1 minute.
8. With aid of the white spatula/stirring rods, pour the sample into a 50 ml
polypropylene orange cap tube. Add a 100 µl aliquot of 10 mg/ml proteinase K
(10 mg/ml dissolved in sterile water and stored at -80°C until use) to the sample.
Incubate the sample in a 37°C incubator with gentle shaking (80 rpm) for 20
minutes. This step may not work well if there is any active RNAase activity in
your sample or the buffers do not have the inhibitors listed.
9. Centrifuge for 10 minutes in the JA17 at only 5000 rpm to pellet insoluble
materials and PVPP. You will have to leave off the orange caps as they do not fit.
Alternatively, centrifuge in the large JA14 angle rotor with the yellow adapters.
Balance the tubes, use extraction buffer to balance if needed. Do not centrifuge
any faster than 5000 rpm as the conical tubes are not made for high speeds.)
10. During the centrifugation step, add 4 ml of saturated phenol (USB 75829) to each
15 ml polypropylene tube under the fume hood. Use a glass pipette. Be sure the
phenol: chloroform is clear and good quality. If it is pink or brown, do not use it.
Caution: phenol is toxic and corrosive and causes severe burns. Always use
gloves and dispose of both phenol and chloroform in the appropriate waste
containers under the fume hood. Also, use on glass disposable pipettes, not
plastic, with either phenol or chloroform as the plastic will dissolve 11. Carefully remove the supernatant and add it to the 15 ml tube containing phenol.
Cap the tube and vortex vigorously for 2 minutes.
12. Balance tubes (use extraction buffer if needed) and centrifuge for 5 minutes in the
clinical centrifuge with the caps on. Pre-chill the adapters.
13. An interface of precipitated proteins will form between the phenol and the
aqueous layers. Using a 10 ml glass pipette that is resistant to phenol, carefully
withdraw the upper aqueous layer down to and including the thick white interface.
Place into a new 15 ml tube containing 4 ml of saturated phenol. Vortex for at
least 2 minutes.
14. Balance tubes and centrifuge as before at 5000 rpm for 5 minutes.
15. Carefully remove the upper aqueous layer leaving behind the interface and place
into a new 15 ml tube containing 4 ml of saturated Sevag. Vortex for 2 minutes.
Do not forget this step as the chloroform is needed to remove the phenol from the
sample.
16. Centrifuge at 5000 rpm for 5 minutes.
17. Carefully remove the upper aqueous layer, measure volume, and place into an
autoclaved 30 ml Corex tube. It is very important from now on not to contaminate
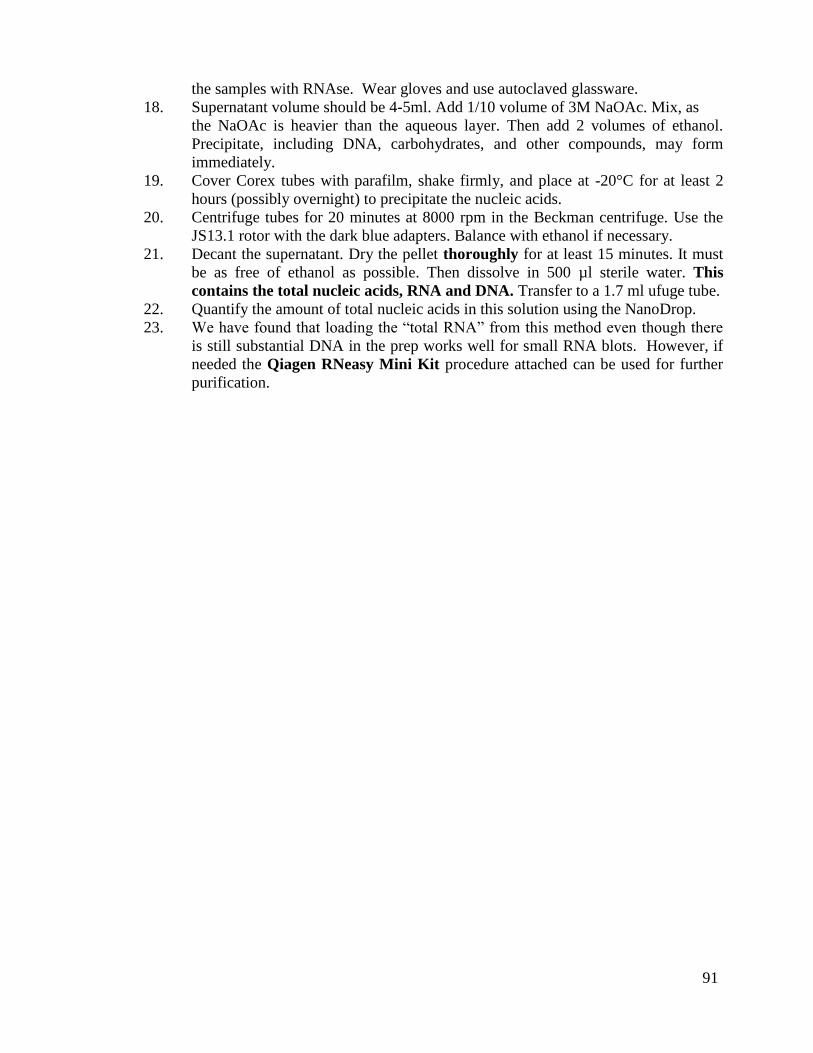
91
the samples with RNAse. Wear gloves and use autoclaved glassware.
18. Supernatant volume should be 4-5ml. Add 1/10 volume of 3M NaOAc. Mix, as
the NaOAc is heavier than the aqueous layer. Then add 2 volumes of ethanol.
Precipitate, including DNA, carbohydrates, and other compounds, may form
immediately.
19. Cover Corex tubes with parafilm, shake firmly, and place at -20°C for at least 2
hours (possibly overnight) to precipitate the nucleic acids.
20. Centrifuge tubes for 20 minutes at 8000 rpm in the Beckman centrifuge. Use the
JS13.1 rotor with the dark blue adapters. Balance with ethanol if necessary.
21. Decant the supernatant. Dry the pellet thoroughly for at least 15 minutes. It must
be as free of ethanol as possible. Then dissolve in 500 µl sterile water. This
contains the total nucleic acids, RNA and DNA. Transfer to a 1.7 ml ufuge tube.
22. Quantify the amount of total nucleic acids in this solution using the NanoDrop.
23. We have found that loading the “total RNA” from this method even though there
is still substantial DNA in the prep works well for small RNA blots. However, if
needed the Qiagen RNeasy Mini Kit procedure attached can be used for further
purification.
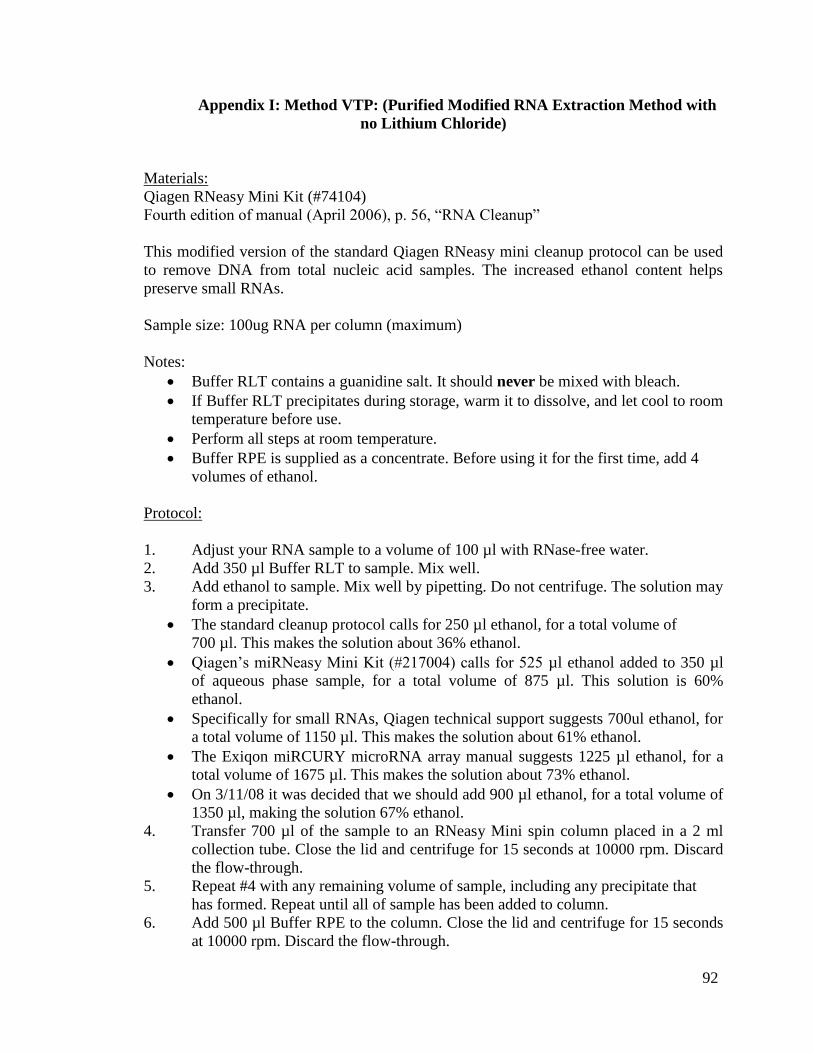
92
Appendix I: Method VTP: (Purified Modified RNA Extraction Method with
no Lithium Chloride)
Materials:
Qiagen RNeasy Mini Kit (#74104)
Fourth edition of manual (April 2006), p. 56, “RNA Cleanup”
This modified version of the standard Qiagen RNeasy mini cleanup protocol can be used
to remove DNA from total nucleic acid samples. The increased ethanol content helps
preserve small RNAs.
Sample size: 100ug RNA per column (maximum)
Notes:
Buffer RLT contains a guanidine salt. It should never be mixed with bleach.
If Buffer RLT precipitates during storage, warm it to dissolve, and let cool to room
temperature before use.
Perform all steps at room temperature.
Buffer RPE is supplied as a concentrate. Before using it for the first time, add 4
volumes of ethanol.
Protocol:
1. Adjust your RNA sample to a volume of 100 µl with RNase-free water.
2. Add 350 µl Buffer RLT to sample. Mix well.
3. Add ethanol to sample. Mix well by pipetting. Do not centrifuge. The solution may
form a precipitate.
The standard cleanup protocol calls for 250 µl ethanol, for a total volume of
700 µl. This makes the solution about 36% ethanol.
Qiagen’s miRNeasy Mini Kit (#217004) calls for 525 µl ethanol added to 350 µl
of aqueous phase sample, for a total volume of 875 µl. This solution is 60%
ethanol.
Specifically for small RNAs, Qiagen technical support suggests 700ul ethanol, for
a total volume of 1150 µl. This makes the solution about 61% ethanol.
The Exiqon miRCURY microRNA array manual suggests 1225 µl ethanol, for a
total volume of 1675 µl. This makes the solution about 73% ethanol.
On 3/11/08 it was decided that we should add 900 µl ethanol, for a total volume of
1350 µl, making the solution 67% ethanol.
4. Transfer 700 µl of the sample to an RNeasy Mini spin column placed in a 2 ml
collection tube. Close the lid and centrifuge for 15 seconds at 10000 rpm. Discard
the flow-through.
5. Repeat #4 with any remaining volume of sample, including any precipitate that
has formed. Repeat until all of sample has been added to column.
6. Add 500 µl Buffer RPE to the column. Close the lid and centrifuge for 15 seconds
at 10000 rpm. Discard the flow-through.

93
7. Add 500 µl Buffer RPE to the column again. Close the lid and centrifuge for 2
minutes at 10000 rpm to dry the column membrane and prevent ethanol carryover.
Discard flow-through.
8. Without adding any reagents, spin column again at 10000 rpm for 1 minute to
prevent ethanol carryover.
Optional: Place column in new 2ml collection tube before spinning.
9. Place spin column in a 1.5ml microfuge tube. Add 30-50 µl RNase-free water
directly to the column membrane. Close the lid and centrifuge for 1 minute at
10000 rpm to elute the RNA.
10. Add another 30-50 µl RNase-free water to the column, or add the eluate back to
the column. Close the lid and centrifuge for 1 minute at 10000 rpm.
Note: To get the highest possible yield, add more water to the column. To get a
more concentrated sample, add the eluate back to the column.
11. Quantify the amount of RNA in the sample using the NanoDrop. Store at -80°C.
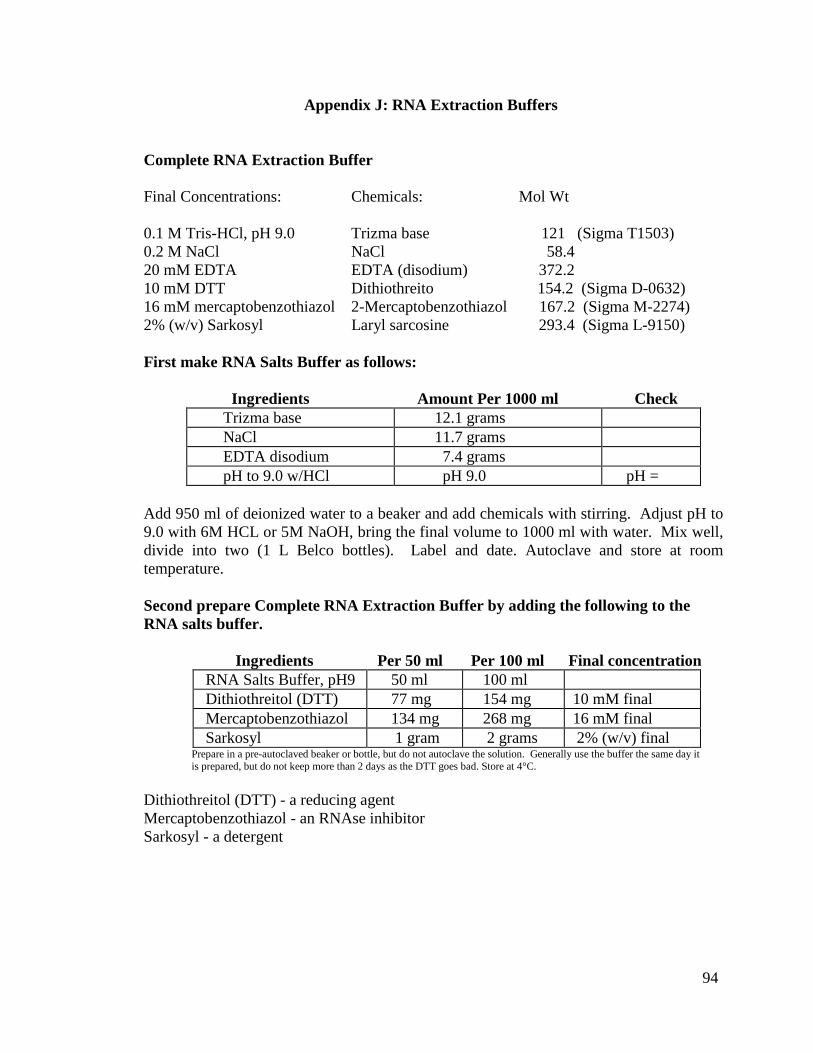
94
Appendix J: RNA Extraction Buffers
Complete RNA Extraction Buffer
Final Concentrations: Chemicals: Mol Wt
0.1 M Tris-HCl, pH 9.0 Trizma base 121 (Sigma T1503)
0.2 M NaCl NaCl 58.4
20 mM EDTA EDTA (disodium) 372.2
10 mM DTT Dithiothreito 154.2 (Sigma D-0632)
16 mM mercaptobenzothiazol 2-Mercaptobenzothiazol 167.2 (Sigma M-2274)
2% (w/v) Sarkosyl Laryl sarcosine 293.4 (Sigma L-9150)
First make RNA Salts Buffer as follows:
Ingredients Amount Per 1000 ml Check
Trizma base 12.1 grams
NaCl 11.7 grams
EDTA disodium 7.4 grams
pH to 9.0 w/HCl pH 9.0 pH =
Add 950 ml of deionized water to a beaker and add chemicals with stirring. Adjust pH to
9.0 with 6M HCL or 5M NaOH, bring the final volume to 1000 ml with water. Mix well,
divide into two (1 L Belco bottles). Label and date. Autoclave and store at room
temperature.
Second prepare Complete RNA Extraction Buffer by adding the following to the
RNA salts buffer.
Ingredients Per 50 ml Per 100 ml Final concentration
RNA Salts Buffer, pH9 50 ml 100 ml
Dithiothreitol (DTT) 77 mg 154 mg 10 mM final
Mercaptobenzothiazol 134 mg 268 mg 16 mM final
Sarkosyl 1 gram 2 grams 2% (w/v) final Prepare in a pre-autoclaved beaker or bottle, but do not autoclave the solution. Generally use the buffer the same day it
is prepared, but do not keep more than 2 days as the DTT goes bad. Store at 4°C.
Dithiothreitol (DTT) - a reducing agent
Mercaptobenzothiazol - an RNAse inhibitor
Sarkosyl - a detergent
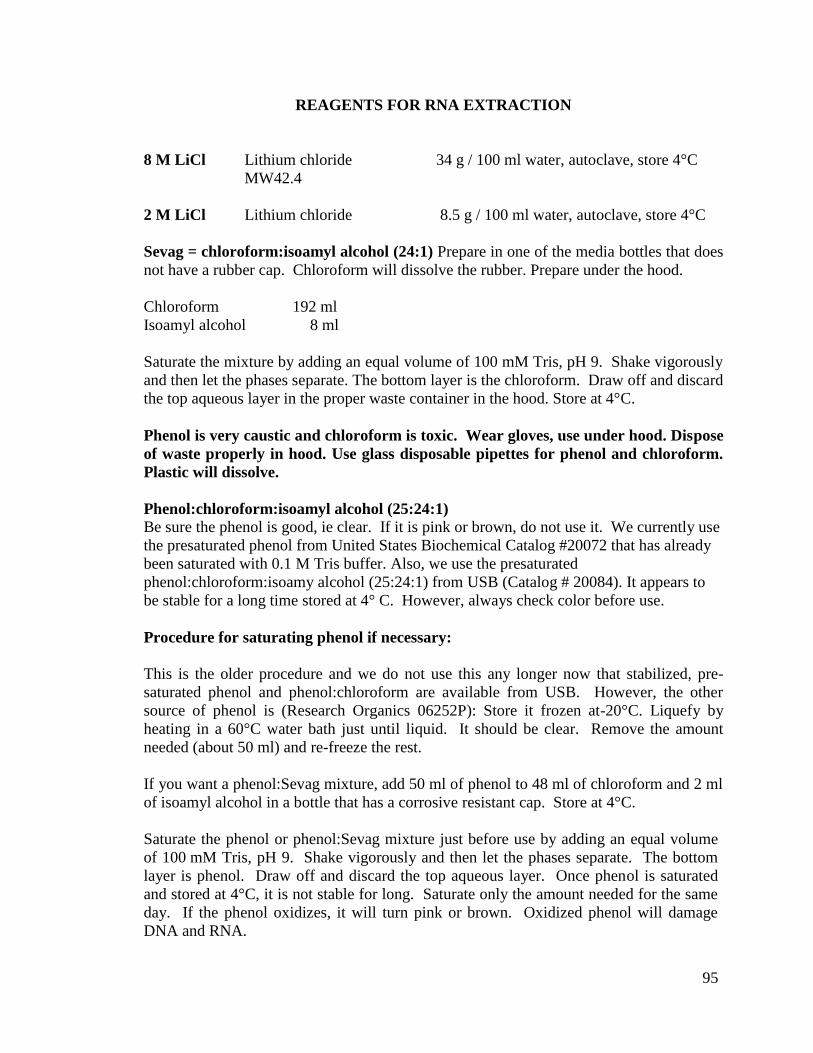
95
REAGENTS FOR RNA EXTRACTION
8 M LiCl Lithium chloride 34 g / 100 ml water, autoclave, store 4°C
MW42.4
2 M LiCl Lithium chloride 8.5 g / 100 ml water, autoclave, store 4°C
Sevag = chloroform:isoamyl alcohol (24:1) Prepare in one of the media bottles that does
not have a rubber cap. Chloroform will dissolve the rubber. Prepare under the hood.
Chloroform 192 ml
Isoamyl alcohol 8 ml
Saturate the mixture by adding an equal volume of 100 mM Tris, pH 9. Shake vigorously
and then let the phases separate. The bottom layer is the chloroform. Draw off and discard
the top aqueous layer in the proper waste container in the hood. Store at 4°C.
Phenol is very caustic and chloroform is toxic. Wear gloves, use under hood. Dispose
of waste properly in hood. Use glass disposable pipettes for phenol and chloroform.
Plastic will dissolve.
Phenol:chloroform:isoamyl alcohol (25:24:1)
Be sure the phenol is good, ie clear. If it is pink or brown, do not use it. We currently use
the presaturated phenol from United States Biochemical Catalog #20072 that has already
been saturated with 0.1 M Tris buffer. Also, we use the presaturated
phenol:chloroform:isoamy alcohol (25:24:1) from USB (Catalog # 20084). It appears to
be stable for a long time stored at 4° C. However, always check color before use.
Procedure for saturating phenol if necessary:
This is the older procedure and we do not use this any longer now that stabilized, pre-
saturated phenol and phenol:chloroform are available from USB. However, the other
source of phenol is (Research Organics 06252P): Store it frozen at-20°C. Liquefy by
heating in a 60°C water bath just until liquid. It should be clear. Remove the amount
needed (about 50 ml) and re-freeze the rest.
If you want a phenol:Sevag mixture, add 50 ml of phenol to 48 ml of chloroform and 2 ml
of isoamyl alcohol in a bottle that has a corrosive resistant cap. Store at 4°C.
Saturate the phenol or phenol:Sevag mixture just before use by adding an equal volume
of 100 mM Tris, pH 9. Shake vigorously and then let the phases separate. The bottom
layer is phenol. Draw off and discard the top aqueous layer. Once phenol is saturated
and stored at 4°C, it is not stable for long. Saturate only the amount needed for the same
day. If the phenol oxidizes, it will turn pink or brown. Oxidized phenol will damage
DNA and RNA.
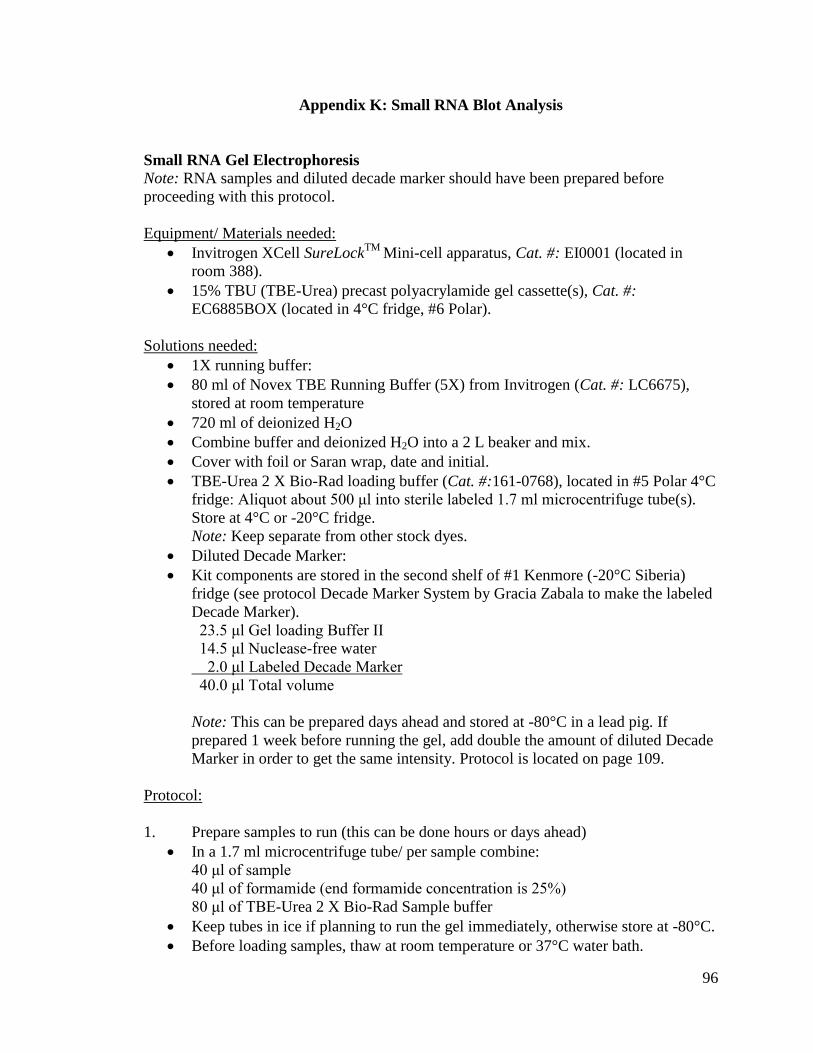
96
Appendix K: Small RNA Blot Analysis
Small RNA Gel Electrophoresis
Note: RNA samples and diluted decade marker should have been prepared before
proceeding with this protocol.
Equipment/ Materials needed:
Invitrogen XCell SureLockTM
Mini-cell apparatus, Cat. #: EI0001 (located in
room 388).
15% TBU (TBE-Urea) precast polyacrylamide gel cassette(s), Cat. #:
EC6885BOX (located in 4°C fridge, #6 Polar).
Solutions needed:
1X running buffer:
80 ml of Novex TBE Running Buffer (5X) from Invitrogen (Cat. #: LC6675),
stored at room temperature
720 ml of deionized H2O
Combine buffer and deionized H2O into a 2 L beaker and mix.
Cover with foil or Saran wrap, date and initial.
TBE-Urea 2 X Bio-Rad loading buffer (Cat. #:161-0768), located in #5 Polar 4°C
fridge: Aliquot about 500 μl into sterile labeled 1.7 ml microcentrifuge tube(s).
Store at 4°C or -20°C fridge.
Note: Keep separate from other stock dyes.
Diluted Decade Marker:
Kit components are stored in the second shelf of #1 Kenmore (-20°C Siberia)
fridge (see protocol Decade Marker System by Gracia Zabala to make the labeled
Decade Marker).
23.5 μl Gel loading Buffer II
14.5 μl Nuclease-free water
2.0 μl Labeled Decade Marker
40.0 μl Total volume
Note: This can be prepared days ahead and stored at -80°C in a lead pig. If
prepared 1 week before running the gel, add double the amount of diluted Decade
Marker in order to get the same intensity. Protocol is located on page 109.
Protocol:
1. Prepare samples to run (this can be done hours or days ahead)
In a 1.7 ml microcentrifuge tube/ per sample combine:
40 μl of sample
40 μl of formamide (end formamide concentration is 25%)
80 μl of TBE-Urea 2 X Bio-Rad Sample buffer
Keep tubes in ice if planning to run the gel immediately, otherwise store at -80°C.
Before loading samples, thaw at room temperature or 37°C water bath.
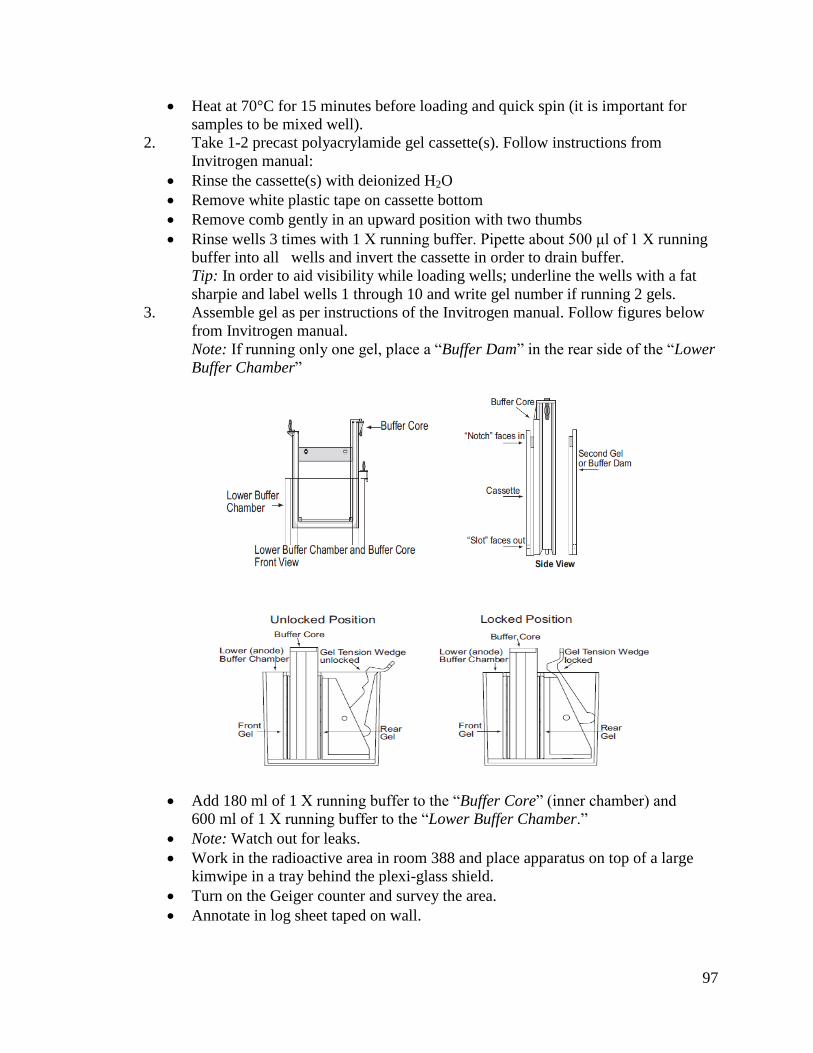
97
Heat at 70°C for 15 minutes before loading and quick spin (it is important for
samples to be mixed well).
2. Take 1-2 precast polyacrylamide gel cassette(s). Follow instructions from
Invitrogen manual:
Rinse the cassette(s) with deionized H2O
Remove white plastic tape on cassette bottom
Remove comb gently in an upward position with two thumbs
Rinse wells 3 times with 1 X running buffer. Pipette about 500 μl of 1 X running
buffer into all wells and invert the cassette in order to drain buffer.
Tip: In order to aid visibility while loading wells; underline the wells with a fat
sharpie and label wells 1 through 10 and write gel number if running 2 gels.
3. Assemble gel as per instructions of the Invitrogen manual. Follow figures below
from Invitrogen manual.
Note: If running only one gel, place a “Buffer Dam” in the rear side of the “Lower
Buffer Chamber”
Add 180 ml of 1 X running buffer to the “Buffer Core” (inner chamber) and
600 ml of 1 X running buffer to the “Lower Buffer Chamber.”
Note: Watch out for leaks.
Work in the radioactive area in room 388 and place apparatus on top of a large
kimwipe in a tray behind the plexi-glass shield.
Turn on the Geiger counter and survey the area.
Annotate in log sheet taped on wall.
98
4. Load heated samples with the long clear pipette tips (1-200 μl Microcapillary tips-
round/ M μl TI flex) and diluted Decade Marker.
Note: make sure that samples are mixed well.
5. Close apparatus with the “Cell Safety Lid with Cables”, plug into the
electrophoretic power unit.
6. Run gel for about 2 hours and 15 minutes or more between 107 V-108 V, 3-5 mA.
7. Disassemble as per instructions from Invitrogen manual.
Turn off power and disconnect cables
Take cassette(s) and place on top of the rectangular plexi-glass container.
Carefully insert the “Gel knife” along edges of the cassette(s) and push carefully
up and down in order to break open the cassette(s).
8. With a razor blade, cut the overhangs of the gel(s) and cut the left corner over the
lane 1 side in order to identify gel direction. Place the side of the cassette with the
polyacrylamide gel in a Tupperware container; add enough 1X running buffer to
cover the gel. Set aside for 5 min.
Note: if running two gels, to avoid confusion label each tray with the gel numbers.
9. Proceed to transfer gel(s) to the Mini Trans-Blot electrophoretic transfer cell
apparatus from Bio-Rad. Follow instructions from manual about setting the “Gel
sandwich(s)” in the gel holder cassette(s).
10. After starting the blotting procedure, clean up the work area:
Check used materials with the Geiger counter
Discard running buffer in the Radioactive waste bin
Rinse apparatus with deionized H2O very well and set to dry
Note: Proceed to work the Small RNA Blotting Protocol.
Small RNA Gel Blotting
Note: this should be done after protocol Small RNA Gel Electrophoresis.
Equipment needed:
Mini Trans-Blot Electrophoretic Transfer Cell (Bio-Rad Mini-Protean II), Cat. #:
170-3930.
Solutions needed:
Prepare 1X TBE transfer buffer:
Use Invitrogen Novex® TBE Running buffer (5 X), Cat. #: LC6675
200 ml of 5 X TBE
800 ml of deionized H2O
Combine in a 1 L bottle and store at 4°C.
Wash Buffer for Small RNA blot (2 X SSC + 0.2% SDS):
100 ml of 20 X SSC
900 ml of ultrapure deionized H2O
2 g of SDS
Pour ingredients in a 2 L beaker with a stir bar
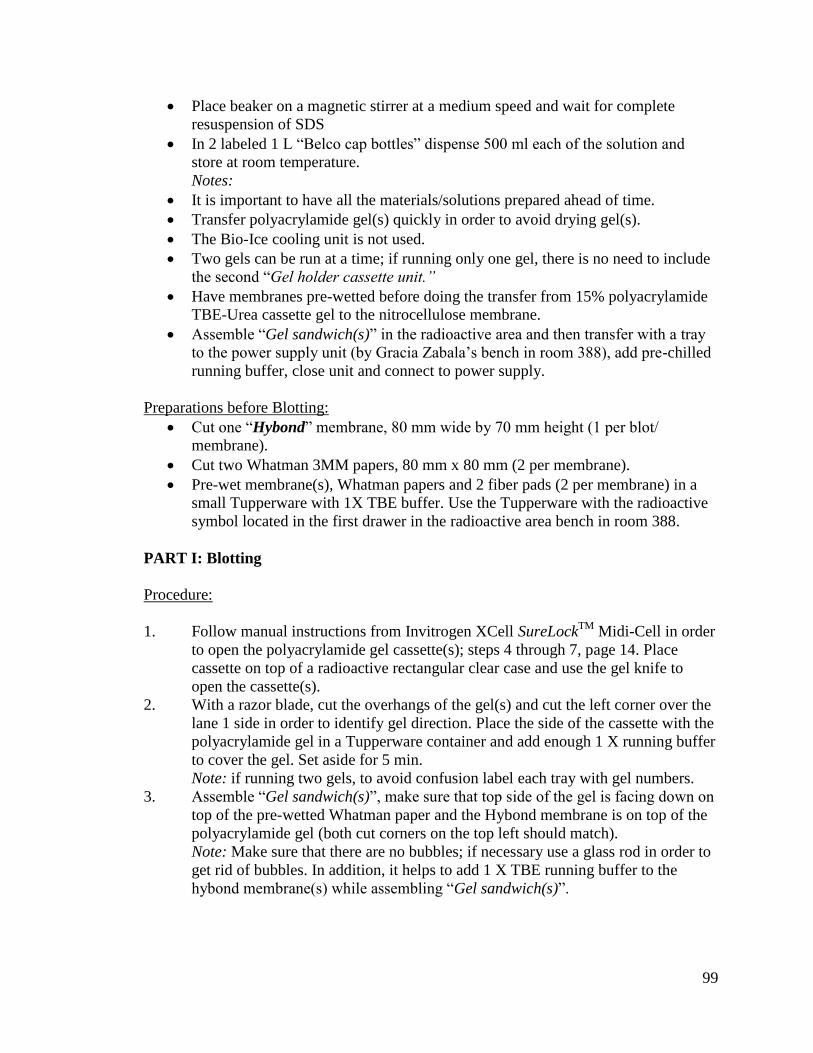
99
Place beaker on a magnetic stirrer at a medium speed and wait for complete
resuspension of SDS
In 2 labeled 1 L “Belco cap bottles” dispense 500 ml each of the solution and
store at room temperature.
Notes:
It is important to have all the materials/solutions prepared ahead of time.
Transfer polyacrylamide gel(s) quickly in order to avoid drying gel(s).
The Bio-Ice cooling unit is not used.
Two gels can be run at a time; if running only one gel, there is no need to include
the second “Gel holder cassette unit.”
Have membranes pre-wetted before doing the transfer from 15% polyacrylamide
TBE-Urea cassette gel to the nitrocellulose membrane.
Assemble “Gel sandwich(s)” in the radioactive area and then transfer with a tray
to the power supply unit (by Gracia Zabala’s bench in room 388), add pre-chilled
running buffer, close unit and connect to power supply.
Preparations before Blotting:
Cut one “Hybond” membrane, 80 mm wide by 70 mm height (1 per blot/
membrane).
Cut two Whatman 3MM papers, 80 mm x 80 mm (2 per membrane).
Pre-wet membrane(s), Whatman papers and 2 fiber pads (2 per membrane) in a
small Tupperware with 1X TBE buffer. Use the Tupperware with the radioactive
symbol located in the first drawer in the radioactive area bench in room 388.
PART I: Blotting
Procedure:
1. Follow manual instructions from Invitrogen XCell SureLockTM
Midi-Cell in order
to open the polyacrylamide gel cassette(s); steps 4 through 7, page 14. Place
cassette on top of a radioactive rectangular clear case and use the gel knife to
open the cassette(s).
2. With a razor blade, cut the overhangs of the gel(s) and cut the left corner over the
lane 1 side in order to identify gel direction. Place the side of the cassette with the
polyacrylamide gel in a Tupperware container and add enough 1 X running buffer
to cover the gel. Set aside for 5 min.
Note: if running two gels, to avoid confusion label each tray with gel numbers.
3. Assemble “Gel sandwich(s)”, make sure that top side of the gel is facing down on
top of the pre-wetted Whatman paper and the Hybond membrane is on top of the
polyacrylamide gel (both cut corners on the top left should match).
Note: Make sure that there are no bubbles; if necessary use a glass rod in order to
get rid of bubbles. In addition, it helps to add 1 X TBE running buffer to the
hybond membrane(s) while assembling “Gel sandwich(s)”.
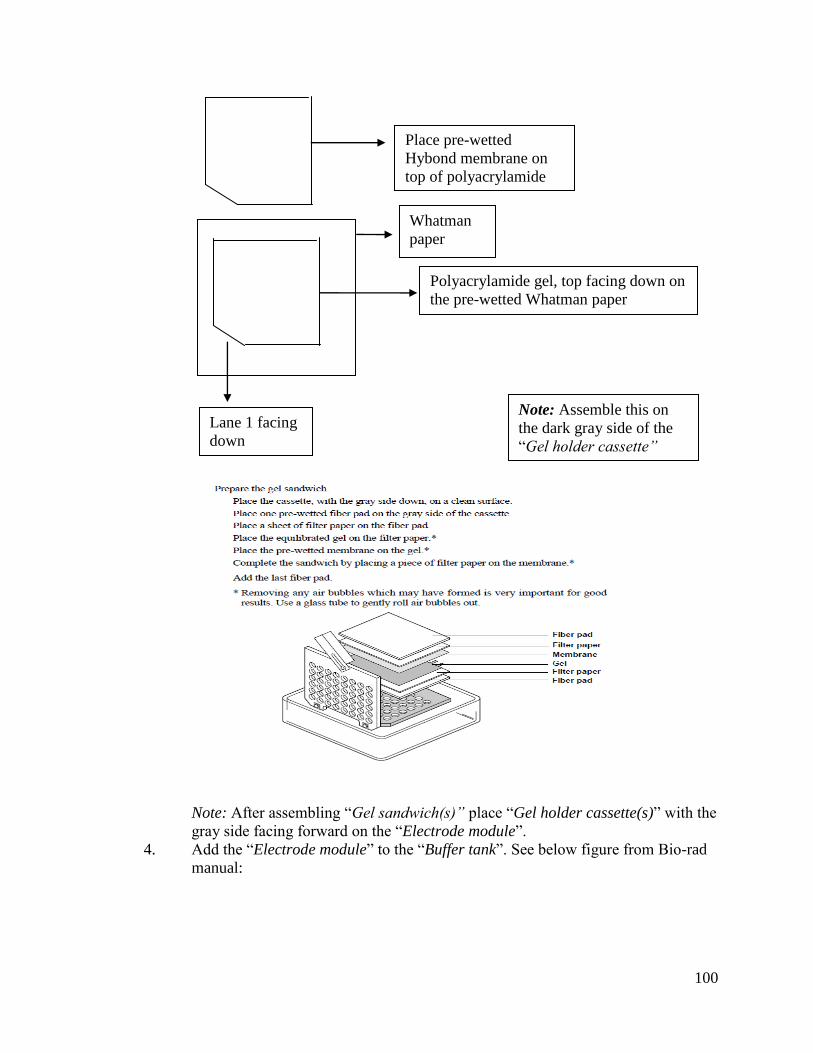
100
Note: After assembling “Gel sandwich(s)” place “Gel holder cassette(s)” with the
gray side facing forward on the “Electrode module”.
4. Add the “Electrode module” to the “Buffer tank”. See below figure from Bio-rad
manual:
Polyacrylamide gel, top facing down on
the pre-wetted Whatman paper
Whatman
paper
Lane 1 facing
down
Place pre-wetted
Hybond membrane on
top of polyacrylamide gel
Note: Assemble this on
the dark gray side of the
“Gel holder cassette”
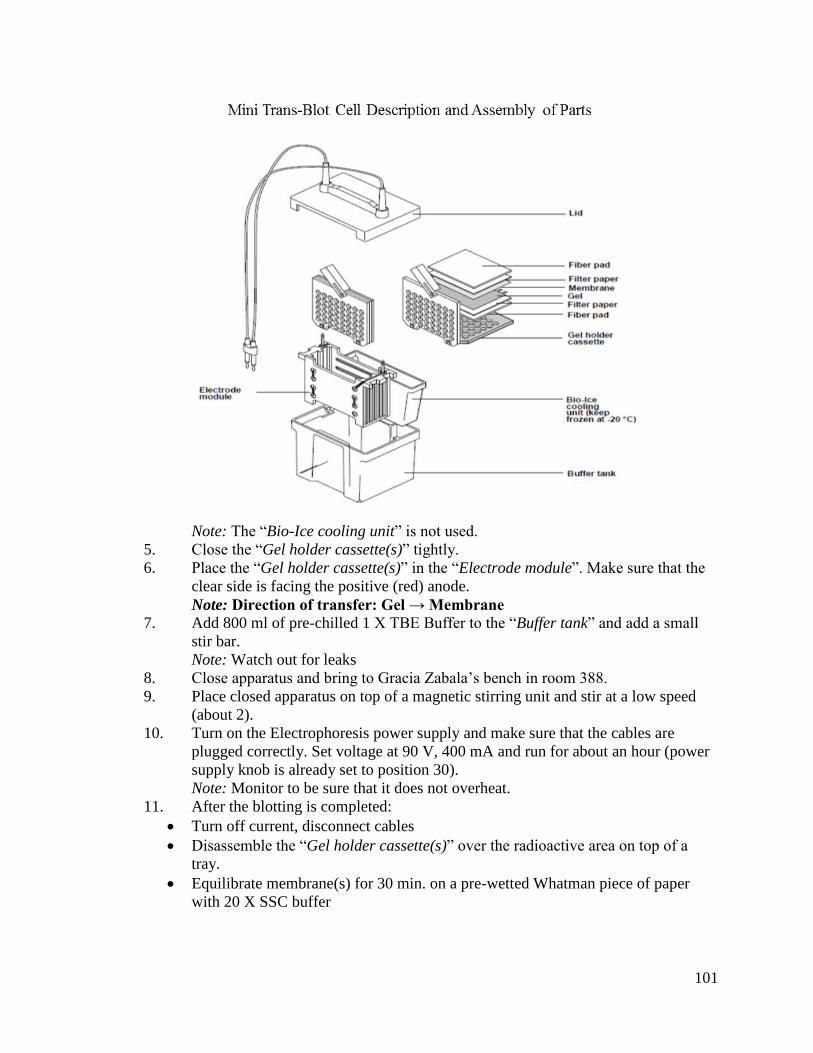
101
Note: The “Bio-Ice cooling unit” is not used.
5. Close the “Gel holder cassette(s)” tightly.
6. Place the “Gel holder cassette(s)” in the “Electrode module”. Make sure that the
clear side is facing the positive (red) anode.
Note: Direction of transfer: Gel → Membrane 7. Add 800 ml of pre-chilled 1 X TBE Buffer to the “Buffer tank” and add a small
stir bar.
Note: Watch out for leaks
8. Close apparatus and bring to Gracia Zabala’s bench in room 388.
9. Place closed apparatus on top of a magnetic stirring unit and stir at a low speed
(about 2).
10. Turn on the Electrophoresis power supply and make sure that the cables are
plugged correctly. Set voltage at 90 V, 400 mA and run for about an hour (power
supply knob is already set to position 30).
Note: Monitor to be sure that it does not overheat.
11. After the blotting is completed:
Turn off current, disconnect cables
Disassemble the “Gel holder cassette(s)” over the radioactive area on top of a
tray.
Equilibrate membrane(s) for 30 min. on a pre-wetted Whatman piece of paper
with 20 X SSC buffer
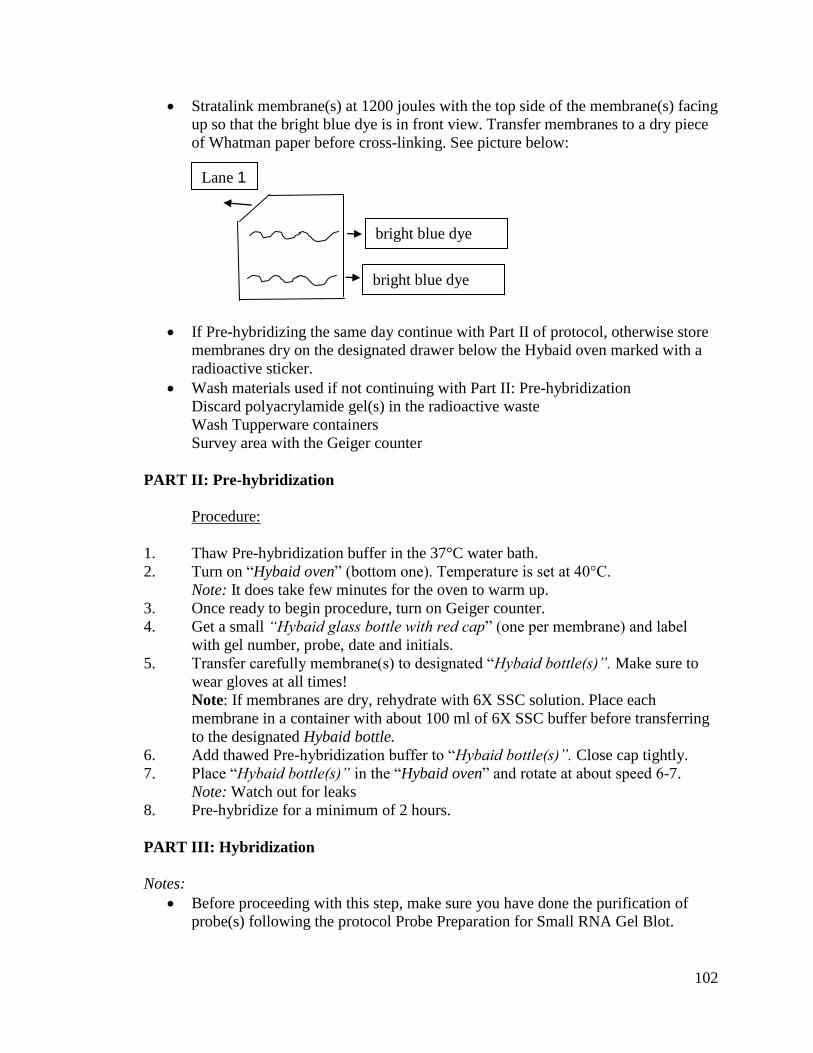
102
Stratalink membrane(s) at 1200 joules with the top side of the membrane(s) facing
up so that the bright blue dye is in front view. Transfer membranes to a dry piece
of Whatman paper before cross-linking. See picture below:
If Pre-hybridizing the same day continue with Part II of protocol, otherwise store
membranes dry on the designated drawer below the Hybaid oven marked with a
radioactive sticker.
Wash materials used if not continuing with Part II: Pre-hybridization
Discard polyacrylamide gel(s) in the radioactive waste
Wash Tupperware containers
Survey area with the Geiger counter
PART II: Pre-hybridization
Procedure:
1. Thaw Pre-hybridization buffer in the 37°C water bath.
2. Turn on “Hybaid oven” (bottom one). Temperature is set at 40°C.
Note: It does take few minutes for the oven to warm up.
3. Once ready to begin procedure, turn on Geiger counter.
4. Get a small “Hybaid glass bottle with red cap” (one per membrane) and label
with gel number, probe, date and initials.
5. Transfer carefully membrane(s) to designated “Hybaid bottle(s)”. Make sure to
wear gloves at all times!
Note: If membranes are dry, rehydrate with 6X SSC solution. Place each
membrane in a container with about 100 ml of 6X SSC buffer before transferring
to the designated Hybaid bottle.
6. Add thawed Pre-hybridization buffer to “Hybaid bottle(s)”. Close cap tightly.
7. Place “Hybaid bottle(s)” in the “Hybaid oven” and rotate at about speed 6-7.
Note: Watch out for leaks
8. Pre-hybridize for a minimum of 2 hours.
PART III: Hybridization
Notes:
Before proceeding with this step, make sure you have done the purification of
probe(s) following the protocol Probe Preparation for Small RNA Gel Blot.
bright blue dye
bright blue dye
Lane 1
103
Heat probes at 68°C in water bath for 10 minutes and cool down for 5
minutes before usage.
Procedure:
1. Turn on Geiger counter.
2. Take “Hybaid bottle(s)” out of the “Hybaid oven” and add purified
probe(s) very carefully.
3. Close cap tightly.
4. Place “Hybaid bottle(s)” in the “Hybaid oven” and rotate at about speed 6-7.
Note: Watch out for leaks
5. Hybridize overnight. Temperature is set at 40°C.
6. Once finished with the procedure, survey area with the Geiger counter.
7. Proceed to wash materials used:
Discard polyacrylamide gel(s) in the radioactive waste.
Wash Tupperware containers.
Survey area with the Geiger counter.
PART IV: Washing of Blot(s)
Procedure:
1. Turn on the water bath shaker set at 40°C.
2. Label one small Tupperware per membrane and add 150 ml of Wash Buffer for
Small RNA blot (2 X SSC + 0.2% SDS) solution, set aside.
3. Get one 50 ml conical tube- orange cap per blot and place a radioactive sticker;
annotate radioactive isotope used, quantity, probe name, date, gel number and
initials. This is done in order to save the radioactive labeled probe with the
pre-hybridization solution.
4. Turn on Geiger counter.
5. Take “Hybaid bottle(s)” out of the “Hybaid oven” and place in the rack behind
the plexi-glass shield. Record the total time of Hybridization.
6. Pour the pre-hybridization solution(s) with the radiolabeled probe(s) into the
labeled 50 ml conical tube(s) - orange cap. Close lid tightly, store in a plexi-glass
container and place in the -20°C fridge in room 388 (#7 Kenmore, 3rd
shelf).
7. Add 100 ml of Wash Buffer for Small RNA blot (2 X SSC + 0.2% SDS) solution
to the “Hybaid bottle(s)”. This is done in order to release the membrane from the
sides of the “Hybaid bottle(s)”.
8. Use small tweezers to take out membrane(s) and place facing down in the small-
labeled Tupperware container with the 150 ml of Wash Buffer for Small RNA
blot (2 X SSC + 0.2% SDS) solution, close lid tightly.
9. Place Tupperware container in the water bath shaker set at 40°C. Place a Lead
pig on top of the container. Do not cover the water bath shaker with its metal lid.
Incubate for 15 min.
104
10. In the meantime:
Get a piece of saran wrap and place over the radioactive area bench. This is done
in order to wrap the membrane(s) after washing procedure.
Discard Wash Buffer for Small RNA blot (2 X SSC + 0.2% SDS) solution
contained in the “Hybaid bottle(s)” in the Liquid radioactive waste bin.
Wash “Hybaid bottle(s)” and store solutions/ materials used.
11. After washing the membrane(s), transfer carefully membrane(s) on top of the
piece of Saran wrap with the orientation of lane 1 on top-left corner (see figure
below). Fold over Saran wrap and label. Grab the Geiger counter and check
carefully membrane.
12. Place membrane on top of a used film and label the lane 1 position with adhesive
tape and place in the metal cassette with the “Enhancer screen”.
13. From the (#5 polar, 4°C) fridge get Amersham box of films (Product code
RPN1677K, 8x10 inches) located in room 386.
14. Get Dark room keys (#5) from cabinet in room 386.
15. In the dark room, take out 1 piece of film (make sure that it is not the cardboard
piece) and place between the membrane(s) and “Enhancer screen”. Close metal
cassette tightly.
16. Back in room 388, store metal cassette(s) with film(s) in the -80°C freezer.
Usually one day exposure with the “Enhancer screen” gives a very intense signal,
also 4 days exposure without the “Enhancer screen” reduces the intensity of the
signal.
17. Proceed to clean up and store materials used.
Part V: Film exposure
1. Once ready to develop film:
Turn on X-ray processor (takes about 15 min. to clean).
Defrost metal cassette(s) with film(s) for 30 min. (takes about 6 min. to develop
one film).
Lane 1
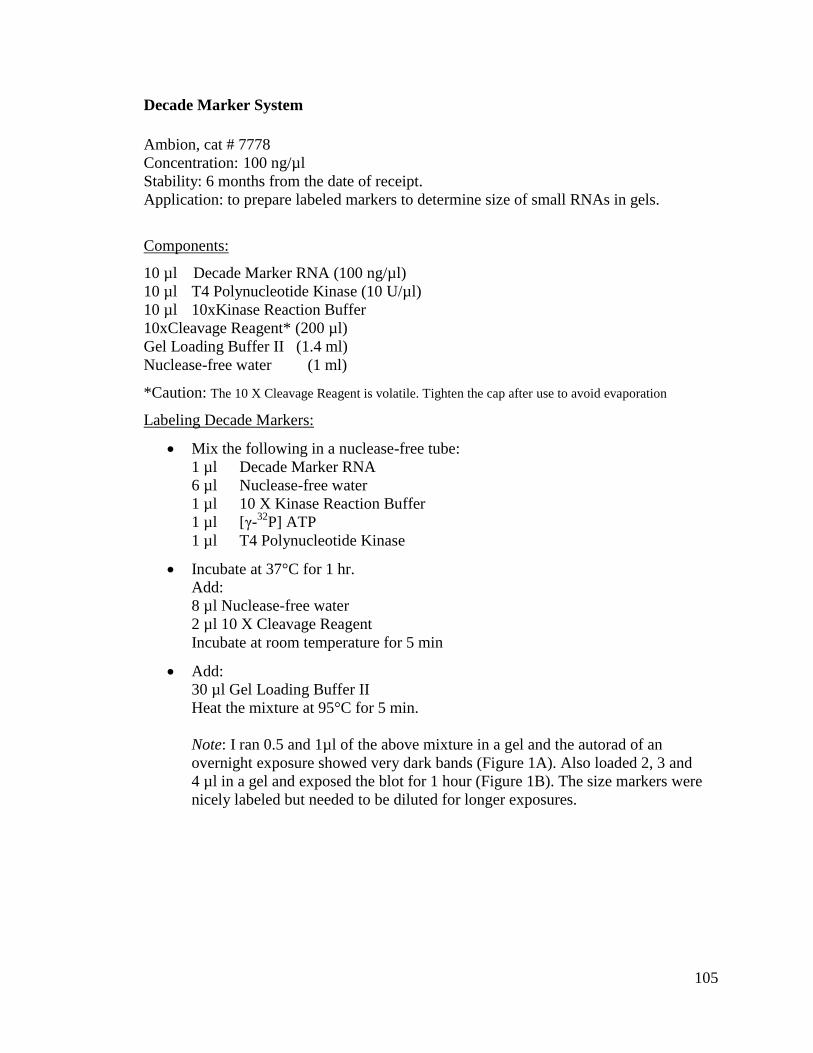
105
Decade Marker System
Ambion, cat # 7778
Concentration: 100 ng/µl Stability: 6 months from the date of receipt.
Application: to prepare labeled markers to determine size of small RNAs in gels.
Components:
10 µl Decade Marker RNA (100 ng/µl)
10 µl T4 Polynucleotide Kinase (10 U/µl)
10 µl 10xKinase Reaction Buffer
10xCleavage Reagent* (200 µl)
Gel Loading Buffer II (1.4 ml)
Nuclease-free water (1 ml)
*Caution: The 10 X Cleavage Reagent is volatile. Tighten the cap after use to avoid evaporation
Labeling Decade Markers:
Mix the following in a nuclease-free tube:
1 µl Decade Marker RNA
6 µl Nuclease-free water
1 µl 10 X Kinase Reaction Buffer
1 µl [γ-32
P] ATP
1 µl T4 Polynucleotide Kinase
Incubate at 37°C for 1 hr.
Add:
8 µl Nuclease-free water
2 µl 10 X Cleavage Reagent
Incubate at room temperature for 5 min
Add:
30 µl Gel Loading Buffer II
Heat the mixture at 95°C for 5 min.
Note: I ran 0.5 and 1µl of the above mixture in a gel and the autorad of an
overnight exposure showed very dark bands (Figure 1A). Also loaded 2, 3 and
4 µl in a gel and exposed the blot for 1 hour (Figure 1B). The size markers were
nicely labeled but needed to be diluted for longer exposures.
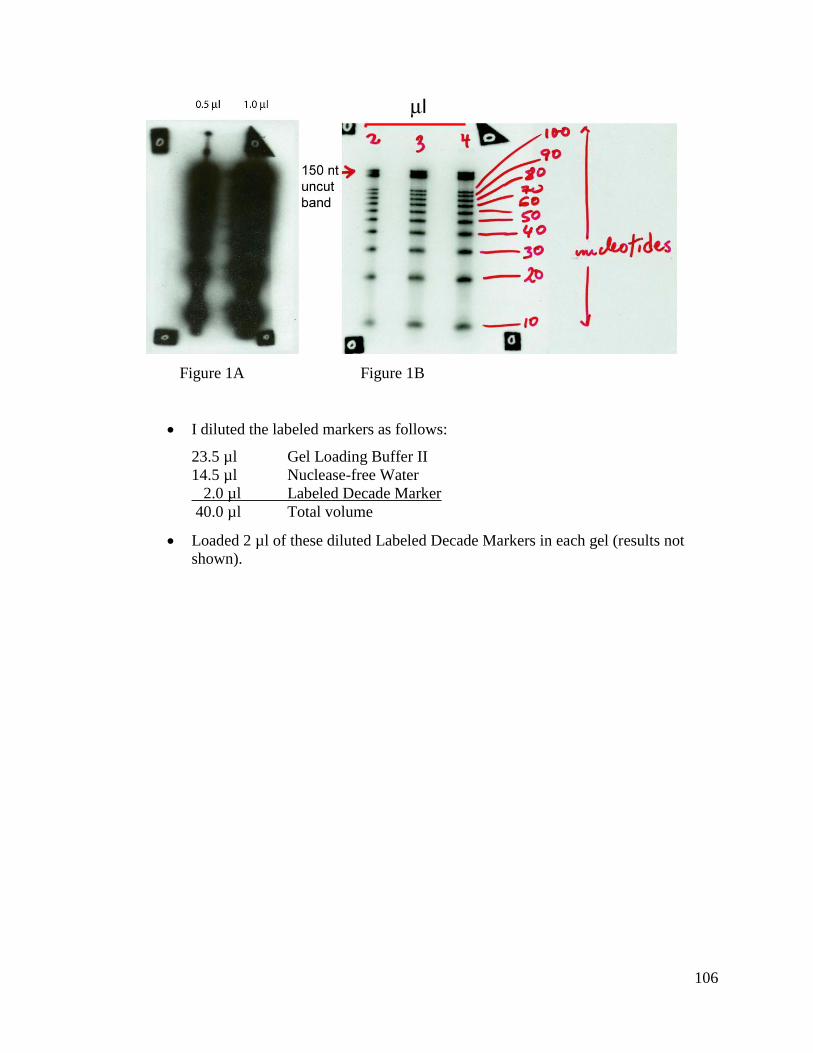
106
Figure 1A Figure 1B
I diluted the labeled markers as follows:
23.5 µl Gel Loading Buffer II
14.5 µl Nuclease-free Water
2.0 µl Labeled Decade Marker
40.0 µl Total volume
Loaded 2 µl of these diluted Labeled Decade Markers in each gel (results not
shown).
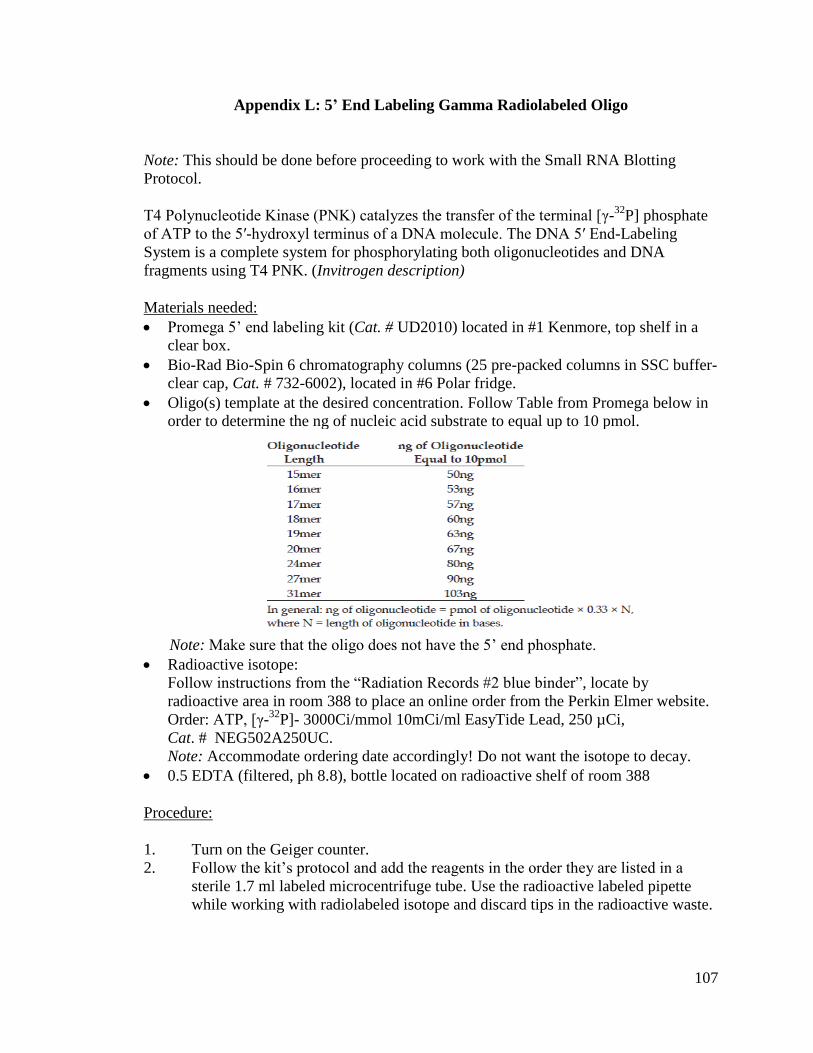
107
Appendix L: 5’ End Labeling Gamma Radiolabeled Oligo
Note: This should be done before proceeding to work with the Small RNA Blotting
Protocol.
T4 Polynucleotide Kinase (PNK) catalyzes the transfer of the terminal [γ-32
P] phosphate
of ATP to the 5′-hydroxyl terminus of a DNA molecule. The DNA 5′ End-Labeling
System is a complete system for phosphorylating both oligonucleotides and DNA
fragments using T4 PNK. (Invitrogen description)
Materials needed:
Promega 5’ end labeling kit (Cat. # UD2010) located in #1 Kenmore, top shelf in a
clear box.
Bio-Rad Bio-Spin 6 chromatography columns (25 pre-packed columns in SSC buffer-
clear cap, Cat. # 732-6002), located in #6 Polar fridge.
Oligo(s) template at the desired concentration. Follow Table from Promega below in
order to determine the ng of nucleic acid substrate to equal up to 10 pmol.
Note: Make sure that the oligo does not have the 5’ end phosphate.
Radioactive isotope:
Follow instructions from the “Radiation Records #2 blue binder”, locate by
radioactive area in room 388 to place an online order from the Perkin Elmer website.
Order: ATP, [γ-32
P]- 3000Ci/mmol 10mCi/ml EasyTide Lead, 250 µCi,
Cat. # NEG502A250UC.
Note: Accommodate ordering date accordingly! Do not want the isotope to decay.
0.5 EDTA (filtered, ph 8.8), bottle located on radioactive shelf of room 388
Procedure:
1. Turn on the Geiger counter.
2. Follow the kit’s protocol and add the reagents in the order they are listed in a
sterile 1.7 ml labeled microcentrifuge tube. Use the radioactive labeled pipette
while working with radiolabeled isotope and discard tips in the radioactive waste.
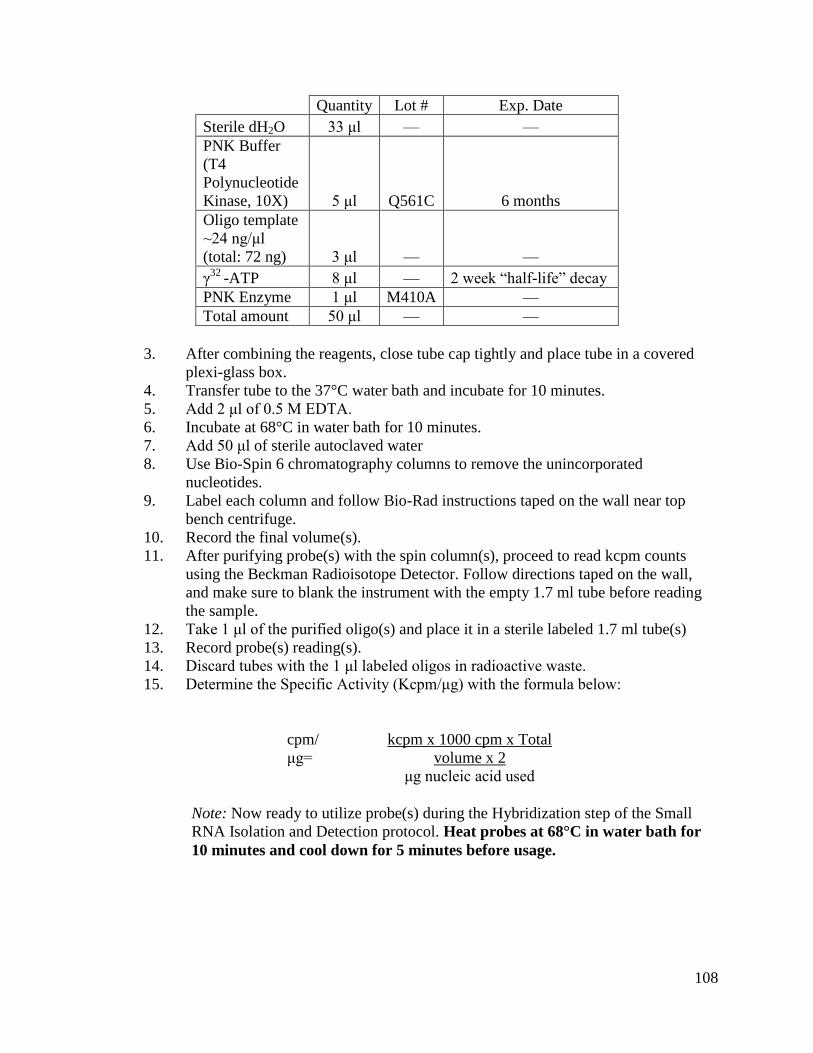
108
Quantity Lot # Exp. Date
Sterile dH2O 33 μl — —
PNK Buffer
(T4
Polynucleotide
Kinase, 10X) 5 μl Q561C 6 months
Oligo template
~24 ng/μl
(total: 72 ng) 3 μl — —
γ32
-ATP 8 μl — 2 week “half-life” decay
PNK Enzyme 1 μl M410A —
Total amount 50 μl — —
3. After combining the reagents, close tube cap tightly and place tube in a covered
plexi-glass box.
4. Transfer tube to the 37°C water bath and incubate for 10 minutes.
5. Add 2 μl of 0.5 M EDTA.
6. Incubate at 68°C in water bath for 10 minutes.
7. Add 50 μl of sterile autoclaved water
8. Use Bio-Spin 6 chromatography columns to remove the unincorporated
nucleotides.
9. Label each column and follow Bio-Rad instructions taped on the wall near top
bench centrifuge.
10. Record the final volume(s).
11. After purifying probe(s) with the spin column(s), proceed to read kcpm counts
using the Beckman Radioisotope Detector. Follow directions taped on the wall,
and make sure to blank the instrument with the empty 1.7 ml tube before reading
the sample.
12. Take 1 μl of the purified oligo(s) and place it in a sterile labeled 1.7 ml tube(s)
13. Record probe(s) reading(s).
14. Discard tubes with the 1 μl labeled oligos in radioactive waste.
15. Determine the Specific Activity (Kcpm/μg) with the formula below:
cpm/
μg=
kcpm x 1000 cpm x Total
volume x 2
μg nucleic acid used
Note: Now ready to utilize probe(s) during the Hybridization step of the Small
RNA Isolation and Detection protocol. Heat probes at 68°C in water bath for
10 minutes and cool down for 5 minutes before usage.
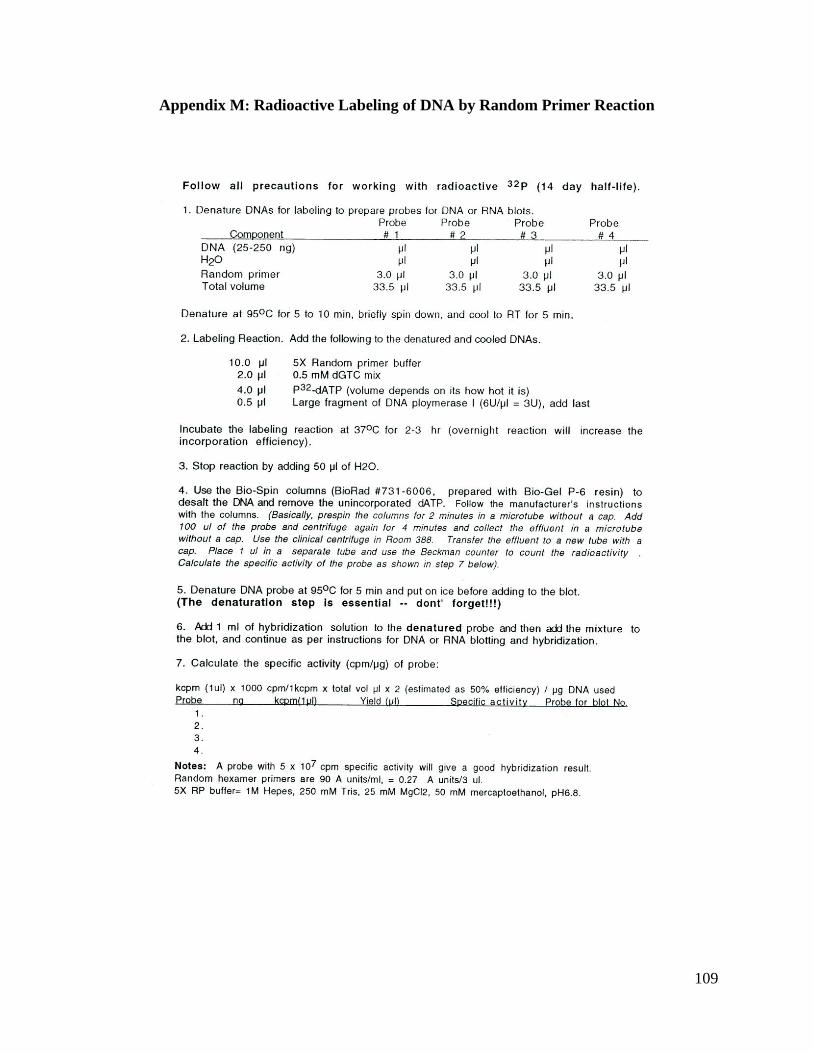
109
Appendix M: Radioactive Labeling of DNA by Random Primer Reaction
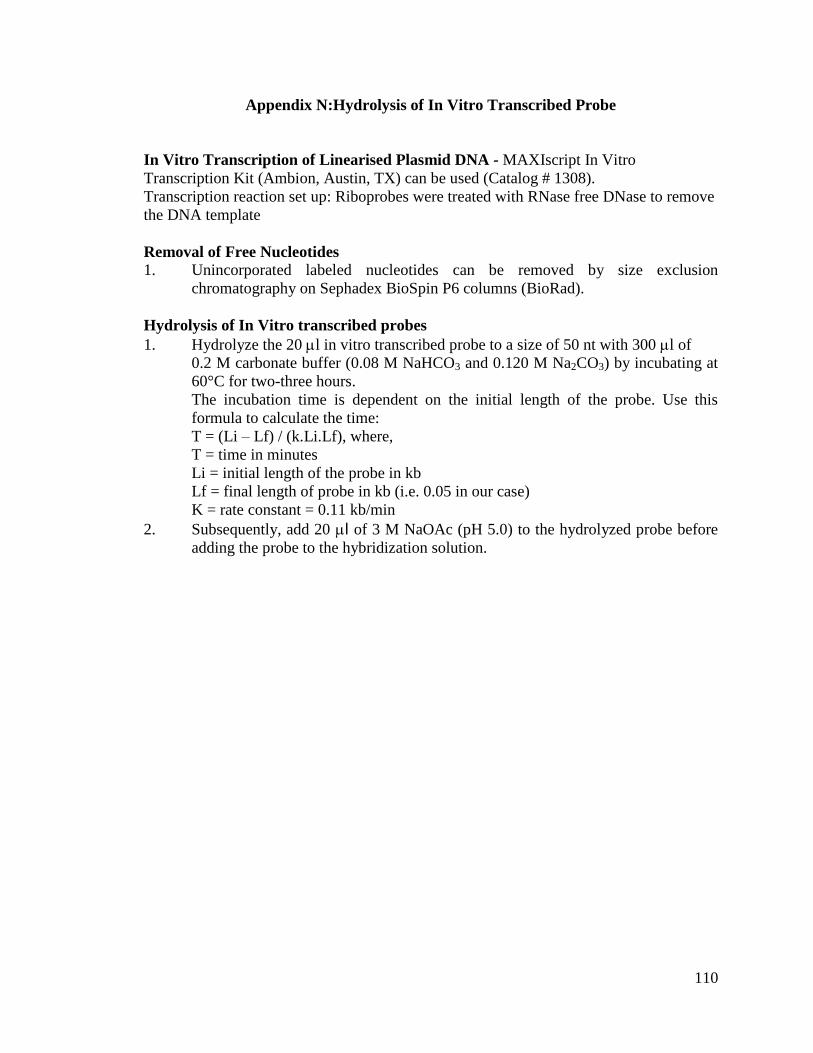
110
Appendix N:Hydrolysis of In Vitro Transcribed Probe
In Vitro Transcription of Linearised Plasmid DNA - MAXIscript In Vitro
Transcription Kit (Ambion, Austin, TX) can be used (Catalog # 1308).
Transcription reaction set up: Riboprobes were treated with RNase free DNase to remove
the DNA template
Removal of Free Nucleotides 1. Unincorporated labeled nucleotides can be removed by size exclusion
chromatography on Sephadex BioSpin P6 columns (BioRad).
Hydrolysis of In Vitro transcribed probes
1. Hydrolyze the 20 l in vitro transcribed probe to a size of 50 nt with 300 l of
0.2 M carbonate buffer (0.08 M NaHCO3 and 0.120 M Na2CO3) by incubating at
60°C for two-three hours.
The incubation time is dependent on the initial length of the probe. Use this
formula to calculate the time:
T = (Li – Lf) / (k.Li.Lf), where,
T = time in minutes
Li = initial length of the probe in kb
Lf = final length of probe in kb (i.e. 0.05 in our case)
K = rate constant = 0.11 kb/min
2. Subsequently, add 20 l of 3 M NaOAc (pH 5.0) to the hydrolyzed probe before
adding the probe to the hybridization solution.
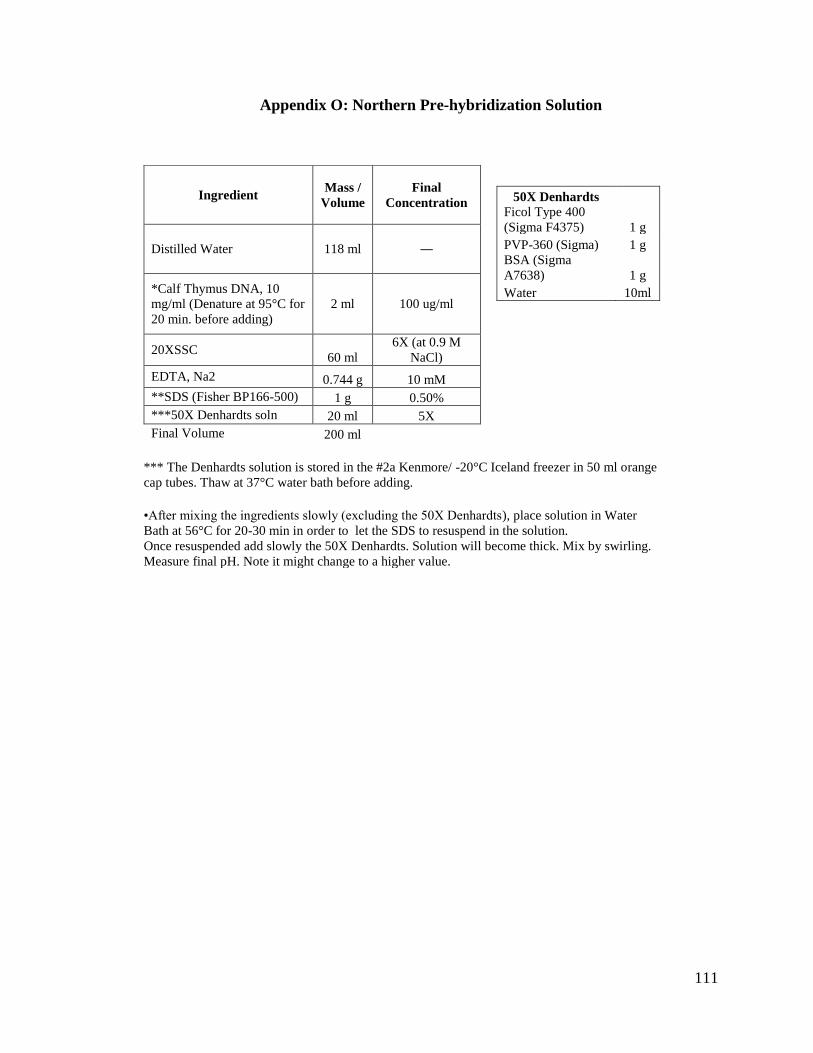
111
Appendix O: Northern Pre-hybridization Solution
Ingredient Mass /
Volume
Final
Concentration
Distilled Water 118 ml ―
*Calf Thymus DNA, 10
mg/ml (Denature at 95°C for
20 min. before adding)
2 ml 100 ug/ml
20XSSC 60 ml
6X (at 0.9 M
NaCl)
EDTA, Na2 0.744 g 10 mM
**SDS (Fisher BP166-500) 1 g 0.50%
***50X Denhardts soln 20 ml 5X
Final Volume 200 ml
50X Denhardts
Ficol Type 400
(Sigma F4375) 1 g
PVP-360 (Sigma) 1 g
BSA (Sigma
A7638) 1 g
Water 10ml
*** The Denhardts solution is stored in the #2a Kenmore/ -20°C Iceland freezer in 50 ml orange
cap tubes. Thaw at 37°C water bath before adding.
•After mixing the ingredients slowly (excluding the 50X Denhardts), place solution in Water
Bath at 56°C for 20-30 min in order to let the SDS to resuspend in the solution.
Once resuspended add slowly the 50X Denhardts. Solution will become thick. Mix by swirling.
Measure final pH. Note it might change to a higher value.
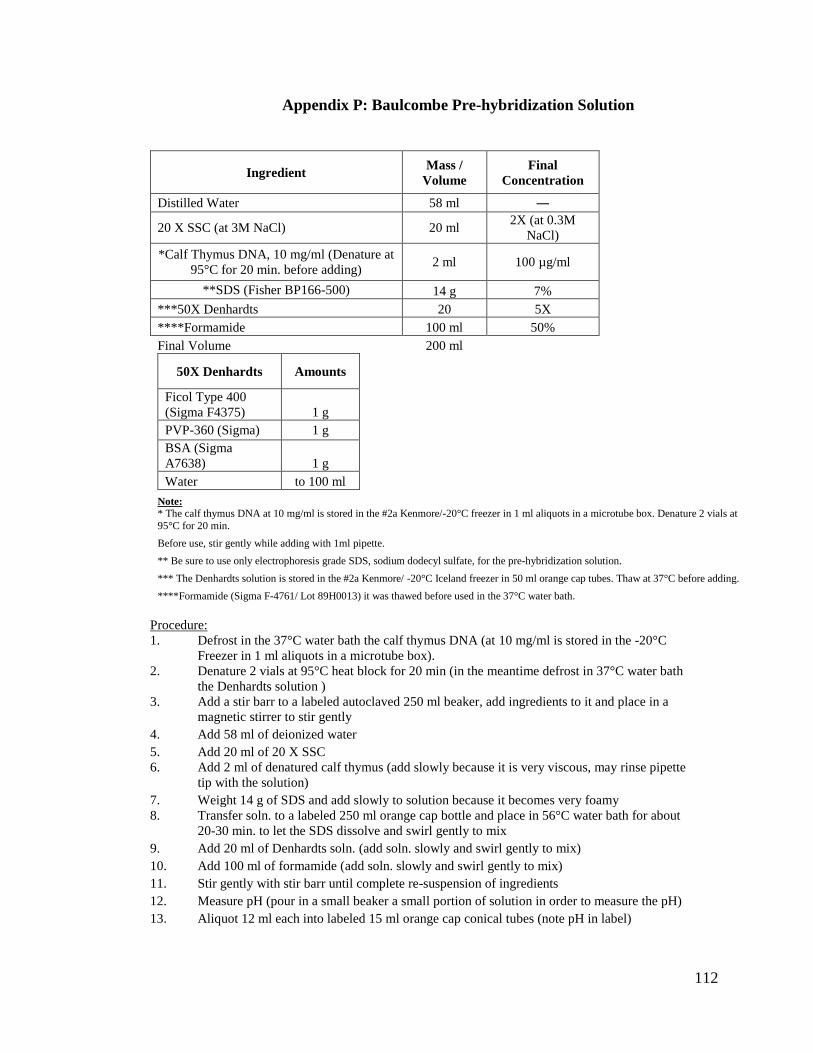
112
Appendix P: Baulcombe Pre-hybridization Solution
Ingredient Mass /
Volume
Final
Concentration
Distilled Water 58 ml ―
20 X SSC (at 3M NaCl) 20 ml
2X (at 0.3M
NaCl)
*Calf Thymus DNA, 10 mg/ml (Denature at
95°C for 20 min. before adding) 2 ml 100 µg/ml
**SDS (Fisher BP166-500) 14 g 7%
***50X Denhardts 20 5X
****Formamide 100 ml 50%
Final Volume 200 ml
50X Denhardts Amounts
Ficol Type 400
(Sigma F4375) 1 g
PVP-360 (Sigma) 1 g
BSA (Sigma
A7638) 1 g
Water to 100 ml
Note:
* The calf thymus DNA at 10 mg/ml is stored in the #2a Kenmore/-20°C freezer in 1 ml aliquots in a microtube box. Denature 2 vials at
95°C for 20 min.
Before use, stir gently while adding with 1ml pipette.
** Be sure to use only electrophoresis grade SDS, sodium dodecyl sulfate, for the pre-hybridization solution.
*** The Denhardts solution is stored in the #2a Kenmore/ -20°C Iceland freezer in 50 ml orange cap tubes. Thaw at 37°C before adding.
****Formamide (Sigma F-4761/ Lot 89H0013) it was thawed before used in the 37°C water bath.
Procedure:
1. Defrost in the 37°C water bath the calf thymus DNA (at 10 mg/ml is stored in the -20°C
Freezer in 1 ml aliquots in a microtube box).
2. Denature 2 vials at 95°C heat block for 20 min (in the meantime defrost in 37°C water bath
the Denhardts solution )
3. Add a stir barr to a labeled autoclaved 250 ml beaker, add ingredients to it and place in a
magnetic stirrer to stir gently
4. Add 58 ml of deionized water
5. Add 20 ml of 20 X SSC
6. Add 2 ml of denatured calf thymus (add slowly because it is very viscous, may rinse pipette
tip with the solution)
7. Weight 14 g of SDS and add slowly to solution because it becomes very foamy
8. Transfer soln. to a labeled 250 ml orange cap bottle and place in 56°C water bath for about
20-30 min. to let the SDS dissolve and swirl gently to mix
9. Add 20 ml of Denhardts soln. (add soln. slowly and swirl gently to mix)
10. Add 100 ml of formamide (add soln. slowly and swirl gently to mix)
11. Stir gently with stir barr until complete re-suspension of ingredients
12. Measure pH (pour in a small beaker a small portion of solution in order to measure the pH)
13. Aliquot 12 ml each into labeled 15 ml orange cap conical tubes (note pH in label)
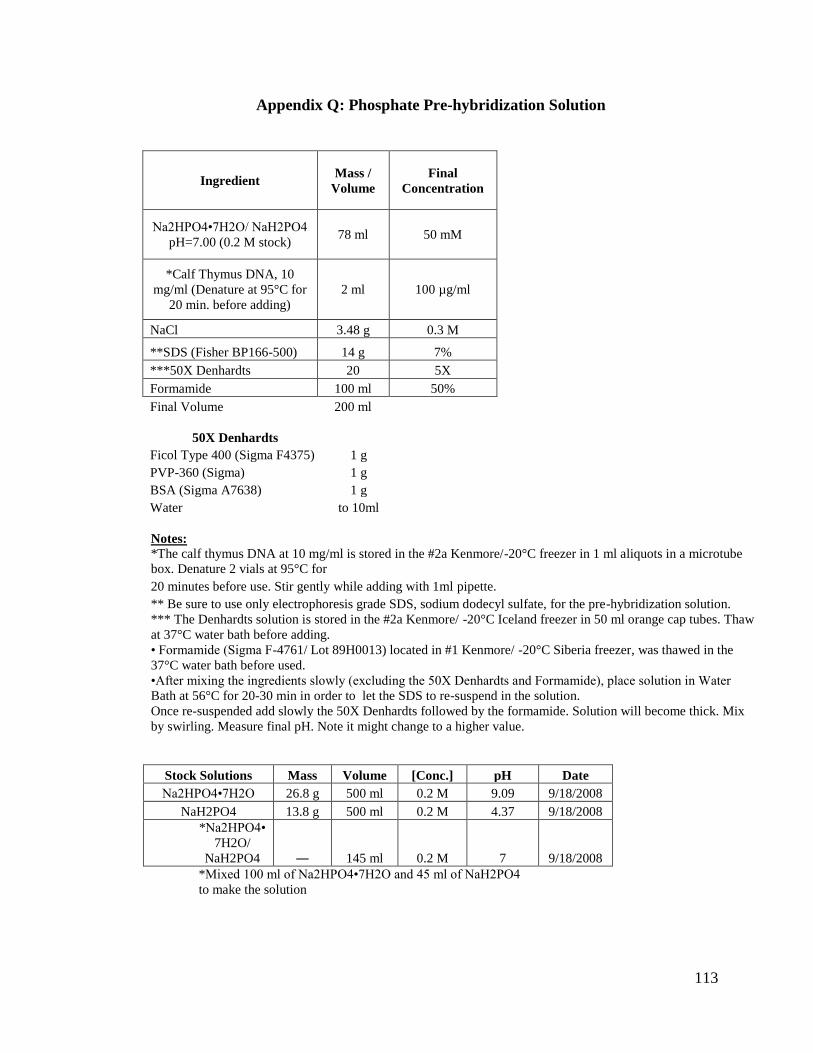
113
Appendix Q: Phosphate Pre-hybridization Solution
Ingredient Mass /
Volume
Final
Concentration
Na2HPO4•7H2O/ NaH2PO4
pH=7.00 (0.2 M stock) 78 ml 50 mM
*Calf Thymus DNA, 10
mg/ml (Denature at 95°C for
20 min. before adding)
2 ml 100 µg/ml
NaCl 3.48 g 0.3 M
**SDS (Fisher BP166-500) 14 g 7%
***50X Denhardts 20 5X
Formamide 100 ml 50%
Final Volume 200 ml
50X Denhardts
Ficol Type 400 (Sigma F4375) 1 g
PVP-360 (Sigma) 1 g
BSA (Sigma A7638) 1 g
Water to 10ml
Notes:
*The calf thymus DNA at 10 mg/ml is stored in the #2a Kenmore/-20°C freezer in 1 ml aliquots in a microtube
box. Denature 2 vials at 95°C for
20 minutes before use. Stir gently while adding with 1ml pipette.
** Be sure to use only electrophoresis grade SDS, sodium dodecyl sulfate, for the pre-hybridization solution.
*** The Denhardts solution is stored in the #2a Kenmore/ -20°C Iceland freezer in 50 ml orange cap tubes. Thaw
at 37°C water bath before adding.
• Formamide (Sigma F-4761/ Lot 89H0013) located in #1 Kenmore/ -20°C Siberia freezer, was thawed in the
37°C water bath before used.
•After mixing the ingredients slowly (excluding the 50X Denhardts and Formamide), place solution in Water
Bath at 56°C for 20-30 min in order to let the SDS to re-suspend in the solution.
Once re-suspended add slowly the 50X Denhardts followed by the formamide. Solution will become thick. Mix
by swirling. Measure final pH. Note it might change to a higher value.
Stock Solutions Mass Volume [Conc.] pH Date
Na2HPO4•7H2O 26.8 g 500 ml 0.2 M 9.09 9/18/2008
NaH2PO4 13.8 g 500 ml 0.2 M 4.37 9/18/2008
*Na2HPO4•
7H2O/
NaH2PO4 ― 145 ml 0.2 M 7 9/18/2008
*Mixed 100 ml of Na2HPO4•7H2O and 45 ml of NaH2PO4
to make the solution
114
LITERATURE CITED
Ausubel, F. M., Brent, R., Kingston, R. E., Moore, D. D., Seidman, J. G., Smith, J.
A., and Struhl, K. (1987). Current protocols in molecular biology 4.3.1–4.3.3,
John Wiley and Sons, NY.
Ausubel, F.M. et al. (2003) Current Protocols in Molecular Biology Vol. 3, John Wiley
and Sons, NY.
Bartel, D.P. (2004). “MicroRNAs: genomics, biogenesis, mechanism, and function.” Cell 116(2):281-297.
Bartlett, J.M. (2002) Approaches to the analysis of gene expression using mRNA: A
technical overview. Mol. Biotechnol. 21: 149–60.
Baulcombe, D. (2004). RNA Silencing in Plants. Nature 431: 356-363.
Buzzell, R. I., Buttery, B. R., and MacTavish, D. C. (1987). Biochemical genetics of
black pigmentation of soybean seed. J. of Heredity. 78: 53-54.
Couzin, J. (2002). Breakthrough of the year: Small RNAS make big splash, Science 298:
2296-2297.
Fire, A., Xu, S.Q., Montgomery, M.K., Kostas, S.A., Driver, S.E., and Mello, C.C.
(1998). Potent and specific genetic interference by double-stranded RNA in
Caenorhabditis elegans. Nature 391: 806-811.
Feinberg, A.P., and Vogelstein, B. (1983). A technique for radiolabeling DNA
restriction endonuclease fragments to high specific activity. Analytical
Biochemistry 132: 6-13.
Jorgensen, R. (2004).“Petunia image cover in issue 5689: Piecing Together Human
Aging ” [The phenomenon now known as RNA interference (RNAi) was first
uncovered as a sequence-specific gene silencing response provoked by the
introduction of exogenous multicopy transgenes into petunia. This resulted in
flowers with two-toned color patterns.] Science 305: 1353-1512.
Hamilton, A.J., and Baulcombe, D.C. (1999). A series of small antisense RNA in
posttranscriptional gene silencing in plants [comment]. Science 286: 950-952.
Hamilton, A., Voinnet, O., Chappell, L., and Baulcombe, D. (2002). Two classes of
short interfering RNA in RNA silencing. EMBO Journal 21, 4671-4679.
115
Koes, R. E., Spelt, C. E., Mol, J. N. M., and Gerats G. (1987). The chalcone synthase
multigene family of Petunia hybrida (V 30); sequence homology, chromosomal
location and evolutionary aspects. Plant Mol Bio. 10: 159-169.
Lee J. L., and Costlow N. A. (1987). A molecular titration assay to measure transcript
prevalence levels. Methods Enzymol. 152:633-648.
Long, S. (1989) Rhixobium-legume nodulation: life together in the underground. Cell 56:
203-214.
McCarty, D. (1986). A simple method for the extraction of RNA from maize tissue.
Maize Genetics Cooperation Newsletter 60: 61.
Moscatiello, R., Squartini, A., Mariani, P. and Navazio, L. (2010). Flavonoid-induced
calcium signalling in Rhizobium leguminosarum bv. viciae. New Phytologist,
188: 814–823.
Napoli, C., Lemieux, C., and Jorgensen, R. (1990). Introduction of a chimeric chalcone
synthase gene into petunia results in a reversible co-suppression of homologous
genes in trans. Plant Cell 2: 279-289.
Röll, A. (2006) “RNAi mechanism illustration”. The Nobel Committee for Physiology or
Medicine.
Roth, C.M. (2002). Quantifying gene expression. Curr. Issues Mol. Biol. 4: 93–100.
Ryder, T.B., Hedrick, S.A., Bell, J.N., Liang, X.W., Clouse, S.D., and Lamb, C.J.
(1987). Organization and differential activation of a gene family encoding the
plant defense enzyme chalcone synthase in Phaseolus vulgaris. Molecular and
General Genetics 210: 219-233.
Sambrook, J., Fritsch, E.F., and Maniatis, T. (1989). Molecular Cloning: A
Laboratory Manual. Ed. 2. Cold Spring Harbor Laboratory Press, Cold Spring
Harbor, NY.
Sambrook and Russell. (2001). Molecular Cloning: A Laboratory Manual Ed. 3. Cold
Spring Harbor Laboratory Press, Cold Spring Harbor, NY.
Stafford, H. A. (1990). Flavonoid Metabolism. CRC Press, Boca Raton, FL pp. 105-107.
Todd, J.J., and Vodkin, L.O. (1996). Duplications that suppress and deletions that
restore expression from a chalcone synthase multigene family. Plant Cell 8: 687-
699.
116
Tuteja, J.H., Clough, S.J., Chan, W.C., and Vodkin, L.O. (2004) Tissue-specific gene
silencing mediated by a naturally occurring chalcone synthase gene cluster in
Glycine max. Plant Cell 16: 819-835.
Tuteja, J.H., Zabala, G., Varala, K., Hudson, M., and Vodkin, L.O. (2009).
Endogenous, tissue-specific short interfering RNAs silence the chalcone synthase
gene family in Glycine max seed coats. Plant Cell 21:3063-3077.
van der Krol, A.R., Mur, L.A., Beld, M., Mol, J.N., and Stuitje, A.R. (1990).
Flavanoid genes in petunia: addition of a limited number of gene copies may lead
to a suppression of gene expression, Plant Cell 2: 291-299.
Wallace, D.M. (1987). Precipitation of Nucleic Acids, Methods of Enzymology 152:41-
46.
Wang, N., and Fisher, D.B. (1994). The use of fluorescent traces to characterize the
post-phloem transport pathway in maternal tissues of developing wheat grains.
Plant Physiology 104: 17-27.
Wang, C.S., Todd, J.J., and Vodkin, L.O. (1994). Chalcone synthase mRNA and
activity are reduced in yellow soybean seed coats with dominant I alleles. Plant
Physiology 105: 739-748.
Wu, Miin-Feng, Qing Tian, and Jason M. Reed. (2006). "Arabidopsis MicroRNA167
Controls Patterns of ARF6 and ARF8 Expression, and Regulates Both Female and
Male Reproduction." Web <://dev.biologists.org/content/133/21/4211.abstract>.
Zuker, M. (1995-2010). “mfold server.” Rensselaer Polytechnic Institute. Web
<http://mfold.bioinfo.rpi.edu/cgi-bin/rna-form1.cgi.>.