Embed Size (px)
Citation preview
Hindawi Publishing CorporationThe Scientific World JournalVolume 2013 Article ID 897624 7 pageshttpdxdoiorg1011552013897624
Research ArticleDifferentiating between Underwater Construction Noiseof Monopile and Jacket Foundations for Offshore WindmillsA Case Study from the Belgian Part of the North Sea
Alain Michel Jules Norro Bob Rumes and Steven Johan Degraer
Royal Belgian Institute of Natural Sciences Management Unit of the North Sea Mathematical Models Gulledelle 1001200 Brussels Belgium
Correspondence should be addressed to Alain Michel Jules Norro anorromummacbe
Received 9 January 2013 Accepted 5 February 2013
Academic Editors A Azzellino D Conley J P Kofoed and D Vicinanza
Copyright copy 2013 Alain Michel Jules Norro et al This is an open access article distributed under the Creative CommonsAttribution License which permits unrestricted use distribution and reproduction in any medium provided the original work isproperly cited
Steel monopiles jackets requiring four steel pinpiles and gravity-based foundations were applied in offshore wind farms in theBelgian part of the North Sea This paper compares the underwater noise generated during the piling activities of steel monopilesat the Belwind wind farm (Blighbank) with that of jacket pinpiles at the C-Power project (Thorntonbank) Underwater noise wasmeasured at various distances from the pile driving locationThe underwater noise was quantified by its zero to peak sound pressurelevel (119871
119911minus119901) unweighted sound exposure level (SEL) cumulative SEL and 13 octave spectra No significant differences in 119871
119911minus119901
could be demonstrated (monopile 119871119911minus119901
179ndash194 dB re 1120583Pa jacket 119871119911minus119901
172ndash189 dB re 1120583Pa) SEL showed no statistical differencebetween monopile and jacket and varied between 145 and 168 dB re 1 120583Pa2s Furthermore near identical spectra were measuredfor both types of piling Piling of the jacket pinpiles took however about 25 times the time of the monopile When standardisedto megawatt installed per foundation both types of piling scored near equally As an illustration the radius of major behaviouraldisturbance (119871
119901minus119901= 155 dB re 1 120583Pa) in the harbour porpoise Phocoena phocoena was estimated by a model at 16 km for monopiles
and at 8 km for jacket
1 Introduction
The European Marine Strategy Framework Directive obligesevery member state to achieve or maintain good environ-mental status under which also the introduction of energyincluding underwater noise is considered a main concern [1]An indicator for impulsive sound and a second indicator con-cerning the evolution of background noise are introducedClarification and details can be found in [2]
One of the major concerns in excessive underwater noiseemissions is linked to offshore wind farms as this industry isrelatively new to the marine environment [3] is developingfast and is highly diverse in technology used [4] As suchat present major attention is paid to the underwater noisegenerated during the construction operation and (future)dismantlement of offshore wind farms [3] Here four dif-ferent phases should be distinguished in relation to the life
cycle of an offshore wind farm (1) the before implantationphase-reference situation (2) the construction phase (3) theoperational phase and (4) the dismantlement phase [5]
For the Belgian part of the North Sea (BPNS) the under-water noise emissions were documented for the first threephases with reference sound pressure levels (SPL) of about100 dB re 1120583Pa at the Thorntonbank and Blighbank [6 7]So far seven wind farms are planned for the BPNS ofwhich four have been granted both a domain concession andenvironmental permit Two wind farms have actually beenconstructed The first six windmills (C-Power project phase1Thorntonbank) were built on concrete gravity based found-ation (GBF) while in a second and third phase jacket found-ations involving the piling of four pinpiles per jacket wereused In a second wind farm (Belwind project Blighbank)only monopile foundations were applied During the oper-ational phase finally [8] a 20 dB re 1 120583Pa increase in mean
2 The Scientific World Journal
SPL emitted in case of a steel monopile foundation (totalling120 dB re 1 120583Pa at 100Hz) was measured while hardly anyincrease in underwater noise was observed in case of GBFs
This paper focuses on the differences in underwater noiseemissions by two different types of piling that is piling oflargemonopiles (further calledmonopiling) and the piling ofthe jacket foundation pinpiles (further called jacket piling)In addition to zero to peak level (119871
119911minus119901) the best measures for
comparing noise from pile driving also include sound expo-sure level (SEL) as the latter is better related to the energyemitted by the piling Comparison of both piling activitiestherefore focused on both 119871
119911minus119901and SELWe finally also com-
pared their noise spectra and attenuation functions As an ill-ustration and for the harbour porpoise that is the onlymarinemammal present in high density in Belgian waters somecomputations related to the impact of underwater noise levelsare proposed
2 Materials and Methods
Analysis focused on the quantification of the discontinuousimpulsive pile driving-generated underwater noise Under-water noise wasmeasured at various distances (250ndash14000m)from the pile driving location during the installation of steelmonopiles and jackets at the Blighbank and Thorntonbanksite respectively Zero to peak sound pressure level (119871
119911minus119901)
unweighted sound exposure level (SEL) cumulative SEL and13 octave spectra were computed in order to quantify theunderwater noise emitted during the construction phase
21 Measurement Methodology Measurements of wind farmconstruction noise were performed from a drifting rigid hullinflatable boat (RHIB) in the vicinity of the piling site [7]To avoid interaction with the hydrophone the engine radarand echosounder were turned off The geographic positionand time of measurement were recorded with a handheldGPS GARMIN GPSMap60 at a frequency of one positionevery 5 seconds The clock of the recorder was synchronisedbeforehand with the GPS-time (UTC) At the start and theend of each measurement a reference signal was recorded
Several recordings of few minutes each (1 to 5min)were performed at different locations on September 26 2009(monopile A02) and January 15 2010 (monopile B10) at theBlighbank and on the May 11 (jacket CG3) and the of July 122011 (jacket CB6) at theThorntonbank site (Table 1) Weatherconditions encountered during fieldwork featured a windforce of 1ndash3 BF and a sea state of 1 to 2
22 Acoustic Measurement Equipment For every measure-ment a Bruel amp Kjaeligr hydrophone (type 8104) was deployedat a depth of 10m A Bruel amp Kjaeligr amplifier (Nexus type2692-0S4) was connected between the hydrophone and therecorder in order to allow for an amplification and filtrationof the signal A reference signal was used together with theoutput sensitivity of the Nexus to calibrate the amplitude ofthe recorded signal The signal was recorded using an audioMARANTZ Solid State Recorder (type PMD671) It wasoperated with the highest possible sampling rate of 44100HzThe signal was recorded inWAVE format (wav) on Compact
Table 1 Geographic position peak level (119871119911ndash119901) and distance from
the piling location of the underwater noise measurements at theBlighbank site (monopiles A02 and B10) and at the Thorntonbanksite (jackets CG3 and CB6)
Position start recording(WGS84) Peak level (dB)
119871119911ndash119901
Distance (m) frompiling location
Latitude LongitudeMonopile A02
51∘40391015840 2∘50031015840 177 sim300051∘39411015840 2∘50641015840 177 sim482051∘38251015840 2∘51251015840 166 sim6990
Monopile B1051∘34591015840 2∘57311015840 159 sim1415051∘38521015840 2∘48161015840 185 sim158051∘38501015840 2∘47441015840 193 sim770
Jacket CG351∘33921015840 2∘58941015840 192 sim25051∘51341015840 2∘58361015840 187 sim50051∘33961015840 2∘58931015840 196 sim250
Jacket CB651∘33071015840 2∘53941015840 182 sim60051∘32961015840 2∘52591015840 175 sim170051∘32651015840 2∘53421015840 172 sim75051∘32221015840 2∘53011015840 171 sim1600
Flash cards of 2GB (Sandisk Ultra II) Batteries powered allequipment
23 Response Variables It is very common in underwateracoustics to use values expressed in a logarithmic scale(decibels) In order to characterize extreme level values of atransient signal like the one associated with pile driving thepeak sound pressure level is often used This terminology isnot totally unambiguous and we prefer to use 119871
119911minus119901that is
defined by [9] as
119871119911minus119901= 10log
10
1199012
119911minus119901
1199012
refin dB re 1 120583Pa (1)
For impulsive sound however the unweighted SEL bettercharacterises the energy produced by a given stroke extractedfrom a complete piling event SEL is computed as defined by[9] The SEL is the level of a continuous sound during theintegration period and having the same sound energy as theimpulse
SEL = 10 log( 1119879int
1198792
1198791
119901 (119905)2
1199012
0
119889119905)
= 10 log 119864119864ref
in dB re 1 120583Pa2s(2)
where 119879 is 1 second 1198791 and 1198792 are respectively the start andthe end of the integration time window (the complete strokebeing included in this window) 119901(119905) is the sound pressure
The Scientific World Journal 3
Table 2 Summary statistics of the piling activities of monopile A02 and B10 and jacket foundations CB6 and CG3 targeted in this study aswell as the averages and total (where appropriate) for the 56monopiles installed at the Blighbank (source Belwind) and the 49 jacket installedon theThorntonbank (source C-Power)
Monopile piling activities (pile diameter = 5m) Jacket piling activities (pinepile diameter = 18m)Unit A02 B10 Average Total Unit G3 B6 Average Total
Pile length m 55 63 54 m 48 21 37 mdashMass t 401 453 375 t 96 46 77 mdashNumber of strokes required 2114 3848 2982 168550 13321 4288 9476 464328Average energy per stroke kJ 642 839 706 kJ 436 321 412Duration of piling min 64 163 120 6779 min 405 162 319 15646
Net piling frequency Number ofstrokesminute 42 39 40 Number of
strokesminute About 40 About 40
Total energy MJ 1356 3224 2084 118909 MJ 5805 1376 3909 191531
signal and 1199010is the reference sound pressure of 1120583Pa When
more than one noise pulse is generated as is the case forpile driving it is possible to compute a cumulative soundexposure level For a series of strokes the cumulative SEL iscomputed following the definition given by [10] advising notto rely only on cumulative SEL but also to include the totalnumber of blows and the frequency of piling Measurementsmade at various distances were normalized to a referencedistance of 750m using the equation [11 12]
119871norm = 119871measured + 15log10 (distance750) (3)
This normalization has been used in this study in orderto allow for an appropriate comparison of noise character-istics collected at various distances from the source using anormalized transmission loss [11 12] permitting comparisonwith other sites
The third octave band spectrum of the underwater soundpressure level was computed according to the norm IEC1260All these computations were made using dedicated routinesdeveloped using the MATLAB environment
A Kruskal-Wallis test followed by Dunnrsquos post hoc mul-tiple comparison tests was used to identify statisticallysignificant differences in the underwater noise emitted by thedifferent foundation types More specifically Dunnrsquos post hoctest as applied by Statistica 10 compares the difference in thesumof ranks between two columnswith the expected averagedifference (based on the number of groups and their size)For each pair of columns Prism reports the 119875 value as gt005lt005 lt001 or lt0001 The calculation of the 119875 value takesinto account the number of comparisons made If the nullhypothesis is true (all data are sampled frompopulationswithidentical distributions so all differences between groups aredue to random sampling) then there is a 5 chance that atleast one of the posttests will have 119875 lt 005 The 5 chancedoes not apply to each comparison but rather to the entirefamily of comparisons
24 Piling Activity Details For the piling of the 56 monopilefoundations at the Blighbank a hammer IHC hydrohammerS1200 operated from the support vessel Svanen was used
The hammer featured a maximum power of 1200 kJ Theaverage energy used for each stroke was 706 kJ (Table 2)For the installation of the 49 jacket foundations at the Thor-tonbank the piling of 196 pinpiles was requiredThe hammerused was an IHC hydrohammer S-800 featuring a maximumpower of 800 kJ for a nominal power of 720 kJ Average energyused for each stokewas 412 kJThe hammer log did not recorda time stamp for every blow alongwith the other informationhampering a direct comparison between the records and thehammer log
25Major Behavioural Disturbance Levels forMarineHarbourPorpoise Even if underwater noise produced by humanactivities is known to produce effect to themarine life includ-ing fishes or birds we propose an illustration to compare ourdata and model results with known level for the most com-mon marine mammal present in Belgian water For the har-bour porpoise Phocoena phocoena a major behavioural dis-turbance level is found above 119871
119901minus119901= 155 dB re 1 120583Pa [13]
26 Regression Model for Noise Propagation A linear regres-sion model based on the ordinary least square (OLS) wascomputed from the data presented at Table 1
119871119911minus119901= minus274 log (119889) + 2707 dB for monopile
119871119911minus119901= minus 274 log (119889) + 259 5 dB for jacket
(4)
in which 119889 is the distance to the source It has a transmissionloss of 274log (119889) ranging within the 95 confidence intervalfrom 305 to 243log (119889) That model is further modified bythe addition of an absorption term making use of absorptioncoefficient of 00004 dBm as proposed by [13] and the finalmodel reads
119871119911minus119901= minus274 log (119889) + 2707 dB minus 00004119889
for monopile
119871119911minus119901= minus274 log (119889) + 259 5 dB minus 00004119889
for jacket
(5)
4 The Scientific World Journal
Table 3 Normalized 750m zero to peak sound pressure level(119871119911ndash119901) in dB re 1 120583Pa Normalized 750m mean and maximum
sound exposure levels (SEL) in dB re 1120583Pa2s
Record Norm 119871119911ndash119901
750mNorm meanSEL 750m
Norm maxSEL 750m
Monopile A021 186 161 1642 189 164 1663 180 160 164
Monopile B101 194 162 1662 190 168 1623 179 163 166
Jacket CG31 185 168 1742 189 168 1783 186 168 175
Jacket CB6
1 180 155 1592 172 145 1513 176 150 1524 180 152 157
3 Results
31 Underwater Noise Sound Pressure and Exposure LevelsThe highest normalised 119871
119911minus119901of 194 dB re 1 120583Pa was observed
for the piling of the B10 monopile at the Blighbank whilefor the piling of the jacket pinpiles a maximum of 189 dBre 1 120583Pa was observed (CG3) at the Thorntonbank (Table 3)The lowest 119871
119911minus119901value of 172 dB re 1 120583Pa was observed for the
piling of the jacket CB6 while the lowest 119871119911minus119901
for monopileswas 179 dB re 1 120583Pa The piling of the jacket foundation CG3and the piling of the monopile A02 exert similar normalized119871119911minus119901
values of about 186 dB re 1 120583Pa Some lower normalized119871119911minus119901
(by 15 to 20 dB re 1 120583Pa) is observed for the piling of thejacket CB6
Normalized maximum SEL values range between 151 and178 dB re 1 120583Pa2s The maximum observed normalised SELfor jacket foundation piling was 178 dB re 1 120583Pa2s (CG3)while the maximum observed normalized SEL for monopiles(B10) was some 10 dB lower with a maximum of 166 dBre 1 120583Pa2s Normalized mean SELs show similar behaviourwith the highest value of 168 dB re 1 120583Pa2s measured at CG3and the lowest value for jacket piling of 145 dB re 1 120583Pa2s(CB6) Normalized mean SELs for both steel monopile arein between with 168 dB re 1 120583Pa2s for B10 and 164 dB re1 120583Pa2s for A02 Whereas statistically significant differenceswere detected between the four piling events for normalizedmaximum SEL (Kruskal-Wallis test 119875 = 0016) and meanSEL (119875 = 0020) post hoc multiple comparisons revealeddifferences only between the two jacket piling events (119875 =0008 and 119875 = 0018 resp)
32 Underwater Noise Spectra For both monopile and jacketpiling the strongest underwater noises were emitted between60 to 2000Hz Moreover while the shape of the spectra aresimilar in the frequency domain 100 to 500Hz the spectrashowed more isolated peaks for the jacket piling than for the
Table 4 Characterization of the monopile and jacket piling activi-ties Normalized maximum sound exposure level (norm max SEL 750m)
Foundation type Monopile(3MW)
Jacket(6MW)
Average no of blowfoundation 3010 9476Average no of blowMW installed 1021 1612Average energy (MJ)blow 07 04Average energy (MJ)foundation 2123 3909Average energy (MJ)MW installed 721 665Norm max SEL 750m (dB re 1 120583Pa2s) 166 178Average duration of piling (min)foundation 120 319Average duration of piling (min)MW installed 41 55Average piling frequency (blowmin) 25 30
monopiling for which only one larger peak was found Thedecay of the spectra showed a similar slope for both found-ation types
On average a jacket foundation required about threetimes more blows per foundation (Table 4) than a monopileWhen that parameter was normalized to MW installed 57more blowsMWinstalledwere needed for jacket foundationsthan formonopileMoreover the average piling time requiredwas higher for a jacket foundation than for amonopile (factor25) and remained somewhat higher when normalized toMW installed (factor 13)
33 Noise Propagation and Attenuation For both farms thepropagationmodel (Figure 2) is used to compute the extent ofthe zone wherein noise levels exceeded themajor behaviouraldisturbance level for harbour porpoises
The simple model used is an approximation of the exactsituation That zone of the North Sea features complex geo-morphology on a shallowwater environment thatmay inducemore complicated propagation and attenuation for under-water sound waves Nevertheless when taking into accountthe variability found on the production of the noise itself(Table 2) the first approximation that is represented by themodel is acceptable for the purpose of an estimation of aradius ofmajor behavioural disturbance formarinemammalsaround a construction place
The zone of major behavioural disturbance for harbourporpoises was estimated by the model to a radius of 8 kmaround the jacket piling location while that radius extendedto 16 km from the monopile piling location
34 Cumulative Sound Exposure Level The mean numberof strokes required for the complete piling of one monopilefoundation was 3010 strokes (Table 4) As 3010 strokes rep-resent an increase of the normalized 750m mean SEL of35 dB (10 log
10(3010)) themean cumulative SEL formonopile
was estimated at 196 dB re 1120583Pa2s The mean duration ofpiling for one foundation was 120min A mean number of9476 strokes were required for the installation of one jacketfoundation This represented an increase of 40 dB giving acumulative normalized SEL of 196 dB re 1 120583Pa2s 750mThe
The Scientific World Journal 5
mean duration of piling for one jacket was 319minThe samecumulative SEL values were hence observed for both found-ation types but the disturbance time for jacket foundationslasted for longer than that for monopile foundations
4 Discussion
As expressed earlier the piling work linked to the installationof the jacket foundation requires the piling of four pinpileswhile the monopile design requires the piling of only onelarge monopile Jacket foundations may however accom-modate larger turbines than monopiles [4] A less powerfulhammer can be used for the installation of the jacket foun-dations than that for the monopile foundations However ajacket design requires longer piling time than the monopiledesign (mean time of 319min for jacket against 120min formonopile) but at lower noise levels with a normalized 119871
119911minus119901
of maximum 194 dB re 1 120583Pa for a monopile against 189 dBre 1 120583Pa for a jacket The installation of jacket foundationshence impacts a smaller zone but for a longer period of time
In terms of energy the total piling energy needed toachieve the complete construction of the C-Power projectphases 2 and 3 at the Thorntonbank (49 jacket foundations)was just above 019 TJ (Table 2) while the same figure for theBelwind wind farm implanted at the Blighbank and featuring56 monopile foundations was 012 TJ The overall message isthat more energy was used and therefore transmitted to theenvironment for the installation of the new C-Power windfarm than that for the installation of the Belwind wind farmThis is further confirmed by the SEL data (Table 3) featuringa maximum value for the normalized SEL of 178 dB re 1 120583Pa2sfor the C-Power project wind farm against 166 dB re 1120583Pa2sfor the Belwind wind farm
When underwater noise is generated by pile driving thesize of the pile power of the pile driver (hammer) andsedimentological and geological properties are importantvariables affecting the effective underwater noise producedFor similar sediment properties using a larger pile driverwould generate less noise because of a lower impact velocityapplied when hammering [11] It could also be economicallymore efficient to use a large pile driver operated at 23 ofits nominal power than a smaller one used at its maximumpowerThe use of a less powerful hammer (800 kJ) for pinpil-ing (versus 1200 kJ for monopiling) in conjunction with theuse of smaller pinpiles produced lower 119871
119911minus119901values than those
for the monopiling at the Blighbank (some 5 dB re 1 120583Pa750m) The higher SEL identified for the piling of jacketCG3 (Table 2) in comparisonwith the piling of the jacket CB6is most probably related to the use of the hammer at a higherpower even if we cannot demonstrate that relation due tothe unavailability of a timestamp for every blow Howeverto conclude the differences observed between pinpiling andmonopiling a significant difference was found within thepinpiling group (Table 3) This significant difference can beexplained by the fact that the piling of one of the jackets(CB6) required only a third of the mean energy used for theinstallation of the other jackets (Table 2)This could indeed berelated to the small scale local differences in sedimentologicaland geological properties
Nevertheless when renormalizing these data to theinstalled power the message is different with a little loweraverage energy per MW used for the jacket founda-tion (665MJMW) than that for the monopile foundation(721MJMW) While jacket piling used less piling energyper MW the average duration of piling per installed MWremained 26 higher with 55 minutes for a jacket and only41 minutes for a monopile However an even better normal-ization would be obtained when standardising to the MWproduced instead of the MW installed Such standardisationwould however be premature at this moment since the windfarms are either operational for a short period of time (Bel-wind) or not yet operational at all (C-Power phases 2 and 3)
For both monopiling and jacket installed in the BPNScumulative SEL of 196 dB re 1120583Pa2s 750mwas found Com-parison with the available data for the Q7 wind farm [10]located in Dutch waters and featuring 4m diameter mono-piles was possible after a renormalization at 750m Some13 dB higher cumulative SEL was computed (209 dB re1 120583Pa2s) Unfortunately other comparisons based on thatvariable are difficult to make since primary data are missingAdapted from [11] zero to peak levels ranging between 185and 199 dB re 1120583Pa for a pile diameter ranging between 33and 47m were observed in various wind farms located inGerman andUKwatersThese results are of the same order ofmagnitude and coherent withwhat was observed in the BPNSwind farms
Some of the levels observed here for both the monopileor jacket type foundations installation exceed the 185 dB re1 120583Pa permitted by the BelgianMSFD descriptor 11This indi-cates that future offshore wind farms will need to take miti-gatingmeasures during constructionDifferentmethods exist[11 14] One of these is the air bubble curtainmethod [15] thatcould reduce the levels (both 119871
119911minus119901and SEL) by about 14 dB
These values were obtained inside a port and such techniqueremains to be validated at sea with for example strong tidalcurrent A current of 1ms which is not uncommon for theBPNS may indeed induce a drift of the bubble curtain ofabout 70m for a bottom depth of 20m [11] New difficul-ties may arise when the sleeve may be in contact with the piledue to the tidal current For bubble curtains size of the bubblehas an impact on sound insulation [14 15] A second methodoften preferred by the industry for sound isolation is the useof pile sleeves made from various material including foamor air [11 14] This last method can achieve a sound reduc-tion of 20 to 25 dB for low frequencies where the maximumnoise is produced (Figure 1)Thesemethods if theywere usedin conjunction with piling works would have reduced theproduced noise to levels below the Belgian MSFD require-ments
5 Conclusion
(i) While jacket foundations involved smaller diameterpinpiles and while the emitted noise levels normal-ized at 750m 119871
119911minus119901values are lower than those for
monopiling therefore impacting a smaller zone theoverall energy needed for the complete pilingwas 58higher for the 49 jackets than for the 56 monopiles
6 The Scientific World Journal
90100110120130140150160
Frequency (Hz)
Monopile
101
102
103
104A
mpl
itude
(dB
re1120583
Pa)
(a)
Jacket
Frequency (Hz)10
110
210
310
4
90100110120130140150160
Am
plitu
de (d
B re1120583
Pa)
(b)
Figure 1 13 octave spectra of the underwater noise of the Blighbankmonopiling and the C-Power jacket piling
120130140150160170180190200210220
Distance to the source (m)
Zero
to p
eak
leve
l
100
101
102
103
104
105
Figure 2 Application of the propagation model to jacket piling(dashed line) andmonopiling (plain line) Squares and circles are themeasured 119871
119911minus119901 respectively for jacket and monopile (Table 1) while
the horizontal line at 149 dB re 1120583Pa represents the level (119871119911minus119901
) formajor behavioural disturbance for harbour porpoise [13]
The normalized 750 SEL was also higher for jacketthan for monopile foundation piling
(ii) When normalized to installed MW the figure isinversed and average energy needed by installed MWis 8 lower for jacket than for monopile
(iii) Finally for both maximum and mean normalized750m SEL no statistically significant difference onthe emitted underwater noise between pinpiling andmonopiling could however be observed
(iv) The radius for major behavioural disturbance wasmodelled to reach 16 km for monopile and 8 km forjacket
(v) Some measurements are above the Belgian MSFDrequirements and those for monopile as well as forjacketUse ofmitigationmeasures could have reducedthe produced noise below these requirements
Acknowledgments
The officers and crew of the RV Belgica are acknowledgedfor their help provided during fieldwork The authors wouldlike to thank the financial support of the companies C-Power Belwind and Northwind They thank the companiesC-Power and Belwind for the transmission of the piling dataused to generate Tables 2 and 4
References
[1] M L Tasker M Amundin M Andre et al ldquoIndicator for thegood environmental status for underwater noise and other formof energyrdquoThemain report of task group 11 for Marine StrategyFramework Directiversquos descriptor 11 Draft 11012010 ICESJRCreport pp 39 2010
[2] A J van der Graaf M A Ainslie M Andre et al ldquoEuropeanMarine Strategy Framwork Directive Good EnvironmentalStatus (MSFDGES) report of the technical subgroup on under-water noise and other form of energyrdquo 2012
[3] J Huddelston EdUnderstanding the Environmental Impacts ofOffshore Windfarms COWRIE 2010
[4] EWEA Wind Energymdashthe Facts A Guide to the TechnologyEconomics and Future of Wind Power European Wind EnergyAssociation 2012
[5] J R Nedwell and D Howell ldquoA review of offshore windfarmrelated underwater noise sourcesrdquo Tech Rep 544 R 0308COWRIE 2004
[6] J P Henriet W Versteeg P Staelens J Vercruysse and D vanRooij ldquoMonitoring van het onderwatergeluid op de Thornton-bank referentietoestand van het jaar nul eindrapportrdquo Studiein Opdracht van Het KBINBMM rapport JPH2005sec15Renard Centre of Marine Geology Ghent University GentBelgium 2006
[7] J Haelters A Norro and T Jacques ldquoUnderwater noise emis-sion during the phase I construction of the C-Power wind farmand baseline for the Belwind wind farmrdquo in Offshore WindFarms in the Belgian Part of the North Sea State of the ArtAfter Two Years of Environmental Monitoring S Degraer andR Brabant Eds p 288 MUMM Bruxelles 2009
[8] A Norro B Rumes and S Degraer ldquoCharacterisation of theoperational noise generated by offshore wind farms in theBelgian part of the North Seardquo in Offshore Wind Farms in theBelgian Part of theNorth Sea Selected Findings From the Baselineand Targeted Monitoring S Degraer R Brabant and B RumesEds p 162 2011
[9] M A Ainslie ldquoStandard for measurement and monitoring ofunderwater noise Part I Physical quantities and their unitsrdquoTNO Report TNO-DV 2011 C235 2011
[10] C A F de Jong and M A Ainslie ldquoUnderwater radiated noisedue to the piling for the Q7 offshore wind parkrdquo Journal of theAcoustical Society of America vol 123 no 5 p 2987 2008
[11] G Nehls K Betke S Eckelmann andM Ros ldquoAssessment andcosts of potential engineering solutions for themitigation of theimpacts of underwater noise arising from the construction ofoffshore windfarmsrdquo COWRIE Report ENG-01-2007 2007
The Scientific World Journal 7
[12] A Muller and C Zerbs ldquoOffshore wind farms Measurementinstruction for waterborne sound measurementsrdquo Tech RepM88 6075 Muller-BBM GmbH 2011
[13] H Bailey B Senior D Simmons J Rusin G Picken and PM Thompson ldquoAssessing underwater noise levels during pile-driving at an offshore windfarm and its potential effects onmarine mammalsrdquoMarine Pollution Bulletin vol 60 no 6 pp888ndash897 2010
[14] Z Saleem ldquoAlternatives and modifications of tMonoplie foun-dation or its installation technique for noise mitigationrdquoTUDelft Report TUDelft University 2011
[15] K Lucke P Lepper M A Blanchet and U Siebert ldquoThe useof an air bubble curtain to reduce the received sound levels forharbour purpoisesrdquo Journal of the Acoustical Society of Americavol 130 no 5 pp 3406ndash3412 2011
Submit your manuscripts athttpwwwhindawicom
Hindawi Publishing Corporationhttpwwwhindawicom Volume 2014
Anatomy Research International
PeptidesInternational Journal of
Hindawi Publishing Corporationhttpwwwhindawicom Volume 2014
Hindawi Publishing Corporation httpwwwhindawicom
International Journal of
Volume 2014
Zoology
Hindawi Publishing Corporationhttpwwwhindawicom Volume 2014
Molecular Biology International
GenomicsInternational Journal of
Hindawi Publishing Corporationhttpwwwhindawicom Volume 2014
The Scientific World JournalHindawi Publishing Corporation httpwwwhindawicom Volume 2014
Hindawi Publishing Corporationhttpwwwhindawicom Volume 2014
BioinformaticsAdvances in
Marine BiologyJournal of
Hindawi Publishing Corporationhttpwwwhindawicom Volume 2014
Hindawi Publishing Corporationhttpwwwhindawicom Volume 2014
Signal TransductionJournal of
Hindawi Publishing Corporationhttpwwwhindawicom Volume 2014
BioMed Research International
Evolutionary BiologyInternational Journal of
Hindawi Publishing Corporationhttpwwwhindawicom Volume 2014
Hindawi Publishing Corporationhttpwwwhindawicom Volume 2014
Biochemistry Research International
ArchaeaHindawi Publishing Corporationhttpwwwhindawicom Volume 2014
Hindawi Publishing Corporationhttpwwwhindawicom Volume 2014
Genetics Research International
Hindawi Publishing Corporationhttpwwwhindawicom Volume 2014
Advances in
Virolog y
Hindawi Publishing Corporationhttpwwwhindawicom
Nucleic AcidsJournal of
Volume 2014
Stem CellsInternational
Hindawi Publishing Corporationhttpwwwhindawicom Volume 2014
Hindawi Publishing Corporationhttpwwwhindawicom Volume 2014
Enzyme Research
Hindawi Publishing Corporationhttpwwwhindawicom Volume 2014
International Journal of
Microbiology
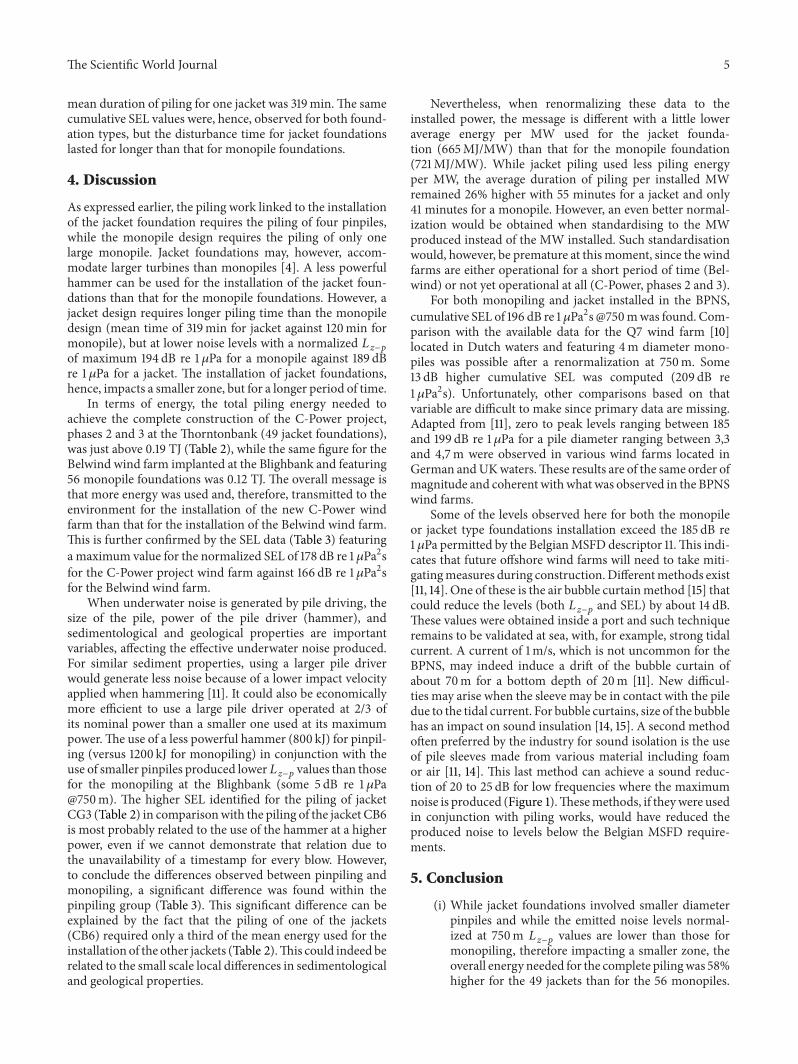
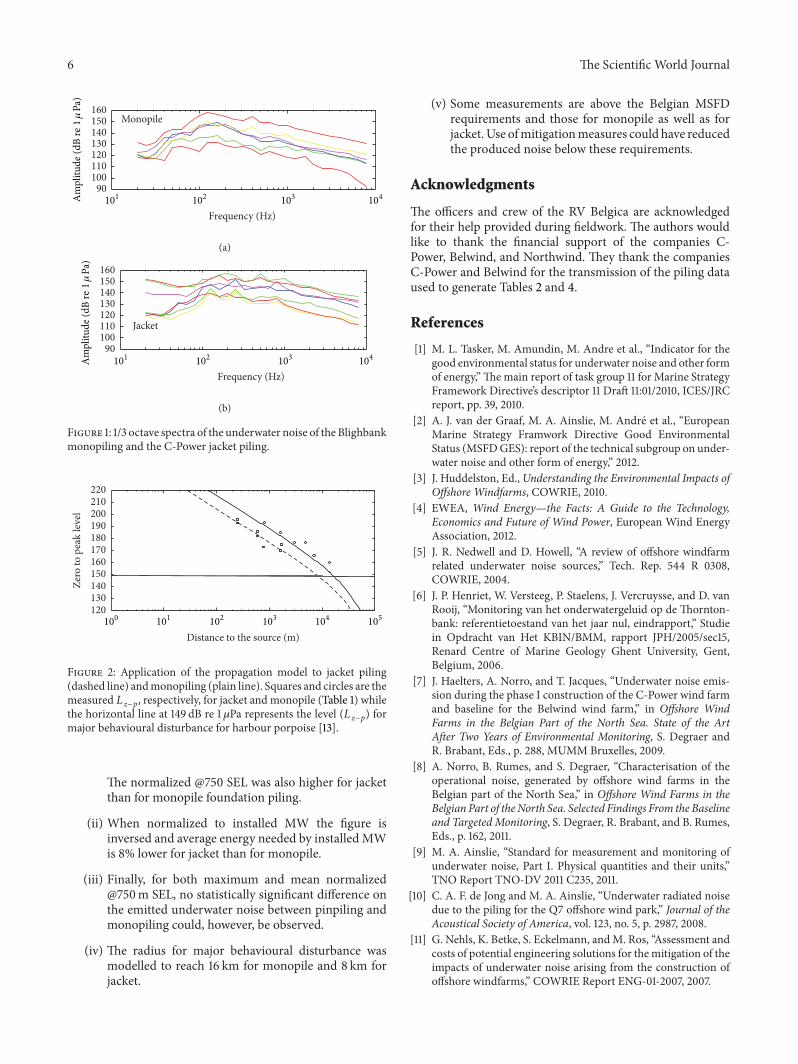