Embed Size (px)
Citation preview
Differentiation between B2B and B2C
companies on LinkedIn: A content
analysis for high customer engagement
Master Thesis
MSc Business Administration – Digital Business track
University of Amsterdam
Amsterdam Business School
Author: Sophie Louise Koopmans
Student number: 10556419
Date of submission: June 22nd, 2018
Supervisor: Dr. Shameek Sinha
MASTER THESIS – MSc DIGITAL BUSINESS SOPHIE LOUISE KOOPMANS, 10556419
2
Statement of Originality
This document is written by Student Sophie Louise Koopmans who declares to take full
responsibility for the contents of this document.
I declare that the text and the work presented in this document is original and that no sources
other than those mentioned in the text and its references have been used in creating it.
The Faculty of Economics and Business is responsible solely for the supervision of completion
of the work, not for the contents.
MASTER THESIS – MSc DIGITAL BUSINESS SOPHIE LOUISE KOOPMANS, 10556419
3
Abstract
This study researches to what extent there is a difference in customer engagement on LinkedIn
between B2B and B2C companies, and what role social media content has in generating
engagement. Posts from six company pages on LinkedIn were collected and a content analysis
was conducted over the resulting 572 posts. Each post was assigned one of the twelve content
types and one of the three relationship types. The data was quantitatively analyzed. The results
indicate that there is indeed a difference between business models: B2C company posts generate
higher customer engagement than B2B posts. There are also significant differences between
content types: counts of five types differ significantly between B2B and B2C. Concerning the
relationship phases (awareness, acquisition and retention), B2B companies post more
awareness-related posts, and B2C companies post more acquisition-related posts. There are no
significant differences in engagement between the relationship phases. For both content types
and relationship phases, there is no significant moderating role for business models on customer
engagement. Moreover, no three-way effect between business models, content types and
relationship phases has been found. This study narrows the knowledge gap in B2B social media
marketing research and the methodology for content analyses on social media is further
developed. Furthermore, it helps practitioners to make deliberate decisions on social media
strategy and allows them to select the right content types on social media for their respective
business model to generate engagement. Concluding, some directions for future research are
proposed.
Keywords: social media strategy, LinkedIn, B2B, B2C, content analysis, relationship phases,
customer engagement
MASTER THESIS – MSc DIGITAL BUSINESS SOPHIE LOUISE KOOPMANS, 10556419
4
Contents
1. Introduction .............................................................................................................. 8
1.1 Expected contributions to theory and practice ..................................................... 9
2. Theoretical Framework .......................................................................................... 11
2.1 Social media use in business .............................................................................. 11
2.2 B2B vs. B2C ....................................................................................................... 12
2.3 Customer engagement ........................................................................................ 13
2.4 Content type ....................................................................................................... 15
2.5 Relationship phases ............................................................................................ 19
2.5.1 Awareness ................................................................................................... 20
2.5.2 Acquisition .................................................................................................. 21
2.5.3 Retention ..................................................................................................... 21
2.6 Relationship between Content Type and Relationship Phase ............................ 23
2.7 Conceptual Framework ...................................................................................... 26
3. Methodology .......................................................................................................... 27
3.1 LinkedIn ............................................................................................................. 27
3.2 Sample ................................................................................................................ 28
3.3 Measurements ..................................................................................................... 29
3.3.1 Business Model ........................................................................................... 29
3.3.2 Content Type ............................................................................................... 29
3.3.3 Relationship Phase ...................................................................................... 30
3.3.4 Customer Engagement ................................................................................ 31
3.4 Procedure ............................................................................................................ 32
3.4.1 Data Collection ........................................................................................... 32
3.4.2 Content Analysis ......................................................................................... 33
3.5 Reliability ........................................................................................................... 34
3.6 Data Analysis ..................................................................................................... 34
MASTER THESIS – MSc DIGITAL BUSINESS SOPHIE LOUISE KOOPMANS, 10556419
5
4. Results .................................................................................................................... 35
4.1 Reliability ........................................................................................................... 35
4.2 Result per hypothesis ......................................................................................... 36
5. Discussion .............................................................................................................. 47
5.1 Business models ................................................................................................. 47
5.2 Content types ...................................................................................................... 48
5.3 Relationship Phases ............................................................................................ 51
5.4 Missing three-way effect .................................................................................... 52
5.5 Limitations ......................................................................................................... 56
5.6 Theoretical and Managerial Implications ........................................................... 57
6. Conclusion ............................................................................................................. 58
6.1 Future research ................................................................................................... 60
7. References .............................................................................................................. 61
8. Appendix ................................................................................................................ 67
8.1 Coding guidelines second coder ......................................................................... 67
8.2 Descriptives tables .............................................................................................. 69
8.3 Content type preferences .................................................................................... 71
8.4 Ranking of most used content types ................................................................... 72

MASTER THESIS – MSc DIGITAL BUSINESS SOPHIE LOUISE KOOPMANS, 10556419
6
Table of Figures
1. Figure 1 Conceptual model of variables business model, content type and customer
engagement ................................................................................................................... 19
2. Figure 2 Simplified customer journey in relationship phases ...................................... 19
3. Figure 3 Conceptual model of variables business model, relationship phase and
customer engagement ................................................................................................... 23
4. Figure 4 Conceptual model of variables business model, content type and relationship
phase ............................................................................................................................. 26
5. Figure 5 Conceptual Framework .................................................................................. 26
6. Figure 6 Interaction plot of the effect of business model on the relationship between
content type and customer engagement ....................................................................... 42
7. Figure 7 Interaction plot of the effect of business model on the relationship between
relationship phase and customer engagement .............................................................. 45
MASTER THESIS – MSc DIGITAL BUSINESS SOPHIE LOUISE KOOPMANS, 10556419
7
Table of Tables
1. Table 1 Sample of selected companies ........................................................................ 29
2. Table 2 Coding sheet Content Types ........................................................................... 30
3. Table 3 Descriptives of the engagement scores per business model groups ................ 36
4. Table 4 Descriptives and chi square results of content types ....................................... 38
5. Table 5 Descriptives and chi square results of broad content categories ..................... 39
6. Table 6 Games Howell Post Hoc Test: Mean differences ........................................... 41
7. Table 7 Descriptives and chi square results ................................................................. 43
8. Table 8 Hochberg's GT2 Post Hoc test results ............................................................. 44
9. Table 9 Results of the two-way independent ANOVA ................................................ 45
10. Table 10 Partial Associations: Effect of each variable in the loglinear model ............ 47
11. Table 11 The Content Decision Table: Matrix with preferences of content types over
other types. ................................................................................................................... 49
12. Table 12 Top 10 of the most engaging content types for customers. ........................... 50
13. Table 13 Descriptives: Counts of posts in each category in the loglinear analysis ..... 54
14. Table 14 Overview of hypotheses and corresponding results ...................................... 55
15. Table 15 Coding sheet: Content Categories ................................................................. 67
16. Table 16 Coding Sheet: Relationship Phases ............................................................... 68
17. Table 17 Descriptives of customer engagement for each content type. Sorted on
Means. .......................................................................................................................... 69
18. Table 18 Descriptives of engagement scores per group ............................................... 70
19. Table 19 Results of engagement comparing content types .......................................... 71
20. Table 20 Ranking of content types of the data set per business model ........................ 72
MASTER THESIS – MSc DIGITAL BUSINESS SOPHIE LOUISE KOOPMANS, 10556419
8
1. Introduction
Social media is everywhere and the number of users keeps growing. LinkedIn has passed the
500 million users (Awan, 2017). The advancement of technology in the last decades is making
the world more connected. The new domain of digital marketing is becoming ubiquitous and is
expanding (Brennan & Croft, 2012; Peters, Chen, Kaplan, Ognibeni, & Pauwels, 2013).
Social media is an important component of digital marketing. Social media platforms are
defined as ”forms of electronic communication through which users create online communities
to share information, ideas, personal messages, and other content” (Merriam-Webster, 2018).
Nowadays, social media have become indispensable in business. In 2015, already 96% of
businesses globally used social media (Statista, 2015). Facebook, Twitter, Instagram and
LinkedIn are the most popular examples of social media marketing channels.
Some industries are frontrunners in the digital marketing domain. Especially in business
to consumer (B2C) marketing, social media grew from an underestimated channel to one that
marketers can’t do without (Brennan & Croft, 2012; Peters et al., 2013; Rodriguez, Peterson,
& Krishnan, 2012). This caused an increase in research in B2C digital marketing. While
research in B2C social media marketing is advancing and becoming more mature, research on
business to business (B2B) marketing is far behind and still in its embryonic stage (Salo, 2017).
The shortage in research cannot be the result of a lack of size or relevance of the B2B industry,
since B2B transactions account for 42% of reported US revenues in 2010 (Lilien, 2016). As
more businesses are using social media, marketing scholars are urgently calling for further
research on the distinction between B2B and B2C social media (Lilien, 2016; Mora Cortez &
Johnston, 2017; Salo, 2017).
The interest of social media usage differs between the business to business and business
to consumer contexts. B2B companies are more focused on customer relationship management,
whereas B2C companies’ main goal is to create brand awareness (Michaelidou, Siamagka, &
MASTER THESIS – MSc DIGITAL BUSINESS SOPHIE LOUISE KOOPMANS, 10556419
9
Christodoulides, 2011). Hoffman and Fodor (2010) proposed to forget the traditional
(monetary) measures of return on investment (ROI) as a measure of performance, but instead
assess customer engagement, as customer engagement might better predict the likelihood of
payoff in the long term. The common focus on “show me the return” by companies is too much
oriented on the short term and dismisses the qualitative opportunities that social media might
bring (Hoffman & Fodor, 2010). Thus, performance comes through customer engagement;
digital marketers should focus on increasing engagement instead of directly trying to increase
sales through social media. The goal of social media is not selling; it’s engaging.
Customers can engage with companies on social media by liking and commenting on
firm-generated content or by creating content about companies (user-generated content). Social
media content is textual, visual and aural content that is posted on a social media platform by
any member, including textual messages, images, audio, videos, website links, and news
articles. Content plays a crucial role in the engagement of customers. Good content engages
customers, but the question is what content works for B2B and B2C companies.
There has been little research on how the different company contexts influence customer
engagement on social media, or if there is any difference in customer engagement between B2B
and B2C contexts at all. And what influence does the type of content that firms posts on its
social media company pages have on customer engagement? This study addresses this query.
It attempts to answer the following research question:
To what extent does customer engagement on social media differ in the B2B
and B2C contexts, and what role does content play in this relationship?
1.1 Expected contributions to theory and practice
First, this study adds to the literature about the distinction of B2B and B2C markets. B2B and
B2C differ in such a degree that B2C measurements cannot bluntly be copied into B2B
MASTER THESIS – MSc DIGITAL BUSINESS SOPHIE LOUISE KOOPMANS, 10556419
10
applications (Swani, Brown, & Milne, 2014). A distinction in business models must be made
for future research to progress. Also, this study contributes to narrowing the B2B knowledge
gap proposed by Lilien (2016). Lilien studied the imbalance between the volume of B2B and
B2C research and uncovered opportunities and challenges of B2B digital marketing. Also,
academics are calling for more explanatory research in the industrial marketing field (La Placa
& da Silva, 2016). This study extends the limited quantified knowledge on customer
engagement on social media in the B2B and B2C context. The knowledge can be used in
practice to develop targeted social media strategies for firms in B2B and B2C markets.
Second, this study might encourage more (non-)social media using companies to seize
the opportunities of this type of marketing and adapt their marketing strategies on their business
model. In a study on the usage, perceived barriers and the measurement of effectiveness of the
social networks of small and medium-sized enterprises (SMEs) in the UK, Michaelidou,
Siamagka and Christodoulides (2011) found that only 27% of the B2B SMEs were actively
using social media networks. 53% of the social media-using participating companies indicated
that they did not measure the effectiveness of social media at all, mostly due to their lack of
knowledge of the right metrics. 61% of them did claim to consider evaluating the metrics in the
near future (Michaelidou et al., 2011). This thesis attempts to reduce the lack of knowledge and
provides tools and guidance for academics and practitioners to increase the effectivity and
performance of social media usage for companies.
Third, the results might provide direction for both B2B and B2C companies on which
content works best for their specific customer: businesses or consumers. This research looks at
what objective the content supports and which type of content increases customer engagement.
With this insight, marketers can increase overall customer engagement by posting B2B- or
B2C-specific content, which will benefit companies in the long run (Hoffman & Fodor, 2010).
MASTER THESIS – MSc DIGITAL BUSINESS SOPHIE LOUISE KOOPMANS, 10556419
11
The structure of this research is as follows. First, extant literature on social media content
and customer engagement is discussed to build a conceptual framework and form hypotheses.
Second, the methodology of this research is described. Third, the results are discussed in the
sequence of the hypotheses. Forth, the results are deliberated on in the discussion section,
limitations are uncovered, and theoretical and practical implications are revealed. To conclude,
the main research question is answered in the conclusion and directions for future research are
proposed.
2. Theoretical Framework
2.1 Social media use in business
Social media allows firms to communicate and engage more extensively online with customers
than in the past. Social media marketing offers a solution for the declining effectiveness of
traditional marketing techniques (Holliman & Rowley, 2014). Despite the potential, social
media is not as much used as traditional digital tools like email and websites in business, and is
still underutilized by industrial companies (Karjaluoto, Mustonen, & Ulkuniemi, 2015).
The extent to which companies and employees use social media for professional purposes
depends on several factors: technology savviness, personal use and the use of social media in
work processes. Taking insights from different studies together suggests that the steps to
increase social media usage in business are, firstly, to let employees get social media savvy
personally, e.g. encourage them to make a personal account (Keinänen & Kuivalainen, 2015;
Schultz, Schwepker, & Good, 2012); secondly, to implement social media network usage in the
internal organization; after which, thirdly, the reach can be expanded externally to customers
(Karjaluoto et al., 2015). The literature that provides these insights does not distinguish between
MASTER THESIS – MSc DIGITAL BUSINESS SOPHIE LOUISE KOOPMANS, 10556419
12
different business models. However, B2B and B2C companies are likely to act differently on
social media.
2.2 B2B vs. B2C
Extant research has studied the differences in customers, companies and sales people between
B2B and B2C. First, customers of B2B companies have different motivations to use social
media than customers of B2C companies. Customers of B2B companies are professionals who
represent their employer. The customer and company in the B2B context build a professional
relationship. Customers of B2C companies, on the other hand, represent themselves. They buy
products or use services for their own personal needs. The objectives of the customer to use
social media are to find product and service information, share their experiences or join in co-
creation on social media (Constantinides, Schepers, & De Vries, 2015; Moore, Hopkins, &
Raymond, 2013).
Second, B2B and B2C companies themselves differ. The general objectives of companies
for using digital channels are to create awareness, enhance customer relationships and support
sales (Karjaluoto et al., 2015). These key objectives are different for B2B companies than for
B2C companies. For B2C companies, the most important objective to use social media is to
create brand awareness by consumers (Michaelidou et al., 2011). Furthermore, providing
information, having interaction and doing sales is also important for B2C companies
(Constantinides et al., 2015). On the other hand, attracting new customers and cultivating
customer relationships are the most important objectives of social media for B2B companies.
While creating brand awareness is the main objective in the B2C context, its only third for B2B
companies (Michaelidou et al., 2011).
Third, B2B sales people seem to use social media more than B2C sales people. A study
found that when comparing social media usage of B2B and B2C sales people, the utilization
MASTER THESIS – MSc DIGITAL BUSINESS SOPHIE LOUISE KOOPMANS, 10556419
13
percentage of B2B salesmen was significantly higher than the number of B2C sales people on
many social media platforms (Moore et al., 2013). This would imply that the adoption rate of
social media is higher for B2B sales people than for B2C sales people. It can be explained by
the relationship-oriented selling practices of B2B sales people. For B2B sales people, quality
of relationships is more important, while B2C sales people use social media to reach a large
quantity of potential customers (Moore et al., 2013).
2.3 Customer engagement
These differences between B2B and B2C markets in customers, companies, and its sales people
are expected to endure in customer engagement. But what is customer engagement? Scholars
do not seem to agree on one general definition as customer engagement is a very broad concept
(Brodie, Hollebeek, Jurić, & Ilić, 2011; Malthouse, Haenlein, Skiera, Wege, & Zhang, 2013;
Sashi, 2012). The much used definition of customer engagement proposed by Brodie et al.
(2011) is: “a psychological state, which occurs by virtue of interactive customer experiences
with a focal agent/object within specific service relationships”. It emphasizes the interactive
nature of social media on which both sides (company and customer) can create content and
interact.
To examine the effectiveness of the interactions, social media is becoming more data
driven. Marketers utilize social Customer Relationship Management (CRM) systems to collect
data on customer engagement, from which they can gather insights on how to reach new
customers and enhance relationships more efficiently and effectively (Trainor, Andzulis, Rapp,
& Agnihotri, 2014). These insights improve relationships and facilitate integration of the
obtained information in the sales process (Rodriguez, Peterson, & Ajjan, 2015). Keeping
consumers engaged is crucial to increase the value of interactive firm-consumer relationships.
MASTER THESIS – MSc DIGITAL BUSINESS SOPHIE LOUISE KOOPMANS, 10556419
14
Barger & Labrecque (2013) identified four types of social media users based on their
customer engagement: bystanders, followers, participants and advocates. Bystanders stumble
upon posts or mentions of a brand, but do not interact. Followers neither engage with a brand,
but do search for them on social media and actively follow their posts. Participants engage and
interact with a brand by liking or commenting on their posts. Lastly, advocates both interact
with and actively promote a brand by creating and uploading their own positive content (Barger
& Labrecque, 2013).
Customers of B2C companies have found their way to social media and are more likely
to be participants or advocates. According to Keinänen and Kuivalainen (2015), B2B customers
are still fairly passive on social media, as they use it as a source of information and do not
actively comment nor open a discussion. Therefore, most B2B customers can be classified as
bystanders and followers. Companies should think about how to activate business customers
on social media and turn them into participants and advocates to get the true value from the
platforms.
Cuillierier (2016) argues that customer engagement is more important for B2B firms,
because client bases are smaller and customers buy in large volumes or do larger transactions,
as compared to B2C firms. Maintaining good relations with customers and retaining customer
engagement should therefore be more critical to B2B firms than to B2C firms. Also, B2B sales
people are more focused on building relationships with the help of social media and are utilizing
the platforms more for these purposes (Moore et al., 2013) than B2C sales people. It is expected
that customers reciprocate the efforts of B2B salespeople. Therefore, it is hypothesized that:
Hypothesis 1: Customer engagement is higher on B2B company posts than on B2C
company posts on LinkedIn.
MASTER THESIS – MSc DIGITAL BUSINESS SOPHIE LOUISE KOOPMANS, 10556419
15
2.4 Content type
Besides the objectives of firms to post on social media networks, content of posts (firm-
generated content) is controlled by firms and might have an influence on customer engagement.
Content on social media is created by corporate, employee, professional and civilian users.
Firms have limited direct control what customers see and do on social media, but firms do have
an (indirect) influence on the customer engagement of a post. B2B companies influence
customer engagement directly with corporate user accounts by adding new content,
participating in discussions, and removing content with corporate accounts (Huotari et al.,
2015). So, the content companies post is important for customer engagement.
Some types of content might work better than others to involve customers. There haven’t
been many studies on which content works on social media and which doesn’t. In other
disciplines of digital marketing has been some more research. For instance, in search engine
advertising (SEA) stating a call to action in an search engine advertisement’s content has a
positive effect on the engagement (click through rate) (Rutz & Trusov, 2011). Another study
found that increasing the interactivity of a post was found to have a strong effect on customer
engagement on posts, measured by likes, comments and shares (Luarn, Lin, & Chiu, 2015).
Semantics, writing style and evidence type of content also influence engagement (Haans,
Raassens, & van Hout, 2013), but are out of the scope of this study. This study is primarily
focused on subjects of content.
The individual content types can be divided into three broad categories: promotion,
reputation, and events. The content types in the promotion category promote products and
services from the companies. They are directly related to sales. The promotion category
includes the content types promotion/discount, contests, and products and services. With the
second category, reputation posts, a company can influence the image a customer has of the
company, and present the company as an industry expert. The reputation posts include posts
MASTER THESIS – MSc DIGITAL BUSINESS SOPHIE LOUISE KOOPMANS, 10556419
16
about awards, CSR, knowledge sharing, reports, industry news, company information, and
workforce/recruitment. In the third overarching category, content types are related to events,
which include content types like presence at internal or external events, conferences or award
shows. As there is no prior study which provides a categorization, the following categorization
is based on assumptions.
The type of content used may be dependent on the business model. For example, B2C
firms may make more use of certain types of content than B2B firms, like content to enhance
awareness among customers. Because the objectives for using social media differ for B2B and
B2C, it is expected that business to business and business to consumer companies emphasize
different types of content.
For instance, I expect that B2C companies engage more in promotional activities like
(publicly announced) discounts and contests. B2B companies are less likely to engage in these
types of promotions, as their individual customers have to some extent more bargaining power
than B2C customers, because the transactions in the B2B industries are larger and the products
and services are more personalized on the client’s preferences (Cuillierier, 2016). B2B
marketers rely more on (personal) emotional appeals than functional appeals (Swani et al.,
2014). On the other side, B2C customers have less bargaining power as prices and product
specifications are commonly fixed. Also, the relationship with a brand is less personal
(Homburg, Klarmann, & Schmitt, 2010) and B2C companies must rely more on mass
communication channels, like social media, to promote their products, because the quantity of
potential customers is larger than for B2B companies (Moore et al., 2013). Therefore, I
hypothesize:
Hypothesis 2a: B2C companies post more promotional content than B2B companies.
MASTER THESIS – MSc DIGITAL BUSINESS SOPHIE LOUISE KOOPMANS, 10556419
17
Customers may be more responsive to a “1+1 for free!” promotional post than to “Did
you know [fact] about our product?” as a product introduction post. The type of content of posts
may influence the amount of likes and comments on posts. It is expected that some types of
content interact better with either B2B or B2C customers than other types. I expect that the
content types that are popular with B2B or B2C marketers, are also more engaging for their
customers. The business model works as a moderator on the relationship between content type
and customer engagement. So, in line with the previous hypothesis that B2C companies post
more promotional content, it is expected that these posts generate higher engagement for this
target group. Therefore:
Hypothesis 3a: B2C customers are more engaged in promotional content than B2B
customers.
Content types in the reputation category are important for both B2B and B2C companies
(Smaiziene & Jucevicius, 2009). Building a positive brand reputation on social media causes
an increase in firm performance (Swani et al., 2014), which is an objective of all companies.
However, having a good corporate reputation and posting about this might be slightly more
important to B2B companies. Especially in the professional services industry, reputation is very
important to retain loyal customers (Walsh, Beatty, & Holloway, 2015). Though, I expect the
difference between B2B and B2C to be only small.
Hypothesis 2b: B2B companies post slightly more posts to increase reputation than B2C
companies.
Again, in line with the reasoning of the hypothesis 2b about content, I expect the following:
MASTER THESIS – MSc DIGITAL BUSINESS SOPHIE LOUISE KOOPMANS, 10556419
18
Hypothesis 3b: B2B customers are slightly more engaged in reputation posts than B2C
customers.
Furthermore, as B2B companies are more focused on individual relationships with customers
and can adapt their efforts to some degree of personalization, B2B companies are more involved
in organizing, joining and promoting events. During events, they can meet and engage with
customers on a more personal level. On the other hand, B2C companies have a less personalized
relationship with their customers, and due to the relatively large size of their customer base,
they are less likely to post about events to reach their individual customers. Therefore, it is
expected that B2B companies post more event-related posts to engage customers than B2C
companies.
Hypothesis 2c: B2B companies post significantly more event-related content than B2C
companies.
Once again, in line with the reasoning of the hypothesis about content, I expect the following:
Hypothesis 3c: B2B customers are more engaged with event-related posts than B2C
customers.
Throughout the theoretical framework of this paper, the conceptual framework will be build up
out of smaller parts. The full conceptual framework is given in the end. Figure 1 shows a
conceptual model that connects the (sub) hypotheses 1, 2 and 3. The moderating effect of

MASTER THESIS – MSc DIGITAL BUSINESS SOPHIE LOUISE KOOPMANS, 10556419
19
business models on the relationship between content type and customer engagement is left out
of this figure.
Figure 1 Conceptual model of variables business model, content type and customer engagement
2.5 Relationship phases
As mentioned before, firms post content on social media to support their relationship objectives:
raising (brand) awareness, doing customer acquisition or enhancing customer retention
(Michaelidou et al., 2011). These objectives form a customer’s simplified journey (see Figure
2). Companies can create content on social media targeted at customers in one of the three
phases of the customer journey. A relationship that is still in the awareness phase targets
potential customers who do not know or barely have knowledge about a brand. In the
acquisition phase, potential customers are encouraged to buy a product or use a service. The
potential customers might never have used the brand before or only incidentally. In the retention
phase, relationships with customers are present, and companies like to invigorate the
relationships and encourage customers to re-use the brand. Below, all relationship phases are
further explained.
Figure 2 Simplified customer journey in relationship phases
Awareness Acquisition Retention
MASTER THESIS – MSc DIGITAL BUSINESS SOPHIE LOUISE KOOPMANS, 10556419
20
2.5.1 Awareness
Customers gain awareness through exposure to a brand or product. Hoffman and Fodor (2010)
describe brand awareness in the social media environment as: “every time a person uses an
application designed by or about the company, the company gains increased exposure to its
brand, often in highly relevant contexts.” The exposure enhances and strengthens associations
of the brand in the customers’ minds. Awareness posts are not necessarily personalized, at best
segmented, because in general the first awareness messages are meant for a wide audience. The
goal of raising awareness is to inform customers about the existence of a brand, product or
service, not yet actively acquiring or converting them as customers. That is the next step in the
customer journey. In traditional marketing, television advertisements or billboards are
examples of ways to create customer awareness. On social media, this could be online
advertisements, (sponsored) posts, mentions or events.
In B2C markets, social media are used for one-to-many communications and posts are
quite general. In B2B markets the focus is a slightly more personal, even in this first stage where
potential customers get acquainted with brands and products. The social media channels can be
used for one-to-many, but also one-to-one communications. It is not likely that B2C marketers
contact individual customers to let them know about a certain new product. The return on (time)
investment is too low for B2C, while in B2B ‘cold calling’ on social media may be worth the
time investment. On the other hand, the main objective for B2C marketers to use social media
is to create awareness (Michaelidou et al., 2011). Accordingly, they will focus their social media
strategy on awareness posts and aim to reach many potential customers with one message (one-
to-many marketing). Therefore, I expect that B2C companies post more awareness posts.
Hypothesis 4a: B2C companies post more awareness-related posts than B2B companies.
MASTER THESIS – MSc DIGITAL BUSINESS SOPHIE LOUISE KOOPMANS, 10556419
21
2.5.2 Acquisition
In the acquisition phase, companies, which already created awareness, start encouraging
prospective customers to buy a product or use a service. This may be the first time a customer
converts, or a customer has incidentally bought the product or service before, without reaching
the retention phase. Online acquisition efforts include running promotions about a product or
service or giving discounts on e.g. Facebook or LinkedIn. In traditional marketing, this could
be promotions in brochures, on television or in magazines. An important difference between
traditional and online marketing is the ability to improve targeting and personalization in online
marketing (Malthouse et al., 2013). For instance, a web shop could run personalized ads of
products a customer viewed online, but did not buy yet. This is an example of retargeting.
Another distinction between B2B and B2C in the acquisition phase is the difference in
the origin of demand. For B2B, demand is derived by a subsequent customer; the buyer is not
likely to be the end user, while in B2C demand is driven by the specific tastes, emotions and
preferences of the end customer (Lilien, 2016; Mora Cortez & Johnston, 2017). Furthermore,
the buying decision process differs between the two markets. Where in B2C the decision maker
is most likely the same person as the consumer, in B2B the decision making process is more
complex and involves more stakeholders (Mora Cortez & Johnston, 2017). For example, a
consumer of a product (an employee) does not make the buying decision, but his/her boss does.
This implies that it is more about quantity of demand in the B2C markets and more about quality
of relationships in the B2B markets. Therefore, it is hypothesized:
Hypothesis 4b: B2B companies post more acquisition-related posts than B2C companies.
2.5.3 Retention
In the retention phase, customers are aware of a company’s offerings and have been
successfully acquired as a customer. The goal of retention is to encourage them to return and
MASTER THESIS – MSc DIGITAL BUSINESS SOPHIE LOUISE KOOPMANS, 10556419
22
remain in an ongoing relationship with the company, preferably becoming loyal to the brand.
Firms can retain existing customers by keeping them satisfied and engaged. Customer
relationship management is very important in this stage. In online marketing, firms use cookies
and re-marketing techniques to remind customers of the brand, product or service (Iankova,
Davies, Archer-Brown, Marder, & Yau, 2018). The relationship and communication is
becoming even more personal to create a bond with customers and let them know their business
appreciated. With the remarketing technologies, it is possible to automate the process, yet make
the messages personal. When the customer is successfully retained, the customer enters the
loyalty loop and stays with the company. Once the customer has entered the loyalty loop, it is
important to maintain the relationship and nurture the customer, otherwise the customer may
become unsatisfied and switch to a competitor’s product or service (Thaichon & Quach, 2015).
Hence, the retention phase is mainly about keeping the customer satisfied. In B2B, this is
done by creating strong buyer-seller relationships. In B2C, buyer-seller relationships are weaker
(Homburg et al., 2010), so customers base their choice to stay loyal to a brand on different
factors. As B2B marketers are focused on building relationships with customers on social
media, more than B2C marketers, I expect that B2B marketers post more retention posts than
B2C marketers.
Hypothesis 4c: B2B companies post more retention-related posts than B2C companies.
In the acquisition and retention stages of the customer journey, relationships are established to
some extent, and customers might feel more connected to a company’s brand. The relationship
is more personal than in the awareness phase. Because of this feeling of connectedness, I expect
higher customer engagement on acquisition and retention posts, which implies that B2B
customers are more engaged than B2C customers. Therefore, I hypothesize:
MASTER THESIS – MSc DIGITAL BUSINESS SOPHIE LOUISE KOOPMANS, 10556419
23
Hypothesis 5a: Acquisition and Retention content generates higher Customer
Engagement than Awareness content.
If hypotheses 4b, 4c, and 5a are true, this might indicate a moderating relationship of business
model on the connection between relationship phase of the content and engagement. Therefore,
I additionally hypothesize:
Hypothesis 5b: Relationship content posted by B2B companies create higher engagement
than relationship content by B2C companies.
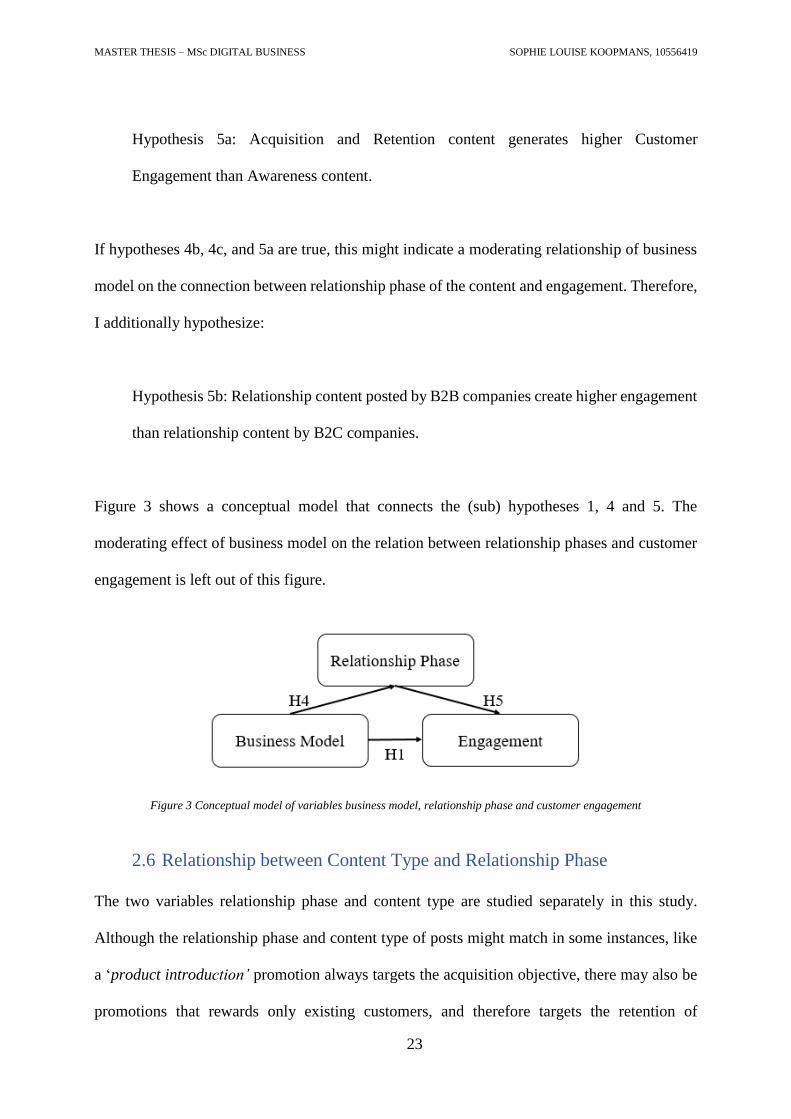
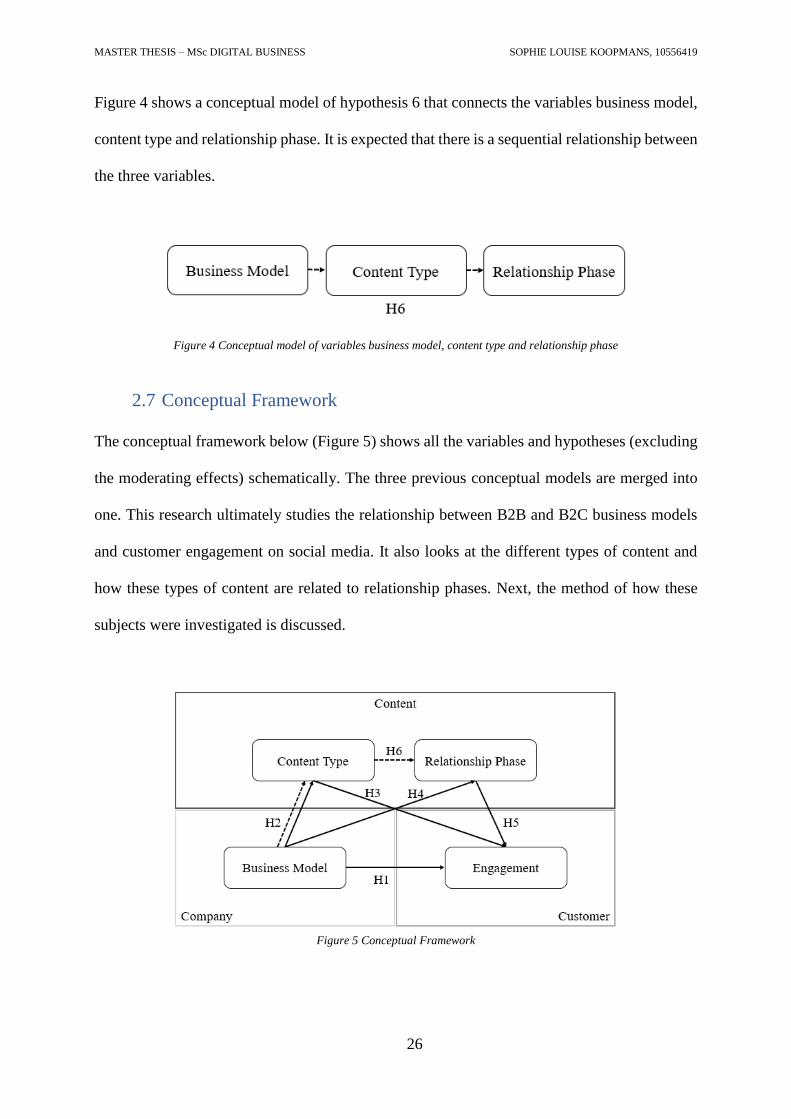
Figure 3 shows a conceptual model that connects the (sub) hypotheses 1, 4 and 5. The
moderating effect of business model on the relation between relationship phases and customer
engagement is left out of this figure.
Figure 3 Conceptual model of variables business model, relationship phase and customer engagement
2.6 Relationship between Content Type and Relationship Phase
The two variables relationship phase and content type are studied separately in this study.
Although the relationship phase and content type of posts might match in some instances, like
a ‘product introduction’ promotion always targets the acquisition objective, there may also be
promotions that rewards only existing customers, and therefore targets the retention of
MASTER THESIS – MSc DIGITAL BUSINESS SOPHIE LOUISE KOOPMANS, 10556419
24
customers. This way, the same content category promotion can target two different relationship
phases. Interestingly, which types of content and relationship phases are connected, might
deviate between the B2B and B2C markets. What content types can be linked to certain
relationship types in which markets? Marketers could use this information to determine what
content to create when they aim to influence customers in a certain relationship phase,
according to their business model.
Few scholars studied the connection of content types to the relationship phase, so there is
little academic knowledge in this area. This study is the first to address this question. Using the
two business models (B2B and B2C), the three broad content categories (promotion, reputation
and events) and the three relationship phases (awareness, acquisition and retention), I framed
hypotheses based on intuition.
I expect the types of promotional posts that the two different business markets use to
differ. B2C companies probably use promotional posts to incentivize potential customers to buy
the products by offering discounts, targeting the acquisition phase. B2B companies are less
keen on giving discounts, as mentioned before. B2B companies probably use promotional posts
to introduce and inform customers about products or services, targeting the awareness and
retention phases. Therefore, I hypothesize:
Hypothesis 6a: Promotion posts in the B2C context mainly target the acquisition phase.
Hypothesis 6b: Promotion posts in the B2B context mainly target the awareness and
retention phases.
Next, reputation posts are presumably used by B2C companies to raise awareness about the
company’s products and capabilities, mainly creating trust in the brand. Therefore, reputation
MASTER THESIS – MSc DIGITAL BUSINESS SOPHIE LOUISE KOOPMANS, 10556419
25
posts by B2C companies are likely to be focused on the awareness phase. On the other hand,
B2B companies use reputation posts for raising awareness with potential customers, but also
use reputation for retention purposes. To retain customers and keep the company-customer
relationship positive, B2B company would want to profile themselves as experts in their field
of work by sharing reports and industry news. These content types would be less relevant for
B2C customers to increase a B2C company’s reputation. Therefore, I hypothesize:
Hypothesis 6c: Reputation posts in the B2C contexts mainly target the awareness phase.
Hypothesis 6d: Reputation posts in the B2B context mainly target the awareness and
retention phases.
Finally, event-related posts could also have different purposes in the B2B and B2C contexts. If
a B2C company would, for example, organize an event for its customers, it is probably to
increase awareness about the brand by e.g. handing out free samples. On the contrary, B2B
companies would organize events to invite existing customers for retention purposes, for
example inviting customers to conferences. Therefore, I expect that B2B and B2C companies
would use event-related posts to reach customers in different relationship phases. I hypothesize:
Hypothesis 6e: Event posts in the B2C context mainly target the awareness phase.
Hypothesis 6f: Event posts in the B2B context mainly target the retention phase.
MASTER THESIS – MSc DIGITAL BUSINESS SOPHIE LOUISE KOOPMANS, 10556419
26
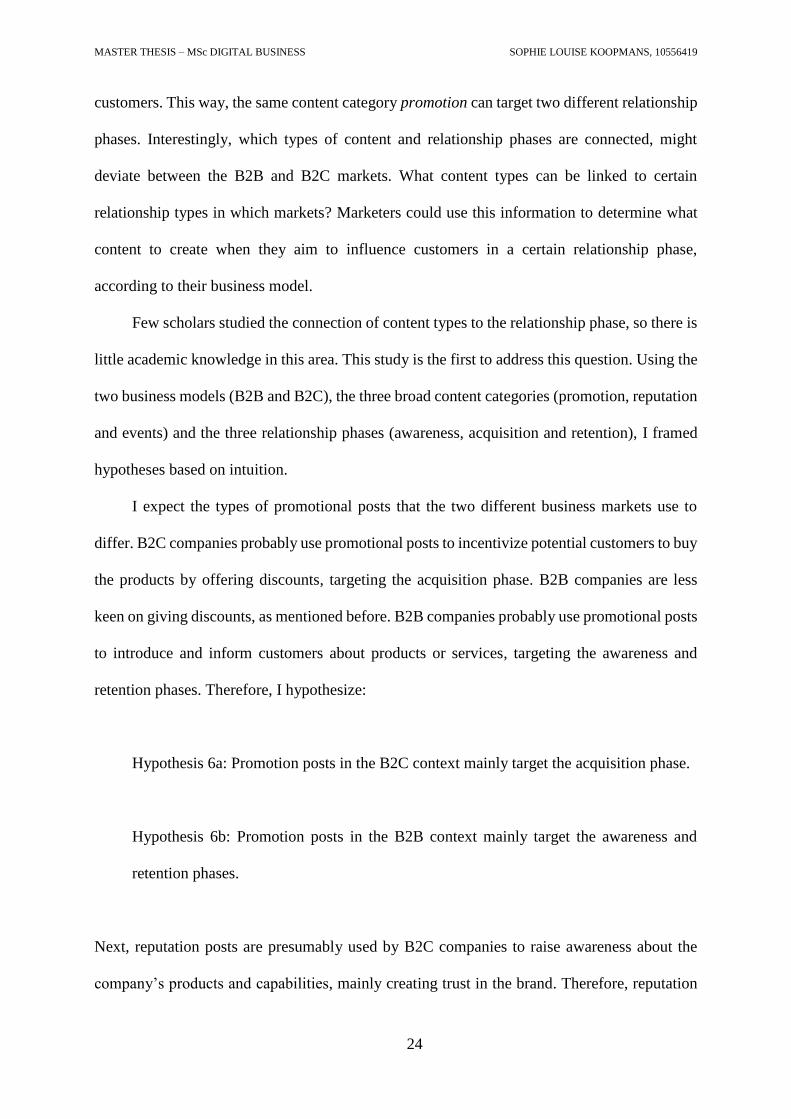
Figure 4 shows a conceptual model of hypothesis 6 that connects the variables business model,
content type and relationship phase. It is expected that there is a sequential relationship between
the three variables.
Figure 4 Conceptual model of variables business model, content type and relationship phase
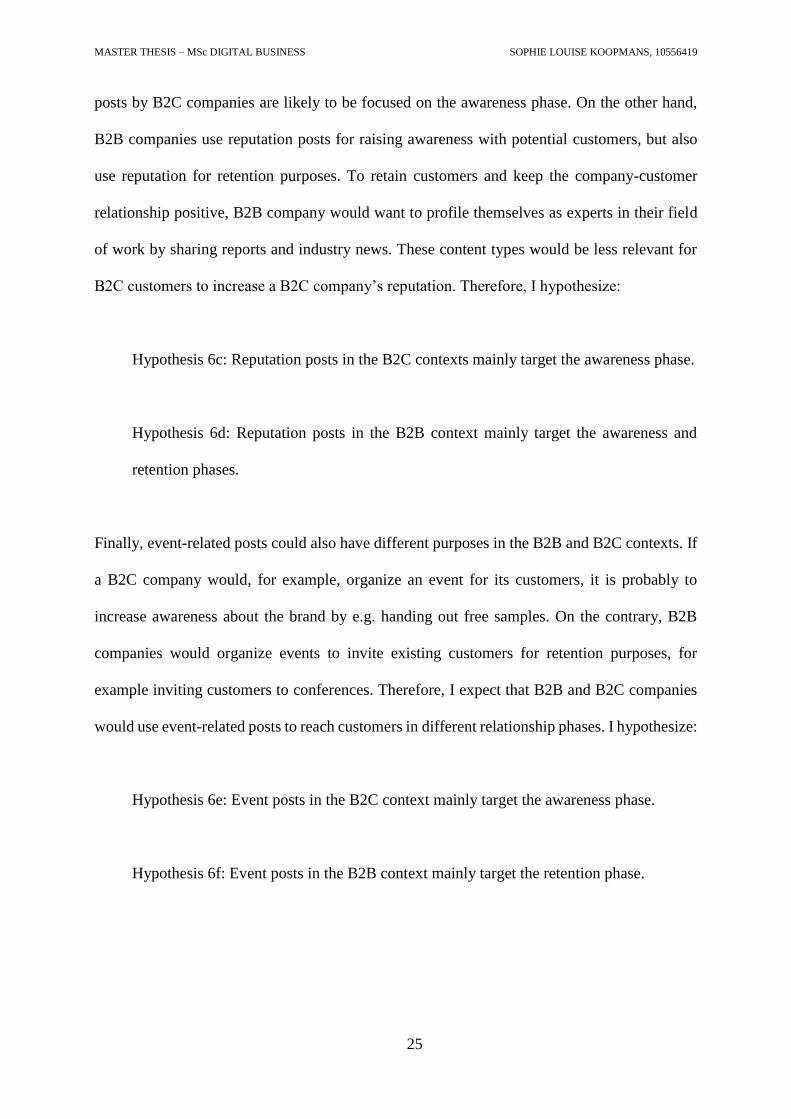
2.7 Conceptual Framework
The conceptual framework below (Figure 5) shows all the variables and hypotheses (excluding
the moderating effects) schematically. The three previous conceptual models are merged into
one. This research ultimately studies the relationship between B2B and B2C business models
and customer engagement on social media. It also looks at the different types of content and
how these types of content are related to relationship phases. Next, the method of how these
subjects were investigated is discussed.
Figure 5 Conceptual Framework
MASTER THESIS – MSc DIGITAL BUSINESS SOPHIE LOUISE KOOPMANS, 10556419
27
3. Methodology
The purpose of the study is to assess the influence of business model and content on customer
engagement. This study had an explanatory, cross-sectional research design. The data was
measured at a specific point in time, and the sample was selected based on existing differences
rather than random allocation (Labaree, 2009). For obtaining data on content of social media
posts, this study used the methodological framework of content analysis (White & Marsh,
2006).
3.1 LinkedIn
The social medium assessed in this study is LinkedIn (www.linkedin.com). LinkedIn claims to
be world’s largest professional network with more than 546 million users in more than 200
countries and territories worldwide. The mission is to connect the world’s professionals to make
them more productive and successful (Linkedin Corporation, 2018). Individuals can display
their resumes publicly online and link with other professionals. Companies can create corporate
pages where they can upload posts (‘updates’), communicate vacancies and display information
about the company. Members can opt-in to follow company pages.
Companies can also create corporate accounts on other social media platforms like
Facebook, Twitter and Instagram. In this study, LinkedIn was chosen as the focal social media
platform, because members represent both themselves (targeted by B2C’s) and companies
(targeted by B2B’s) as they use the medium for professional purposes and communication.
LinkedIn is the most important social media platform to follow a company professionally
(Keinänen & Kuivalainen, 2015). Also, B2B marketers indicated that LinkedIn was the most
important platform for them, however, B2C marketers preferred Facebook (Social Media
Examiner, 2017). Since part of the contribution of this study is to narrow the B2B knowledge
gap, the preference of B2B marketers was given more weight. Furthermore, the number of
MASTER THESIS – MSc DIGITAL BUSINESS SOPHIE LOUISE KOOPMANS, 10556419
28
studies on LinkedIn is limited, so our academic contribution would be more relevant when
studying LinkedIn instead of Facebook.
3.2 Sample
The LinkedIn posts (‘updates’) of 6 companies were assessed. The selection included 3 B2B
and 3 B2C firms (see Table 1). The companies were selected according to several criteria.
Firstly, the company had to report at least an annual revenue of €100 million. Because of this
revenue level, it is assumed that these companies have professional digital marketing
employees/departments, so professional marketers create content on the LinkedIn page.
As B2B and B2C companies mostly operate in different sectors, getting all the sampled
companies from only one sector is not feasible. Therefore, the companies in the sample all
operated in different sectors. An advantage of this method of sampling is that the sample was
not biased by one specific sector and the results are generalizable across sectors. On the other
hand, a disadvantage of this sampling method is that it is harder to find significant results.
The LinkedIn profiles of the companies also had to meet several criteria. The selected
companies had to be active on LinkedIn for at least one year and posted at least 27 times in the
last six months (average of once a week). This would imply that the marketers had experience
on writing content for LinkedIn. Furthermore, the company’s LinkedIn page had to have at least
10,000 followers, so there were enough LinkedIn members to engage. The content of company
pages was also assessed to check if they used LinkedIn as a marketing and sales tool, not merely
a recruitment tool, so maximum 25% of the lasts 50 posts should could have recruitment
purposes (i.e. the page cannot exclusively contain content about vacancies and recruitment
activities). The posts had to be in either Dutch or English. Lastly, if the company had both B2B
and B2C divisions, it was checked that the LinkedIn content was not targeted at both B2B and
B2C customers, but exclusively at one group. Following these requirements and using the
MASTER THESIS – MSc DIGITAL BUSINESS SOPHIE LOUISE KOOPMANS, 10556419
29
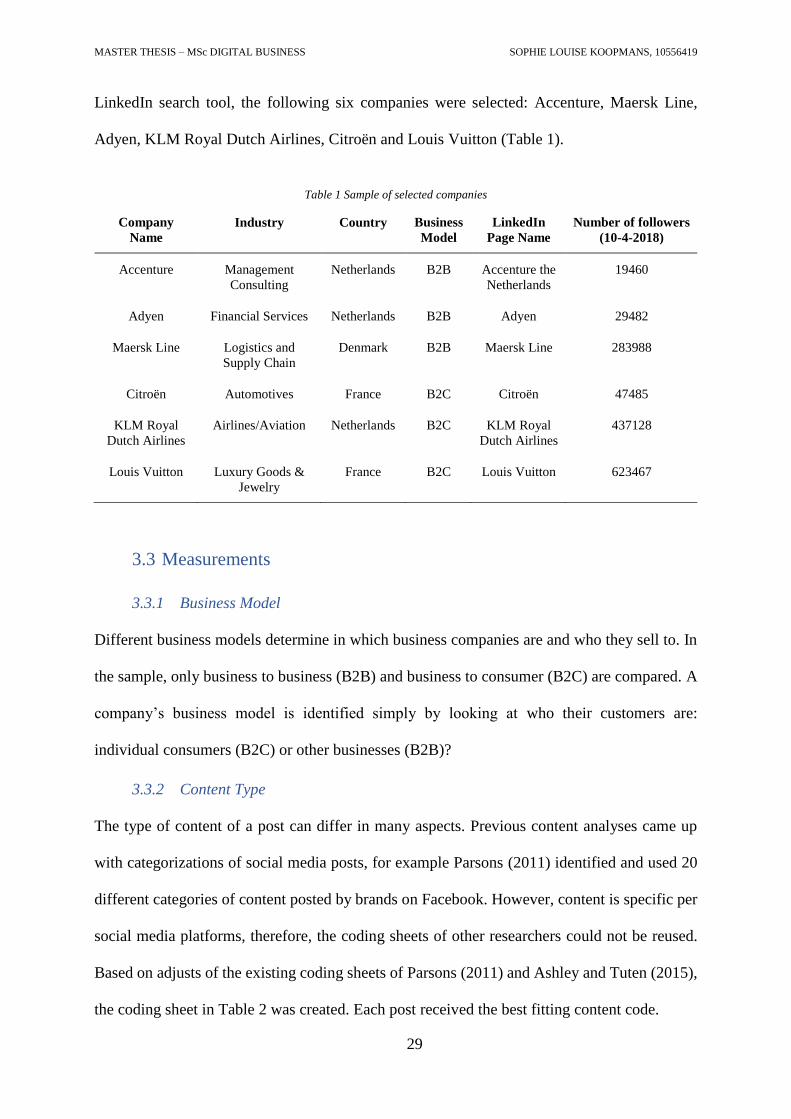
LinkedIn search tool, the following six companies were selected: Accenture, Maersk Line,
Adyen, KLM Royal Dutch Airlines, Citroën and Louis Vuitton (Table 1).
Table 1 Sample of selected companies
Company
Name
Industry Country Business
Model
Page Name
Number of followers
(10-4-2018)
Accenture Management
Consulting
Netherlands B2B Accenture the
Netherlands
19460
Adyen Financial Services Netherlands B2B Adyen 29482
Maersk Line Logistics and
Supply Chain
Denmark B2B Maersk Line 283988
Citroën Automotives France B2C Citroën 47485
KLM Royal
Dutch Airlines
Airlines/Aviation Netherlands B2C KLM Royal
Dutch Airlines
437128
Louis Vuitton Luxury Goods &
Jewelry
France B2C Louis Vuitton 623467
3.3 Measurements
3.3.1 Business Model
Different business models determine in which business companies are and who they sell to. In
the sample, only business to business (B2B) and business to consumer (B2C) are compared. A
company’s business model is identified simply by looking at who their customers are:
individual consumers (B2C) or other businesses (B2B)?
3.3.2 Content Type
The type of content of a post can differ in many aspects. Previous content analyses came up
with categorizations of social media posts, for example Parsons (2011) identified and used 20
different categories of content posted by brands on Facebook. However, content is specific per
social media platforms, therefore, the coding sheets of other researchers could not be reused.
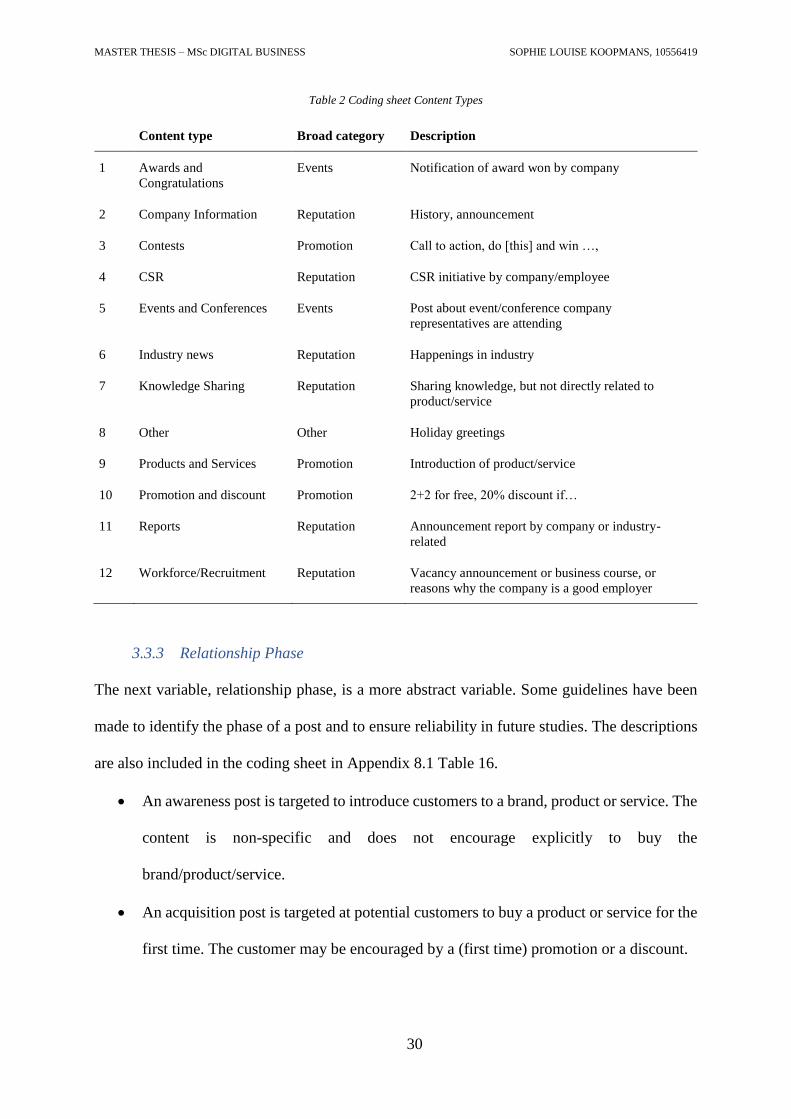
Based on adjusts of the existing coding sheets of Parsons (2011) and Ashley and Tuten (2015),
the coding sheet in Table 2 was created. Each post received the best fitting content code.
MASTER THESIS – MSc DIGITAL BUSINESS SOPHIE LOUISE KOOPMANS, 10556419
30
Table 2 Coding sheet Content Types
Content type Broad category Description
1 Awards and
Congratulations
Events Notification of award won by company
2 Company Information Reputation History, announcement
3 Contests Promotion Call to action, do [this] and win …,
4 CSR Reputation CSR initiative by company/employee
5 Events and Conferences Events Post about event/conference company
representatives are attending
6 Industry news Reputation Happenings in industry
7 Knowledge Sharing Reputation Sharing knowledge, but not directly related to
product/service
8 Other Other Holiday greetings
9 Products and Services Promotion Introduction of product/service
10 Promotion and discount Promotion 2+2 for free, 20% discount if…
11 Reports Reputation Announcement report by company or industry-
related
12 Workforce/Recruitment Reputation Vacancy announcement or business course, or
reasons why the company is a good employer
3.3.3 Relationship Phase
The next variable, relationship phase, is a more abstract variable. Some guidelines have been
made to identify the phase of a post and to ensure reliability in future studies. The descriptions
are also included in the coding sheet in Appendix 8.1 Table 16.
• An awareness post is targeted to introduce customers to a brand, product or service. The
content is non-specific and does not encourage explicitly to buy the
brand/product/service.
• An acquisition post is targeted at potential customers to buy a product or service for the
first time. The customer may be encouraged by a (first time) promotion or a discount.
MASTER THESIS – MSc DIGITAL BUSINESS SOPHIE LOUISE KOOPMANS, 10556419
31
• A retention post is targeted at existing customers. The post could mention a loyalty
program or promotion, an invitation to events for customers, complementary services
or the name of an existing customer as a best practice or case study of their work.
The phases of a post were sometimes mutually inclusive, for example when a post targeted both
new and existing customers (both acquisition and retention). However, only the best fit was
assigned to a post for analytical purposes. Furthermore, posts about recruitment and job
opportunities were excluded in this measurement, as they do not target customers in any phase
of the customer journey. These posts received the code None.
3.3.4 Customer Engagement
The customer engagement measurements are based on existing social media metrics. The
number of likes is a metric for low engagement and number of comments is medium
engagement (Neiger et al., 2012). There are many other social media metrics for engagement,
but only these two are used, because they are publicly available and retrievable. To get one
general engagement score, the number of comments were weighted twice as heavy as the
number of likes. To control for the number of followers per company page in the sample, as
more followers increases the number of impressions and thus the possibility to engage, the
number of likes and the number of comments were divided per 10,000 followers to standardize
the metrics. Thus, the engagement score of a post was calculated as follows (formula 1):
(1) 𝐸𝑛𝑔𝑎𝑔𝑒𝑚𝑒𝑛𝑡 𝑆𝑐𝑜𝑟𝑒 = 𝑁𝑢𝑚𝑏𝑒𝑟 𝑜𝑓 𝑙𝑖𝑘𝑒𝑠 + (𝑁𝑢𝑚𝑏𝑒𝑟 𝑜𝑓 𝑐𝑜𝑚𝑚𝑒𝑛𝑡𝑠 × 2)
(𝑁𝑢𝑚𝑏𝑒𝑟 𝑜𝑓 𝑓𝑜𝑙𝑙𝑜𝑤𝑒𝑟𝑠/10000)
Number of shares is also a widely used metric for customer engagement across social media
platforms, but as of February 2018 LinkedIn does not longer show the number of shares on
posts or provide the count. LinkedIn states: “The share count on its own doesn’t fully reflect
the impact that a piece of content delivers, and we encourage publishers and other content
creators to leverage the [share tool] as a way to drive conversation and engage with members
MASTER THESIS – MSc DIGITAL BUSINESS SOPHIE LOUISE KOOPMANS, 10556419
32
on LinkedIn.” Therefore, only the number of likes and comments were used as measurements
for customer engagement.
Logically, the longer a post has been online, the more exposure it could get and the more
time there was to like or comment on the post. However, the time a post has been online was
not considered in the data analysis of engagement. LinkedIn only displays recent posts on the
timeline of users and it is assumed that users mostly engage with posts that appear on their
timeline. From own experience, most likes and comments are given within a few days after
posting the message. Research on Twitter messages confirmed that the majority of shares
happens within one week (Priem & Costello, 2010). Therefore, it is unlikely that a three-month-
old post received significantly more likes and comments than a one-month-old post. To control
for recently posted updates which are still appearing on timelines, the post sample excluded
posts younger than one week.
3.4 Procedure
3.4.1 Data Collection
After the sample was successfully composed, the collection of data started. The unit of analysis
was the independent posts. For each company in the sample, the last 100 qualifying posts
including the engagement data were collected. A post qualified when it met all the following
criteria:
1. The post should contain at least three words (besides optionally an ‘attachment’ like
e.g. a website link, report, photo, video).
2. The post must be generated by the official account of the company (firm generated
content).
MASTER THESIS – MSc DIGITAL BUSINESS SOPHIE LOUISE KOOPMANS, 10556419
33
3. Posts posted in the seven days prior to the date of data collection were excluded.
Customer engagement is not reliable yet, because not all followers had the chance to
see the post, as explained before.
The collection was done either by using the LinkedIn API which collected several statistics for
each post separately, or it was done manually by copying/pasting the data in Microsoft Excel.
The first method had preference, but the LinkedIn API had the limitation that the data collector
must be an administrator of the LinkedIn company page. Not all companies in the sample had
provided this access to the company’s LinkedIn page, so these companies’ data had to be
collected manually. After the content of the post, date, number of likes, number of comments,
and number of followers of the company page were documented, the content analysis could
begin.
3.4.2 Content Analysis
To obtain data on each post about the variables Relationship Phase and Content Type, each post
had to be assessed on its content. According to Riff, Lacey and Fico (2014), “Quantitative
content analysis is the systematic and replicable examination of symbols of communication,
which have been assigned numeric values according to valid measurement rules, and the
analysis of relationships involving those values in statistical methods, to describe the
communication, draw inferences about its meaning, or infer from the communication to its
context, both of production and consumption.”
Due to the manageable size of the sample of posts, the content of the LinkedIn post was
coded and analyzed on content type and then categorized in a relationship phase, both manually.
As the content of the post in the data file (Excel spreadsheet) only captured text and not
interactive content, the content analysis was done based on the online version of the posts, and
not just the text in the data file. To check whether the post was not altered in the time between

MASTER THESIS – MSc DIGITAL BUSINESS SOPHIE LOUISE KOOPMANS, 10556419
34
the data collection and the content analysis, the text of the post in the dataset and the text online
were compared. If the post was altered, the post was excluded from the dataset.
The data was collected in different formats for the purpose of data analysis. For the
business model variable, each company and corresponding posts received a categorical value
of 0 (B2B) or 1 (B2C). For the relationship phase variable, each post was assessed on each
category and received a 1 (Awareness), 2 (Acquisition) or 3 (Retention). For the content type
variable, each post was assessed on each type and received the corresponding number 1 to 12
(see Table 2). Engagement was measured as an interval variable, and the number of likes and
comments were recorded as the number displayed on the LinkedIn website.
3.5 Reliability
Before testing our hypotheses, the reliability of the acquired data was tested. The whole dataset
was coded by one researcher (also the author of this paper). To guarantee reliable results and
reduce the possibility of bias, one additional researcher was trained on the coding method and
was asked to code 50 random posts on content type and on relationship phase. According to
intercoder reliability research, the twice coded sample had to be at least 10% of the full sample
(±30 in this study) or 50 units (Lombard, Snyder-Duch, & Bracken, 2002). To assess intercoder
reliability, Krippendorff’s Alpha had to be at least 0.67 (De Swert, 2012; Krippendorff, 2004).
This reliability test was done to ensure that the coding of the main researcher isn’t biased and
the research can be replicated.
3.6 Data Analysis
The data was quantitatively analyzed in the IBM SPSS software program. To analyze
hypothesis 1, the relation between business model and customer engagement, an independent
t-test was conducted. The hypotheses 2a, 2b and 2c about the relation between business model
MASTER THESIS – MSc DIGITAL BUSINESS SOPHIE LOUISE KOOPMANS, 10556419
35
and content type were assessed by conducting a 2X12 Pearson’s chi-square test. However, when
the assumptions of the chi-square test were violated, the test would be replaced by a Fisher’s
exact test. This would be the case if counts were less than 5. After the 2X12 chi square, each
category would be analyzed separately with a 2X1 chi square test. Hypotheses 3a, b and c about
the relation between content type and customer engagement were tested with a one-way
independent ANOVA and a factorial ANOVA to add business model as a moderator.
Hypotheses 4a, b and c were analyzed with a 2X3 chi-square test to look for a statistical link
between business model and relationship phase and 2X1 chi square tests for individual
differences in business models. Hypothesis 5a about the association of relationship phase of
posts to the engagement was analyzed with a one-way independent ANOVA. Hypothesis 5b,
which studies the moderating effect of business model on the relation between relationship
phase and customer engagement, was assessed by conducting an independent factorial
ANOVA. Lastly, the influence of the business model on the relationship between content type
and relationship phase was analyzed by conducting loglinear analysis.
Furthermore, as content analysis is also seen as a qualitative research method (White &
Marsh, 2006), the quantitative results were complemented to offer additional insights with
qualitative results such as frequencies, means and proportions. This was especially relevant for
the descriptive statistical results of the chi-square tests. Descriptive statistics indicate an
association, but are not modeling techniques and can therefore not predict values of the outcome
variable. The reader should keep this in mind when interpreting the results.
4. Results
4.1 Reliability
Before starting statistical analyses, the reliability of the coding was assessed. The results of the
Krippendorff’s Alpha showed that intercoder reliability was moderate for the content type
MASTER THESIS – MSc DIGITAL BUSINESS SOPHIE LOUISE KOOPMANS, 10556419
36
coding (α = 0.72) and on the border of acceptable for relationship phase coding (α = 0.69). As
a reference, a Krippendorff’s Alpha of 0.67 is acceptable and 0.80 is high (Krippendorff, 2004).
Thus, the dataset was reliable enough to proceed with the analysis according to the standards
of Hayes and Krippendorff (2007).
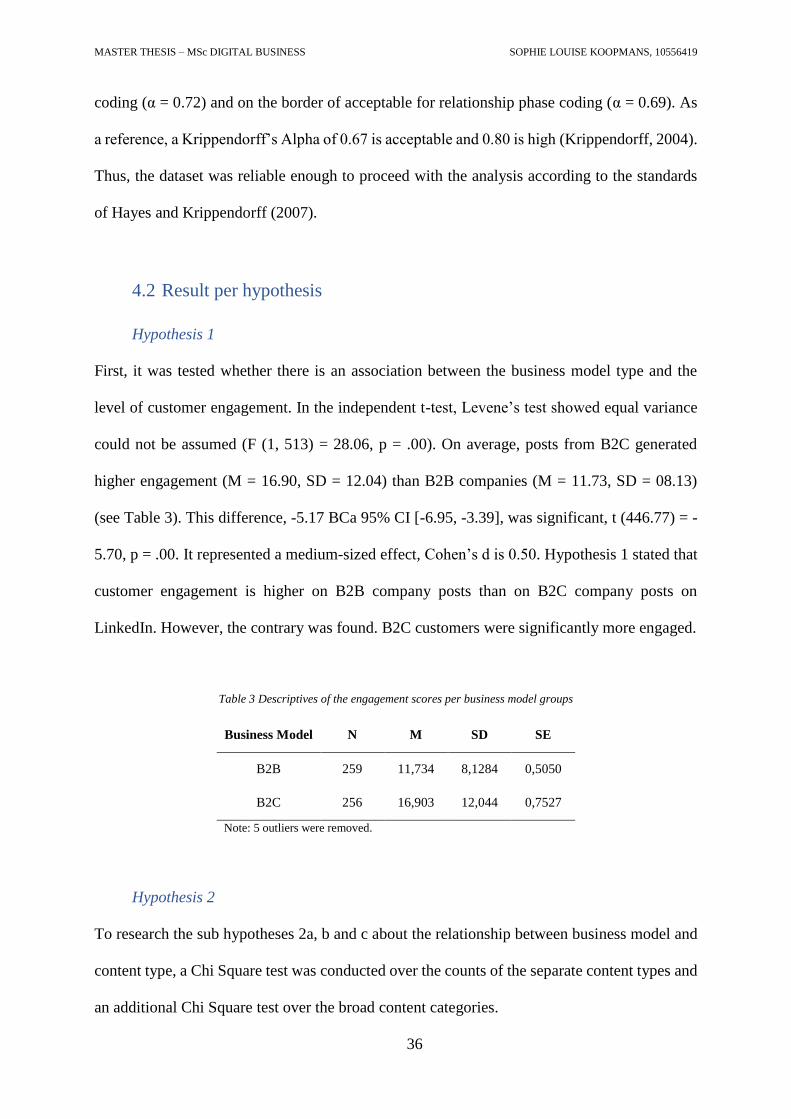
4.2 Result per hypothesis
Hypothesis 1
First, it was tested whether there is an association between the business model type and the
level of customer engagement. In the independent t-test, Levene’s test showed equal variance
could not be assumed (F (1, 513) = 28.06, p = .00). On average, posts from B2C generated
higher engagement (M = 16.90, SD = 12.04) than B2B companies (M = 11.73, SD = 08.13)
(see Table 3). This difference, -5.17 BCa 95% CI [-6.95, -3.39], was significant, t (446.77) = -
5.70, p = .00. It represented a medium-sized effect, Cohen’s d is 0.50. Hypothesis 1 stated that
customer engagement is higher on B2B company posts than on B2C company posts on
LinkedIn. However, the contrary was found. B2C customers were significantly more engaged.
Table 3 Descriptives of the engagement scores per business model groups
Business Model N M SD SE
B2B 259 11,734 8,1284 0,5050
B2C 256 16,903 12,044 0,7527
Note: 5 outliers were removed.
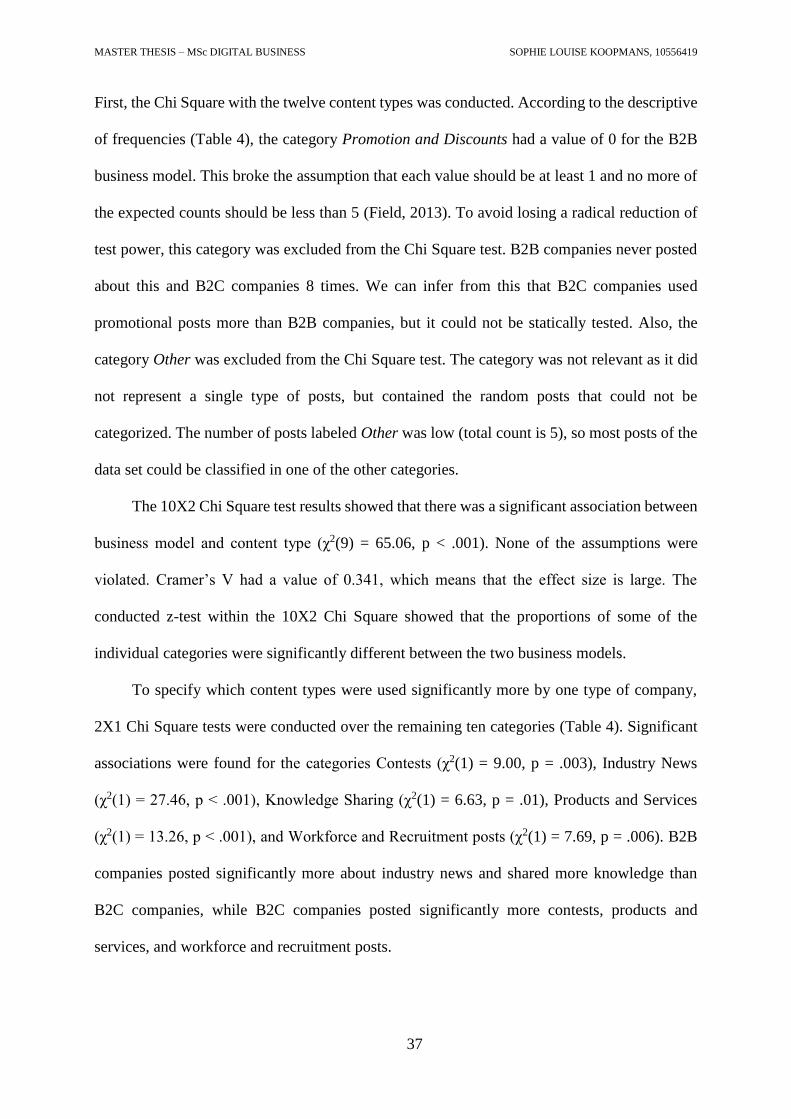
Hypothesis 2
To research the sub hypotheses 2a, b and c about the relationship between business model and
content type, a Chi Square test was conducted over the counts of the separate content types and
an additional Chi Square test over the broad content categories.
MASTER THESIS – MSc DIGITAL BUSINESS SOPHIE LOUISE KOOPMANS, 10556419
37
First, the Chi Square with the twelve content types was conducted. According to the descriptive
of frequencies (Table 4), the category Promotion and Discounts had a value of 0 for the B2B
business model. This broke the assumption that each value should be at least 1 and no more of
the expected counts should be less than 5 (Field, 2013). To avoid losing a radical reduction of
test power, this category was excluded from the Chi Square test. B2B companies never posted
about this and B2C companies 8 times. We can infer from this that B2C companies used
promotional posts more than B2B companies, but it could not be statically tested. Also, the
category Other was excluded from the Chi Square test. The category was not relevant as it did
not represent a single type of posts, but contained the random posts that could not be
categorized. The number of posts labeled Other was low (total count is 5), so most posts of the
data set could be classified in one of the other categories.
The 10X2 Chi Square test results showed that there was a significant association between
business model and content type (χ2(9) = 65.06, p < .001). None of the assumptions were
violated. Cramer’s V had a value of 0.341, which means that the effect size is large. The
conducted z-test within the 10X2 Chi Square showed that the proportions of some of the
individual categories were significantly different between the two business models.
To specify which content types were used significantly more by one type of company,
2X1 Chi Square tests were conducted over the remaining ten categories (Table 4). Significant
associations were found for the categories Contests (χ2(1) = 9.00, p = .003), Industry News
(χ2(1) = 27.46, p < .001), Knowledge Sharing (χ2(1) = 6.63, p = .01), Products and Services
(χ2(1) = 13.26, p < .001), and Workforce and Recruitment posts (χ2(1) = 7.69, p = .006). B2B
companies posted significantly more about industry news and shared more knowledge than
B2C companies, while B2C companies posted significantly more contests, products and
services, and workforce and recruitment posts.
MASTER THESIS – MSc DIGITAL BUSINESS SOPHIE LOUISE KOOPMANS, 10556419
38
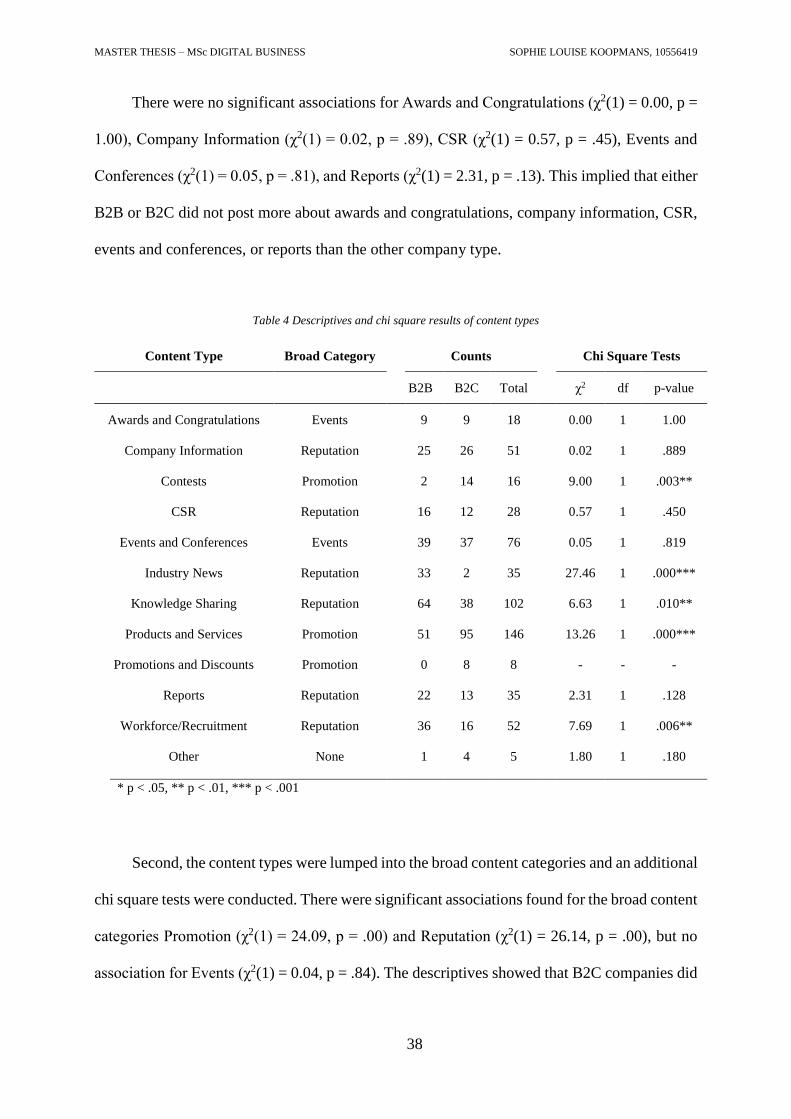
There were no significant associations for Awards and Congratulations (χ2(1) = 0.00, p =
1.00), Company Information (χ2(1) = 0.02, p = .89), CSR (χ2(1) = 0.57, p = .45), Events and
Conferences (χ2(1) = 0.05, p = .81), and Reports (χ2(1) = 2.31, p = .13). This implied that either
B2B or B2C did not post more about awards and congratulations, company information, CSR,
events and conferences, or reports than the other company type.
Table 4 Descriptives and chi square results of content types
Content Type Broad Category Counts
Chi Square Tests
B2B B2C Total χ2 df p-value
Awards and Congratulations Events 9 9 18
0.00 1 1.00
Company Information Reputation 25 26 51
0.02 1 .889
Contests Promotion 2 14 16
9.00 1 .003**
CSR Reputation 16 12 28
0.57 1 .450
Events and Conferences Events 39 37 76
0.05 1 .819
Industry News Reputation 33 2 35
27.46 1 .000***
Knowledge Sharing Reputation 64 38 102
6.63 1 .010**
Products and Services Promotion 51 95 146
13.26 1 .000***
Promotions and Discounts Promotion 0 8 8
- - -
Reports Reputation 22 13 35
2.31 1 .128
Workforce/Recruitment Reputation 36 16 52
7.69 1 .006**
Other None 1 4 5
1.80 1 .180
* p < .05, ** p < .01, *** p < .001
Second, the content types were lumped into the broad content categories and an additional
chi square tests were conducted. There were significant associations found for the broad content
categories Promotion (χ2(1) = 24.09, p = .00) and Reputation (χ2(1) = 26.14, p = .00), but no
association for Events (χ2(1) = 0.04, p = .84). The descriptives showed that B2C companies did
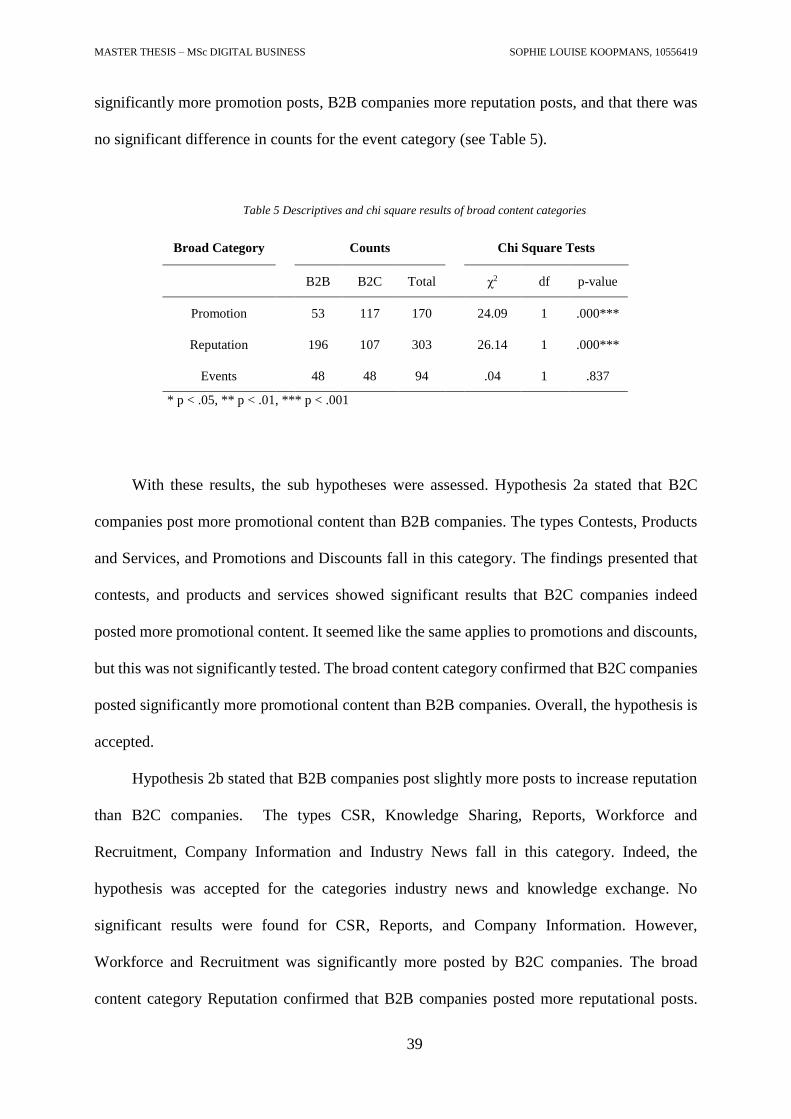
MASTER THESIS – MSc DIGITAL BUSINESS SOPHIE LOUISE KOOPMANS, 10556419
39
significantly more promotion posts, B2B companies more reputation posts, and that there was
no significant difference in counts for the event category (see Table 5).
Table 5 Descriptives and chi square results of broad content categories
Broad Category Counts
Chi Square Tests
B2B B2C Total
χ2 df p-value
Promotion 53 117 170
24.09 1 .000***
Reputation 196 107 303
26.14 1 .000***
Events
48 48 94
.04 1 .837
* p < .05, ** p < .01, *** p < .001
With these results, the sub hypotheses were assessed. Hypothesis 2a stated that B2C
companies post more promotional content than B2B companies. The types Contests, Products
and Services, and Promotions and Discounts fall in this category. The findings presented that
contests, and products and services showed significant results that B2C companies indeed
posted more promotional content. It seemed like the same applies to promotions and discounts,
but this was not significantly tested. The broad content category confirmed that B2C companies
posted significantly more promotional content than B2B companies. Overall, the hypothesis is
accepted.
Hypothesis 2b stated that B2B companies post slightly more posts to increase reputation
than B2C companies. The types CSR, Knowledge Sharing, Reports, Workforce and
Recruitment, Company Information and Industry News fall in this category. Indeed, the
hypothesis was accepted for the categories industry news and knowledge exchange. No
significant results were found for CSR, Reports, and Company Information. However,
Workforce and Recruitment was significantly more posted by B2C companies. The broad
content category Reputation confirmed that B2B companies posted more reputational posts.
MASTER THESIS – MSc DIGITAL BUSINESS SOPHIE LOUISE KOOPMANS, 10556419
40
Given that the hypothesis mentioned that B2B’s post slightly more than B2C, this hypothesis is
accepted, keeping in mind that this did not account for Workforce and Recruitment.
Hypothesis 2c stated that B2B companies post significantly more event-related content
than B2C companies. The types Events and Conferences, and Awards and Congratulations fall
in this category. However, the results showed no significant results for these two content types.
Neither did the broad content category Events. Therefore, the hypothesis is rejected.
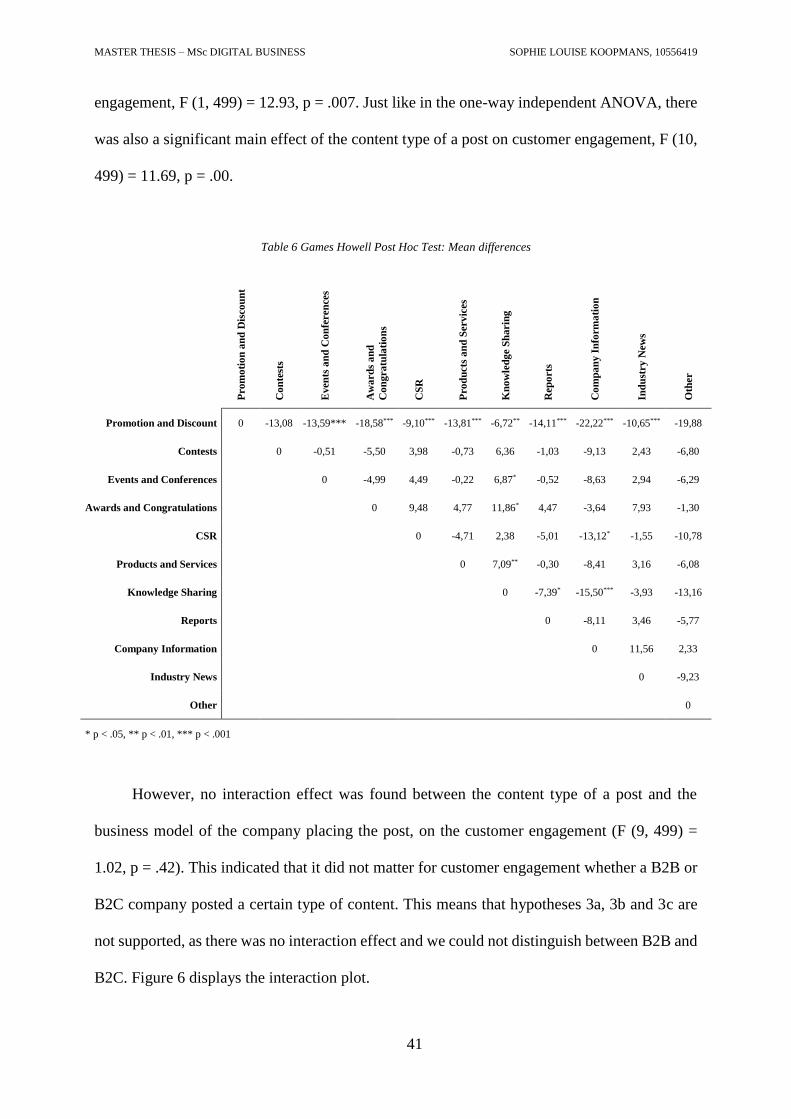
Hypothesis 3
To test the sub hypotheses of hypothesis 3, whether there is a relationship between content types
and customer engagement and a possible moderating effect of business models, a factorial
ANOVA was conducted. However, Levene’s test showed a significant result (p = 0.004), so the
assumption of homogeneity of variance was violated. Therefore, first a one-way independent
ANOVA was conducted with a Welch test to look at the relation between content type and
customer engagement. The results (Welch’s F (10, 72.5) = 26.68, p < .001) showed there were
significant differences in customer engagement between the content types. The Games-Howell
Post Hoc test exposed that some categories generated either significantly higher or lower
engagement than other types of posts. See Table 6 for the results over all categories. The most
notable results were that the content category promotions and discounts generated to lowest
engagement, and knowledge sharing posts didn’t perform very well either. Posts with company
information performed the best.
To find out whether there is an interaction effect between the business model and content
types, a two-way independent ANOVA was conducted. To account for the violated
homogeneity of variance, the data of the dependent variable data had to be transformed by
taking the square root of the engagement score to meet the homogeneity of error variance
assumption. After this, the result of Levene’s test was that homogeneity of error variance could
be assumed (p = .46). There was a significant main effect of the business model on customer
MASTER THESIS – MSc DIGITAL BUSINESS SOPHIE LOUISE KOOPMANS, 10556419
41
engagement, F (1, 499) = 12.93, p = .007. Just like in the one-way independent ANOVA, there
was also a significant main effect of the content type of a post on customer engagement, F (10,
499) = 11.69, p = .00.
Table 6 Games Howell Post Hoc Test: Mean differences
Prom
oti
on
an
d D
isco
un
t
Co
nte
sts
Even
ts a
nd
Co
nfe
ren
ces
Aw
ard
s a
nd
Co
ngra
tula
tio
ns
CS
R
Pro
du
cts
an
d S
erv
ices
Kn
ow
led
ge
Sh
arin
g
Rep
orts
Co
mp
an
y I
nfo
rma
tio
n
Ind
ust
ry
New
s
Oth
er
Promotion and Discount 0 -13,08 -13,59*** -18,58*** -9,10*** -13,81*** -6,72** -14,11*** -22,22*** -10,65*** -19,88
Contests
0 -0,51 -5,50 3,98 -0,73 6,36 -1,03 -9,13 2,43 -6,80
Events and Conferences
0 -4,99 4,49 -0,22 6,87* -0,52 -8,63 2,94 -6,29
Awards and Congratulations
0 9,48 4,77 11,86* 4,47 -3,64 7,93 -1,30
CSR
0 -4,71 2,38 -5,01 -13,12* -1,55 -10,78
Products and Services
0 7,09** -0,30 -8,41 3,16 -6,08
Knowledge Sharing
0 -7,39* -15,50*** -3,93 -13,16
Reports
0 -8,11 3,46 -5,77
Company Information
0 11,56 2,33
Industry News
0 -9,23
Other
0
* p < .05, ** p < .01, *** p < .001
However, no interaction effect was found between the content type of a post and the
business model of the company placing the post, on the customer engagement (F (9, 499) =
1.02, p = .42). This indicated that it did not matter for customer engagement whether a B2B or
B2C company posted a certain type of content. This means that hypotheses 3a, 3b and 3c are
not supported, as there was no interaction effect and we could not distinguish between B2B and
B2C. Figure 6 displays the interaction plot.
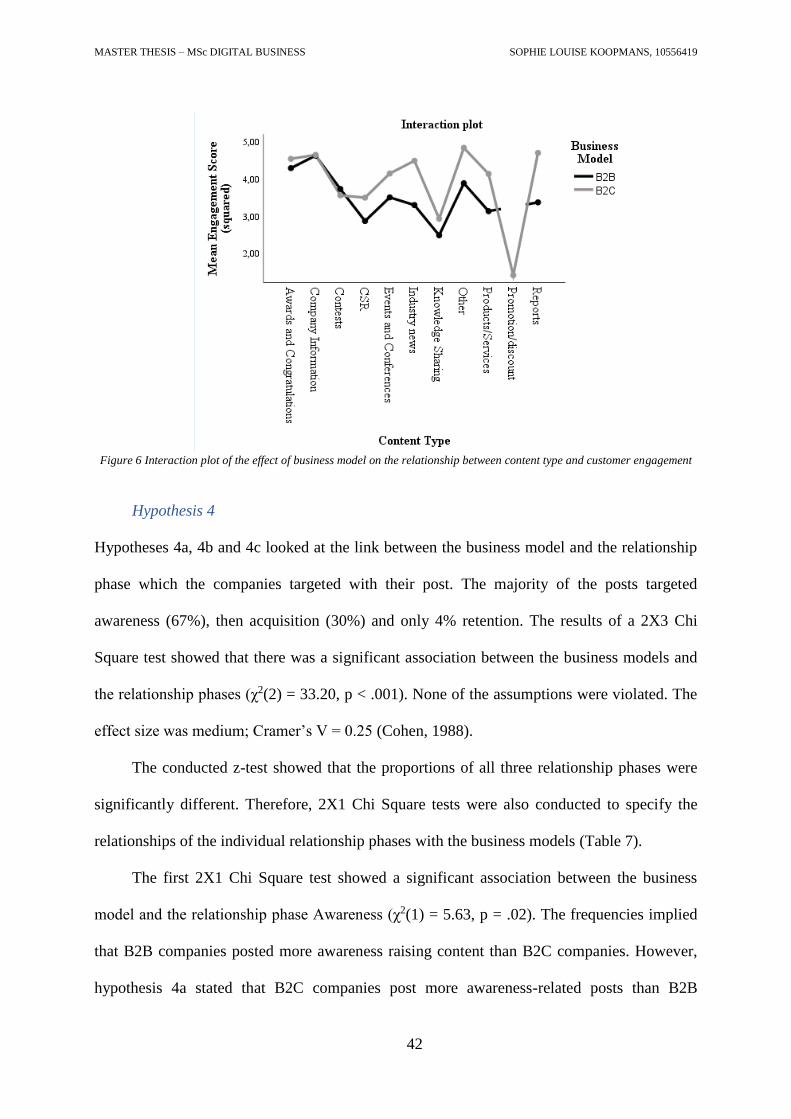
MASTER THESIS – MSc DIGITAL BUSINESS SOPHIE LOUISE KOOPMANS, 10556419
42
Figure 6 Interaction plot of the effect of business model on the relationship between content type and customer engagement
Hypothesis 4
Hypotheses 4a, 4b and 4c looked at the link between the business model and the relationship
phase which the companies targeted with their post. The majority of the posts targeted
awareness (67%), then acquisition (30%) and only 4% retention. The results of a 2X3 Chi
Square test showed that there was a significant association between the business models and
the relationship phases (χ2(2) = 33.20, p < .001). None of the assumptions were violated. The
effect size was medium; Cramer’s V = 0.25 (Cohen, 1988).
The conducted z-test showed that the proportions of all three relationship phases were
significantly different. Therefore, 2X1 Chi Square tests were also conducted to specify the
relationships of the individual relationship phases with the business models (Table 7).
The first 2X1 Chi Square test showed a significant association between the business
model and the relationship phase Awareness (χ2(1) = 5.63, p = .02). The frequencies implied
that B2B companies posted more awareness raising content than B2C companies. However,
hypothesis 4a stated that B2C companies post more awareness-related posts than B2B
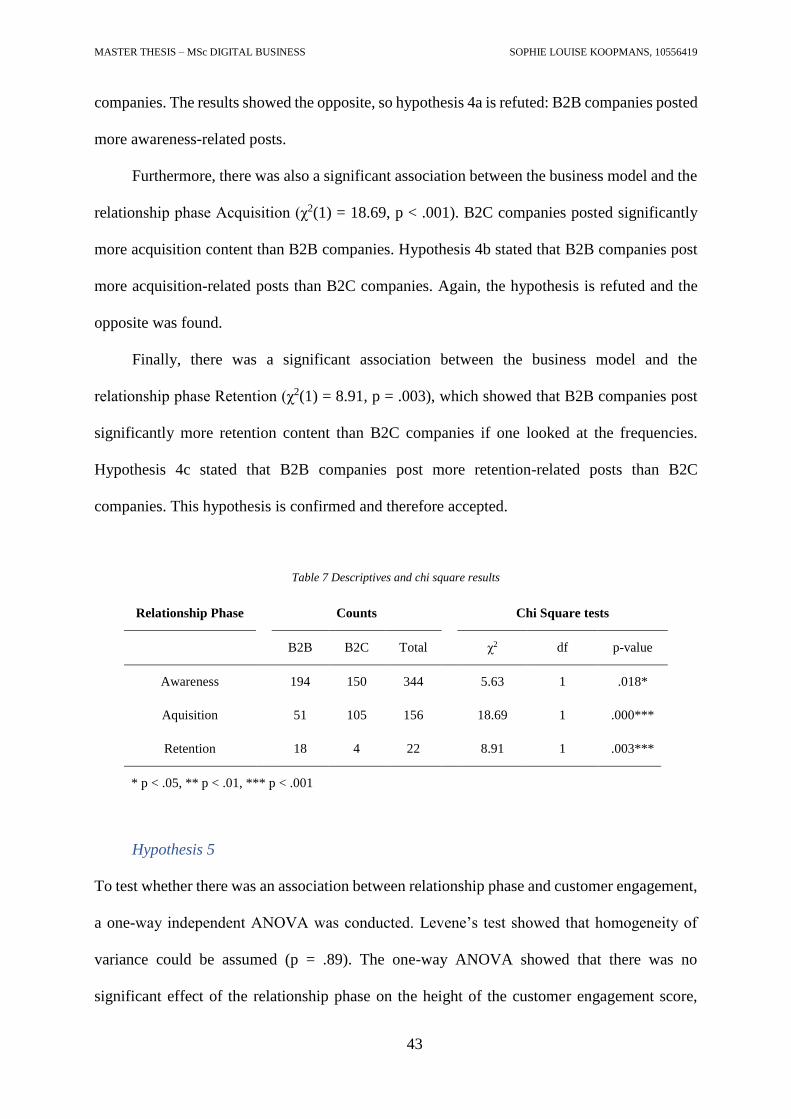
MASTER THESIS – MSc DIGITAL BUSINESS SOPHIE LOUISE KOOPMANS, 10556419
43
companies. The results showed the opposite, so hypothesis 4a is refuted: B2B companies posted
more awareness-related posts.
Furthermore, there was also a significant association between the business model and the
relationship phase Acquisition (χ2(1) = 18.69, p < .001). B2C companies posted significantly
more acquisition content than B2B companies. Hypothesis 4b stated that B2B companies post
more acquisition-related posts than B2C companies. Again, the hypothesis is refuted and the
opposite was found.
Finally, there was a significant association between the business model and the
relationship phase Retention (χ2(1) = 8.91, p = .003), which showed that B2B companies post
significantly more retention content than B2C companies if one looked at the frequencies.
Hypothesis 4c stated that B2B companies post more retention-related posts than B2C
companies. This hypothesis is confirmed and therefore accepted.
Table 7 Descriptives and chi square results
Relationship Phase Counts
Chi Square tests
B2B B2C Total
χ2 df p-value
Awareness 194 150 344
5.63 1 .018*
Aquisition 51 105 156
18.69 1 .000***
Retention 18 4 22
8.91 1 .003***
* p < .05, ** p < .01, *** p < .001
Hypothesis 5
To test whether there was an association between relationship phase and customer engagement,
a one-way independent ANOVA was conducted. Levene’s test showed that homogeneity of
variance could be assumed (p = .89). The one-way ANOVA showed that there was no
significant effect of the relationship phase on the height of the customer engagement score,

MASTER THESIS – MSc DIGITAL BUSINESS SOPHIE LOUISE KOOPMANS, 10556419
44
F (2, 519) = 0.40, p = .67. Also, Hochberg’s GT2 post hoc test did not show any significant
results (Table 8). This indicated that there was no association between the relationship phase of
a post and customer engagement. Hypothesis 5a stated that acquisition and retention content
generates higher customer engagement than awareness content, which is not statically
significant and therefore the hypothesis is rejected.
Table 8 Hochberg's GT2 Post Hoc test results
Relationship Phase
Awareness Acquisition Retention
Awareness 0 -0,52045 2,23205
Acquisition
0 2,75250
Retention
0
* p < .05, ** p < .01, *** p < .001
To study hypothesis 5b, the moderating effect of business models, an additional two-way
independent ANOVA was conducted. To comply with the assumptions of this test, the data of
the dependent variable data again had to be transformed by taking the square root of the
engagement score to meet the homogeneity of error variance assumption. After this, the result
of Levene’s test was that homogeneity of error variance could be assumed (p = .13). For the
descriptives, see Appendix 8.2 Table 18. The statistical results showed there was no significant
main effect of the relationship phase of the customer that the company targeted with the post
on customer engagement, F (2, 516) = 1.04, p = .35. This was in accordance with the results of
hypothesis 5a. The two-way ANOVA also did not find a significant main effect for the business
models on customer engagement (F (1, 515) = 3.34, p = .07), but it was close to the alpha value
of .05 to be significant (Table 9). Furthermore, there was also no interaction effect between the
relationship phase and the business model type on the height of the customer engagement score,
F (2, 516) = 2.49, p = .08. This indicated that the variables relationship phase and business
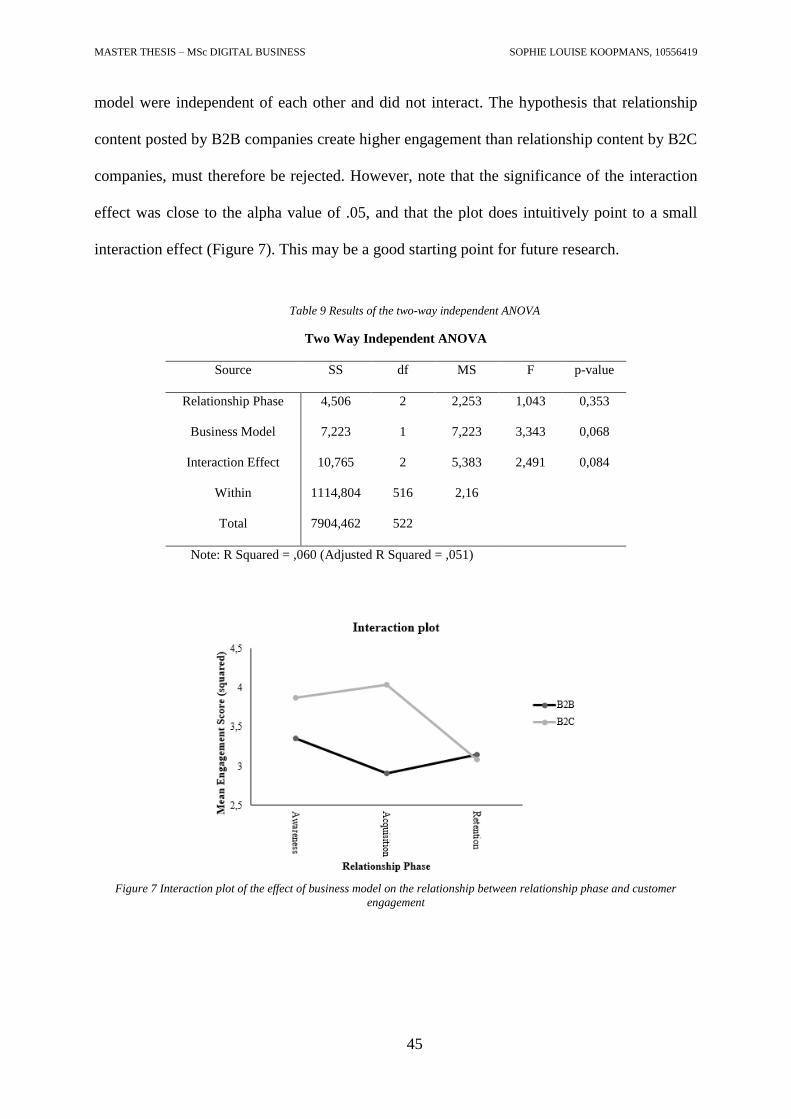
MASTER THESIS – MSc DIGITAL BUSINESS SOPHIE LOUISE KOOPMANS, 10556419
45
model were independent of each other and did not interact. The hypothesis that relationship
content posted by B2B companies create higher engagement than relationship content by B2C
companies, must therefore be rejected. However, note that the significance of the interaction
effect was close to the alpha value of .05, and that the plot does intuitively point to a small
interaction effect (Figure 7). This may be a good starting point for future research.
Table 9 Results of the two-way independent ANOVA
Two Way Independent ANOVA
Source SS df MS F p-value
Relationship Phase 4,506 2 2,253 1,043 0,353
Business Model 7,223 1 7,223 3,343 0,068
Interaction Effect 10,765 2 5,383 2,491 0,084
Within 1114,804 516 2,16
Total 7904,462 522
Note: R Squared = ,060 (Adjusted R Squared = ,051)
Figure 7 Interaction plot of the effect of business model on the relationship between relationship phase and customer
engagement
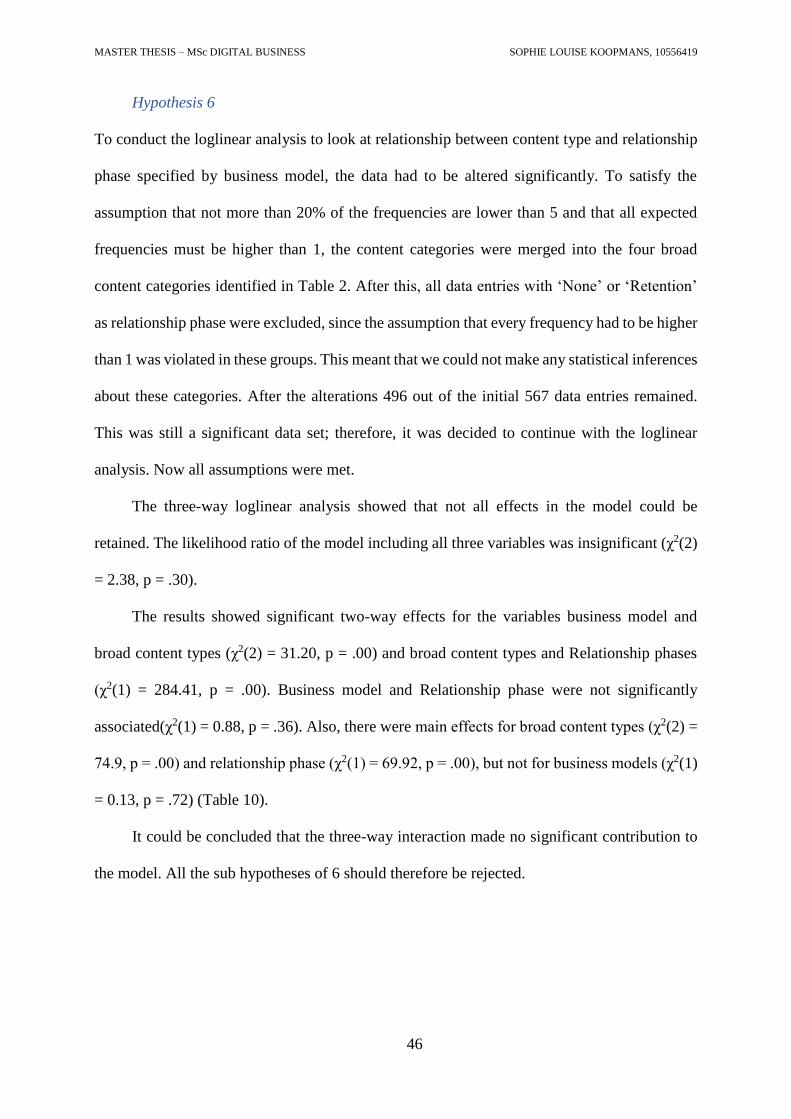
MASTER THESIS – MSc DIGITAL BUSINESS SOPHIE LOUISE KOOPMANS, 10556419
46
Hypothesis 6
To conduct the loglinear analysis to look at relationship between content type and relationship
phase specified by business model, the data had to be altered significantly. To satisfy the
assumption that not more than 20% of the frequencies are lower than 5 and that all expected
frequencies must be higher than 1, the content categories were merged into the four broad
content categories identified in Table 2. After this, all data entries with ‘None’ or ‘Retention’
as relationship phase were excluded, since the assumption that every frequency had to be higher
than 1 was violated in these groups. This meant that we could not make any statistical inferences
about these categories. After the alterations 496 out of the initial 567 data entries remained.
This was still a significant data set; therefore, it was decided to continue with the loglinear
analysis. Now all assumptions were met.
The three-way loglinear analysis showed that not all effects in the model could be
retained. The likelihood ratio of the model including all three variables was insignificant (χ2(2)
= 2.38, p = .30).
The results showed significant two-way effects for the variables business model and
broad content types (χ2(2) = 31.20, p = .00) and broad content types and Relationship phases
(χ2(1) = 284.41, p = .00). Business model and Relationship phase were not significantly
associated(χ2(1) = 0.88, p = .36). Also, there were main effects for broad content types (χ2(2) =
74.9, p = .00) and relationship phase (χ2(1) = 69.92, p = .00), but not for business models (χ2(1)
= 0.13, p = .72) (Table 10).
It could be concluded that the three-way interaction made no significant contribution to
the model. All the sub hypotheses of 6 should therefore be rejected.
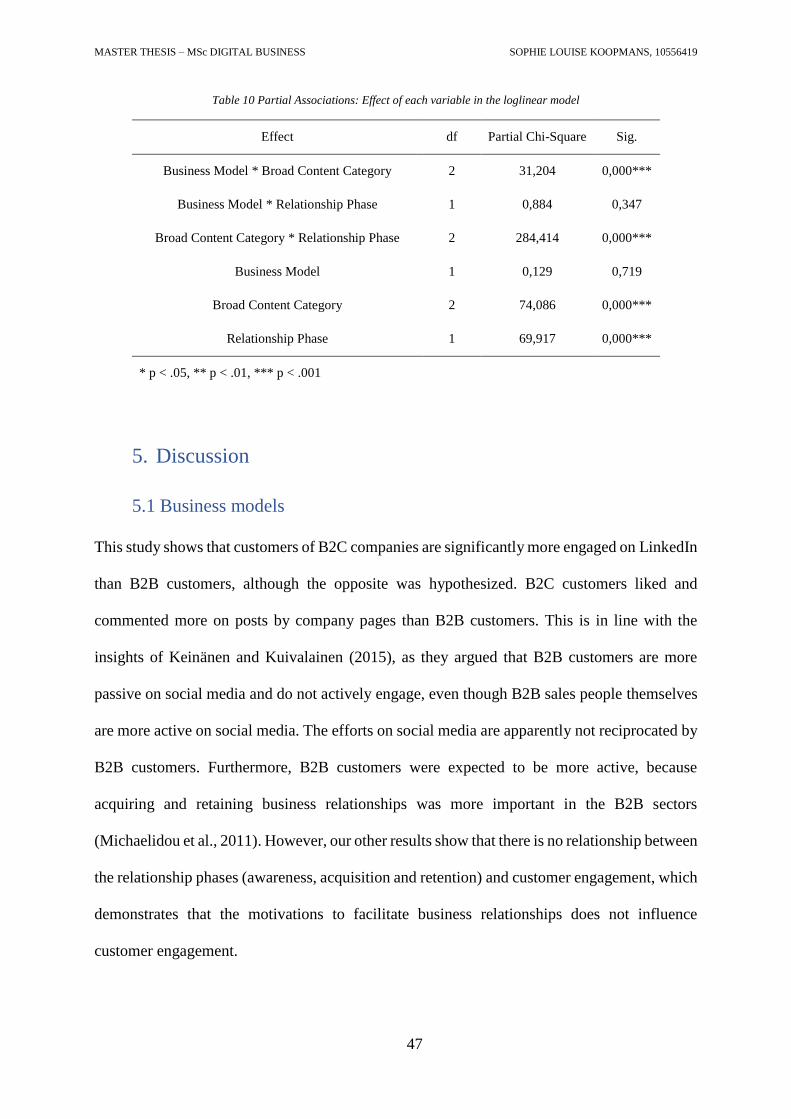
MASTER THESIS – MSc DIGITAL BUSINESS SOPHIE LOUISE KOOPMANS, 10556419
47
Table 10 Partial Associations: Effect of each variable in the loglinear model
Effect df Partial Chi-Square Sig.
Business Model * Broad Content Category 2 31,204 0,000***
Business Model * Relationship Phase 1 0,884 0,347
Broad Content Category * Relationship Phase 2 284,414 0,000***
Business Model 1 0,129 0,719
Broad Content Category 2 74,086 0,000***
Relationship Phase 1 69,917 0,000***
* p < .05, ** p < .01, *** p < .001
5. Discussion
5.1 Business models
This study shows that customers of B2C companies are significantly more engaged on LinkedIn
than B2B customers, although the opposite was hypothesized. B2C customers liked and
commented more on posts by company pages than B2B customers. This is in line with the
insights of Keinänen and Kuivalainen (2015), as they argued that B2B customers are more
passive on social media and do not actively engage, even though B2B sales people themselves
are more active on social media. The efforts on social media are apparently not reciprocated by
B2B customers. Furthermore, B2B customers were expected to be more active, because
acquiring and retaining business relationships was more important in the B2B sectors
(Michaelidou et al., 2011). However, our other results show that there is no relationship between
the relationship phases (awareness, acquisition and retention) and customer engagement, which
demonstrates that the motivations to facilitate business relationships does not influence
customer engagement.
MASTER THESIS – MSc DIGITAL BUSINESS SOPHIE LOUISE KOOPMANS, 10556419
48
5.2 Content types
As the content types of LinkedIn posts were analyzed, the results showed that the types of
content posted by the two company types differs. Of the identified twelve content types on
LinkedIn, five types differ significantly between B2B and B2C. B2B companies posted
significantly more about industry news and shared more knowledge than B2C companies, while
B2C companies post significantly more contests, products and services, and workforce and
recruitment posts. The frequencies of the other seven types (awards and congratulations,
company information, CSR, events and conferences, reports, promotions and discounts, and
other) do not significantly differ between B2B and B2C.
The content types were divided in three broader content categories: promotion, reputation
and events. Overall, it was found that B2B companies aim to increase their reputation more
than B2C’s, which supports the findings of Walsh et al. (2015) stated in the theoretical
framework that reputation is more important for B2B companies. Furthermore, B2C companies
promote their products and services more. Events were not significantly used by one party more
than the other. Although from the latter broad category it was expected that B2B would post
more about events, there was no difference between the two business models. What did stand
out about event posts during the content coding, was that B2C companies sponsored many
events which they could use for marketing purposes. B2B companies were more active at sales
events, like conferences, at which they were physically present.
The top 3 most used content types for B2B in this study were knowledge sharing (21%),
products and services (17%) and events and conferences (13%). The top 3 for B2C companies
are products and services (35%), knowledge sharing (14%) and events and conferences (35%)
(see Table 20 in Appendix 8.4 for the top 10). Yet, what stands out is the differences in counts
between the twelve categories. By far, the most popular content types were products and
services (count: 146) and knowledge sharing (count: 102) (out of the 572 posts, see Table 17 in
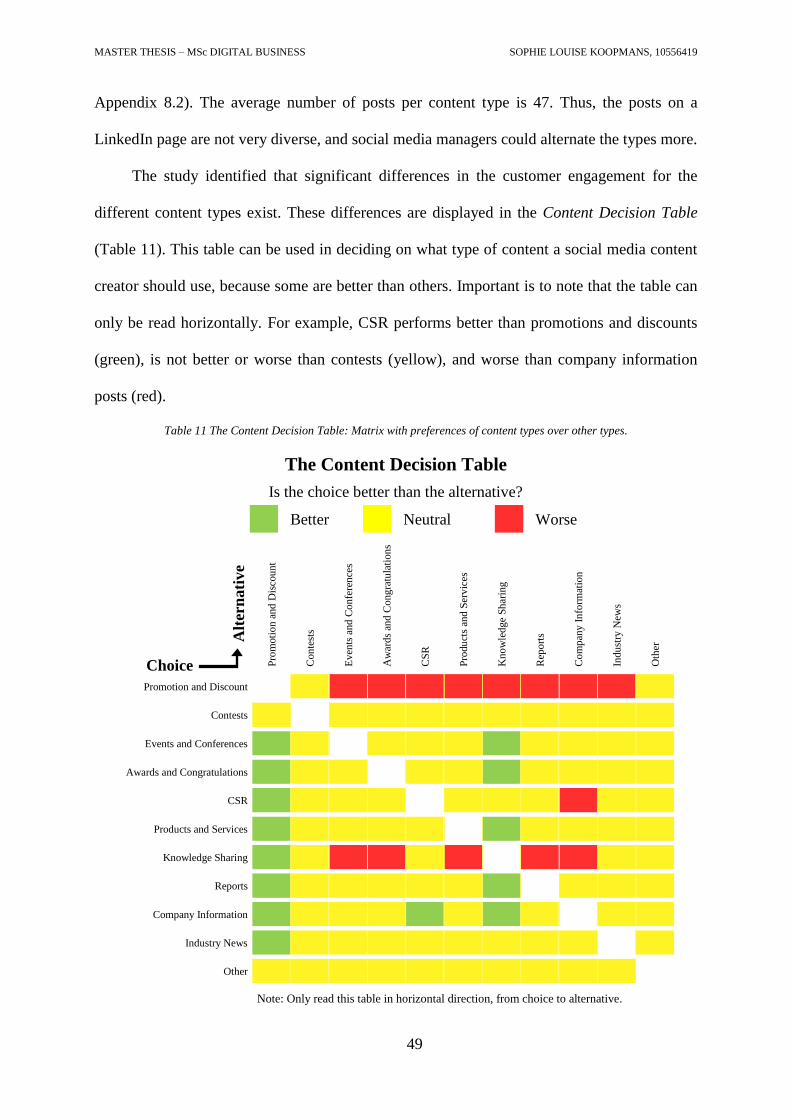
MASTER THESIS – MSc DIGITAL BUSINESS SOPHIE LOUISE KOOPMANS, 10556419
49
Appendix 8.2). The average number of posts per content type is 47. Thus, the posts on a
LinkedIn page are not very diverse, and social media managers could alternate the types more.
The study identified that significant differences in the customer engagement for the
different content types exist. These differences are displayed in the Content Decision Table
(Table 11). This table can be used in deciding on what type of content a social media content
creator should use, because some are better than others. Important is to note that the table can
only be read horizontally. For example, CSR performs better than promotions and discounts
(green), is not better or worse than contests (yellow), and worse than company information
posts (red).
Table 11 The Content Decision Table: Matrix with preferences of content types over other types.
The Content Decision Table
Is the choice better than the alternative?
Better Neutral Worse
Choice
Alt
ern
ati
ve
Pro
moti
on a
nd
Dis
coun
t
Con
test
s
Ev
ents
and
Con
fere
nce
s
Aw
ard
s an
d C
ong
ratu
lati
on
s
Co
mp
any
In
form
atio
n
Indu
stry
New
s
Oth
er
CS
R
Pro
du
cts
and
Ser
vic
es
Kn
ow
led
ge
Sh
arin
g
Rep
ort
s
Promotion and Discount
Contests
Events and Conferences
Awards and Congratulations
CSR
Products and Services
Knowledge Sharing
Reports
Company Information
Industry News
Other Note: Only read this table in horizontal direction, from choice to alternative.
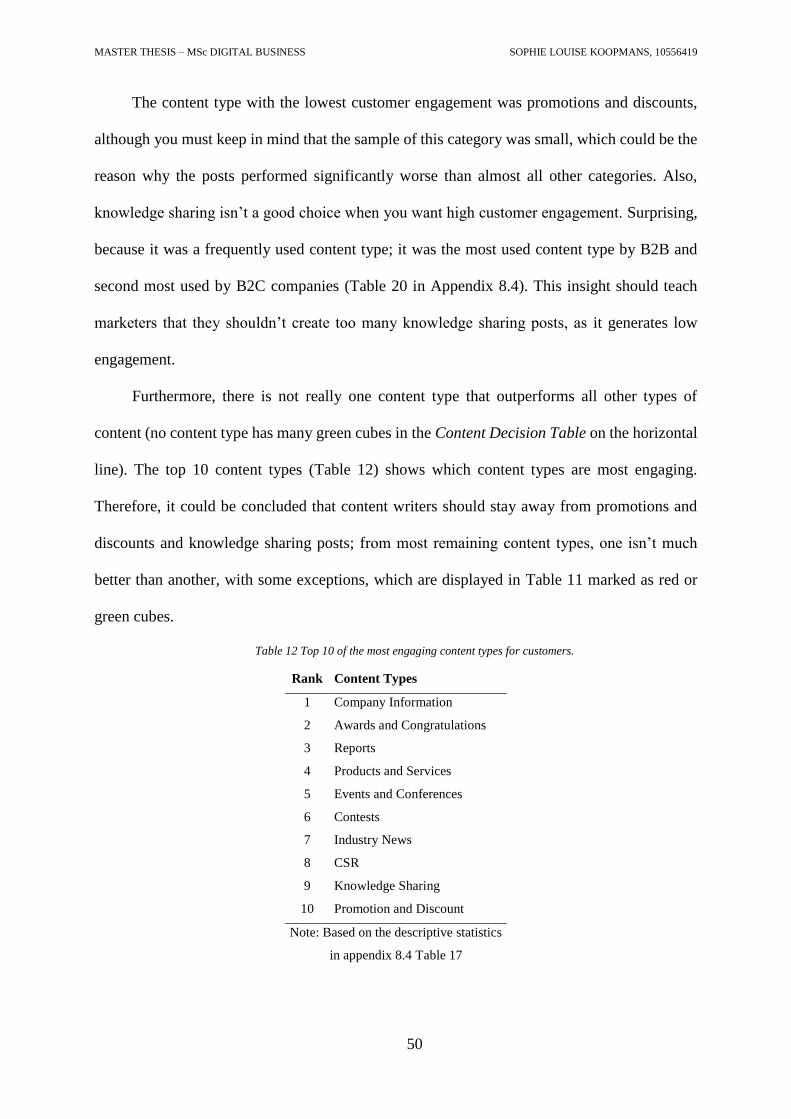
MASTER THESIS – MSc DIGITAL BUSINESS SOPHIE LOUISE KOOPMANS, 10556419
50
The content type with the lowest customer engagement was promotions and discounts,
although you must keep in mind that the sample of this category was small, which could be the
reason why the posts performed significantly worse than almost all other categories. Also,
knowledge sharing isn’t a good choice when you want high customer engagement. Surprising,
because it was a frequently used content type; it was the most used content type by B2B and
second most used by B2C companies (Table 20 in Appendix 8.4). This insight should teach
marketers that they shouldn’t create too many knowledge sharing posts, as it generates low
engagement.
Furthermore, there is not really one content type that outperforms all other types of
content (no content type has many green cubes in the Content Decision Table on the horizontal
line). The top 10 content types (Table 12) shows which content types are most engaging.
Therefore, it could be concluded that content writers should stay away from promotions and
discounts and knowledge sharing posts; from most remaining content types, one isn’t much
better than another, with some exceptions, which are displayed in Table 11 marked as red or
green cubes.
Table 12 Top 10 of the most engaging content types for customers.
Rank Content Types
1 Company Information
2 Awards and Congratulations
3 Reports
4 Products and Services
5 Events and Conferences
6 Contests
7 Industry News
8 CSR
9 Knowledge Sharing
10 Promotion and Discount
Note: Based on the descriptive statistics
in appendix 8.4 Table 17
MASTER THESIS – MSc DIGITAL BUSINESS SOPHIE LOUISE KOOPMANS, 10556419
51
Furthermore, there was no interaction effect of business models on the relationship
between content type and customer engagement. This means that we cannot, for example, say
that a company information post creates higher customer engagement than a CSR post for B2B
companies, but not for B2C companies. Therefore, the Content Decision Table and the top 10
content types for customer engagement are the same for both business models. Apparently, the
preferences for content types do not significantly differ between B2B and B2C customers.
5.3 Relationship Phases
We also looked at which part of the simplified customer journey (relationship phases) posts
targeted. The study shows that the use of relationship phases differs between the two business
models.
Although the opposite was hypothesized based on the literature of Michaelidou et al.
(2011), B2B companies post more awareness-related posts than B2C companies, and B2C
companies more acquisition-related posts. Although the objective for using social media by
B2C companies is raising awareness and by B2B companies is more acquisition-related
(Michaelidou et al., 2011), the actual use of content types and the objectives are surprisingly
not aligned. It could be the case that LinkedIn company pages covers only a small part of the
LinkedIn strategies, followed up by other actions on LinkedIn to reach the objective. For
instance, the objective of a B2B company is to acquire new customers. The company page is
utilized to ‘plant a seed’ in the potential customer’s mind by using awareness posts, after which
social media marketers follow up on the engaged potential customers who liked a certain post,
by sending them a direct message. The objective of using LinkedIn is still to acquire customers,
though the company page is not used for this. The posts in the company page have a more
supporting role in the social media strategy. Also, using multiple channels, including digital
and traditional, to reach and communicate with customers is the most profitable strategy.
MASTER THESIS – MSc DIGITAL BUSINESS SOPHIE LOUISE KOOPMANS, 10556419
52
Multichannel customers have higher rates of profitability, consistently across industries and
geographies (Honts, Klimek, & Meyer, 2016). LinkedIn is definitely not the only marketing
and sales channel, and may be just a part of an extensive social media marketing strategy.
Furthermore, it may be more difficult for B2B companies to create acquisition related
posts than for B2C’s. The products and services of B2B companies are more often customized
for customers, while the products and services of B2C companies are more standard and high
volume. That makes it easier to create an acquisition post for a product or service, because they
can be very specific in details about the product and the deal. This may explain part of the
unexpected result that B2B companies post less acquisition posts than B2C companies.
For retention-related posts our expectation was confirmed; B2B companies have more
posts in the category. However, the number of retention posts was very small in the sample.
Moreover, it was expected that the relationship phases acquisition and retention generated
higher customer engagement than awareness posts, but we couldn’t find any significant
differences. There is no relation between the relationship phase of a post and the customer
engagement. This indicates that a customer is not more or less engaged with a certain
relationship type of a post than another.
There is also no interaction effect found of business model on the relationship between
relationship phase and customer engagement. However, the interaction effect (p = .084) was
close to being significant, and the interaction plot (Figure 7) showed some interaction. It is very
interesting though, because there is no main effect from the relationship phase on customer
engagement. However, this could also be due to the small sample size of retention posts.
5.4 Missing three-way effect
The results showed there is no significant effect between the business model, content types and
relationship phases. This means there is no three-way relationship, it is not possible to predict,
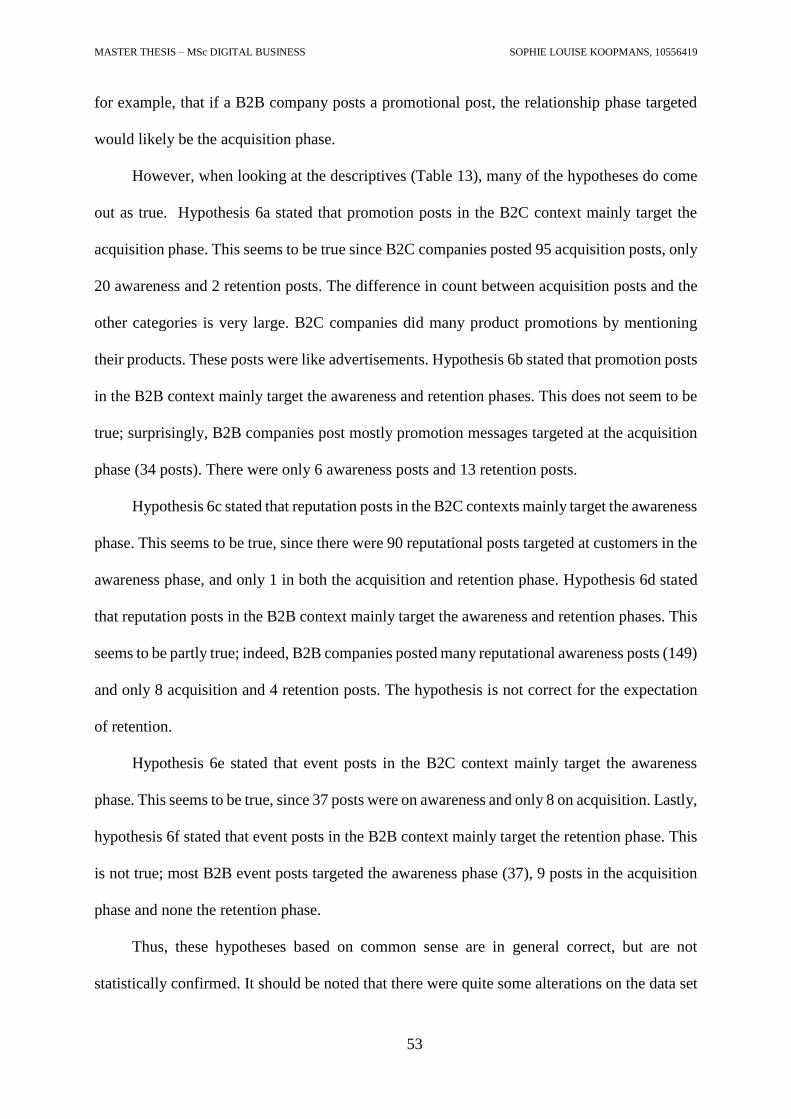
MASTER THESIS – MSc DIGITAL BUSINESS SOPHIE LOUISE KOOPMANS, 10556419
53
for example, that if a B2B company posts a promotional post, the relationship phase targeted
would likely be the acquisition phase.
However, when looking at the descriptives (Table 13), many of the hypotheses do come
out as true. Hypothesis 6a stated that promotion posts in the B2C context mainly target the
acquisition phase. This seems to be true since B2C companies posted 95 acquisition posts, only
20 awareness and 2 retention posts. The difference in count between acquisition posts and the
other categories is very large. B2C companies did many product promotions by mentioning
their products. These posts were like advertisements. Hypothesis 6b stated that promotion posts
in the B2B context mainly target the awareness and retention phases. This does not seem to be
true; surprisingly, B2B companies post mostly promotion messages targeted at the acquisition
phase (34 posts). There were only 6 awareness posts and 13 retention posts.
Hypothesis 6c stated that reputation posts in the B2C contexts mainly target the awareness
phase. This seems to be true, since there were 90 reputational posts targeted at customers in the
awareness phase, and only 1 in both the acquisition and retention phase. Hypothesis 6d stated
that reputation posts in the B2B context mainly target the awareness and retention phases. This
seems to be partly true; indeed, B2B companies posted many reputational awareness posts (149)
and only 8 acquisition and 4 retention posts. The hypothesis is not correct for the expectation
of retention.
Hypothesis 6e stated that event posts in the B2C context mainly target the awareness
phase. This seems to be true, since 37 posts were on awareness and only 8 on acquisition. Lastly,
hypothesis 6f stated that event posts in the B2B context mainly target the retention phase. This
is not true; most B2B event posts targeted the awareness phase (37), 9 posts in the acquisition
phase and none the retention phase.
Thus, these hypotheses based on common sense are in general correct, but are not
statistically confirmed. It should be noted that there were quite some alterations on the data set
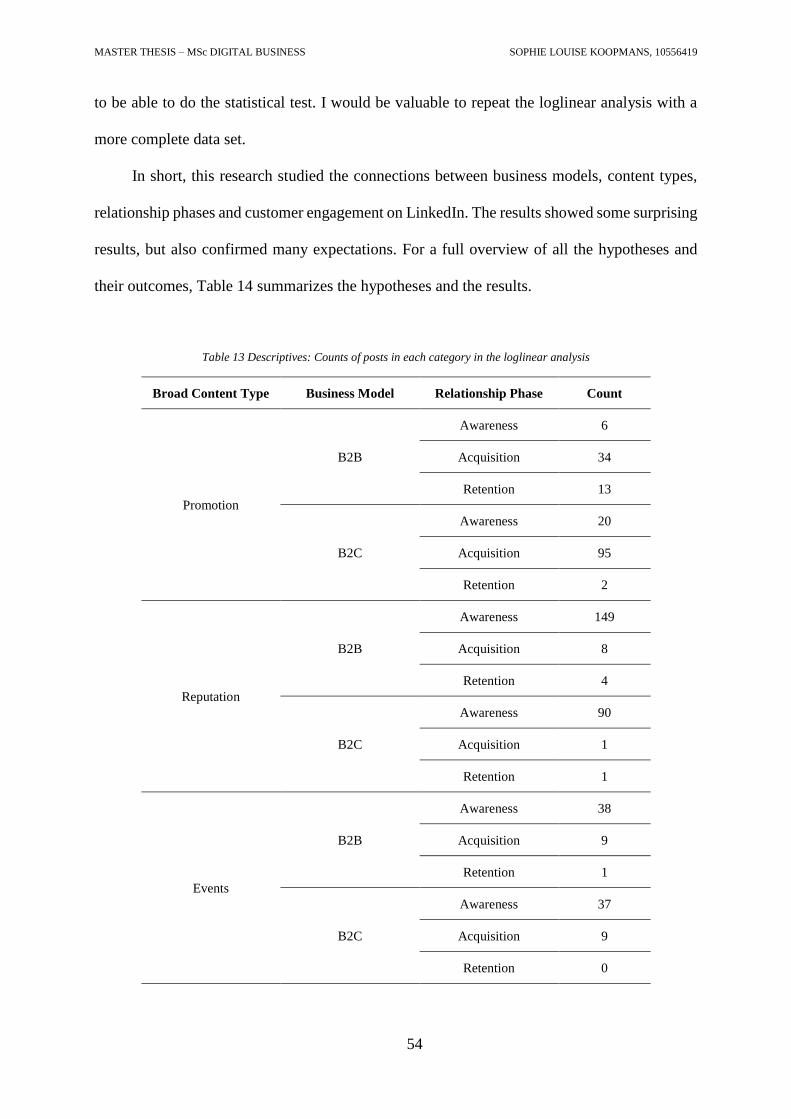
MASTER THESIS – MSc DIGITAL BUSINESS SOPHIE LOUISE KOOPMANS, 10556419
54
to be able to do the statistical test. I would be valuable to repeat the loglinear analysis with a
more complete data set.
In short, this research studied the connections between business models, content types,
relationship phases and customer engagement on LinkedIn. The results showed some surprising
results, but also confirmed many expectations. For a full overview of all the hypotheses and
their outcomes, Table 14 summarizes the hypotheses and the results.
Table 13 Descriptives: Counts of posts in each category in the loglinear analysis
Broad Content Type Business Model Relationship Phase Count
Promotion
B2B
Awareness 6
Acquisition 34
Retention 13
B2C
Awareness 20
Acquisition 95
Retention 2
Reputation
B2B
Awareness 149
Acquisition 8
Retention 4
B2C
Awareness 90
Acquisition 1
Retention 1
Events
B2B
Awareness 38
Acquisition 9
Retention 1
B2C
Awareness 37
Acquisition 9
Retention 0
MASTER THESIS – MSc DIGITAL BUSINESS SOPHIE LOUISE KOOPMANS, 10556419
55
Table 14 Overview of hypotheses and corresponding results
Number Hypothesis Result
Accepted = Result is significant Refuted = Opposite is significant Rejected = No significant result
1 Customer engagement is higher on B2B company posts than on B2C company posts
on LinkedIn.
Refuted
2a B2C companies post more promotional content than B2B companies. Accepted
2b B2B companies post slightly more posts to increase reputation than B2C companies. Accepted
2c B2B companies post significantly more event-related content than B2C companies. Rejected
3a B2C customers are more engaged in promotional content than B2B customers. Rejected
3b B2B customers are slightly more engaged in reputation posts than B2C customers. Rejected
3c B2B customers are more engaged with event-related posts than B2C customers. Rejected
4a B2C companies post more awareness-related posts than B2B companies. Refuted
4b B2B companies post more acquisition-related posts than B2C companies. Refuted
4c B2B companies post more retention-related posts than B2C companies. Accepted
5a Acquisition and Retention content generates higher Customer Engagement than
Awareness content.
Rejected
5b Relationship content posted by B2B companies create higher engagement than
relationship content by B2C companies.
Rejected
6a Promotion posts in the B2C context mainly target the acquisition phase. Rejected*
6b Promotion posts in the B2B context mainly target the awareness and retention
phases.
Rejected
6c Reputation posts in the B2C contexts mainly target the awareness phase. Rejected*
6d Reputation posts in the B2B context mainly target the awareness and retention
phases.
Rejected
6e Event posts in the B2C context mainly target the awareness phase. Rejected*
6f Event posts in the B2B context mainly target the retention phase. Rejected
* Descriptives show otherwise
MASTER THESIS – MSc DIGITAL BUSINESS SOPHIE LOUISE KOOPMANS, 10556419
56
5.5 Limitations
Some limitations are associated with the current study.
First, although the sample size of the LinkedIn posts of six different companies was
extensive, the sample was too small for some statistical tests to be conducted at full strength.
Adaptations, like the exclusion of a category, had to be done to meet the assumptions for some
tests. With a larger sample, some of these problems could have been bypassed, but this was not
possible in this study due to time and access constraints. A solution would be to use the
LinkedIn API for all company pages to collect data, but the researchers will have to be
authorized to access the data by each company separately.
Second, technology and digital industries are fastmoving, and what is hot and trending
this year, could be obsolete the next. Likewise, in social media networks, the features and
content are constantly changing. In the last couple of years, LinkedIn has grown and added and
removed features. Some literature used in this study is not very recent, but in my opinion the
insights are still valid. However, the reader should keep in mind that some parameters might
have become invalid during the pace of this study. Legislation for digital and data-intensive
companies is also currently changing, like the General Data Protection Regulation (GDPR) that
has taken effect in May 2018 in the EU. The effect on data sharing and the functions of the
APIs is still uncertain, but could be changing in the near future.
Third, the content types identified and used in this study are not applicable to every social
network. Also, if this study would be repeated, some content types may be lumped to get
stronger statistical results and validity. Moreover, each post was assigned only one content type
and one relationship phase, to satisfy the assumption of chi square tests where all units in the
sample should be independent. In practice, in many posts the content and/or relationship types
overlap, i.e. are not mutually exclusive. A post with the mention of an event may as well include
MASTER THESIS – MSc DIGITAL BUSINESS SOPHIE LOUISE KOOPMANS, 10556419
57
a product discount, which allows the post to receive two labels. However, in this study the best
option was chosen in such situations, which may cause a dispersion with reality.
5.6 Theoretical and Managerial Implications
As expected in the introduction, this study adds new insights to the literature on the distinction
between the B2B and B2C markets. There is a difference in the level of engagement of B2B
and B2C customers and in which content they are engaged. These insights are new to this
branch of literature. Also, the content categorization helps advance the methodology of content
analysis on social media. Surprisingly, there are few studies which specifically focus on the
content of social media messages. The categorization in Table 2 will still need to be adapted,
but will be a good starting point for future studies.
In practice, this study helps managers better understand the distinction between the B2B
and B2C markets. It makes them aware that for each business model a different online strategy
might be needed for optimal results. The better they engage their customers, the better the long
term (financial) results of the company will be (Hoffman & Fodor, 2010).
Social media managers are better equipped to development an effective social media
strategy after reading this study. For instance, it makes it easier for social media managers to
choose other companies to benchmark their performance of social media pages with. Many
social media networks have the option to see how other companies are performing. On
LinkedIn, the tool ‘Companies to track’ is available at the Analytics page of an administrator.
Social media managers should now be able to make a better selection of which companies they
should track to compare their company page performance with; it has been revealed that
comparing their results with those of company pages with other business models is deceitful.
Companies should only benchmark themselves with companies with the same business model,
otherwise it would be comparing apples with oranges.
MASTER THESIS – MSc DIGITAL BUSINESS SOPHIE LOUISE KOOPMANS, 10556419
58
Furthermore, social media managers can use the information on content types to make a
substantiated choice of which type of content they should choose for a message. Also, if a social
media manager is considering two types and must make a choice, he can use the Content
Decision Table (Table 11) to determine which content will work best to get the highest customer
engagement.
LinkedIn positions itself as the social network for professionals and businesses. Because
customer engagement on B2C company pages is higher than on B2B company pages, it implies
that LinkedIn members are representing themselves more than they are representing the
company they work for. They are more active in liking and commenting on posts they enjoy
personally than they enjoy professionally. So, although LinkedIn positions itself as the
professional social network, this study refutes the intuitive idea that LinkedIn is made for
professionals only. Therefore, the insights may be valuable for LinkedIn itself, as an
opportunity for business development is uncovered. LinkedIn could focus more on B2B
businesses and facilitate their optimal use of LinkedIn, and equalize the value B2B and B2C
companies obtain from their platform.
6. Conclusion
The lack of studies about the distinction between B2B and B2C companies in digital marketing
led to the need for a quantitative and explanatory study in this field. LinkedIn is a widely used,
but barely studied social medium for professionals. This study identifies differences between
the two business models and finds which content works best to generate high customer
engagement. Therefore, the results of this study can be used by social media managers to
establish an effective social media strategy on LinkedIn. The main research question of this
study was to find out to what extent customer engagement on social media differs in the B2B
and B2C contexts, and what role content plays in this relationship.
MASTER THESIS – MSc DIGITAL BUSINESS SOPHIE LOUISE KOOPMANS, 10556419
59
The findings suggest that there is a significant difference in customer engagement
between B2B and B2C companies. Posts of B2C companies on LinkedIn company pages
receive significantly more likes and comments than B2C companies’ posts.
In addition, the type of content also differs between the two business models. B2C
companies post more promotional content and B2C companies more content that establishes a
reputation. Both business models post about events, but there were no significant differences in
counts. Although some content types generate significantly less or more engagement than other
types, there is no significant influence of the business models on the customer engagement per
content type.
The study also made a distinction in the phase of the relationship that the posts target:
awareness, acquisition or retention. B2B companies posts more awareness-related posts, B2C
companies post more acquisition-related posts, and lastly, B2B companies use more retention-
related posts, although previous literature showed that B2C companies are more focused on the
awareness phase, and B2B companies on the acquisition and retention phases (Michaelidou et
al., 2011). However, there is no link between the relationship phases and customer engagement,
so the phase does not influence engagement. The results neither show a significant interaction
effect of the two business models on the connection between relationship phases and customer
engagement. Finally, there is no three-way effect between the business models, content types
and relationship phases.
To conclude, this study shows some interesting findings, even though not all hypothesis
could be answered with significant results. It has been established that there are indeed
differences between business to business and business to consumer companies on social media,
and also in the content they can use and post.

MASTER THESIS – MSc DIGITAL BUSINESS SOPHIE LOUISE KOOPMANS, 10556419
60
6.1 Future research
The findings suggest various avenues for future research. Scholars may repeat this research on
other social media platforms to establish that there’s a difference in content and engagement
per platform, or that the content preferences of customers are the same throughout social media
platforms. An advantage of repeating this study on other social media could be that their APIs
are more accessible (likes Facebook’s API), and data collection will be easier.
Future researchers may also take a deeper look into the three-way effect of business
models, content types and relationship types as the descriptives confirmed out hypotheses, but
the loglinear analysis did not. In this research, the data set for the loglinear analysis had to be
adapted unfortunately. It would be very interesting to see if the hypotheses are confirmed with
a more extensive data set.
Furthermore, although there is no significant difference in customer engagement
between posts of different relationship phases in this study, this might actually point to an
association, which will need further research. Hypothetically, if it’s the case that only
converting (acquisition stage) or converted (retention stage) customers engage with acquisition
and retention posts, and non-converted (awareness stage) followers exclusively engage with
awareness posts, then converted customers are actually much more active, since this group is
likely to be only a fraction of the total followers of a LinkedIn company page. This means that,
for example, a group of 1000 non-converted followers would account for the same number of
likes and comments on awareness posts as a group of 100 converted followers on acquisition
and retention posts. A study with two groups of customers (converted and non-converted)
would lead to further insights into the motivations of a (potential) customer to engage on social
media.
MASTER THESIS – MSc DIGITAL BUSINESS SOPHIE LOUISE KOOPMANS, 10556419
61
7. References
Ashley, C., & Tuten, T. (2015). Creative Strategies in Social Media Marketing: An Exploratory
Study of Branded Social Content and Consumer Engagement. Psychology & Marketing,
32(1), 15–27. https://doi.org/10.1002/mar.20761
Awan, A. (2017). The Power of LinkedIn’s 500 Million Community | Official LinkedIn Blog.
Retrieved February 5, 2018, from https://blog.linkedin.com/2017/april/24/the-power-of-
linkedins-500-million-community
Barger, V. A., & Labrecque, L. (2013). An Integrated Marketing Communications Perspective
on Social Media Metrics. International Journal of Integrated Marketing Communications,
(Spring), 64–76.
Brennan, R., & Croft, R. (2012). The use of social media in B2B marketing and branding: An
exploratory study. Journal of Customer Behaviour, 11(2), 101–115.
https://doi.org/10.1362/147539212X13420906144552
Brodie, R. J., Hollebeek, L. D., Jurić, B., & Ilić, A. (2011). Customer Engagement. Journal of
Service Research, 14(3), 252–271. https://doi.org/10.1177/1094670511411703
Cohen, J. (1988). Statistical Power Analysis for the Behavioral Sciences. New Jersey:
Lawrence Erlbaum Associates.
Constantinides, E., Schepers, L., & De Vries, S. (2015). B2C social media value gap-model: a
study of the Dutch online retailing. International Journal of Electronic Marketing and
Retailing, 6(3), 179. https://doi.org/10.1504/IJEMR.2015.070802
Cuillierier, A. (2016). Customer Engagement through Social Media. Retrieved from
https://www.theseus.fi/handle/10024/115812
De Swert, K. (2012). Calculating inter-coder reliability in media content analysis using
Krippendorff’s Alpha. Retrieved from https://www.polcomm.org/wp-
content/uploads/ICR01022012.pdf
MASTER THESIS – MSc DIGITAL BUSINESS SOPHIE LOUISE KOOPMANS, 10556419
62
Field, A. (2013). Discovering Statistics using IBM SPSS Statistics (4th Editio). Sage.
Haans, H., Raassens, N., & van Hout, R. (2013). Search engine advertisements: The impact of
advertising statements on click-through and conversion rates. Marketing Letters, 24(2),
151–163. https://doi.org/10.1007/s11002-013-9226-5
Hayes, A. F., & Krippendorff, K. (2007). Answering the Call for a Standard Reliability Measure
for Coding Data. Communication Methods and Measures, 1(1), 77–89.
https://doi.org/10.1080/19312450709336664
Hoffman, D. L., & Fodor, M. (2010). Can You Measure the ROI of Your Social Media
Marketing? Sloan Management Review, 52(1).
Holliman, G., & Rowley, J. (2014). Business to business digital content marketing: marketers’
perceptions of best practice. Journal of Research in Interactive Marketing, 8(4), 269–293.
https://doi.org/10.1108/JRIM-02-2014-0013
Homburg, C., Klarmann, M., & Schmitt, J. (2010). Brand awareness in business markets: When
is it related to firm performance? International Journal of Research in Marketing, 27(3),
201–212. https://doi.org/10.1016/J.IJRESMAR.2010.03.004
Honts, B. R., Klimek, D., & Meyer, S. (2016). Why do you think your digital customers are the
most profitable ? Accenture.
Huotari, L., Ulkuniemi, P., Saraniemi, S., Mäläskä, M., Holliman, G., & Rowley, J. (2015).
Analysis of content creation in social media by B2B companies. Journal of Business &
Industrial Marketing, 30(4), 761–770. Retrieved from http://dx.doi.org/10.1108/JBIM-05-
2013-0118
Iankova, S., Davies, I., Archer-Brown, C., Marder, B., & Yau, A. (2018). A comparison of
social media marketing between B2B, B2C and mixed business models. Industrial
Marketing Management. https://doi.org/10.1016/j.indmarman.2018.01.001
Karjaluoto, H., Mustonen, N., & Ulkuniemi, P. (2015). The role of digital channels in industrial

MASTER THESIS – MSc DIGITAL BUSINESS SOPHIE LOUISE KOOPMANS, 10556419
63
marketing communications. Journal of Business & Industrial Marketing, 30(6), 703–710.
https://doi.org/10.1108/JBIM-04-2013-0092
Keinänen, H., & Kuivalainen, O. (2015). Antecedents of social media B2B use in industrial
marketing context: customers’ view. Journal of Business & Industrial Marketing, 30(6),
711–722. https://doi.org/10.1108/JBIM-04-2013-0095
Krippendorff, K. (2004). Reliability in Content Analysis. Human Communication Research,
30(3), 411–433. https://doi.org/10.1111/j.1468-2958.2004.tb00738.x
La Placa, P., & da Silva, R. V. (2016). B2B: A Paradigm Shift from Economic Exchange to
Behavioral Theory: A Quest for Better Explanations and Predictions. Psychology &
Marketing, 33(4), 232–249. https://doi.org/10.1002/mar.20872
Labaree, R. V. (2009). Research Guides: Organizing Your Social Sciences Research Paper:
Types of Research Designs. Retrieved from
http://libguides.usc.edu/c.php?g=235034&p=1559832
Lilien, G. L. (2016). The B2B Knowledge Gap. International Journal of Research in
Marketing, 33(3), 543–556. https://doi.org/10.1016/J.IJRESMAR.2016.01.003
Linkedin Corporation. (2018). About LinkedIn. Retrieved March 19, 2018, from
https://about.linkedin.com/
Lombard, M., Snyder-Duch, J., & Bracken, C. C. (2002). Content Analysis in Mass
Communication: Assessment and Reporting of Intercoder Reliability. Human
Communication Research, 28(4), 587–604. https://doi.org/10.1111/j.1468-
2958.2002.tb00826.x
Luarn, P., Lin, Y.-F., & Chiu, Y.-P. (2015). Influence of Facebook brand-page posts on online
engagement. Online Information Review, 39(4), 505–519. https://doi.org/10.1108/OIR-
01-2015-0029
Malthouse, E. C., Haenlein, M., Skiera, B., Wege, E., & Zhang, M. (2013). Managing Customer
MASTER THESIS – MSc DIGITAL BUSINESS SOPHIE LOUISE KOOPMANS, 10556419
64
Relationships in the Social Media Era: Introducing the Social CRM House. Journal of
Interactive Marketing, 27(4), 270–280. https://doi.org/10.1016/J.INTMAR.2013.09.008
Merriam-Webster. (2018). Social Media | Definition of Social Media by Merriam-Webster.
Retrieved June 8, 2018, from https://www.merriam-webster.com/dictionary/social media
Michaelidou, N., Siamagka, N. T., & Christodoulides, G. (2011). Usage, barriers and
measurement of social media marketing: An exploratory investigation of small and
medium B2B brands. Industrial Marketing Management, 40(7), 1153–1159.
https://doi.org/10.1016/J.INDMARMAN.2011.09.009
Moore, J. N., Hopkins, C. D., & Raymond, M. A. (2013). Utilization of Relationship-Oriented
Social Media in the Selling Process: A Comparison of Consumer (B2C) and Industrial
(B2B) Salespeople. Journal of Internet Commerce, 12(1), 48–75.
https://doi.org/10.1080/15332861.2013.763694
Mora Cortez, R., & Johnston, W. J. (2017). The future of B2B marketing theory: A historical
and prospective analysis. Industrial Marketing Management, 66, 90–102.
https://doi.org/10.1016/J.INDMARMAN.2017.07.017
Neiger, B. L., Thackeray, R., Van Wagenen, S. A., Hanson, C. L., West, J. H., Barnes, M. D.,
& Fagen, M. C. (2012). Use of Social Media in Health Promotion. Health Promotion
Practice, 13(2), 159–164. https://doi.org/10.1177/1524839911433467
Parsons, A. L. (2011). Social Media from a Corporate Perspective: a content analysis of official
Facebook pages. In Allied Academies International Conference. Academy of Marketing
Studies. (Vol. 16).
Peters, K., Chen, Y., Kaplan, A. M., Ognibeni, B., & Pauwels, K. (2013). Social media metrics
- A framework and guidelines for managing social media. Journal of Interactive
Marketing. https://doi.org/10.1016/j.intmar.2013.09.007
Priem, J., & Costello, K. L. (2010). How and why scholars cite on Twitter. Proceedings of the
MASTER THESIS – MSc DIGITAL BUSINESS SOPHIE LOUISE KOOPMANS, 10556419
65
American Society for Information Science and Technology, 47(1), 1–4.
https://doi.org/10.1002/meet.14504701201
Riff, D., Lacy, S., & Fico, F. (2014). Analyzing Media Messages: Using Quantitative Content
Analysis in Research - (Third Edit). New York: R outledge.
Rodriguez, M., Peterson, R. M., & Krishnan, V. (2012). Social Media’s Influence on Business-
to-Business Sales Performance. Journal of Personal Selling & Sales Management, 32(3),
365–378. https://doi.org/10.2753/PSS0885-3134320306
Rodriguez, M., Peterson, R. M., & Ajjan, H. (2015). CRM/Social Media Technology: Impact
on Customer Orientation Process and Organizational Sales Performance. In Ideas in
Marketing: Finding the New and Polishing the Old (pp. 636–638). Cham: Springer
International Publishing. https://doi.org/10.1007/978-3-319-10951-0_233
Rutz, O. J., & Trusov, M. (2011). Zooming In on Paid Search Ads—A Consumer-Level Model
Calibrated on Aggregated Data. Marketing Science, 30(5), 789–800.
https://doi.org/10.1287/mksc.1110.0647
Salo, J. (2017). Social media research in the industrial marketing field: Review of literature and
future research directions. Industrial Marketing Management, 66, 115–129.
https://doi.org/10.1016/J.INDMARMAN.2017.07.013
Sashi, C. M. (2012). Customer engagement, buyer‐seller relationships, and social media.
Management Decision, 50(2), 253–272. https://doi.org/10.1108/00251741211203551
Schultz, R. J., Schwepker, C. H., & Good, D. J. (2012). Social media usage: an investigation of
B2B salespeople. American Journal of Business, 27(2), 174–194.
https://doi.org/10.1108/19355181211274460
Smaiziene, I., & Jucevicius, R. (2009). Corporate Reputation : Multidisciplinary Richness and
Search for a Relevant Definition. Engineering Economics, 62(2), 91–102.
https://doi.org/10.1.1.616.9860
MASTER THESIS – MSc DIGITAL BUSINESS SOPHIE LOUISE KOOPMANS, 10556419
66
Social Media Examiner. (2017). Social Media Marketing Industry Report. Retrieved from
https://www.socialmediaexaminer.com/wp-content/uploads/2017/05/Industry-Report-
2017.pdf
Statista. (2015). Global share of businesses using social media marketing 2015 | Statistic.
Retrieved February 5, 2018, from https://www.statista.com/statistics/188444/global-
share-of-businesses-using-social-media-marketing/
Swani, K., Brown, B. P., & Milne, G. R. (2014). Should tweets differ for B2B and B2C? An
analysis of Fortune 500 companies’ Twitter communications. Industrial Marketing
Management, 43(5), 873–881. https://doi.org/10.1016/J.INDMARMAN.2014.04.012
Thaichon, P., & Quach, T. N. (2015). From Marketing Communications to Brand Management:
Factors Influencing Relationship Quality and Customer Retention. Journal of Relationship
Marketing, 14(3), 197–219. https://doi.org/10.1080/15332667.2015.1069523
Trainor, K. J., Andzulis, J. (Mick), Rapp, A., & Agnihotri, R. (2014). Social media technology
usage and customer relationship performance: A capabilities-based examination of social
CRM. Journal of Business Research, 67(6), 1201–1208.
https://doi.org/10.1016/J.JBUSRES.2013.05.002
Walsh, G., Beatty, S. E., & Holloway, B. B. (2015). Measuring client-based corporate
reputation in B2B professional services: scale development and validation. Journal of
Services Marketing, 29(3), 173–187. https://doi.org/10.1108/JSM-04-2014-0141
White, M. D., & Marsh, E. E. (2006). Content Analysis: A Flexible Methodology. Library
Trends, 55(1), 22–45. https://doi.org/10.1353/lib.2006.0053

MASTER THESIS – MSc DIGITAL BUSINESS SOPHIE LOUISE KOOPMANS, 10556419
67
8. Appendix
8.1 Coding guidelines second coder
The coding guidelines were given to the second coder for the reliability test.
Table 15 Coding sheet: Content Categories
Content type Description Example
1 Promotion/discount Posts which mention prices or discount
marketing campaigns
• 2+2 for free,
• 20% discount if…,
• KLM werelddealweken
2 Contests Asking a member to take a quiz, guess
an object, etc. Asking for user
generated content in the comment
section.
• Do [this] and win …,
• Take a quiz…,
• Guess what product this
is…?
3 Events / Conferences Mention of an event where the
company attended, or an invite to join
an event. Preferably with place and
time mentioned. No business courses!
• Come see us at booth …,
• Watch our show at 19.00
on 1-1-2011,
• We were present at
[conference]
4 Awards /
Congratulations
Congratulating someone or something,
or announcement of winning an award.
• Congratulations to Timmy
for being nominated for…,
• We’ve won the award…
5 CSR Sustainability related post, charity,
voluntary work
• We reduced water usage
by ...
• Donate to this charity…,
• Our employees
volunteered at ...
6 Products/Services Mentioning of a product or service • See our [new product] …,
• Go to our website to buy
[product name]
7 Knowledge Sharing Sharing knowledge, without explicitly
promoting a product or service.
• Top 10 tips,
• Things to do in this city...,
• Did you know that …
• Whitepapers
8 Reports Mentioning of a report, annual
numbers, infographics with numbers
etc.
• Download our annual
report…,
• This year our revenue
grew to…
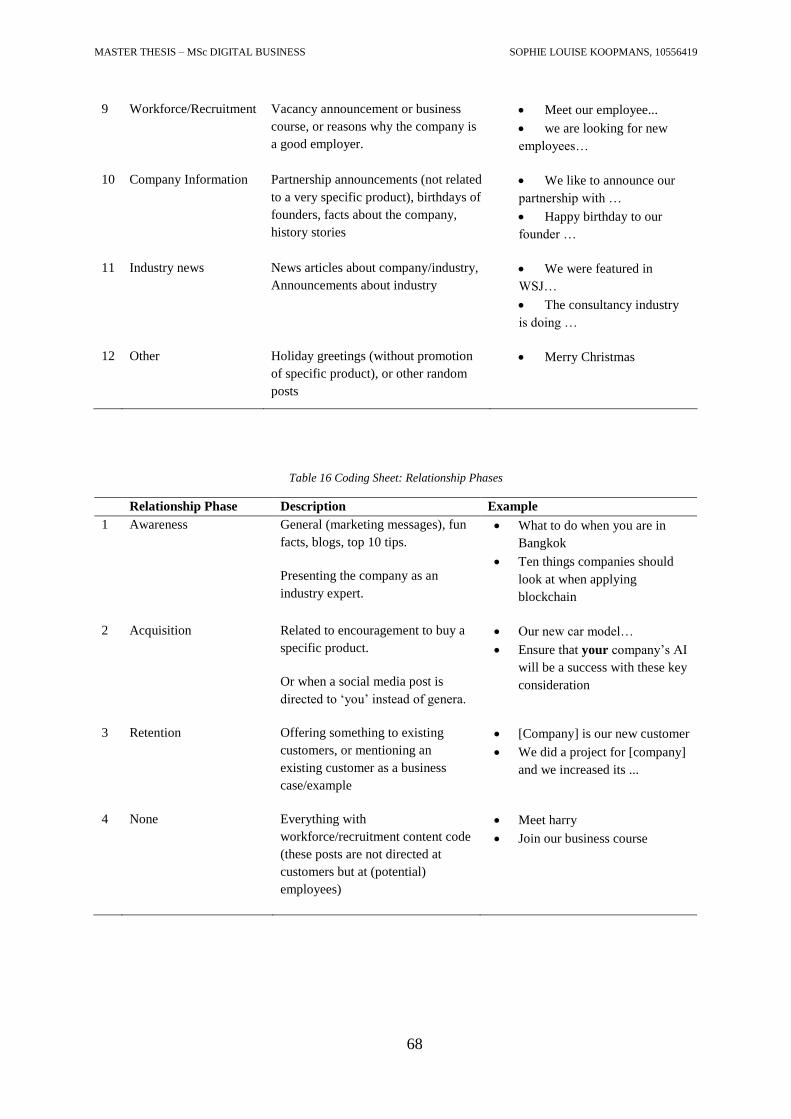
MASTER THESIS – MSc DIGITAL BUSINESS SOPHIE LOUISE KOOPMANS, 10556419
68
9 Workforce/Recruitment Vacancy announcement or business
course, or reasons why the company is
a good employer.
• Meet our employee...
• we are looking for new
employees…
10 Company Information Partnership announcements (not related
to a very specific product), birthdays of
founders, facts about the company,
history stories
• We like to announce our
partnership with …
• Happy birthday to our
founder …
11 Industry news News articles about company/industry,
Announcements about industry
• We were featured in
WSJ…
• The consultancy industry
is doing …
12 Other Holiday greetings (without promotion
of specific product), or other random
posts
• Merry Christmas
Table 16 Coding Sheet: Relationship Phases
Relationship Phase Description Example
1 Awareness General (marketing messages), fun
facts, blogs, top 10 tips.
Presenting the company as an
industry expert.
• What to do when you are in
Bangkok
• Ten things companies should
look at when applying
blockchain
2 Acquisition Related to encouragement to buy a
specific product.
Or when a social media post is
directed to ‘you’ instead of genera.
• Our new car model…
• Ensure that your company’s AI
will be a success with these key
consideration
3 Retention Offering something to existing
customers, or mentioning an
existing customer as a business
case/example
• [Company] is our new customer
• We did a project for [company]
and we increased its ...
4 None Everything with
workforce/recruitment content code
(these posts are not directed at
customers but at (potential)
employees)
• Meet harry
• Join our business course
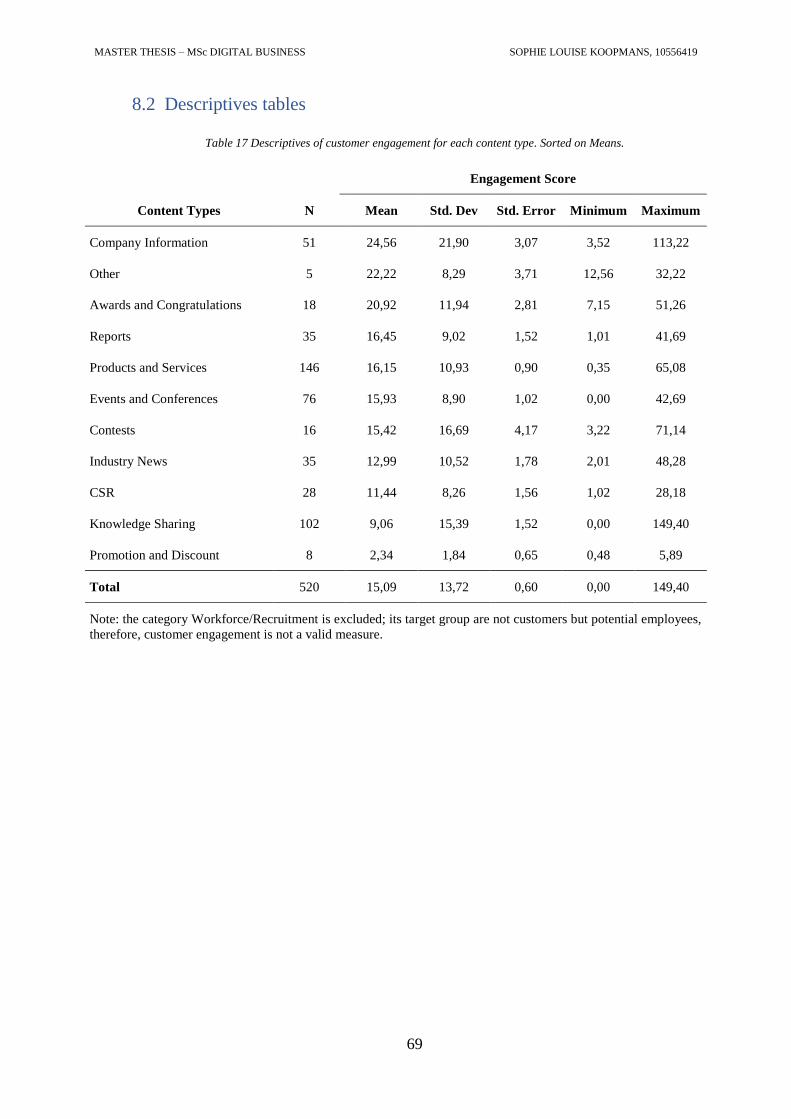
MASTER THESIS – MSc DIGITAL BUSINESS SOPHIE LOUISE KOOPMANS, 10556419
69
8.2 Descriptives tables
Table 17 Descriptives of customer engagement for each content type. Sorted on Means.
Engagement Score
Content Types N Mean Std. Dev Std. Error Minimum Maximum
Company Information 51 24,56 21,90 3,07 3,52 113,22
Other 5 22,22 8,29 3,71 12,56 32,22
Awards and Congratulations 18 20,92 11,94 2,81 7,15 51,26
Reports 35 16,45 9,02 1,52 1,01 41,69
Products and Services 146 16,15 10,93 0,90 0,35 65,08
Events and Conferences 76 15,93 8,90 1,02 0,00 42,69
Contests 16 15,42 16,69 4,17 3,22 71,14
Industry News 35 12,99 10,52 1,78 2,01 48,28
CSR 28 11,44 8,26 1,56 1,02 28,18
Knowledge Sharing 102 9,06 15,39 1,52 0,00 149,40
Promotion and Discount 8 2,34 1,84 0,65 0,48 5,89
Total 520 15,09 13,72 0,60 0,00 149,40
Note: the category Workforce/Recruitment is excluded; its target group are not customers but potential employees,
therefore, customer engagement is not a valid measure.
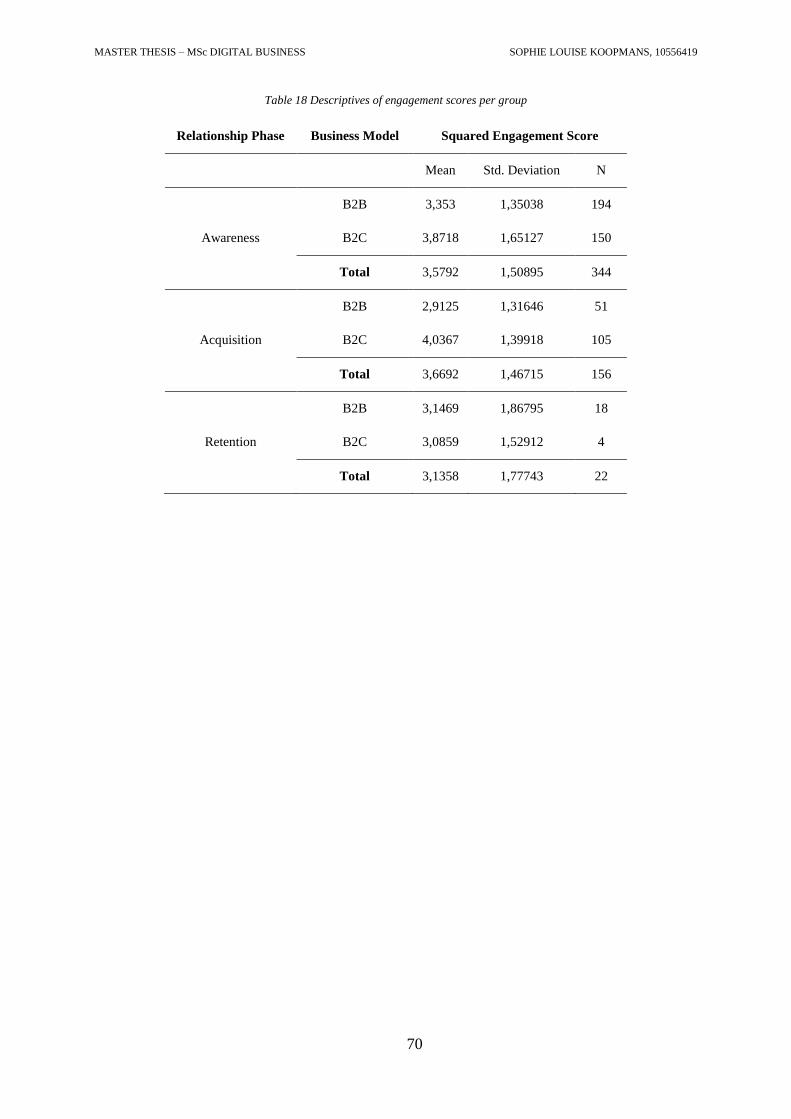
MASTER THESIS – MSc DIGITAL BUSINESS SOPHIE LOUISE KOOPMANS, 10556419
70
Table 18 Descriptives of engagement scores per group
Relationship Phase Business Model Squared Engagement Score
Mean Std. Deviation N
B2B 3,353 1,35038 194
Awareness B2C 3,8718 1,65127 150
Total 3,5792 1,50895 344
B2B 2,9125 1,31646 51
Acquisition B2C 4,0367 1,39918 105
Total 3,6692 1,46715 156
B2B 3,1469 1,86795 18
Retention B2C 3,0859 1,52912 4
Total 3,1358 1,77743 22
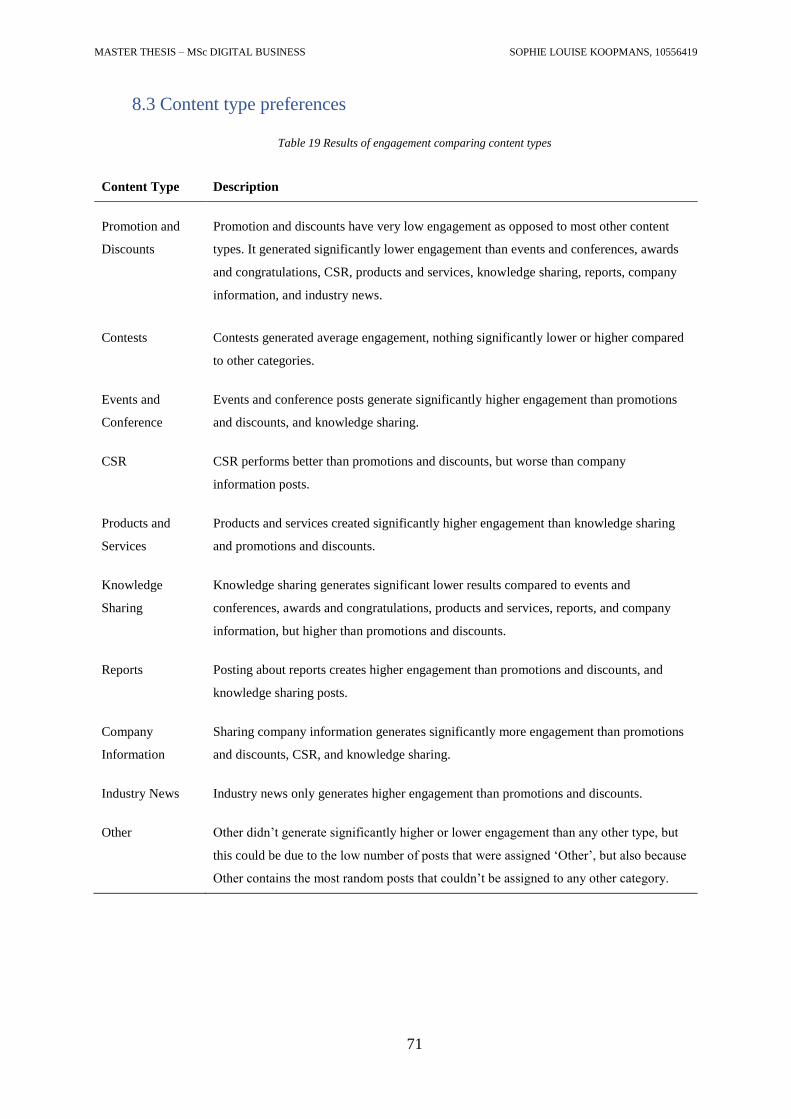
MASTER THESIS – MSc DIGITAL BUSINESS SOPHIE LOUISE KOOPMANS, 10556419
71
8.3 Content type preferences
Table 19 Results of engagement comparing content types
Content Type Description
Promotion and
Discounts
Promotion and discounts have very low engagement as opposed to most other content
types. It generated significantly lower engagement than events and conferences, awards
and congratulations, CSR, products and services, knowledge sharing, reports, company
information, and industry news.
Contests Contests generated average engagement, nothing significantly lower or higher compared
to other categories.
Events and
Conference
Events and conference posts generate significantly higher engagement than promotions
and discounts, and knowledge sharing.
CSR CSR performs better than promotions and discounts, but worse than company
information posts.
Products and
Services
Products and services created significantly higher engagement than knowledge sharing
and promotions and discounts.
Knowledge
Sharing
Knowledge sharing generates significant lower results compared to events and
conferences, awards and congratulations, products and services, reports, and company
information, but higher than promotions and discounts.
Reports Posting about reports creates higher engagement than promotions and discounts, and
knowledge sharing posts.
Company
Information
Sharing company information generates significantly more engagement than promotions
and discounts, CSR, and knowledge sharing.
Industry News Industry news only generates higher engagement than promotions and discounts.
Other Other didn’t generate significantly higher or lower engagement than any other type, but
this could be due to the low number of posts that were assigned ‘Other’, but also because
Other contains the most random posts that couldn’t be assigned to any other category.

MASTER THESIS – MSc DIGITAL BUSINESS SOPHIE LOUISE KOOPMANS, 10556419
72
8.4 Ranking of most used content types
Table 20 Ranking of content types of the data set per business model
Rank B2B
B2C
1 Knowledge Sharing 21% Products and Services 35%
2 Products and Services 17% Knowledge Sharing 14%
3 Events and Conferences 13% Events and Conferences 14%
4 Workforce/Recruitment 12% Company Information 9%
5 Industry News 11% Workforce/Recruitment 6%
6 Company Information 8% Contests 5%
7 Reports 7% Reports 5%
8 CSR 5% CSR 4%
9 Awards and Congratulations 3% Awards and Congratulations 3%
10 Contests 1% Promotions and Discounts 3%
11 Other 0% Other 1%
12 Promotions and Discounts 0% Industry News 1%