Embed Size (px)
Citation preview
GRAIN QUALITY
Differentiation of Hard Red Wheat by Near-Infrared Analysis of Bulk Samples
STEPHEN R. DELWICHE,' YUD-REN CHEN, and WILLIAM R. HRUSCHKA
Cereal Chem. 72(3):243--247
Near-infrared reflectance spectroscopy (1,100-2,498 nm) has been usedto identify hard red winter and hard red spring wheat classes. As a follow-up to a previous study which involved ground wheat samples, the authorshave used the same samples on a whole kernel in-bulk (80 g) basis. Fouryears of U.S. winter and spring wheats were used. A small number (n =150 samples per class) from the first three years' samples were used forcalibration; the remaining portion (n = 1,325), plus all of the fourthyear's samples (n = 778), were used to verify the models. Four typesof classification algorithms were examined: multiple linear regression(MLR), principal component analysis with Mahalanobis distance (PCA/MD), partial least squares (PLS) analysis, and artificial neural networks(ANN). All four models demonstrated classification accuracies (definedas the percentage of correctly classified samples) greater than 88%, and
Hard red winter (HRW) and hard red spring (HRS) are thetwo most prevalent classes of breadmaking wheats grown in theUnited States. The current market system for U.S. grown wheatfor domestic and overseas markets is based on the usual segrega-tion of wheat by class (Office of Technology Assessment 1989).In some years, a premium may be paid for HRS wheat due toa perceived higher breadmaking quality. Hence, buyers wish tomaintain the traditional classification system. The United StatesDepartment of Agriculture, Federal Grain Inspection Service(FGIS) is responsible for the grading of all U.S. wheat sold forexport and inspects samples in the domestic market on request.Classification is traditionally performed by trained personnel whoexamine the size, shape, color, and other physically distinct fea-tures of kernels in a sample of grain. Some subjectivity in classassignment is unavoidable. In the movement toward developingrapid, objective classification and grading methods, the FGIShas been seeking alternative methods to human visual inspection.To date, intact-kernel classification research has been based ondigital image analysis of nontouching kernels (Zayas et al 1985,1986; Neuman et al 1987; Sapirstein et al 1987; Symons andFulcher 1988 ab; Chen et al 1989; Thomson and Pomeranz 1991;Keefe 1992; Barker et al 1992 a-c) and touching kernels (Shatadalet al 1994).
Recently, we reported our results on developing a HRW/ HRSclassification system that is based on near-infrared (NIR) diffusereflectance spectroscopy of ground wheat (Delwiche and Norris1993). Non-mixed-class samples from four crop years were cor-rectly classified as HRW or HRS at an accuracy of 95% by atechnique based on the Mahalanobis distance of the sample scoresfrom principal component analysis. Such accuracies were notattainable through simpler discriminant functions that employedeither protein content, NIR-hardness, or a combination of both.Year-to-year changes in the average levels of these constituentsfor each class were the reason for the poorer performance ofthe simpler functions. We concluded that a full-spectrum tech-nique such as principal component analysis on NIR spectra wasnecessary for robust classification; otherwise, yearly adjustments
'Instrumentation and Sensing Laboratory, Beltsville Agricultural Research Center,ARS, USDA, Beltsville, MD.
Mention of company or trade name is for purpose of description only and doesnot imply endorsement by the U.S. Department of Agriculture.
This article is in the public domain and not copyrightable. It may be freelyreprinted with customary crediting of the source. American Association ofCereal Chemists, Inc., 1995.
most often, about 95% for samples grown during the same years as usedin calibration. These accuracies were significantly better than those associ-ated with discriminant models that were based solely on protein content,NIR-hardness, or a combination of protein and hardness. Spectrally sensedwater-matrix interactions were probably beneficial to model accuracy;however, moisture content alone was not deemed necessary to a model'ssuccess. When predicting the fourth year, the MLR model needed a biascorrection, whereas the other three models performed reasonably well.The ANN model's performance was highest, with accuracies in the rangeof 95-98%. At little expense to model accuracy, the number of inputnodes to the ANN model could be reduced from 223 to Ill, providedthe full wavelength range was preserved.
to mean protein and hardness levels would be necessary. Thecurrent study differs from the previous one in that examinationby NIR is performed on bulk wheat without first grinding thesample; however, the same samples that constituted the calibra-tion, validation, and prediction sets have been used. If successful,classification by NIR spectroscopy would be advantageous overdigital imaging in terms of equipment cost and computationalprocessing time. The objectives of the current study were todevelop accurate models for the differentiation of HRW and HRSwheats based on NIR reflectance spectra of bulk samples andto compare various classification algorithms. Although the scopeof the study was limited because individual kernels were notexamined and, hence, detection of mixtures of classes was notpossible, the study represented the first comprehensive attemptto determine whether differences in intrinsic properties of thehard red wheat classes are measurable by NIR spectroscopy.
MATERIALS AND METHODS
Wheat SamplesSamples of HRW and HRS wheats from four crop years
(1987-1991) were purchased from a private source (Doty Labora-tories, Kansas City, MO). More than 600 samples per year wereobtained as part of an annual crop survey of the hard red wheatgrowing region of the central United States. Classification wasperformed by field personnel at the time of collection and verifiedon two year's (1987, 1988) surveys by the FGIS Board of Appealsand Review. Each survey represented a very good compilationof the quality of U.S. grown hard red wheats for the given year.The ratio of the number of HRW to HRS samples was about2 to 1, with the exception of one year in which only 81 HRSsamples were available in sufficient quantity. Yearly means andstandard deviations of protein content and NIR-hardness, as wellas state origin of the samples from each class, are summarizedin Delwiche and Norris (1993).
EquipmentA near-infrared spectrophotometer (model 6500, NIRSystems,
Silver Spring, MD) equipped with a bulk transport cell attachmentwas used to collect reflectance spectra of bulk kernel samples.Wheat, with dockage and foreign material removed, was loadedinto a rectangular prismatic cell (height 200 mm, width 38 mm,depth 14 mm). Approximately 80 g of seed was required to fillthe cell to three-quarters height. Opposing height X width faceswere clad with infrared transmitting quartz windows (thickness
Vol. 72, No. 3,1995 243
ABSTRACT
1.52 mm). Samples were scanned (1,100-2,498 nm wavelengthrange) in the reflectance mode and referenced to correspondingreflected energy readings from a ceramic block. Reflected energywas captured by two pairs of opposing lead sulfide detectors (each10 mm X 10 mm) oriented 450 with respect to the incident radiationand placed -20 mm from the near face of the sample cell. Theincident radiation path and detector remained stationary whilethe sample cell moved downward at constant speed duringscanning. The speed was adjusted so that 38 repetitive scans wereperformed in one downward movement of the cell. Scans wereaveraged and transformed to log(1/R), producing one spectrumof 700 points (at a uniform 2-nm wavelength spacing) per sample.Each sample was loaded and analyzed once.
Model DevelopmentUsing the same calibration-, validation-, and prediction-set
structure as described in Delwiche and Norris (1993), 50 samplesfrom each of the two classes and from each of the first threecrop years (1987-89) formed the calibration set (300 samples total).The remaining samples from 1987-89 (total = 1,325) formed thevalidation set. The fourth year's samples, of which none wereused in calibration, formed the prediction set (total = 778).
As determined in preliminary analyses of bulk wheat spectra,a second-difference transformation on the spectra performed priorto spectral decomposition enhanced the discriminant functions,despite the appearance of a greater divergence in HRW and HRSin the raw spectra (Fig. 1). Although an offset in absorbancefor the HRW and HRS mean spectra occurred throughout theentire wavelength region (upper graph), sample-to-sample spectralvariation was large enough to produce spectral overlap of thetwo classes when individual samples were examined. Second-difference spectra were more effective at accentuating the classdifferences in individual samples. Consequently, all discriminantmodeling was preceded by the application of a three-point centralsecond difference to the raw log(l / R) spectral data:
g(XA) = k[f(Xi+j) - 2f(XA) +f(Xi_)]
1 .0
0.8
- 0.6
° 0.4
0.2
0.01 .0
0.5
E
0)~007ao
0.0
-0.5
-1.0 1-1000 1500
V w
2000 2500
Wavelength (nm)Fig. 1. Average spectra (top graph) of the calibration set. Set consistedof 150 samples of hard red winter (W) and 150 samples of hard redspring (S) wheats from 1987-1989 crop years. Three-point central seconddifferences (gap = 20 nm) of spectra in bottom graph.
244 CEREAL CHEMISTRY
where g(AX) is the second-difference spectrum,ftX) is the spectrumbefore transformation, k is a scaling constant, i is the wavelengthindex, and j = 10 is the gap (i.e., the half-width expressed inpoints) of the finite difference window. Generally, a second-differ-ence transformation greatly eliminates spectrum-to-spectrumbaseline differences, which is advantageous in the case of groundsamples for reducing the effect of differences in light scatter causedby different particle size distributions (Hruschka 1987). Similarbenefits were found on bulk samples.
For purposes of reducing required computer memory and en-hancing speed, every third point within the second-differencespectrum was stored, while the remaining points were discarded.Thus, each sample was represented by 223 second-difference valuesover the range 1,136-2,468 nm at a constant spacing of 6 nm.Preliminary analyses indicated that this form of data compressioncould be performed without detrimental effects, owing to the col-linearity of neighboring wavelength points.
Four classification models were examined: multiple linear re-gression (MLR), principal component analysis with Mahalanobisdistance classifier (PCA/ MD), partial least squares (PLS), andartificial neural networks (ANN). Classification accuracies of thesespectral models were compared with previously reported accu-racies (Delwiche and Norris 1993) associated with simple lineardiscriminant functions that were based on protein content, NIR-hardness, or a combination of these constituents.
Conditions for MLR ModelingHRW and HRS samples were assigned the arbitrary values
0.0 and 1.0, respectively. Stepwise multiple linear regression wasapplied to the calibration set to determine the best one-, two-,three-, and four-term models, having the general form:
Class =ko+k 1g1 +. . .+kigi
where second differences are designated as g, and gi, and constantsare ko, ki, and ki. The equations were subsequently applied tothe validation and prediction sets, such that a sample was assignedto HRW when Class • 0.5 and to HRS when Class > 0.5. Modelaccuracies were determined as the percentages of HRW and HRSsamples correctly determined.
Conditions for PCA/MD ModelingBefore application of the discriminant function, the calibration-
set spectra were decomposed into their principal components,as described in Lindberg et al (1983). Each spectrum's scores(i.e., the coefficients for each sample, such that when multipliedby their corresponding eigenvector and summed, the spectrumcould be reproduced to within a small error) were used as inputto development of the discriminant function. Separate decomposi-tions were performed on the two wheat classes. When each sam-ple's scores were plotted in multidimensional space, the nearnessof each sample to the group mean was determined in standarddeviation (i.e., Mahalanobis distance) units. These distances werethen normalized against all samples within the calibration setof each class, thereby permitting comparisons between classeswith different magnitudes of standard deviation.
Upon forming a discriminant function for each class, all samplesfrom the validation and prediction sets were tested using the twodiscriminant functions. Assignment of a sample to the winteror spring class was based upon the normalized Mahalanobisdistance to the two groups' means. For each sample, the classwith the smaller distance was then assigned to the sample. Thesame procedure was used in Delwiche and Norris (1993). Compu-tations were performed using the Discrim routine of an MS-DOSspectral analysis program (Lab Calc, Galactic Industries, Salem,NH).
Conditions for PLS ModelingSpectral decomposition was performed in the same manner
as the PCA/ MD method, with the difference that both winterand spring calibration samples were grouped together. Further-more, wavelength regions that demonstrated the most difference
between winter and spring samples were preferentially weightedduring formation of the factors in the manner that defines thedifference between the PLS and PCA algorithms (Lindberg etal 1983). As in the MLR model, winter and spring samples wereassigned the values 0.0 and 1.0, respectively. Likewise, modelaccuracy was determined as the percentage of winter sampleswithin a set that were predicted to have a value less than orequal to 0.5 (the midpoint) and of spring samples with a valuegreater than 0.5. Models of up to 10 factors were examined. Acommercial MS-Windows program (GRAMS/386, Galactic) wasused to develop the models.
An additional PLS model, which excluded the two wavelengthregions of water absorption (1,348-1,500 and 1,830-1,960 nm)in the second-difference data, was examined for the purpose ofassessing the importance of moisture content in the accuraciesof the full-spectrum models. Ideally, a robust model should notbe reliant on differences between mean moisture contents of thetwo classes caused by different crop management practices attime of harvest or differences in postharvest handling. Therefore,a similarity in accuracies between this additional model and thefuller wavelength PLS model would support an argument thatmoisture content alone is not primarily responsible for successfuldifferentiation of HRW and HRS wheats.
Conditions for ANN ModelingCalibration samples from both classes were the input to a feed-
forward back-propagation model (Hecht-Nielsen 1989). The inputlayer consisted of 223 nodes, with each wavelength of the com-pressed second difference spectrum occupying one node. Twonodes representing the HRW and HRS wheat classes formedthe output layer. Modeling was initially performed with and with-out an intermediate (hidden) layer of nodes. Because intermediate-layer models did not demonstrate performance superior to thosewithout one, the intermediate layer was not used in subsequentanalyses. A sigmoidal activation function was applied to eachnode of the output and intermediate layers. The learning rateand momentum were initialized at 0.9 and 0.6, respectively. Upto 50,000 iterations were allowed during training. Software run-ning in the MS-DOS environment was used (Neuralworks Profes-sional II/Plus, Neuralware, Inc., Pittsburgh, PA). A thoroughdiscussion on the application of this algorithm to wheat classifi-cation is given in Song et al (in press).
RESULTS AND DISCUSSION
GeneralA summary of the model performance for the four types of
spectral models and for the constituent-based models is shownin Table I. Model accuracy (i.e., percent of correctly classifiedsamples) is listed for each of the two classes. The average ofthe two accuracies is also listed and represents a figure of meritindependent of the proportion of HRW to HRS samples.
All four spectral models demonstrated that calibration samplescould be correctly assigned to their actual classes at least 90%of the time, and in most cases in excess of 95% of the time.Assuming a 2-3% classification error for what is designated inTable I as the "Actual Class" (Delwiche and Norris 1993), valida-tion and prediction set accuracies of 97% are probably at theupper limit.
Whereas all of the spectral models demonstrated calibration-and validation-set accuracies in excess of 90% (with exceptionof the PCA/ MD model on the HRS validation set), none ofthe protein content, NIR-hardness, or combination of proteinand NIR-hardness models had such accuracies on correspondingsets. Instead, model accuracies of the constituent models weretypically about 85%. Constituent model accuracies were higheron the prediction set, which was formed from the 1990 crop year,primarily because the mean values for protein content of thosesamples (HRW = 13.4%, HRS = 16.0%) were relatively closeto the corresponding mean values for the preceding three yearscombined, which formed the calibration and validation sets,despite the large range in yearly mean protein contents (HRW= 12.1% [1987] to 14.5% [1989], HRS = 14.7% [1987] to 17.0%[1988] from Table I in Delwiche and Norris 1993). The predictionset accuracies of the constituent models were still generally lowerthan the prediction set accuracies of the PCA/ MD, PLS, or ANNmodels. Thus, these full spectral models appear to be necessaryto ensure invariance in accuracy from year to year.
The accuracy of classifying the HRS prediction samplesdropped to less than 90% for the PCA/ MD model. Surprisingly,the MLR model, which was the simplest spectral model, demon-strated accuracies on the calibration and validation sets that werewithin 0.6-4.0% of the accuracies for the two most mathematicallycomplex models, the PLS and ANN models. Of the various (oneto four wavelength) MLR trials examined, a three-term second-difference (X = 1,262, 1,798, and 2,336 nm) model yielded thehighest validation set accuracy and, consequently, it is the MLRmodel shown in Table I. The MLR model accuracy was affectedby the introduction of the new crop year, as demonstrated byan imbalance in prediction set classification accuracy betweenthe HRW samples (100%) and the HRS samples (24.1%). Uponexamining the values for Class (equation 2), it was found thata positive bias occurred in the prediction set samples. Changing
TABLE ISummary of Model Performances for Hard Red Winter (HRW) and Hard Red Spring (HRS)
On Spectral DataOn Constituents, Using Linear PLS`
Discriminant Functionsa (7-factor, less ANN'
Protein NIR Protein & MLRb PCA/MD PLSd H2 0 absorption (9,900Set Actual Class n Content Hardness Hardness (3-term) (8-factor) (7-factor) regions iterations)
Calibration HRW 150 84.0 85.3 87.3 96.0 95.3 98.0 97.3 98.0HRS 150 84.0 87.3 88.7 94.7 90.7 98.0 97.3 98.7Average 84.0 86.3 88.0 95.3 93.0 98.0 97.3 98.3
Validation HRW 892 79.9 86.2 88.5 96.7 92.4 97.3 97.4 97.9HRS 433 76.5 86.4 82.9 93.3 88.4 95.2 94.4 94.9Average 78.2 86.3 85.7 95.0 90.5 96.2 95.9 96.4
Prediction HRW 4719 91.9 68.5 86.2 100.0 (9 5 .4 )h 92.6 91.3 84.9 96.6HRS 2079 90.3 94.9 97.7 24.1 (95.3) 95.6 98.6 98.6 98.0Average 91.1 81.7 92.0 62.1 (95.4) 94.1 94.9 91.8 97.3
aValues derived from Table II of Delwiche and Norris (1993).bMultiple linear regression. The three terms were second differences of log(1 / R) at 1,262, 1,798, and 2,336 nm, with coefficients equaling 1,139.69,954.98, and -389.08, respectively, and a constant of -3.83 (modeling HRW = 0.0; HRS = 1.0).
c Principal component analysis with Mahalanobis distance classifier.dPartial least squares.eSame model as above, excluding 1,348-1,500 nm and 1,830-1,960 nm wavelength regions.'Artificial neural network, feed-forward back-propagation paradigm.9Prediction sets for the MLR and ANN models had an additional 50 samples, yielding n = 521 and 257 for the HRW and HRS sets, respectively.hValues in parentheses are accuracies of the MLR model after bias adjustment (i.e., changing constant from -3.83 to -3.18).
Vol. 72, No. 3,1995 245
the value of ko from -3.83 to -3.18 for the prediction set improvedthe classification accuracy on this set to 95.4% for HRW and95.3% for HRS samples. Only the ANN model demonstrateda higher combined accuracy for the two classes. The fact thata bias adjustment to the MLR model was necessary on the 1990samples is supportive of the earlier statement claiming that fullspectral models ensure yearly invariance.
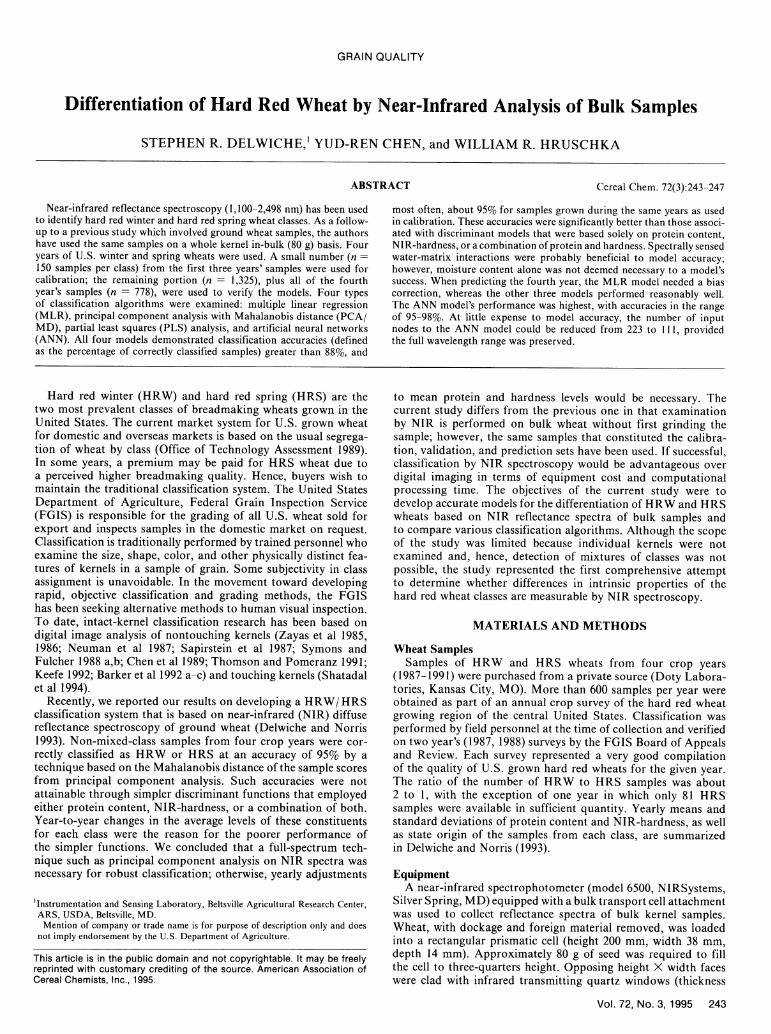
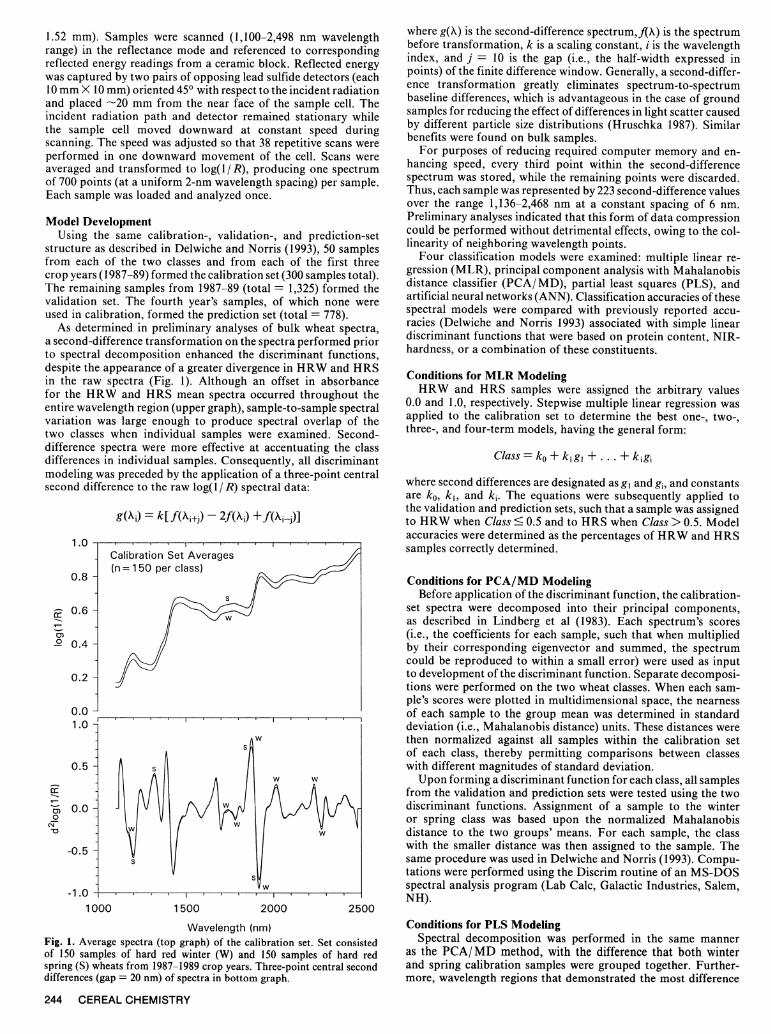
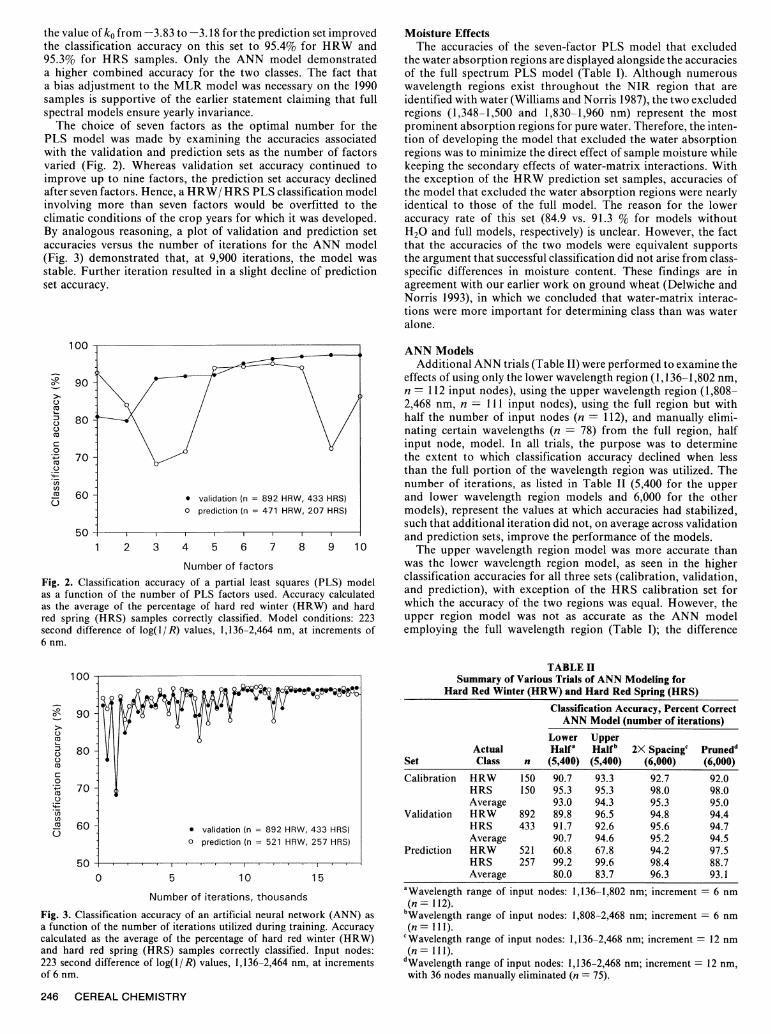
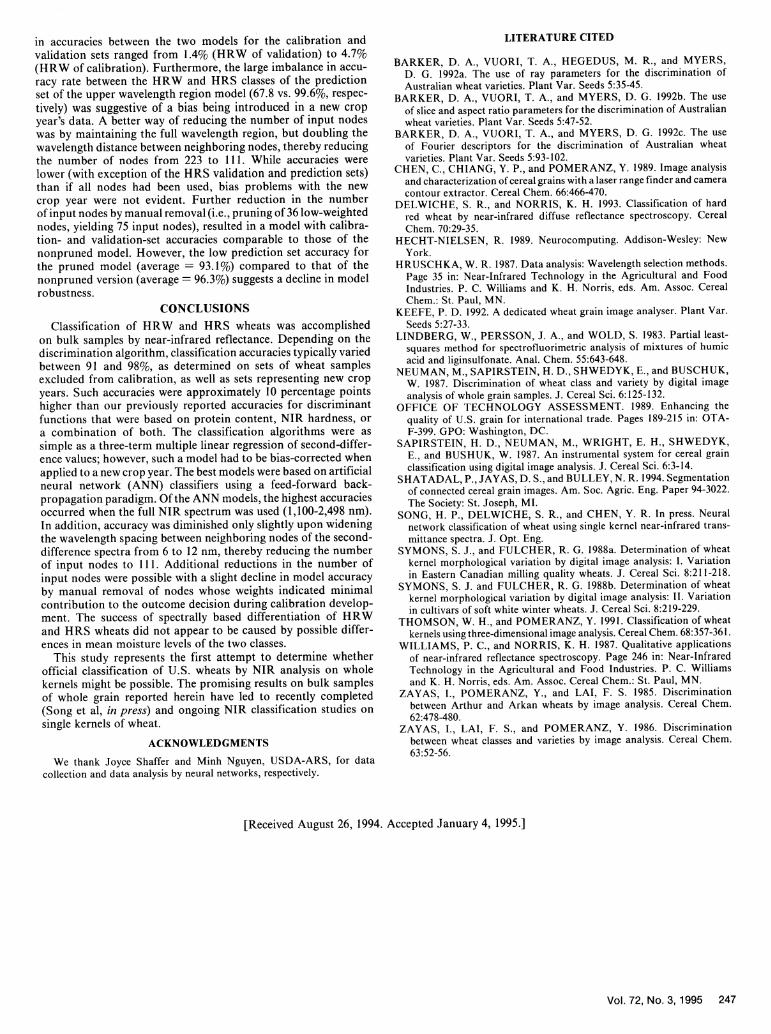
The choice of seven factors as the optimal number for thePLS model was made by examining the accuracies associatedwith the validation and prediction sets as the number of factorsvaried (Fig. 2). Whereas validation set accuracy continued toimprove up to nine factors, the prediction set accuracy declinedafter seven factors. Hence, a HRW/ HRS PLS classification modelinvolving more than seven factors would be overfitted to theclimatic conditions of the crop years for which it was developed.By analogous reasoning, a plot of validation and prediction setaccuracies versus the number of iterations for the ANN model(Fig. 3) demonstrated that, at 9,900 iterations, the model wasstable. Further iteration resulted in a slight decline of predictionset accuracy.
100
0
0Fat
C.
co
0
U,(n
-Co
0)
90
80
70
60
50
Fig. 2. Claas a functias the averred springsecond diff6 nm.
Moisture EffectsThe accuracies of the seven-factor PLS model that excluded
the water absorption regions are displayed alongside the accuraciesof the full spectrum PLS model (Table I). Although numerouswavelength regions exist throughout the NIR region that areidentified with water (Williams and Norris 1987), the two excludedregions (1,348-1,500 and 1,830-1,960 nm) represent the mostprominent absorption regions for pure water. Therefore, the inten-tion of developing the model that excluded the water absorptionregions was to minimize the direct effect of sample moisture whilekeeping the secondary effects of water-matrix interactions. Withthe exception of the HRW prediction set samples, accuracies ofthe model that excluded the water absorption regions were nearlyidentical to those of the full model. The reason for the loweraccuracy rate of this set (84.9 vs. 91.3 % for models withoutH2 0 and full models, respectively) is unclear. However, the factthat the accuracies of the two models were equivalent supportsthe argument that successful classification did not arise from class-specific differences in moisture content. These findings are inagreement with our earlier work on ground wheat (Delwiche andNorris 1993), in which we concluded that water-matrix interac-tions were more important for determining class than was wateralone.
ANN ModelsAdditional ANN trials (Table II) were performed to examine the
effects of using only the lower wavelength region (1,136-1,802 nm,n - 112 input nodes), using the upper wavelength region (1,808-2,468 nm, n = 111 input nodes), using the full region but withhalf the number of input nodes (n = 112), and manually elimi-nating certain wavelengths (n = 78) from the full region, halfinput node, model. In all trials, the purpose was to determinethe extent to which classification accuracy declined when lessthan the full portion of the wavelength region was utilized. Thenumber of iterations, as listed in Table 11 (5,400 for the upper
* validation (n = 892 HRW, 433 HRS) and lower wavelength region models and 6,000 for the othero prediction (n = 471 HRW, 207 HRS) models), represent the values at which accuracies had stabilized,
such that additional iteration did not, on average across validationI I I I I I I , and prediction sets, improve the performance of the models.
1 2 3 4 5 6 7 8 9 10 The upper wavelength region model was more accurate than
Number of factors was the lower wavelength region model, as seen in the higher.ssification accuracy of a partial least squares (PLS) model classification accuracies for all three sets (calibration, validation,
on of the number of PLS factors used. Accuracy calculated and prediction), with exception of the HRS calibration set forrage of the percentage of hard red winter (HRW) and hard which the accuracy of the two regions was equal. However, the(HRS) samples correctly classified. Model conditions: 223 upper region model was not as accurate as the ANN model
Ference of log(l/R) values, 1,136-2,464 nm, at increments of employing the full wavelength region (Table I); the difference
100
-
Co0
0
Cu
co
Cu0
U,coC.)
(-)
90
80
70
60
501 |0 5 10 15
Number of iterations, thousands
Fig. 3. Classification accuracy of an artificial neural network (ANN) asa function of the number of iterations utilized during training. Accuracycalculated as the average of the percentage of hard red winter (HRW)and hard red spring (HRS) samples correctly classified. Input nodes:223 second difference of log(1/R) values, 1,136-2,464 nm, at incrementsof 6 nm.
TABLE IISummary of Various Trials of ANN Modeling for
Hard Red Winter (HRW) and Hard Red Spring (HRS)
Classification Accuracy, Percent CorrectANN Model (number of iterations)
Lower UpperActual Halfa Halfb 2X Spacingc Prunedd
Set Class n (5,400) (5,400) (6,000) (6,000)
Calibration HRW 150 90.7 93.3 92.7 92.0HRS 150 95.3 95.3 98.0 98.0Average 93.0 94.3 95.3 95.0
Validation HRW 892 89.8 96.5 94.8 94.4HRS 433 91.7 92.6 95.6 94.7Average 90.7 94.6 95.2 94.5
Prediction HRW 521 60.8 67.8 94.2 97.5HRS 257 99.2 99.6 98.4 88.7Average 80.0 83.7 96.3 93.1
aWavelength range of input nodes: 1,136-1,802 nm; increment = 6 nm(n = 112).
bWavelength range of input nodes: 1,808-2,468 nm; increment = 6 nm(n = -Il).Wavelength range of input nodes: 1,136-2,468 nm; increment - 12 nm(n= 111).
dWavelength range of input nodes: 1,136-2,468 nm; increment = 12 nm,with 36 nodes manually eliminated (n = 75).
246 CEREAL CHEMISTRY
in accuracies between the two models for the calibration andvalidation sets ranged from 1.4% (HRW of validation) to 4.7%(HRW of calibration). Furthermore, the large imbalance in accu-racy rate between the HRW and HRS classes of the predictionset of the upper wavelength region model (67.8 vs. 99.6%, respec-tively) was suggestive of a bias being introduced in a new cropyear's data. A better way of reducing the number of input nodeswas by maintaining the full wavelength region, but doubling thewavelength distance between neighboring nodes, thereby reducingthe number of nodes from 223 to 111. While accuracies werelower (with exception of the HRS validation and prediction sets)than if all nodes had been used, bias problems with the newcrop year were not evident. Further reduction in the numberof input nodes by manual removal (i.e., pruning of 36 low-weightednodes, yielding 75 input nodes), resulted in a model with calibra-tion- and validation-set accuracies comparable to those of thenonpruned model. However, the low prediction set accuracy forthe pruned model (average 93.1%) compared to that of thenonpruned version (average = 96.3%) suggests a decline in modelrobustness.
CONCLUSIONS
Classification of HRW and HRS wheats was accomplishedon bulk samples by near-infrared reflectance. Depending on thediscrimination algorithm, classification accuracies typically variedbetween 91 and 98%, as determined on sets of wheat samplesexcluded from calibration, as well as sets representing new cropyears. Such accuracies were approximately 10 percentage pointshigher than our previously reported accuracies for discriminant
functions that were based on protein content, NIR hardness, ora combination of both. The classification algorithms were assimple as a three-term multiple linear regression of second-differ-ence values; however, such a model had to be bias-corrected when
applied to a new crop year. The best models were based on artificialneural network (ANN) classifiers using a feed-forward back-
propagation paradigm. Of the ANN models, the highest accuraciesoccurred when the full NIR spectrum was used (1,100-2,498 nm).In addition, accuracy was diminished only slightly upon wideningthe wavelength spacing between neighboring nodes of the second-difference spectra from 6 to 12 nm, thereby reducing the numberof input nodes to 111. Additional reductions in the number ofinput nodes were possible with a slight decline in model accuracy
by manual removal of nodes whose weights indicated minimalcontribution to the outcome decision during calibration develop-ment. The success of spectrally based differentiation of HRW
and HRS wheats did not appear to be caused by possible differ-ences in mean moisture levels of the two classes.
This study represents the first attempt to determine whetherofficial classification of U.S. wheats by NIR analysis on wholekernels might be possible. The promising results on bulk samplesof whole grain reported herein have led to recently completed(Song et al, in press) and ongoing NIR classification studies onsingle kernels of wheat.
ACKNOWLEDGMENTS
We thank Joyce Shaffer and Minh Nguyen, USDA-ARS, for datacollection and data analysis by neural networks, respectively.
LITERATURE CITED
BARKER, D. A., VUORI, T. A., HEGEDUS, M. R., and MYERS,D. G. 1992a. The use of ray parameters for the discrimination ofAustralian wheat varieties. Plant Var. Seeds 5:35-45.
BARKER, D. A., VUORI, T. A., and MYERS, D. G. 1992b. The useof slice and aspect ratio parameters for the discrimination of Australianwheat varieties. Plant Var. Seeds 5:47-52.
BARKER, D. A., VUORI, T. A., and MYERS, D. G. 1992c. The useof Fourier descriptors for the discrimination of Australian wheatvarieties. Plant Var. Seeds 5:93-102.
CHEN, C., CHIANG, Y. P., and POMERANZ, Y. 1989. Image analysisand characterization of cereal grains with a laser range finder and cameracontour extractor. Cereal Chem. 66:466-470.
DELWICHE, S. R., and NORRIS, K. H. 1993. Classification of hardred wheat by near-infrared diffuse reflectance spectroscopy. CerealChem. 70:29-35.
HECHT-NIELSEN, R. 1989. Neurocomputing. Addison-Wesley: NewYork.
HRUSCHKA, W. R. 1987. Data analysis: Wavelength selection methods.Page 35 in: Near-Infrared Technology in the Agricultural and FoodIndustries. P. C. Williams and K. H. Norris, eds. Am. Assoc. CerealChem.: St. Paul, MN.
KEEFE, P. D. 1992. A dedicated wheat grain image analyser. Plant Var.Seeds 5:27-33.
LINDBERG, W., PERSSON, J. A., and WOLD, S. 1983. Partial least-squares method for spectrofluorimetric analysis of mixtures of humicacid and liginsulfonate. Anal. Chem. 55:643-648.
NEUMAN, M., SAPIRSTEIN, H. D., SHWEDYK, E., and BUSCHUK,W. 1987. Discrimination of wheat class and variety by digital imageanalysis of whole grain samples. J. Cereal Sci. 6:125-132.
OFFICE OF TECHNOLOGY ASSESSMENT. 1989. Enhancing thequality of U.S. grain for international trade. Pages 189-215 in: OTA-F-399. GPO: Washington, DC.
SAPIRSTEIN, H. D., NEUMAN, M., WRIGHT, E. H., SHWEDYK,E., and BUSHUK, W. 1987. An instrumental system for cereal grainclassification using digital image analysis. J. Cereal Sci. 6:3-14.
SHATADAL, P., JAYAS, D. S., and BULLEY, N. R. 1994. Segmentationof connected cereal grain images. Am. Soc. Agric. Eng. Paper 94-3022.The Society: St. Joseph, MI.
SONG, H. P., DELWICHE, S. R., and CHEN, Y. R. In press. Neuralnetwork classification of wheat using single kernel near-infrared trans-mittance spectra. J. Opt. Eng.
SYMONS, S. J., and FULCHER, R. G. 1988a. Determination of wheatkernel morphological variation by digital image analysis: I. Variationin Eastern Canadian milling quality wheats. J. Cereal Sci. 8:211-218.
SYMONS, S. J. and FULCHER, R. G. 1988b. Determination of wheatkernel morphological variation by digital image analysis: II. Variationin cultivars of soft white winter wheats. J. Cereal Sci. 8:219-229.
THOMSON, W. H., and POMERANZ, Y. 1991. Classification of wheatkernels using three-dimensional image analysis. Cereal Chem. 68:357-361.
WILLIAMS, P. C., and NORRIS, K. H. 1987. Qualitative applicationsof near-infrared reflectance spectroscopy. Page 246 in: Near-InfraredTechnology in the Agricultural and Food Industries. P. C. Williamsand K. H. Norris, eds. Am. Assoc. Cereal Chem.: St. Paul, MN.
ZAYAS, I., POMERANZ, Y., and LAI, F. S. 1985. Discriminationbetween Arthur and Arkan wheats by image analysis. Cereal Chem.62:478-480.
ZAYAS, I., LAI, F. S., and POMERANZ, Y. 1986. Discriminationbetween wheat classes and varieties by image analysis. Cereal Chem.63:52-56.
[Received August 26, 1994. Accepted January 4, 1995.]
Vol. 72, No. 3,1995 247


![Analysis of Forensic Casework Utilizing Infrared …...Economically-motivated adulteration has plagued the world’s food supply for centuries [22]. Recently, wheat gluten and rice](https://img.pdfslide.net/doc/110x75/5edf0dccad6a402d666a6867/analysis-of-forensic-casework-utilizing-infrared-economically-motivated-adulteration.jpg)