Embed Size (px)
Citation preview

Portland State University Portland State University
PDXScholar PDXScholar
Dissertations and Theses Dissertations and Theses
Fall 11-26-2013
Diffusion of Energy Efficient Technology in Diffusion of Energy Efficient Technology in
Commercial Buildings: An Analysis of the Commercial Buildings: An Analysis of the
Commercial Building Partnerships Program Commercial Building Partnerships Program
Chrissi Argyro Antonopoulos Portland State University
Follow this and additional works at: https://pdxscholar.library.pdx.edu/open_access_etds
Part of the Architectural Technology Commons, and the Construction Engineering Commons
Let us know how access to this document benefits you.
Recommended Citation Recommended Citation Antonopoulos, Chrissi Argyro, "Diffusion of Energy Efficient Technology in Commercial Buildings: An Analysis of the Commercial Building Partnerships Program" (2013). Dissertations and Theses. Paper 1532. https://doi.org/10.15760/etd.1532
This Thesis is brought to you for free and open access. It has been accepted for inclusion in Dissertations and Theses by an authorized administrator of PDXScholar. Please contact us if we can make this document more accessible: [email protected].

Diffusion of Energy Efficient Technology in Commercial Buildings:
An Analysis of the Commercial Building Partnerships Program
by
Chrissi Argyro Antonopoulos
A thesis submitted in partial fulfillment of the requirements for the degree of
Master of Urban Studies
Thesis Committee: Loren Lutzenhiser, Chair
James Strathman Mithra Moezzi
Portland State University 2013

Abstract
This study presents findings from survey and interview data investigating
replication of green building measures by Commercial Building Partnership (CBP)
partners that worked directly with the Pacific Northwest National Laboratory (PNNL).
PNNL partnered directly with 12 organizations on new and retrofit construction projects,
which represented approximately 28 percent of the entire U.S. Department of Energy
(DOE) CBP program. Through a feedback survey mechanism, along with personal
interviews, quantitative and qualitative data were gathered relating to replication efforts
by each organization. These data were analyzed to provide insight into two primary
research areas: 1) CBP partners’ replication efforts of green building approaches used in
the CBP project to the rest of the organization’s building portfolio, and, 2) the market
potential for technology diffusion into the total U.S. commercial building stock, as a
direct result of the CBP program. The first area of this research focused specifically on
replication efforts underway or planned by each CBP program participant. The second
area of this research develops a diffusion of innovations model to analyze potential broad
market impacts of the CBP program on the commercial building industry in the United
States.
Findings from this study provided insight into motivations and objectives CBP
partners had for program participation. Factors that impact replication include motivation,
organizational structure and objectives firms have for implementation of energy efficient
i
technologies. Comparing these factors between different CBP partners revealed patterns
in motivation for constructing energy efficient buildings, along with better insight into
market trends for green building practices. The optimized approach to the CBP program
allows partners to develop green building parameters that fit the specific uses of their
building, resulting in greater motivation for replication. In addition, the diffusion model
developed for this analysis indicates that this method of market prediction may be used to
adequately capture cumulative construction metrics for a whole-building analysis as
opposed to individual energy efficiency measures used in green building.
ii
Acknowledgements
I would like to thank my family, friends and colleagues who provided inspiration,
motivation, and proved to be dedicated supporters of me during this effort. To my parents
Eileen and Konstantinos, you never stopped believing in me and provided a constant
corner of support. To my partner Andrew, your love and encouragement helped me be
successful in this endeavor; I couldn’t have done it without you!
I would like to express the deepest appreciation to my committee chair Professor
Lutzenhiser, whose work has continuously demonstrated the importance of energy
systems in our built environment. In addition, I would like to thank my thesis committee
members Professor Strathman and Mithra Moezzi for providing research guidance. I
would also like to thank Michael Baechler, whose support at PNNL made this study
feasible. Finally, I would like to thank Dr. Heather Dillon for her technical assistance
with diffusion modeling, her constant support, and friendship.
iii
Table of Contents
Abstract ................................................................................................................................ i
Acknowledgements ............................................................................................................ iii
List of Tables .................................................................................................................... vii
List of Figures .................................................................................................................. viii
Chapter 1. Introduction...................................................................................................... 1
The Commercial Building Partnerships Program ........................................................... 3
Chapter 2. Green Building................................................................................................. 7
Regulatory Perspectives on Energy Efficiency in Buildings .......................................... 9
Green Building Programs .............................................................................................. 12
Leadership in Energy and Environmental Design (LEED) ....................................... 13
ENERGY STAR Buildings ....................................................................................... 14
Net Zero Energy Building Certification .................................................................... 15
Chapter 3. Literature Review .......................................................................................... 16
Diffusion of Innovations Theory ................................................................................... 16
Historical Perspectives of the Diffusion on Innovations Theory .............................. 17
Diffusion of Innovations Theory and Energy Efficiency .......................................... 20
Institutional Theory, Corporate Social Responsibility and Business Environmental Management .................................................................................................................. 22
Economics of Energy Efficiency................................................................................... 25
The Energy Paradox .................................................................................................. 27
Chapter 4. Theoretical Framework .................................................................................. 29
Chapter 5. Methodology .................................................................................................. 33
iv

Research Question ......................................................................................................... 33
What is Replication? .................................................................................................. 34
Research Design ............................................................................................................ 34
The Survey Instrument .................................................................................................. 36
Follow-Up Interviews ................................................................................................... 38
Data Analysis ................................................................................................................ 38
CBP Partner Data Analysis........................................................................................ 39
Diffusion Model Development and Analysis ............................................................ 42
Chapter 6. Findings and Discussion ................................................................................ 52
Survey Data and Interview Analysis ............................................................................. 52
CBP Program Participation Details ........................................................................... 54
CBP Partner Replication Trends................................................................................ 58
Motivation and Evidence of Replication ................................................................... 67
Diffusion Model Analysis and Output .......................................................................... 72
Energy Savings Calculations ..................................................................................... 78
Chapter 7. Limitations ..................................................................................................... 81
Chapter 8. Conclusions.................................................................................................... 84
Diffusion Theory Conclusions ...................................................................................... 84
Organizational Theory, Corporate Social Responsibility and Environmental Management Conclusions ............................................................................................. 86
Energy Economics Conclusions .................................................................................... 88
Works Cited ...................................................................................................................... 92
Appendix A: CBP Partner Introductory Letter ............................................................... 100
Appendix B: CBP Partner Survey Instrument ................................................................ 103
v

Appendix C: CBP Partner Follow-Up Interview Questions ........................................... 115
vi

List of Tables
Table 1. Bass Model Parameters Determined from the Raw Data................................... 49
Table 2. Comparison of the USGBC Database with Two Diffusion Models. ................. 50
Table 3. Technologies Replicated from the CBP Program .............................................. 61
Table 4. Bass Model Parameters Determined from the CBP Data .................................. 74
Table 5. Comparison of CBP Construction to Date with Bass Prediction ....................... 77
Table 6. Comparison of CBP Construction with Diffusion Modeling Predictions .......... 85
vii
List of Figures
Figure 1. Commercial Building Partners and Projects ....................................................... 5
Figure 2. Current Commercial Building Energy Code Adoption Status ......................... 10
Figure 3. Adopter Categories and Market Penetration of the Diffusion of Innovations Theory ............................................................................................................................... 19
Figure 4. Traditional Diffusion Curve ............................................................................. 30
Figure 5. Theoretical Framework..................................................................................... 31
Figure 6. CBP Partner Participation by Industry as Reported by Survey Respondents... 40
Figure 7. Percentage of CBP Projects by Building Type ................................................. 41
Figure 8. Current Phase of Construction for Each CBP Partner ...................................... 42
Figure 9. Raw USGBC Data and the Yudelson Model Predictions................................. 47
Figure 10. Raw USGBC Data and the Bass Model Fit for This Study ............................ 51
Figure 11. CBP Partner Program Participation Before, During or After their CBP Building Project, by Percentage of Survey Participation.................................................. 54
Figure 12. CBP Partner Forecast Energy Savings for the CBP Building in the Next 5-10 Years as Reported in the Survey ....................................................................................... 55
Figure 13. CBP Partner Forecast Cost Savings for the CBP Building in the Next 5-10 Years as Reported in the Survey ....................................................................................... 56
Figure 14. CBP Partner Forecast Energy Savings for the Partner Portfolio in the Next 5-10 Years as Reported in the Survey .................................................................................. 57
Figure 15. CBP Partner Reported Number of Buildings with Replication at the Time of the Survey ......................................................................................................................... 60
Figure 16. CBP Partner Reported EEMs by Type and Building Sector .......................... 63
Figure 17. Economic Metrics used by CBP Partners to Measure EEM Cost Effectiveness........................................................................................................................................... 66
viii
Figure 18. Percentage of Organizations with Policies/Procedures for EEM Implementation ................................................................................................................. 68
Figure 19. Survey Responses to CBP Benefits beyond Energy and Cost Savings. Respondents Ranked the Benefits and Percentage of Responses are Shaded. ................. 69
Figure 20. CBP Diffusion Prediction Using the Bass Model, R2=0.95 ........................... 75
Figure 21. CBP Market Penetration Prediction Using the Bass Model ........................... 78
ix

Chapter 1. Introduction
In 2010, the U.S. consumed 97 quadrillion BTUs of energy, spending
approximately $1.2 billion, or roughly 8.3% of total GDP for the country (EIA, 2012). In
2011, U.S. energy consumption resulted in approximately 5.5 million metric tons of
carbon dioxide emitted into the atmosphere (EIA, 2012). U.S. energy consumption equals
approximately 19% of global consumption; a close second only to China which consumes
20% of global totals (DOE, 2012a). While energy production and consumption is
essential for U.S. economic interests, the negative environmental externalities pose
threats to the environment, national security and stress on the overall economy.
Of the overall energy footprint in the U.S., approximately 40% of total primary
energy is consumed by the buildings sector, almost half of which is attributed to
commercial buildings (DOE, 2012a). Furthermore, building codes, which mandate
benchmark safety and building procedures, did not include energy savings considerations
before 1979. According to the most recent Commercial Building Energy Consumption
Survey (CBECS), there were approximately 4.9 million commercial buildings in the U.S.
in 2003, 2.8 million of which were built prior to 1979, when the first energy codes were
enacted (EIA, 2008). Building energy codes help address energy losses through
1
prescriptive requirements for envelope, mechanical and electrical system efficiencies,
thus promoting efficient systems and lowering the overall footprint of the building.
The United States has ambitious goals for increasing efficiency of the nation’s
building stock and lowering the energy footprint of both residential and commercial
buildings. The U.S. Department of Energy (DOE) has commercial building reduction
goals of 20% by 2020, supported by programs through Energy Efficiency and Renewable
Energy’s (EERE) Building Technologies Office (BTO). By 2030, all federal buildings
are required to meet a 30% reduction in energy intensity based on 2003 levels (EISA,
2007; DOE, 2011a). To promote energy efficiency in the buildings sector, EERE utilizes
a multi-pronged effort that includes research to develop new energy efficient building
technologies, regulatory efforts to enforce greater efficiency for new buildings and
equipment, and deployment programs that seek to promote adoption of energy efficient
technologies in new and existing buildings. The Commercial Building Partnerships
(CBP), one example of a DOE program, is a public/private cost-share program addressing
new and existing commercial buildings with the aim of dramatic energy reductions in
new construction and existing buildings (DOE, 2011b). Replication of building measures
utilized in the CBP program could have significant market transformation potential for
the commercial building sector in the U.S in terms of energy savings and promotion of
green building initiatives.
This research focuses on better understanding the CBP program impacts including
investigating how program participants are applying technologies used in their one
2

building project (replication efforts) into other buildings. Analysis of these replication
efforts can provide information about energy savings efforts of individual partners along
with potential market impacts if outcomes of the program are propagated into the entire
commercial building sector.
The Commercial Building Partnerships Program
The CBP program is a limited duration DOE initiative, initially funded in 2008
(CBP I), with a second funding opportunity presented in 2010 (CBP II) through the
American Recovery and Reinvestment Act (ARRA). Selection process for these projects
was competitive, with strict energy savings requirements mandated by DOE. Once
selected, each partner committed to savings goals that were at least 50% greater than
ANSI/ASHRAE/IESNA Standard 90.1-2004 or 2007 for new construction projects, and
retrofit projects were designed to consume at least 30% less energy than either Standard
90.1-2004 or baseline building consumption (DOE, 2011b).
The CBP program includes partnerships of commercial companies, with engineers
and scientists from national laboratories and other energy efficiency experts designing,
implementing and monitoring energy efficient measures for building construction and/or
retrofits (usually one or two building projects per partner). National lab partners include
the Lawrence Berkeley National Laboratory (LBNL), National Renewable Energy
Laboratory (NREL), Argonne National Laboratory (ANL) and the Pacific Northwest
National Laboratory (PNNL). Energy efficiency measures (EEMs) include a broad array
3

of technologies and applications to the building envelope, mechanical systems, electrical
systems and approaches to operations and maintenance (O&M). The national laboratories
provided modeling and design assistance to each partner. A package of EEMs was
developed for each project based on business criteria provided by each partner, along
with measurement and verification (M&V) methods in order to design protocols for
development.
To date, CBP has partnered with 42 entities on 54 specific new construction and
retrofit projects, addressing 8.3 million square feet of commercial building space (DOE
2011b). Total square footage of commercial building floor area held in these portfolios
equals about 4 billion square feet, approximately 6% of the total commercial building
stock in the U.S. (DOE, 2011b; EIA, 2008). While the CBP program only addresses one
or two buildings within an organization’s entire building portfolio, replication of CBP
program measures to all buildings could result in significant energy and cost savings.
Figure1 below provides a list of all companies chosen by DOE to participate in the CBP
program. Green building initiatives strive to promote a “win-win” concept to building
owners and operators by promoting diffusion of technologies that save energy
expenditures, enhance occupant comfort and reduce environmental impacts.
4

Figure 1. Commercial Building Partners and Projects
5

This study presents findings from survey and interview data investigating
replication efforts of each CBP partner that worked directly with the Pacific Northwest
National Laboratory (PNNL). PNNL partnered directly with 12 organizations on new and
retrofit construction projects, which represented approximately 28 percent of the entire
CBP program. Through a feedback survey mechanism, along with personal interviews,
quantitative and qualitative data were gathered relating to replication efforts by each
organization. These data were analyzed to provide insight into two primary research
areas: 1) CBP partners’ replication efforts of technologies and approaches used in the
CBP project to the rest of the organization’s building portfolio (including replication
verification), and, 2) the market potential for technology diffusion into the total U.S.
commercial building stock, as a direct result of the CBP program.
6

Chapter 2. Green Building
As energy intensities and natural resource consumption continues to grow in the
built environment, principles of green building have become more widely adopted
throughout the world. In the United States, buildings account for approximately 41% of
total primary energy consumption, resulting in 2,268 million metric tons of carbon
dioxide emissions (DOE, 2012c). Of total carbon emissions in the United States, the
buildings sector is responsible for 40% of total emissions, consuming approximately 44%
more primary energy than the transportation sector (DOE 2012c). Reducing building
sector energy consumption is a pillar of the nation’s overall plans to decrease greenhouse
gas emissions.
Green building is the process of integrating a variety of technologies into a
building project aimed at increasing the efficiency, health and safety of the project, along
with reducing the overall environmental footprint of the building. No concrete definition
of green building exists, but measures often include site considerations such as location
and orientation, envelope treatments, mechanical system enhancements, materials
selection, water consumption, construction methods and economic considerations
(Retzlaff, 2009). Green building measures that increase energy efficiency have been cited
by many as an efficient way to decrease energy consumption by targeting “low hanging
fruit” before other, more expensive measures such as onsite renewable energy generation
7

systems (Harmelink et al., 2008; ürge-Vorsatz et al., 2007; Sachs et al., 2004; Reinhardt,
2000). This premise, along with federal and state incentives, has helped advance the
green building industry over the past couple of decades.
Energy efficiency measures implemented in green building practices include
envelope treatments such as insulation, air sealing, installation of advanced windows and
roofing materials. Mechanical system improvements include Heating, Ventilation, & Air
Conditioning (HVAC) system size optimization and programmable thermostats or other
whole-building intelligent software. Electrical systems include lighting retrofits and
installation of energy-saving lighting technologies such as compact florescent or light
emitting diode (LED) lighting. In addition, architectural design applications such as
building orientation, site evaluation, daylighting and other structural considerations can
help increase the efficiency of buildings (Wilson, 1998; Melton, 2012, Kebert, 1999).
The goal of optimizing these building systems is to promote the most efficient operation
of the structure, reducing the environmental footprint as much as possible.
In addition to envelope, mechanical, electrical and structural components,
renewable energy systems are increasingly being used to offset the overall footprint and
energy consumption of buildings. Solar photovoltaic, various thermal systems, small
wind and other renewable energy technologies help buildings decrease their overall
footprint, with some achieving zero net energy. Zero net energy buildings combine
efficiency gains with onsite production of renewable energy with the goal of producing as
much annual energy as they consume (Marszal et al., 2011; Torcellini et al., 2006). Many
8
developers and energy efficiency programs have eventual goals of achieving zero net
energy within the built environment.
Not only do green building approaches apply to specific buildings, but increasing
attention to sustainable community and urban development incorporates green building
perspectives to the overall infrastructure of the built environment. Planners, city officials,
developers and academics are investigating the role that green building technology
advancement plays in developing sustainable communities (Getter and Rowe, 2006;
Ding, 2008). Advancement of green building initiatives helps lay stronger foundations for
future sustainable city and urban development.
Regulatory Perspectives on Energy Efficiency in Buildings
The primary regulatory mechanism for energy efficiency in buildings is promoted
by building energy codes, which now exist in almost every state for the construction of
new buildings (DSIRE, 2012). Building energy codes are adopted on a state or local level
based on the International Energy Conservation Code (IECC) for residential buildings,
and the American Society of Heating, Refrigerating and Air Conditioning Engineers
(ASHRAE) Standard 90.1 for Commercial Buildings (ICC, 2012; ASHRAE, 2010).
Building energy codes provide a benchmark for systems within a building that includes
both prescriptive and performance options for compliance. Codes vary by state, city and
county in some cases, and are based both on the efficiencies outlined by ASHRAE 90.1
9
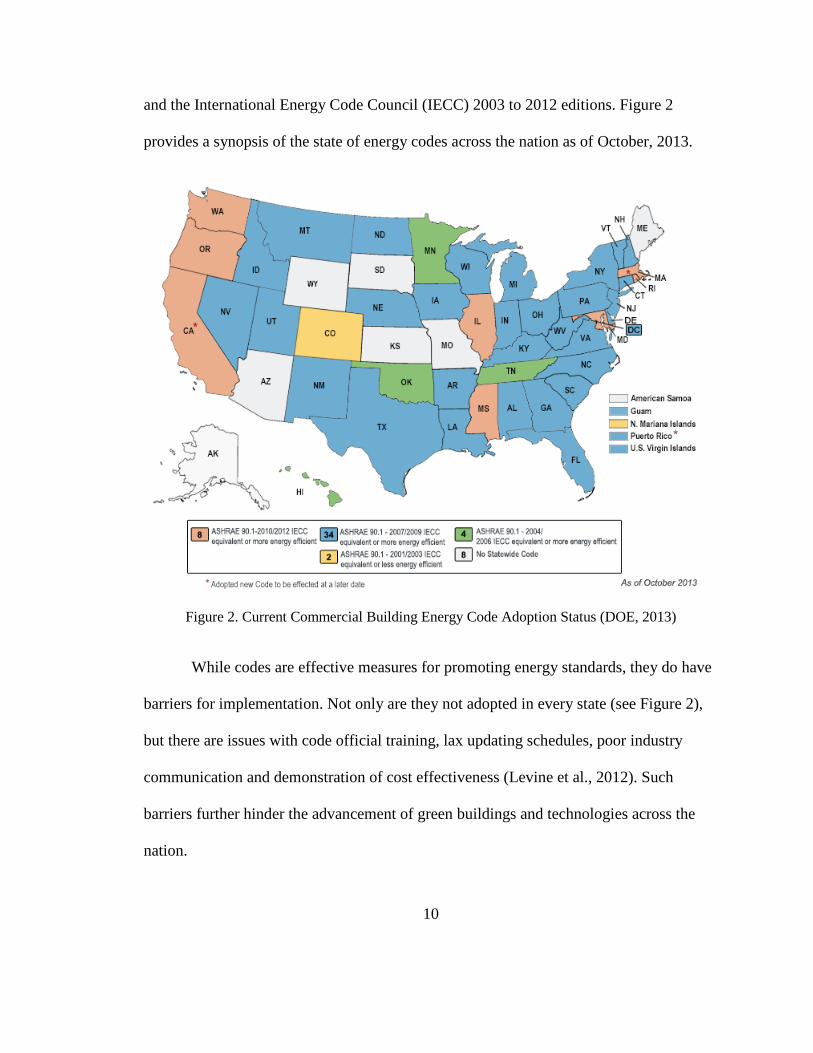
and the International Energy Code Council (IECC) 2003 to 2012 editions. Figure 2
provides a synopsis of the state of energy codes across the nation as of October, 2013.
Figure 2. Current Commercial Building Energy Code Adoption Status (DOE, 2013)
While codes are effective measures for promoting energy standards, they do have
barriers for implementation. Not only are they not adopted in every state (see Figure 2),
but there are issues with code official training, lax updating schedules, poor industry
communication and demonstration of cost effectiveness (Levine et al., 2012). Such
barriers further hinder the advancement of green buildings and technologies across the
nation.
10
In addition to building energy codes, the U.S. Department of Energy (DOE) has
commercial building reduction goals of 20% by 2020, supported by programs through
Energy Efficiency and Renewable Energy’s (EERE) Building Technologies Office
(BTO). By 2030, all federal buildings are required to meet a 30% reduction in energy
intensity based on 2003 levels, per EISA 2007 (DOE, 2011a). To promote energy
efficiency in the buildings sector, EERE utilizes a multi-pronged effort that includes
research to develop new energy efficient building technologies, regulatory efforts to
enforce greater efficiency for new buildings and equipment, and deployment programs
that seek to promote adoption of energy efficient technologies in new and existing
buildings. The CBP program, part of this outreach approach to the private sector,
optimizes new buildings to achieve 50% greater energy savings over ASHRAE Standard
90.1 (2004 version) and retrofits 30% savings over ASHRAE Standard 90.1 or current
consumption levels determined through building energy modeling software (DOE,
2011b).
The CBP program is one example of a voluntary program for green building.
Outside of building codes, voluntary programs are another effective driver for energy
efficient buildings, by providing a prescriptive and/or performance approach to energy
efficiency and promoting environmentally conscious building science. Voluntary
building energy and environmental labeling programs can achieve great energy
reductions (often far more than prescriptive codes) and further promote green
development. It has been noted that the most effective way to promote green
11

infrastructure is to combine regulatory mechanisms such as codes with voluntary labeling
programs and financial incentives (Levine et al., 2012). The following section discusses
some of these approaches.
Green Building Programs
Another driver for energy efficiency in buildings includes voluntary labeling
mechanisms designed to distinguish efficient buildings from non-efficient ones. Such
programs include the U.S. Green Building Council’s Leadership in Energy &
Environmental Design (LEED) program, which certifies buildings in one of four
competitive levels: certified, silver, gold and platinum (USGBC, 2012). The Better
Buildings Initiative, initially funded by Recovery Act dollars, was expanded by President
Obama in 2011 to increase commercial and industrial buildings efficiency 20% by 2020
(DOE, 2012b). These programs, along with many others, are designed to transform the
energy efficiency market, spurring increased private investment in energy efficiency
technologies and aiding market development; the CBP program can be seen as another
example of such programs. Participation in voluntary programs, such as LEED or
ENERGY STAR provides whole-building packages that optimize energy efficiency from
a building science perspective (DOE 2012a).
While the federal government has established programs for energy efficiency,
there are many other models that have been developed by utilities, non-governmental
organizations and local governments. Because of this, efficiency programs tend to be
12
fragmented (Blumstein et al., 2005). One result is that replication and direct influences on
market transformation is not well understood.
Leadership in Energy and Environmental Design (LEED)
One of the most widely adopted green building programs in the U.S. is the
USGBC’s LEED program. Currently, there are nine different rating systems that award
different points for various green attributes within the building project. Levels of LEED
certification include LEED Certified (40-49 points), LEED Silver (50-59 points), LEED
Gold (60-69 points) and LEED Platinum (> 80 points) (USGBC, 2013). Unlike some of
the state and federal programs, participants pay for certification.
LEED scoring systems cover broad categories of green building attributes
including sustainable sites, water efficiency, energy and atmosphere, materials and
resources, indoor environmental quality, innovation in design and regional priority
(USGBC, 2013). Although successful, LEED has been criticized in recent years with
many questioning the measured and verified energy savings within the scoring
mechanism of the program. Some analyses have determined that LEED certified
buildings do not have guaranteed superior energy performance compared to non-LEED
certified buildings (Levine et al., 2012). Regardless, with over 55,000 buildings certified
across the country, LEED does represent the greatest set of voluntarily certified green
buildings in the U.S. As such, this study leveraged LEED data for calibration of the
13
diffusion model used to address the second part of the research question (see Chapter 5,
Methodology).
ENERGY STAR Buildings
The ENERGY STAR Buildings Labeling program began in 1999 and is a
voluntary building design and labeling system for commercial buildings. The program
provides two scoring mechanisms, the first being to design a prototype building to
perform better than the median performance of buildings in the nation. The second
scoring mechanism is a 1-100 ENERGY STAR score, requiring a score of 75 in order to
meet certification standards. The score is based on the building’s estimated energy use
relative to similar buildings nationwide. On average, these buildings consume 35% less
energy than other similar buildings across the country (EPA, 2013). Other similar
buildings are not measured based on energy code, but instead use site consumption
metrics as a means for comparison. This approach to consumption metrics is an effort to
control for varying codes and standards throughout the U.S.
Unlike LEED, the ENERGY STAR program includes a measurement and
verification period for one year after the building is constructed, that monitors
performance once the building is occupied. The tool, called the Portfolio Manager is
designed to help ensure that building goals are met, and energy performance is
maintained over a period of time. To date, ENERGY STAR has partnered with over
5,000 organizations that represent 35% of the Fortune 500 companies, including major
14
league sports teams, small businesses, colleges/universities, and cities/towns working on
sustainable urban infrastructure or large development projects (EPA, 2013).
Net Zero Energy Building Certification
The Net Zero Energy Building Certification program is part of the International
Living Future Institute, based on the Living Building Challenge. In order to qualify for
certification, a building must meet actual performance standards, as opposed to modeled
or anticipated energy performance (International Living Future Institute, 2012). In
addition, the building must be constructed to incorporate renewable energy systems along
with waste processing systems, making it more aggressive than LEED or ENERGY
STAR. The program also has an equity and design component as well as requirements on
how the building interacts with the surrounding habitat (International Living Future
Institute, 2012). The Net Zero Energy Building Certification program strives to integrate
architectural design, art, landscape and green building.
The program is new and only began certifying residential and commercial
buildings in 2010, with 11 buildings being certified as of September, 2013. Although
there are only a few number of total certifications, the program is more rigorous than
other green building programs, providing a platform for advancement of net zero building
approaches.
15
Chapter 3. Literature Review
Literature review for this research focused on three primary areas. The first area
explores classic diffusion of innovations theory, which provides the theoretical
background for analyzing potential market impacts of the CBP program. The second area
focuses on corporate social responsibility, organizational theory, and environmental
management, which provides foundations for organizations’ motivations for
implementing sustainability protocols and energy efficient technologies. The third body
of literature explored focuses more specifically on the economics of energy efficiency
and related policy, including the energy paradox which provides a behavioral perspective
to efficiency gains. Focus on economics provides additional background motivations for
organizations’ participation in green building programs and was cited by survey and
interview respondents as the primary motivation for participating in the CBP program.
Diffusion of Innovations Theory
The discussion of diffusion theory explores two primary areas. First, the historical
significance of diffusion of innovations theory is discussed, including modeling
techniques used by various industries. Second, literature pertaining specifically to energy
efficient technologies and green building is presented, utilizing the diffusion of
innovations theoretical framework.
16

Historical Perspectives of the Diffusion on Innovations Theory
New innovations have been introduced into society for as long as humans have
developed communities. At its core, innovation diffusion occurs due to social
interactions, but has more traditionally been measured by other economic indicators such
as capital accumulation (Fagerbert, 2003). One of the first social scientists to study
innovation diffusion was Joseph Schumpter, who in the 1930’s analyzed the role of
innovation in economic and social change (Schumpter, 1949). Schumpter first defined
innovation as “new combinations” of existing resources that became a driver for
economic development, and that these activities were spurred by entrepreneurs
(Fagerbert, 2003). While Shumpter’s focus was more on the innovation process, his
insight provided foundations for analyzing market penetration of new products. Later
work by many scholars and academics further explored innovations, defining product and
process innovations separately, which is not discussed here since it is out of scope for this
research.
The diffusion of innovations theory also has a spatial component, especially in the
context of urban studies. Different areas, with varying resource availability will innovate
and adopt new technologies based on regional perspectives. City-system development is
dependent on the organizational structure and resource availability of an area, which
requires diffusion studies to take into account the spatial structure of these organizations
(Pred, 1974; Pred, 1975). This organizational structure spurs urban growth and regional
economic development in measurable ways. The first way urban advancement is diffused
17
is through contagious spread of “clustered growth” which is a result of concentrated
advancement from a central area (Hudson, 1969). This idea originated from Torsten
Hägerstrand, who also noted that diffusion occurs concentrically, with through a central
location, known as the “initial frontier” (Hägerstrand, 1965).
From an analytical perspective, diffusion of innovations theory (pertaining to
technology transfer) was developed in the 1960’s by Everett Rogers as a means to
describe the process of technical change and advancement of innovation within a culture
over time (Rogers, 1995). Rogers has been cited as providing the technical outline for
most energy efficiency diffusion analysis (Shove, 1998). Mathematically, the primary
model used to measure diffusion in markets, per Roger’s theory, was developed by Frank
Bass in 1969. This model was used in this research and is discussed in detail in the
Methodology chapter of this thesis.
Technology diffusion happens over five primary “adopter” categories, resulting in
an S curve when analyzed over time, as presented in figure 3 below. New ideas
developed by innovators are introduced into the market with very little penetration and
are first accepted by early adopters. The next adopter categories are the early and late
majorities, and eventually the laggards (Rogers, 1995). The result is a description of the
process, based largely on communication channels, in which new products become
adopted by a population or society.
18

Figure 3. Adopter Categories and Market Penetration of the Diffusion of Innovations Theory (Rogers, 1995)
The period of time between when the innovation is developed and eventually
saturated into the market can vary greatly. This can be due to lags in commercialization,
lack of adequate materials, or general lack of a well-defined product/idea (Fagerbert,
2003; Kline and Rosenberg, 1986; Rogers, 1995). Analysts tasked with exploring
technology diffusion develop coefficients or other assumptions to control for these
varying factors that impact the diffusion process within different markets or technology
sectors.
Finally, another approach to diffusion theory is to model technology adoption and
substitution of products. The traditional approach for this type of analysis is coined the
Fisher-Pry model, developed in the 1970’s (Fisher and Pry, 1971). The model has been
used to explore the number, order of magnitude and pace of new technology adoption in
19

society (Norton and Bass, 1987). The model assumes a 50% substitution rate for
technology adoption, and note “many technological advances can be considered as
competitive substitutions of one method of satisfying a need for another” (Fisher and Pry,
1971). The 50% technology substitution assumption is built into the equation, making it
more difficult to adapt to a broad range of market analyses.
Diffusion of Innovations Theory and Energy Efficiency
The energy efficiency technology and green building industries have seen
tremendous innovation and growth in recent decades. Market analysis of technology
innovations and effectiveness of technology transfer has been studied utilizing the
diffusion of innovations theory and modeling. On an international scale, one recent study
found that distance plays a large role in dissemination of energy efficient knowledge;
countries far from innovators are less likely to obtain knowledge related to energy
efficiency (Verdolini and Galeotti 2010). In addition, higher rates of diffusion of energy
efficiency technologies have been associated with greater technological learning and
information availability (Weiss et al., 2010; Claudy et al., 2011).
The literature relating to diffusion modeling being used specifically for green
building applications is more sparse. There are studies, but most focus on specific
technologies, not the entire energy efficient building as the product diffused. This
research aims to add to the literature, providing an analytical method for energy
efficiency diffusion on a whole-building scale. Yudelson (2005) used a diffusion model
20
to predict market penetration of USGBC LEED buildings. In his analysis, he utilized a
Fisher-Pry model for technology substitution in order to predict the future diffusion of
LEED buildings in the commercial sector (Yudelson, 2005). Thus one weakness of using
the diffusion of innovations for this study could be that there are not many proven
analytical methods to reference and use in building the CBP model. However, the
strengths of the model, including diffusion models’ potential accuracy in predicting
market penetration of energy efficiency may be a useful tool for analyzing green building
programs.
Different versions of the Bass model have been used to predict energy efficiency
technology diffusion in the building sector by several authors. The work of Elliott et al.
(2004) used a modified version for specific building technologies including condensing
furnaces, compact fluorescent lights, and low-emissivity windows. The authors
determined coefficients (p and q) and market potential for each individual building
technology or energy measure separately. Andrews and Krogmann (2009) compared
1992 and 2003 CBECS data to explore key technology diffusion trajectories and energy
intensities over time. In more recent work, Kok et al. (2011) analyzed green building
diffusion in U.S. property markets, estimating that 30% of commercial office space in
large metropolitan areas is ENERGY STAR certified, and 11% LEED certified. This
research expands on the diffusion modeling literature by providing a method for
analyzing diffusion potential of energy efficient commercial buildings on the whole-
building scale.
21

A related perspective to technology diffusion is energy efficiency market
transformation. Market transformation occurs in the later phases of innovation, once a
particular idea has significantly penetrated the market. Research has shown that for the
commercial building energy efficiency industry, process change should occur in three
levels: 1) making energy efficiency relevant, 2) encouraging demand and
institutionalizing energy efficiency in the market place, and 3) standardization within the
development/design process (Lutzenhiser et al., 2001). These principles speak to the
importance of program development and administration.
Institutional Theory, Corporate Social Responsibility and Business Environmental Management
There is a wide body of literature existing that explores traditional institutional
and organizational theory. Most relevant to this research is neoinstitutuional theory which
includes neoclassical economic notions such as optimization, marginality and equilibrium
(Scott, 2008). Institutional theory research investigates both internal and external
influences on firms that motivate them to adopt values, policies and procedures to
minimalize risk. Such pressures have been identified as coercive, normative and mimetic
pressure (DiMaggio and Powell, 1991; Scott, 2008). Much focus has been paid to
understanding firm motivations to adopt environmental management practices. In
general, organizational structure and management institutional pressures contribute
greatly to the environmental management program instituted by a firm. Non-market
pressures (customers, stakeholders etc.) tend to be business drivers and support enhanced
22
voluntary environmental management to elevate the company. Such measures are
supported by marketing departments. In contrast, market pressures are handled through
the legal department of a firm and are seen as risk mitigation for future regulations
(Delmas and Toeffel, 2008; Alberini and Segerson, 2002).
Whether an organization decides to purchase or introduce energy efficiency
measures, originally installed during their participation process of the CBP program
depends on economics of the project (as discussed in the findings chapter), and
organizational structure or behavior. A growing literature is focusing on the behavioral
sciences to investigate non-monetary motivations for increased energy efficiency (Allcot
and Mullainathan, 2010). This section explores organizational motivations for replication
by CBP partners, outside of cost savings. In an effort to measure CBP partner motivations
to replicate energy efficiency measures into other buildings, a portion of the survey and
interview was dedicated to non-monetary motivations.
Corporate social responsibility (CSR) initiatives are becoming mainstream in
most markets today. Environmental corporate social responsibility is a loosely defined
term pertaining to the role of self-regulation within private corporations regarding
environmental protection (Portney, 2005; Lyon and Maxwell, 2008). From a market
perspective, CSR is promoted by both demand and supply side forces. On the demand
side, the largest factors are the level of competition of firms, investor influences and labor
retention through CSR practices. On the supply side, efficiency can be enhanced by
reducing waste and streamlining the production process; often this can present a cost
23
effective approach to abating the “low hanging fruit,” so to speak (Lyon and Maxwell,
2008; Reinhardt, 2000). Market forces also are at play in the international arena; firms
with production facilities in countries with lax or nonexistent laws, transfer their CSR
practices to their facilities overseas, thus promoting a higher level of environmental
protections in countries that otherwise have little or none (Portney, 2005).
There are many political forces that support CSR programs. Voluntary pollution
prevention programs are supported by industries primarily due to their cost effectiveness.
The CBP program is an example of a voluntary program aimed at reducing the building
environmental footprint. In many cases, the cost of voluntarily lowering toxic chemical
use (for example) is significantly less than the costs associated with complying with a
federal regulation mandating abatement. In other words, it often makes economic sense to
voluntarily institute environmental measures as opposed to waiting for regulations to be
enacted. Blackman (2010) supports this notion by identifying a firm’s cost-maximizing
potential by balancing the expected marginal penalty with the marginal abatement costs.
Regulations to control pollution will shift either curve (supply or demand), causing the
equilibrium to shift down, thus reducing profits. Voluntary practices to reduce emissions
can help keep profits maximized, typically because the private sector can lose profits in
order to comply with new standards (Porter and Van der Linde, 1995). While economic
in nature, these are some of the underlying principles of CSR and business environmental
management.
24

Another motivating factor besides cost and energy reduction, impacting the
willingness of companies to engage in increased energy efficiency or other sustainable
building programs is overall organization culture. Organizations that encourage CSR
programs or are environmentally minded tend to be more willing to invest in technologies
or applications that improve building or operational efficiency (Kahanna et al., 2007).
Likewise, companies with socially conscious CEOs or upper management are also more
likely to have voluntary environmental programs (Delmas and Toffel, 2008; Ervin et al.,
undated; Martin et al., 2012). In terms of CBP partners, all participants interviewed for
this study indicated that CSR, company culture, and sustainability initiatives played a part
in the organization’s willingness to participate in the CBP program and invest the upfront
capital necessary for efficiency upgrades in new or existing building. One respondent
identified that the CBP program was an opportunity to increase education, awareness and
competency for sustainable operations. However, all respondents indicated that cost
savings was their primary motivation.
Economics of Energy Efficiency
The previous section discusses corporate social responsibility and the economics
of motivating businesses to participate in business environmental management programs
as an underlying motivator for companies. While also exploring economic considerations,
this section focuses specifically on the economics of energy efficiency, namely in the
built environment.
25
In addition to realizing increased efficiency, installation of energy efficient
technologies has been determined by many to provide economic gains. Overall building
design can help achieve energy and cost savings. For example, design solutions for
existing commercial buildings based on climate zone in which the building is located has
been estimated to have a cost savings potential of 10—20% (Belzer, 2009). Other studies
point to economic gains from lower operation costs of HVAC systems due to increased
envelope efficiencies (Kneifel, 2010; Howarth, 2010). Analysis of the CBP program will
provide further insight into the possible savings associated with energy efficiency
installments.
The terms “triple bottom line” and “win-win-win” are used to describe firms who
are trying to maximize profits, reduce costs and protect the environment. In an effort to
achieve this, many companies aim for product differentiation and profit maximizing
potential (Reinhardt, 2000; Blackman, 2010; Lyon and Maxwell, 2008). They are also
motivated as a way to abate future costs associated with complying with regulations.
Voluntary pollution prevention programs are supported by industries primarily due to
their cost effectiveness.
Interestingly, Lyon and Maxwell (2008) note that there is little measureable
societal benefit from such programs. This could be a foreseen conclusion, since it aligns
with some of the open-access theories of environmental economics. If CSR methods do
not optimize environmental protections, then they must act as a profit maximization tool
for corporations. While CSR should be promoted, it will not alone act to optimize the net
26
benefits to society of environmental protection. This is because of the open-access issue
associated with many public goods. Firms do not have incentive to stop consuming at the
point that rents are maximized; instead they will consume (or degrade the environment)
until their total cost curve crosses their total benefit curve. This naturally results in
overconsumption since the profit maximizing point is well beyond the rent maximizing
point of consumption.
The literature supporting both efficiency and economic gains varies greatly. Some
economists argue that although analysis of potential savings is positive, behavior patterns
have yet to support development of efficiency markets (Gillingham et al., 2009). Others
assert that cost-saving strategies such as efficient lighting systems or ENERGY STAR
electronics increase when firms participate in public programs, but only because the firm
did not have the information prior to participating in the program (Howarth et al., 2000).
In other words, companies are always as efficient as possible and once they know that
installation of efficient lighting systems will reduce operation costs, the will not hesitate
to install these measures. This represents full market penetration, in terms of adoption
trends of the diffusion of innovations theory.
The Energy Paradox
Many argue that market penetration of energy efficient technologies is much
lower than the potential savings of those technologies, a term dubbed the “energy gap” or
“energy paradox” (Jaffe and Stavins, 1994; Alcott and Mullainathan, 2010; Klemich,
27
2013). The goal of this research is to add to the literature and support methods for better
understanding energy efficiency program replication over time, through analysis of a
well-established public-private energy efficiency program. One aspect of energy
efficiency programs that is greatly criticized is the fact that buildings are designed from
model outputs that do not account for human behavior, representing investment barriers
(DeCanio, 1993; Deuble and de Dear, 2012). This issue is recognized by many green
building programs and efforts to remedy this issue by promoting longer-term
measurement and verification periods are being taken.
Market barriers for energy efficiency have been a focus of the current
administration and continue to be focused on by scholars (Charles, 2009; Hoffman and
Henn, 2008). Diffusion of advanced technologies tends to be gradual (Jaffe and Stavins,
1994). Some technologies analyzed in the CBP program are new technologies that have
not been on the market long, so it is likely those technologies in stand-alone analysis will
penetrate the market rather slowly. However some technologies, especially those with
short payback such as LED lighting are being replicated by all partners and will likely
diffuse into the market more quickly than preceding technologies, such as CFL lamps.
28
Chapter 4. Theoretical Framework
Diffusion theory provides the background for the theoretical framework of this
research. Traditional innovation or technology diffusion theory was developed in the
1960’s by Everett Rogers as a means to describe the process of technical change and
advancement of innovation within a culture over time (Rogers, 1995). Technology
diffusion happens over five primary “adopter” categories, resulting in an S curve when
analyzed over time. New ideas developed by innovators are introduced into the market by
early adopters, then through the early and late majorities, and eventually the laggards
(Rogers, 1995). The result is a description of the process, based largely on
communication channels, in which new products become adopted by a population or
society.
This research uses diffusion theory to explore potential outcomes of building
programs and partnerships on energy intensities in the commercial building industry.
While Rogers’ diffusion of innovations theory has been widely used in market research
for technology adoption, application of this theory to commercial building energy
efficiency is relatively new in terms of a whole-building approach to energy savings.
Figure 4 is a representation of Rogers technology adoption curve, representing each
phase of market transformation.
29

Figure 4. Traditional Diffusion Curve (Patenaude, 2011)
The proposed theoretical framework for this study builds off of Bass and Rogers
diffusion of innovations S-curve, applying the diffusion theory to the CBP program, and
beyond. CBP participants, although motivated by cost savings, represent early adopters
within the curve, expanding to partner portfolios, and the entire stock of commercial
building square footage in the United States. As the suite of measures included in the
CBP program is replicated, the potential for market transformation through technology
diffusion is realized.
Figure 5 below represents the proposed framework and model for this study based
on the diffusion of innovations theory. Instead of the S-curve illustrated in Figure 4
above, this framework displays market diffusion from the innovators represented in the
smallest circle, out to full market penetration, represented by the largest circle. The
30

gradual evolution of the energy efficiency market within the commercial sector begins
with the innovators and ends with laggards. The CBP program is identified as an
innovator because it promotes an optimized approach to designing a suite of energy
efficient approaches that optimize energy performance of the building. This is different
from other programs that require a checkbox-style approach to green building.
Figure 5. Theoretical Framework
Each level of adopters represented within the circles of the conceptual framework
is a result of a primary outcome of their market experience. For the CBP partner specific
projects, a package of energy efficiency measures (EEM’s) were optimized based on
31
building use, cost and energy savings then implemented into the building project. The
second circle, “CBP Partner Portfolios”, represents the replication efforts of each partner
based on their optimized EEM package. The third circle, “Early/Late Majority,” represent
broader market adoption and validation of EEM packages. Finally, “Commercial
Building Industry,” is characterized by what Rogers refers to as “laggards,” the final
saturation level realized after industry best practices have been identified and
documented. In the case of commercial building energy efficiency, market saturation or
transformation would occur when price and energy savings packages are maximized.
32

Chapter 5. Methodology
This research utilized two approaches to understand specific CBP partner program
experience, and potential market impacts for full CBP deployment within the commercial
building industry in the United States. This section discusses the specific research
question and research design for this effort.
Research Question
The broad goal of this investigation is to analyze the CBP program critically in an
effort to better understand the impacts of public/private partnership energy efficiency,
including overall energy savings, cost-effectiveness and behavioral changes. More
specifically, this study aims to analyze direct impacts of the CBP program on the building
portfolios of participants in an effort to determine the overall influence the program has
had on the larger building portfolios of CBP partners.
The focus of this study addresses two primary research questions:
1. How are CBP partners replicating specific measures, treatments and processes throughout their building portfolios? How are these efforts verified?
2. How are efforts undertaken through the CBP program diffusing into the overall commercial building industry?
33

By exploring these questions, this study aims to provide insight into how firms
replicate the measures of one building project, and their participation in the CBP
program, into the rest of their building portfolios. Additionally, a better understanding of
CBP program replication can help correlate the design of public/private partnerships for
buildings energy efficiency. This includes analysis of the program structure, individual
results and how those results translate into the remaining building stock held by the
owner/operator.
What is Replication?
For this study, replication refers to the implementation of building science
measures, such as envelope, HVAC and lighting treatments into other buildings owned
by a company. Specifically, this refers to transferring EEMs from the CBP building
project into the rest of the company’s building portfolio. Factors that impact replication
include motivation, organizational structure and objectives firms have for implementation
of energy efficient technologies. Comparing these factors between different CBP partners
may reveal patterns in motivation for constructing energy efficient buildings, along with
better insight into corporate environmental management.
Research Design
In order to study replication of the CBP program, this study surveyed program
participants regarding their participation in the CBP, including motivations, desired
outcomes and continuing efforts. The survey was created, distributed in May, 2013, and
34
followed up with personal interviews with each participant. While the CBP program
represents a significant amount of commercial building space in the United States, the
total number of participants is relatively small. There are a total of 42 CBP partners,
whose building portfolios amount to approximately 3.6 billion square feet of commercial
building space (DOE 2013). The survey instrument was distributed to 11 individual
partners (12 projects), representing 858 million square feet of commercial building space,
about 1% of all commercial square footage in the United States, and 28% of all CBP
participant building portfolios.
Because this research is focused on impacts of a specific program, the sample
analyzed was not chosen at random, and pretests were not utilized to enhance the survey
mechanism. In its entirety, the CBP program is consulted by four national laboratories:
Lawrence Berkeley National Laboratory (LBNL), National Renewable Energy
Laboratory (NREL), Argonne National Laboratory (ANL) and the Pacific Northwest
National Laboratory (PNNL). Data was gathered through the specific partners of the
PNNL. Due to confidentiality protocols, specific partner names are not used in this
analysis, however, a full list of CBP partners is available from the U.S. Department of
Energy (DOE, 2013).
Selection of each CBP participant was a competitive process through DOE (DOE,
2013). Once selected, each participant was partnered with one of the three national labs to
act as building consultants. This partnership resulted in a design-build process to carry
out the construction or retrofit project based on modeling results, company objectives and
35
program requirements. The consulting teams from each lab were comprised of people
with similar backgrounds and education including engineers, building scientists, energy
analysts and program managers. As such, this study makes the assumption that NREL,
LBNL, ANL and PNNL’s approach to optimizing EEM packages for their CBP partners
are alike. That is to say that the same project conducted by any of the three labs would
result in nearly identical approaches to energy and cost savings.
Protocol development for this study was aimed to ensure that data gathered from
each participant was collected using a systematic approach and set of questions,
providing both quantitative (survey) and qualitative (interview) data. There were two
formats of questions:
1. A feedback survey mechanism, distributed through Survey Monkey, with scaled, yes/no, multiple choice, multi-select, and open-ended questions. The feedback survey was completed by CBP partners in May, 2013.
2. A personal telephone interview with follow-up questions, open-ended in nature, designed to give further insight into replication efforts. Follow-up interviews with CBP partners were completed in June, 2013.
The Survey Instrument
The feedback survey was sent via Survey Monkey, a website that provides
surveying services with various features for developing surveys, collecting, and analyzing
responses. The Survey Monkey site allows the user to develop and monitor surveys and
responses, conduct basis analysis and download, track and manage respondent answers.
Prior to completing the survey, respondents were sent a letter explaining the intension of
36

the survey, the format and process and procedures for completion. Respondents were
asked to access and complete the survey within two weeks of receiving the Survey
Monkey link, which was sent to their email. The complete introductory letter can be
accessed in Appendix A. The feedback survey was sent to participants on May 10, 2013.
Appendix B contains the full survey in the format sent to respondents. Each respondent
was given two weeks to complete and resubmit the survey. During this time, respondents
were sent reminder emails twice to encourage survey participation.
The feedback survey contained three primary categories with a total of 37
questions on a variety of subjects relating to their organization’s participation in the CBP
program. The first section focused on CBP partner structure, motivations and objectives
for implementing CBP measures, along with organizational demographic information.
The second section was focused on specific replication strategies and outcomes of
replicating CBP measures. The final section was intended to provide information about
outcomes of replication, documentation processes and long term monitoring of CBP
measures.
The questions in the feedback survey were presented in various formats. The first
format provided fixed-alternative questions with one answer, such as “yes-no” questions.
The second question format was a 3-point scale where multiple options could be selected
by participants. The third format was a ranking system, allowing the user to rank the
importance of various types of green building motivations.
37
Follow-Up Interviews
Once the survey instruments were completed, follow-up interviews were
scheduled and conducted to gain further qualitative insight into CBP partner participation
and experiences. The interviews were scheduled on the week of May 24, 2013, and
conducted throughout the month of June. The interviewee and survey respondent from
each organization was the same person, and interviews were focused on expanding
survey responses. Each interview was conducted over the telephone, and lasted anywhere
between 20—45 minutes, depending on the preference of the interviewee.
The format of the interview, specific interview structure and questions can be
found in Appendix C. Although the interviews were structured, many respondents
discussed specific interests, opinions and feedback that was unstructured in nature.
Data Analysis
Data analysis for this study is broken out into two primary efforts. The first
focuses on the primary data gathered through the survey and interview mechanisms.
These data provided insight into specific experiences of each CBP partner. Additionally,
a diffusion model was developed utilizing data from each CBP partner. The model was
calibrated using commercial green building data that were obtained through the United
States Green Building Council (USGBC). Thus, the second portion of this effort resulted
in two analyses.
38
Data for both efforts was analyzed using The R Project for Statistical Computing
(R), an open source software program providing a language environment for data
analysis, calculations and graphic development (The R Project for Statistical Computing,
2013). R was developed in 1997, and is currently managed by the R Foundation, a non-
profit entity which maintains R statistical computing software. R is open-source, and
available to the public at no cost. R was chosen for this analysis because I am familiar
with using this platform for analysis, and believe it creates superior visual graphs
compared to Microsoft Excel or SPSS. Additionally, a colleague of mine assisted with
the script writing for developing the diffusion model, also utilizing R.
CBP Partner Data Analysis
After the survey and interviews were complete in June, 2013, the data were
gathered and uploaded into a spreadsheet. Because the survey data were sparse, they did
not warrant advanced statistical analysis. Instead, these data were used to provide
descriptive statistics of respondent answers and insights, along with qualitative interview
answers providing further insight into motivations, experience and replication efforts.
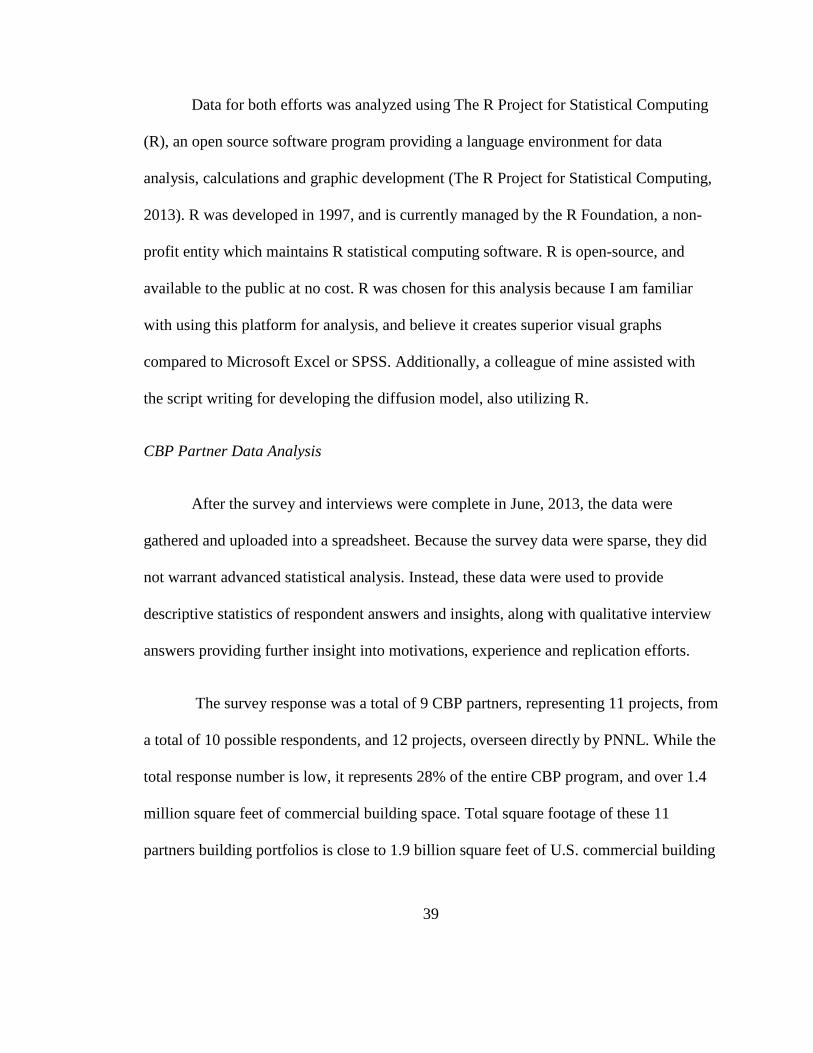
The survey response was a total of 9 CBP partners, representing 11 projects, from
a total of 10 possible respondents, and 12 projects, overseen directly by PNNL. While the
total response number is low, it represents 28% of the entire CBP program, and over 1.4
million square feet of commercial building space. Total square footage of these 11
partners building portfolios is close to 1.9 billion square feet of U.S. commercial building
39
space. Figure 6 below presents CBP partner profiles by industry, for the group analyzed
in this study. There was an even split between education, finance & financial services,
government, and retail & consumer durables (22%). The commercial real estate industry
was also represented at 11%.
Figure 6. CBP Partner Participation by Industry as Reported by Survey Respondents
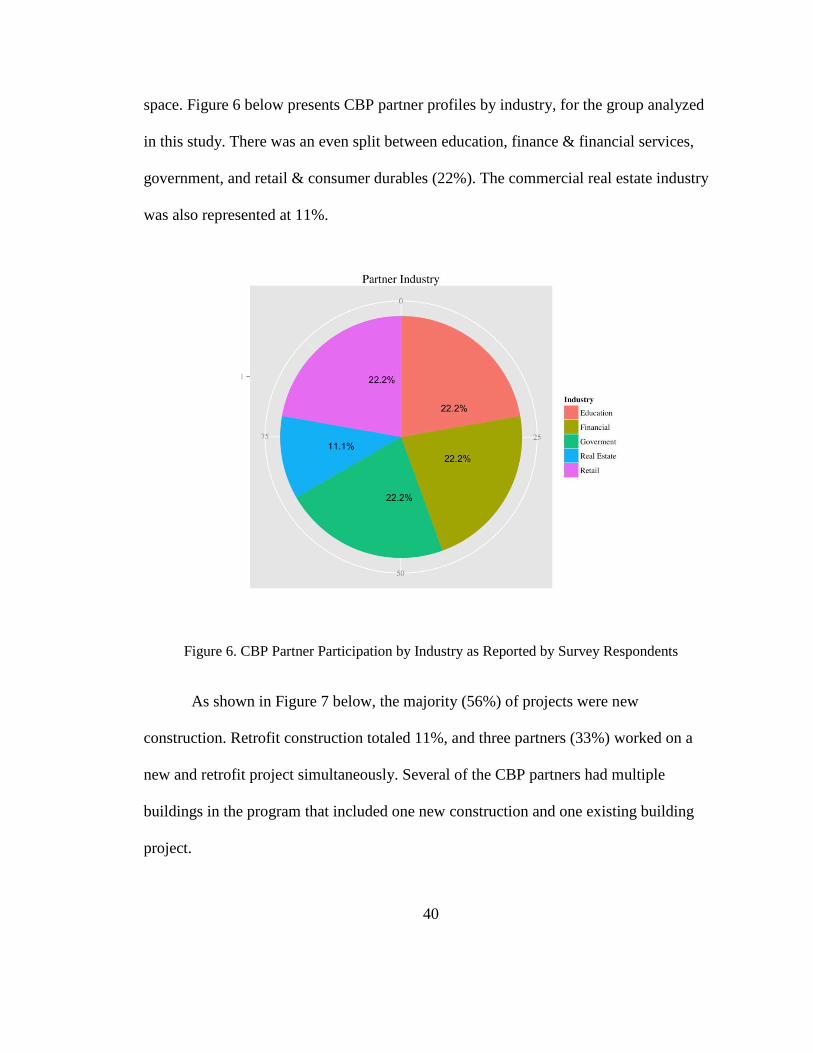
As shown in Figure 7 below, the majority (56%) of projects were new
construction. Retrofit construction totaled 11%, and three partners (33%) worked on a
new and retrofit project simultaneously. Several of the CBP partners had multiple
buildings in the program that included one new construction and one existing building
project.
40
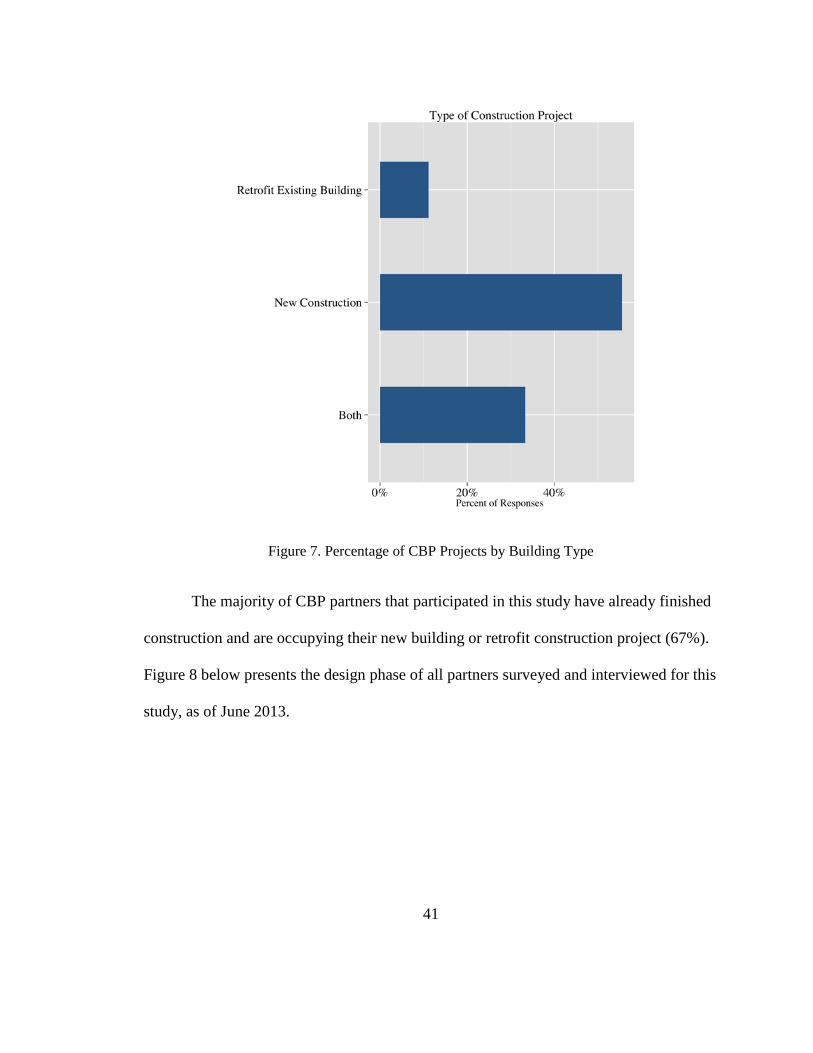
Figure 7. Percentage of CBP Projects by Building Type
The majority of CBP partners that participated in this study have already finished
construction and are occupying their new building or retrofit construction project (67%).
Figure 8 below presents the design phase of all partners surveyed and interviewed for this
study, as of June 2013.
41

Figure 8. Current Phase of Construction for Each CBP Partner
Diffusion Model Development and Analysis
Another primary objective of this study aimed to gain a better understanding of
replication efforts underway by partners, taking EEMs from their specific projects into
the rest of their building portfolios. Analysis of these efforts provides foundations for
broader market analysis of the potential of the CBP program on total commercial
building sector energy consumption and cost savings. Broader market impacts were
42
calculated using data collected from interviews, survey answers and metadata of each
CBP partner building portfolios. This analysis used the diffusion of innovations theory to
explore possible market impacts of the CBP program throughout the commercial building
sector in the United States.
Different versions of a diffusion model have been used to predict energy
efficiency technology diffusion in the building sector by several authors, as discussed in
detail in the Literature Review chapter of this thesis. For technologies relating to green
building, two primary models have been used by researchers; the Bass Model and the
Fisher-Pry Model. Mathematically, the first widely adopted quantitative model describing
the new product or technology diffusion process was developed by Frank Bass in 1969.
In the Bass diffusion model, the formulation is based upon a differential equation
representing the number or market share of innovation adopters over a period of time,
incorporating both internal and external influences (Bass, 2004). Internal influences are
impacts of media, government and other broad adoption efforts, and external influences
involve social interaction (Bass, 2004). Both are represented as coefficients (q and p) and
are key factors in the modeling technique.
The work of Fisher and Pry (Fisher and Pry, 1971) is similar to the work of Bass,
but differs in the initial conditions used to solve the equation. The Fisher-Pry model for
technology diffusion has an assumption of 50% market penetration (or substitution), a
rate which is built into the model. The Bass diffusion model avoids this issue and is
considered more appropriate for this study. Yudelson (Yudelson, 2007) used the Fisher-
43

Pry model to estimate the market penetration of green buildings as the technology
diffused rather than individual energy efficient technologies such as lighting or HVAC
systems, which is also the aim of this analysis. So, a process for developing a diffusion
model that avoids the 50% market penetration assumption but also analyzes the entire
building as the technology diffused had to be created. In order to measure the CBP
program on a whole building scale, development of a Bass Model with appropriate values
for q and p were imperative.
Diffusion models are widely used in many industries as a means of forecasting
market penetration of new technologies. The general form of the Bass model is given in
Equation 1, where:
N(t) is the cumulative number of adoptions at time (t)
M is the market potential, a constant
p is the coefficient of innovation
q is the coefficient of imitation or internal influence (Bass, 1969).
𝑑𝑁(𝑡)𝑑𝑡
= �𝑝 +𝑞𝑀⋅ 𝑁(𝑡)� ⋅ �𝑀 − 𝑁(𝑡)�
The Bass model may be solved explicitly for the fraction of the market penetrated,
F(t), by assuming the initial number of adopters at t=0 is 0. This results in a formula that
may be used to estimate the cumulative adoptions as a function of q (coefficient of
44
imitation) and p (coefficient of innovation). These coefficients describe the curve of the
output, speaking to the rate of diffusion within a market.
𝐹(𝑡) =1 − 𝑒𝑥𝑝(−(𝑝 + 𝑞)𝑡)
1 + �𝑞𝑝� 𝑒𝑥𝑝(−(𝑝 + 𝑞)𝑡)
The diffusion model in this study has been used to estimate the long-term impact
of the CBP efforts (within partner portfolios and the broader market) by modeling
replication of the CBP program approach over time. The most challenging part of
developing the model was identifying the correct values of q and p. The general approach
consisted of calibrating the Bass model for a specific application, in this case commercial
buildings on a whole-building scale, not individual EEMs within it. Because the only
other study analyzing green building on a whole-building scale utilized the Fisher-Pry
model, a method for calibrating it to the Bass model was necessary. To calibrate the Bass
model, a larger whole-building data set was needed so the USGC certification database
was considered.
For application to CBP buildings, this study adopted the diffusion process based
on the model developed by Bass (Bass, 1969) but treats the entire energy-efficient
building as the technology to be diffused rather than a specific EEM. One of the most
important factors in Bass model development is the correct identification of the primary
coefficients, q (coefficient of imitation) and p (coefficient of innovation). To determine
the appropriate coefficients for this model, the market penetration of green buildings was
45

examined using the methodology of Yudelson. Specifically, the empirical modeling was
based on the market data available for LEED certification.
The current study is not focused on the validity of the USGBC system, and
considered it only as an energy efficiency program that operates at the whole-building
level in a manner comparable to the CBP program. The USGBC dataset has a much
larger number of data points than CBP; roughly 15,500 certified buildings are included in
the dataset at the time of this study (USGBC, 2013).
The data set was downloaded from the USGBC website and the Yudelson
estimate was compared to actual LEED certifications as shown in Figure 9 below. The
red data represents actual USGBC data (USGBC, 2013), and the blue line is the Yudelson
estimated (modeled) diffusion profile presented in his 2005 analysis. No modeling work
was done to these data, only comparison between actual buildings constructed, and
Yudelson’s predictions using the Fisher Pry diffusion model developed for that study.
46

Figure 9. Raw USGBC Data and the Yudelson Model Predictions
The Yudelson diffusion model over-predicted the number of LEED certifications
in the first years of the model, and then improved through 2007 as shown in Table 2 and
Figure 10 (and discussed in the Findings chapter). However, the general shape of the
diffusion curve closely matches the historical data for subsequent years. One limitation of
the Yudelson technique as discussed above was the formulation of the diffusion equation,
47

which required an initial condition estimate of the 50% penetration rate. The Bass
diffusion model avoids this issue and is considered more appropriate for this study.
The raw data downloaded from USGBC were fit to the Bass model using a range
of p (coefficient of innovation) and q (coefficient of imitation) parameters with a range of
p between 0.000001 and 0.5 based on the results of Elliott et al. (Elliott et al., 2004).
Similarly the value of q varied between 0.005 and 1. These values acted as a low and
high range and were laid on top of the USGBC dataset. Once the ranges of the parameters
were on the USGBC data, the fit of the p and q parameters was evaluated using the
traditional definition of R2. The results of the R2 analysis gave the optimal value for both
p and q, which were then used to analyze the CBP program. In the following equation, yi
is the observed raw data, 𝑦� is the mean of the raw data, and fi is the value predicted by the
Bass model for each time point.
𝑅2 = 1 −∑ (𝑦𝑖 − 𝑓𝑖)2𝑖∑ (𝑦𝑖 − 𝑦�)2𝑖
Table 1 provides a summary of the modeling inputs and outputs. The final p and
q coefficients are based on maximizing the R2 coefficient. Using a straightforward grid
search methodology, a 100x100 matrix of p and q parameters was generated and the
predicted number of adoptions was calculated using the Bass model for each pair of
parameters. The R2 coefficient was evaluated for each parameter pair in the matrix and
the final pair of parameters was selected on the basis of the best model fit to the raw data.
48

The maximum market potential (number of buildings) was estimated based on the
average commercial buildings size during the time frame of data considered and the
estimated total amount of floor space. The market potential is based only on new
commercial construction because only a small portion of the USGBC building database is
comprised of building renovations (only 5,887 of 41,505 buildings in the USGBC data
base are tagged as “Existing Buildings”). The maximum market potential in this case is
represented by the total number of buildings in the U.S. (m), which matches fairly well
with the number estimated by Yudelson (2005).
Table 1. Bass Model Parameters Determined from the Raw Data
Bass Model Parameter Value Determined (Bass Traditional)
Source
p - coefficient of innovation
8.42e-5 Data fitting
q - coefficient of imitation 0.359 Data fitting
m - maximum market potential (number of buildings)
1,068,493 Total new commercial buildings constructed between 2000-2013, estimated from 14,700 ft2/building and 15.6x109 ft2 (EIA, 2008; DOE, 2012b)
R2 - coefficient of determination
0.987 Calculated to compare fit of Bass model with USGBC data
The final Bass model parameters predict the correct trend for certification in the
later years, but show a tendency to over-predict diffusion in the first few years of the
LEED program. Figure 10 shows the Bass model and raw data on the same scale. While
over-predicting the behavior in the first eight years is an issue for the Bass model, it is the
49
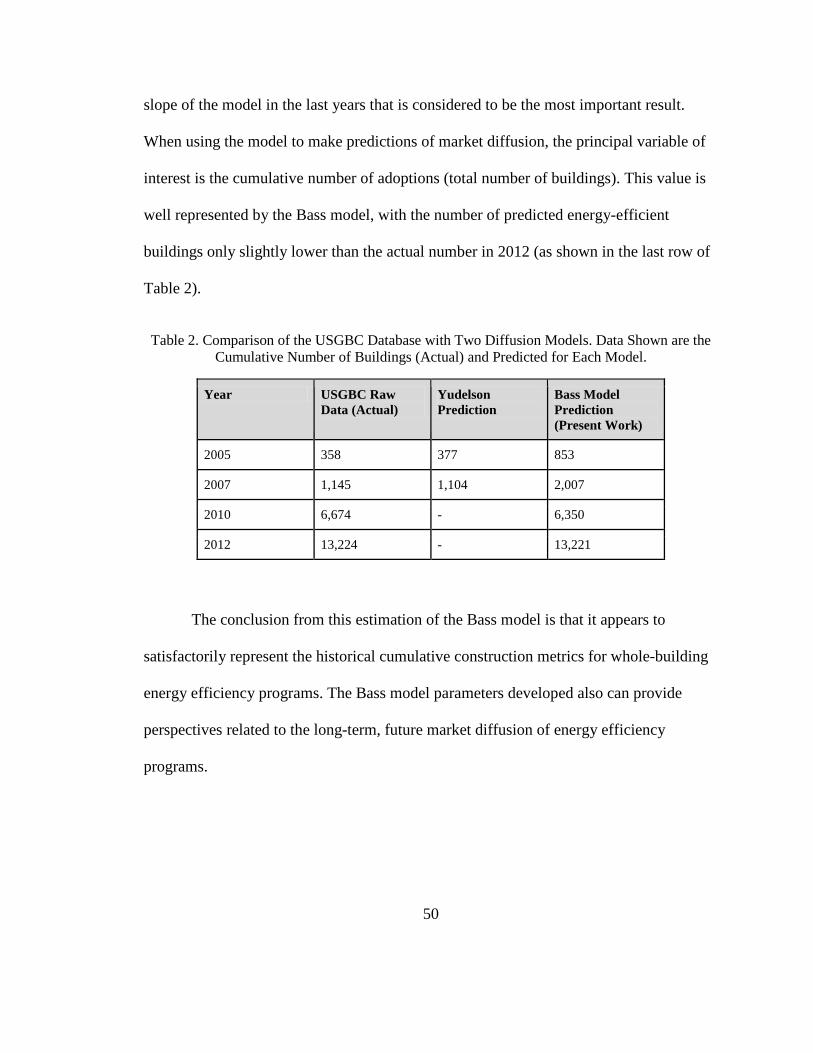
slope of the model in the last years that is considered to be the most important result.
When using the model to make predictions of market diffusion, the principal variable of
interest is the cumulative number of adoptions (total number of buildings). This value is
well represented by the Bass model, with the number of predicted energy-efficient
buildings only slightly lower than the actual number in 2012 (as shown in the last row of
Table 2).
Table 2. Comparison of the USGBC Database with Two Diffusion Models. Data Shown are the Cumulative Number of Buildings (Actual) and Predicted for Each Model.
Year USGBC Raw Data (Actual)
Yudelson Prediction
Bass Model Prediction (Present Work)
2005 358 377 853
2007 1,145 1,104 2,007
2010 6,674 - 6,350
2012 13,224 - 13,221
The conclusion from this estimation of the Bass model is that it appears to
satisfactorily represent the historical cumulative construction metrics for whole-building
energy efficiency programs. The Bass model parameters developed also can provide
perspectives related to the long-term, future market diffusion of energy efficiency
programs.
50
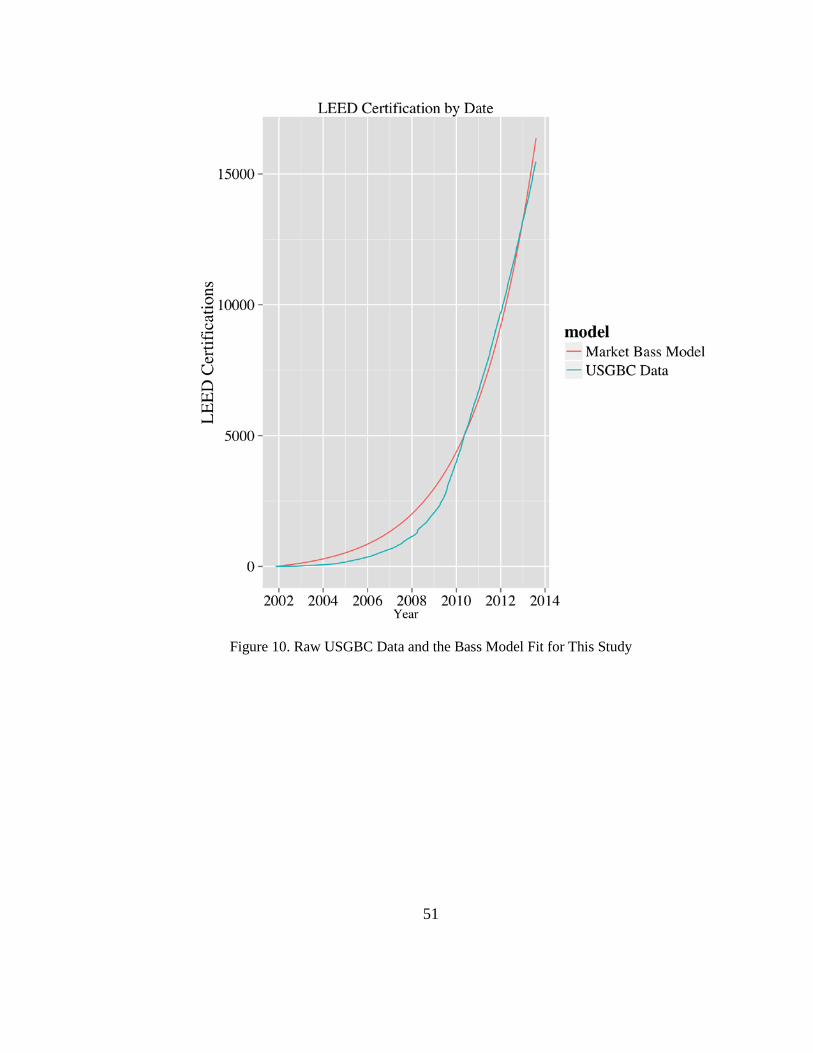
Figure 10. Raw USGBC Data and the Bass Model Fit for This Study
51
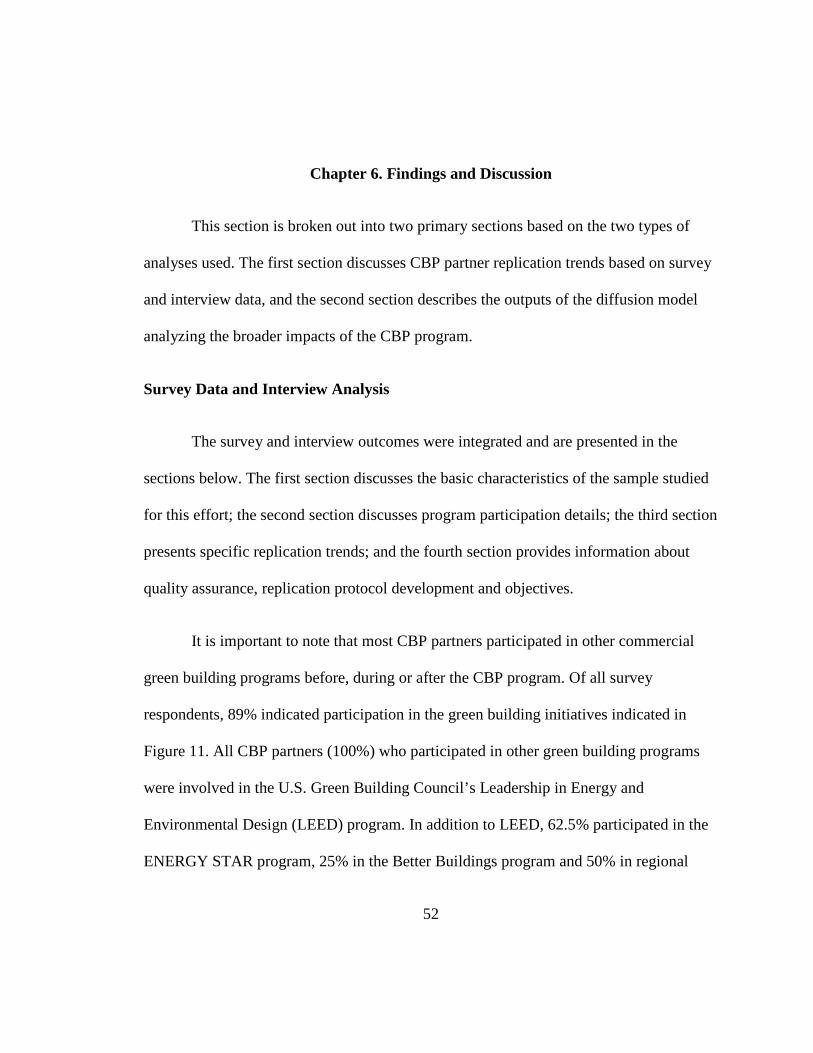
Chapter 6. Findings and Discussion
This section is broken out into two primary sections based on the two types of
analyses used. The first section discusses CBP partner replication trends based on survey
and interview data, and the second section describes the outputs of the diffusion model
analyzing the broader impacts of the CBP program.
Survey Data and Interview Analysis
The survey and interview outcomes were integrated and are presented in the
sections below. The first section discusses the basic characteristics of the sample studied
for this effort; the second section discusses program participation details; the third section
presents specific replication trends; and the fourth section provides information about
quality assurance, replication protocol development and objectives.
It is important to note that most CBP partners participated in other commercial
green building programs before, during or after the CBP program. Of all survey
respondents, 89% indicated participation in the green building initiatives indicated in
Figure 11. All CBP partners (100%) who participated in other green building programs
were involved in the U.S. Green Building Council’s Leadership in Energy and
Environmental Design (LEED) program. In addition to LEED, 62.5% participated in the
ENERGY STAR program, 25% in the Better Buildings program and 50% in regional
52
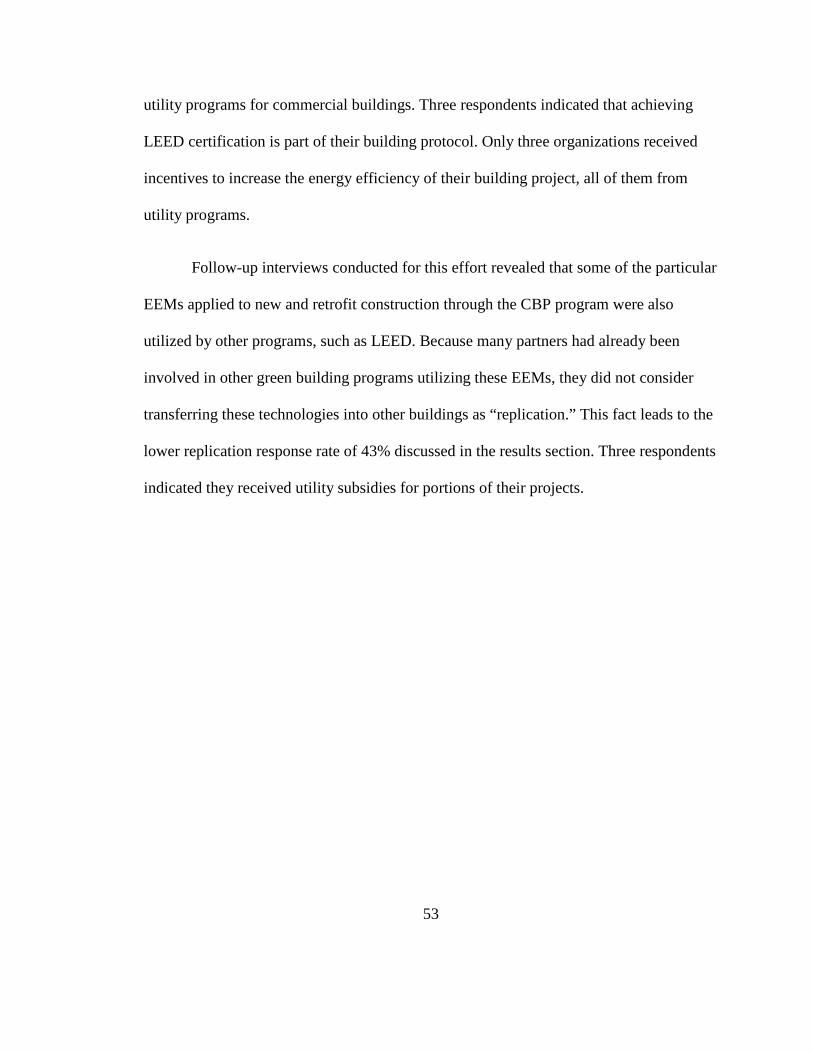
utility programs for commercial buildings. Three respondents indicated that achieving
LEED certification is part of their building protocol. Only three organizations received
incentives to increase the energy efficiency of their building project, all of them from
utility programs.
Follow-up interviews conducted for this effort revealed that some of the particular
EEMs applied to new and retrofit construction through the CBP program were also
utilized by other programs, such as LEED. Because many partners had already been
involved in other green building programs utilizing these EEMs, they did not consider
transferring these technologies into other buildings as “replication.” This fact leads to the
lower replication response rate of 43% discussed in the results section. Three respondents
indicated they received utility subsidies for portions of their projects.
53
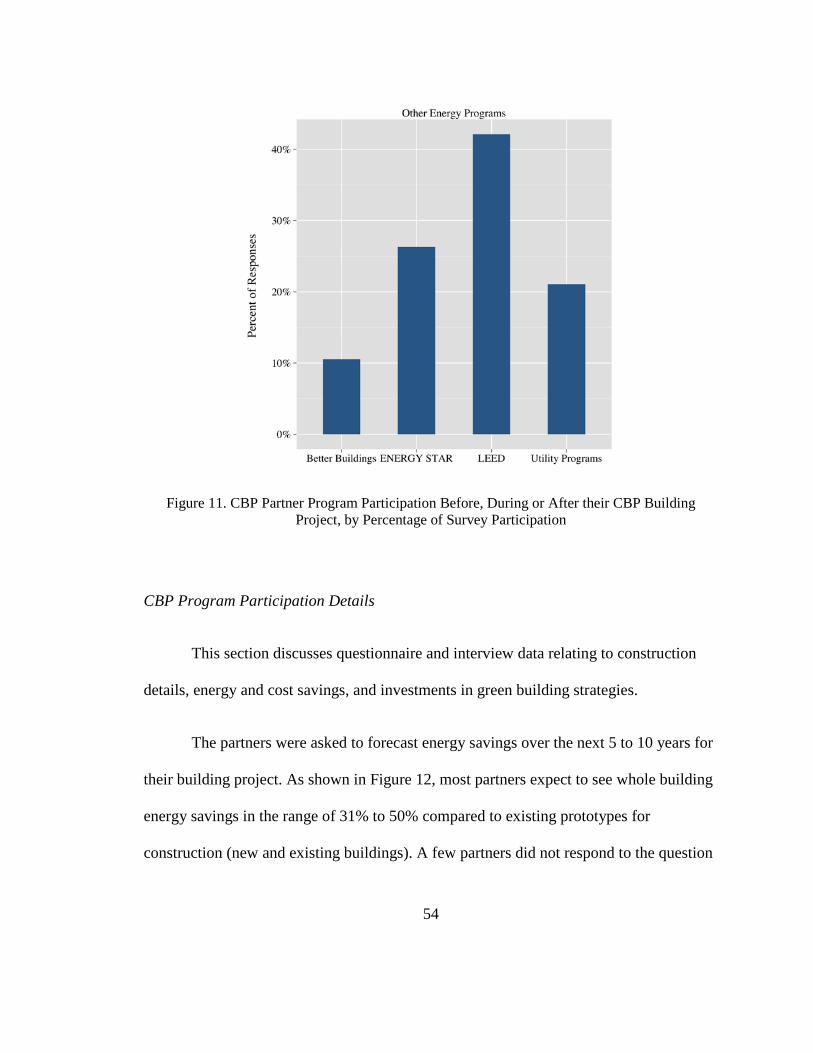
Figure 11. CBP Partner Program Participation Before, During or After their CBP Building Project, by Percentage of Survey Participation
CBP Program Participation Details
This section discusses questionnaire and interview data relating to construction
details, energy and cost savings, and investments in green building strategies.
The partners were asked to forecast energy savings over the next 5 to 10 years for
their building project. As shown in Figure 12, most partners expect to see whole building
energy savings in the range of 31% to 50% compared to existing prototypes for
construction (new and existing buildings). A few partners did not respond to the question
54

as shown the left-most bar in the figure. A few partners expect to see energy savings
higher than 50%.1
Figure 12. CBP Partner Forecast Energy Savings for the CBP Building in the Next 5-10 Years as Reported in the Survey
The partners were also asked to predict cost savings of energy expenditures for
the CBP building as shown below in Figure 13. To better understand the way the partner
expects the CBP methods to propagate through the full building portfolio, the partners
were also asked to estimate the cost savings expected for the full portfolio. As shown in
1 For this analysis, energy savings is defined as site energy use.
55

Figure 14, the majority of respondents indicated 5% to10% cost savings in the full
building portfolio. While these savings are relatively modest compared to energy savings,
multiple partners indicated that energy expenditures represent one of the largest
percentages of total operational costs, and that 5% to10% savings represents significant
kWh and dollar amounts.
Figure 13. CBP Partner Forecast Cost Savings for the CBP Building in the Next 5-10 Years as Reported in the Survey
56

Figure 14. CBP Partner Forecast Energy Savings for the Partner Portfolio in the Next 5-10 Years as Reported in the Survey
Partners were asked how they monitored their project during the process of
construction. Eight respondents indicated their building projects were commissioned, and
monitoring of their project included commissioning agents. As the majority of
organizations that participated in the CBP program are large corporations, most
respondents indicated the monitoring process was conducted by an in-house team of
engineers and project managers who conducted site visits during all steps of the
construction process.
57
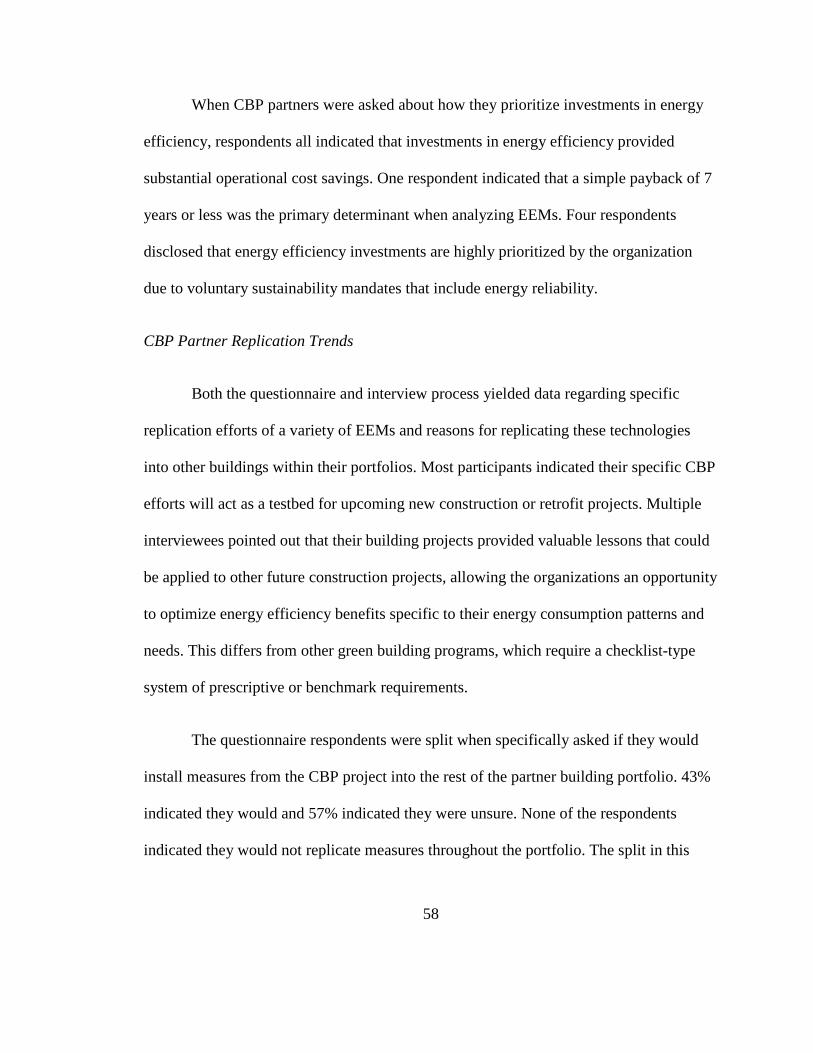
When CBP partners were asked about how they prioritize investments in energy
efficiency, respondents all indicated that investments in energy efficiency provided
substantial operational cost savings. One respondent indicated that a simple payback of 7
years or less was the primary determinant when analyzing EEMs. Four respondents
disclosed that energy efficiency investments are highly prioritized by the organization
due to voluntary sustainability mandates that include energy reliability.
CBP Partner Replication Trends
Both the questionnaire and interview process yielded data regarding specific
replication efforts of a variety of EEMs and reasons for replicating these technologies
into other buildings within their portfolios. Most participants indicated their specific CBP
efforts will act as a testbed for upcoming new construction or retrofit projects. Multiple
interviewees pointed out that their building projects provided valuable lessons that could
be applied to other future construction projects, allowing the organizations an opportunity
to optimize energy efficiency benefits specific to their energy consumption patterns and
needs. This differs from other green building programs, which require a checklist-type
system of prescriptive or benchmark requirements.
The questionnaire respondents were split when specifically asked if they would
install measures from the CBP project into the rest of the partner building portfolio. 43%
indicated they would and 57% indicated they were unsure. None of the respondents
indicated they would not replicate measures throughout the portfolio. The split in this
58

response may indicate that many of the questionnaire respondents (57%) are unsure of
replication through the entire portfolio, but they may be replicating specific measures
through part of the portfolio. Follow-up interviews with partners revealed that some
EEMs, such as high efficiency HVAC systems and high roof/ceiling insulation, are
measures the organization was using prior to participation in the CBP program. Partners
indicated that they did not consider implementation of such measures as “replication.”
When asked whether replication efforts were a direct result of participation in the CBP
program, three respondents indicated yes. A number of partners have identified measures
that will be replicated across many buildings or their entire portfolios. Discussion of
specific EEM replication efforts are discussed in the next section of this report.
The partners were also asked in how many other buildings in which CBP
measures had already implemented. Even a few years into the project significant
replication is occurring and some respondents indicated replication as high as 6 or 10
buildings. However, most of the partners have not yet replicated the CBP methods
beyond the one or two buildings as shown in Figure 15. Still, the majority of partners are
replicating measures as a direct result of their participation in the CBP program; 63% said
they did not have replication protocols before participating but now do.
59
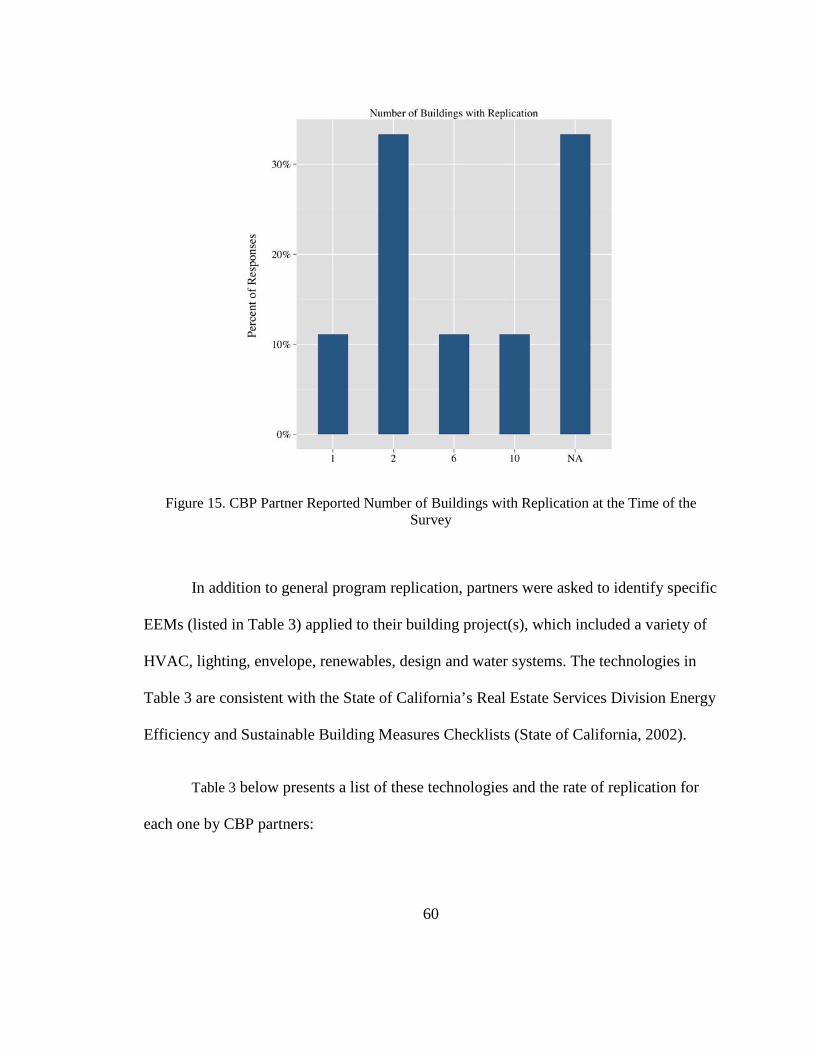
Figure 15. CBP Partner Reported Number of Buildings with Replication at the Time of the Survey
In addition to general program replication, partners were asked to identify specific
EEMs (listed in Table 3) applied to their building project(s), which included a variety of
HVAC, lighting, envelope, renewables, design and water systems. The technologies in
Table 3 are consistent with the State of California’s Real Estate Services Division Energy
Efficiency and Sustainable Building Measures Checklists (State of California, 2002).
Table 3 below presents a list of these technologies and the rate of replication for
each one by CBP partners:
60
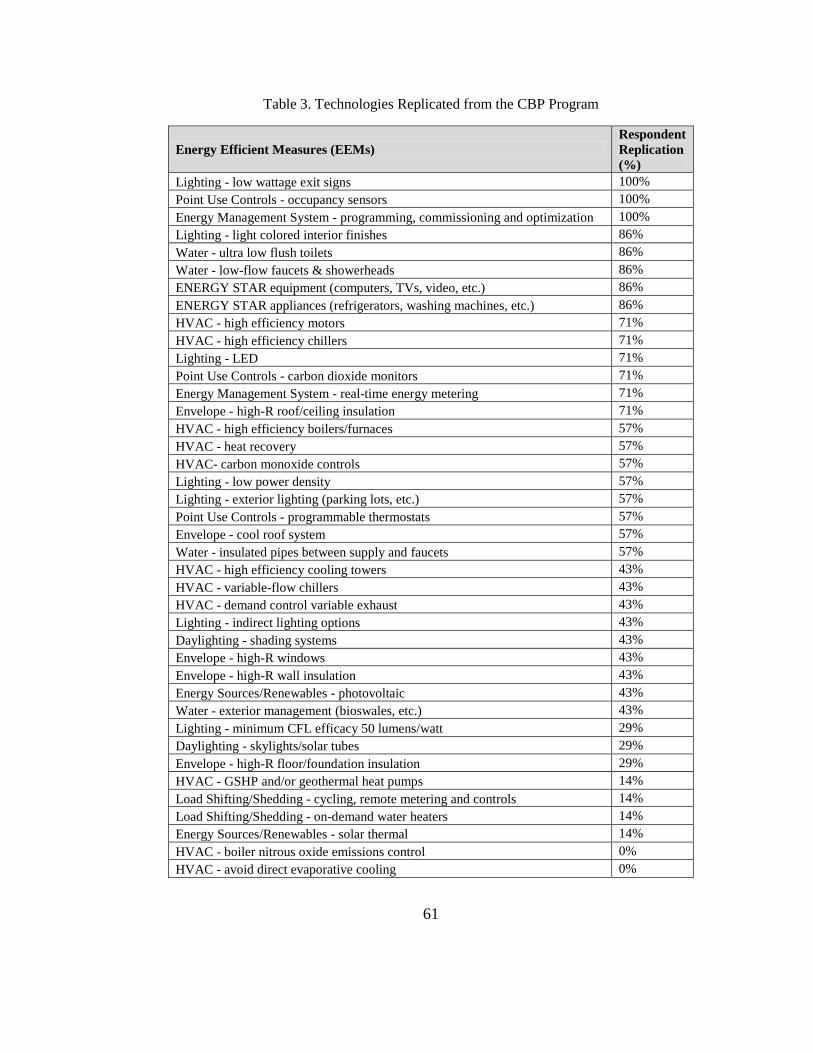
Table 3. Technologies Replicated from the CBP Program
Energy Efficient Measures (EEMs) Respondent Replication (%)
Lighting - low wattage exit signs 100% Point Use Controls - occupancy sensors 100% Energy Management System - programming, commissioning and optimization 100% Lighting - light colored interior finishes 86% Water - ultra low flush toilets 86% Water - low-flow faucets & showerheads 86% ENERGY STAR equipment (computers, TVs, video, etc.) 86% ENERGY STAR appliances (refrigerators, washing machines, etc.) 86% HVAC - high efficiency motors 71% HVAC - high efficiency chillers 71% Lighting - LED 71% Point Use Controls - carbon dioxide monitors 71% Energy Management System - real-time energy metering 71% Envelope - high-R roof/ceiling insulation 71% HVAC - high efficiency boilers/furnaces 57% HVAC - heat recovery 57% HVAC- carbon monoxide controls 57% Lighting - low power density 57% Lighting - exterior lighting (parking lots, etc.) 57% Point Use Controls - programmable thermostats 57% Envelope - cool roof system 57% Water - insulated pipes between supply and faucets 57% HVAC - high efficiency cooling towers 43% HVAC - variable-flow chillers 43% HVAC - demand control variable exhaust 43% Lighting - indirect lighting options 43% Daylighting - shading systems 43% Envelope - high-R windows 43% Envelope - high-R wall insulation 43% Energy Sources/Renewables - photovoltaic 43% Water - exterior management (bioswales, etc.) 43% Lighting - minimum CFL efficacy 50 lumens/watt 29% Daylighting - skylights/solar tubes 29% Envelope - high-R floor/foundation insulation 29% HVAC - GSHP and/or geothermal heat pumps 14% Load Shifting/Shedding - cycling, remote metering and controls 14% Load Shifting/Shedding - on-demand water heaters 14% Energy Sources/Renewables - solar thermal 14% HVAC - boiler nitrous oxide emissions control 0% HVAC - avoid direct evaporative cooling 0%
61

HVAC - evaporative pre-cooled condensers on rooftop units 0% Lighting - minimum linear fluorescent efficacy 76 lumens/watt 0% Point Use Controls - 365 digital clocks 0% Energy Sources/Renewables - cogeneration plant 0% Energy Sources/Renewables - onsite wind system 0%
Of all the specific technologies represented in Table 3 above, three have a 100%
replication rate:
• Lighting - low wattage exit signs • Point Use Controls - occupancy sensors • Energy Management System - programming, commissioning and optimization
Similar to Table 3, Figure 16 below identifies EEMs by primary category, and is
broken out to show the penetration rates by building sector. Figure 16 illustrates that the
HVAC and lighting measures were the most popular measures for replication for all
building sectors, even though some partners did not consider HVAC EEMs to be
replicable because they were already doing it. Follow-up interviews revealed that many
partners found LED technologies to be very promising for future energy and cost
reductions. One partner in particular noted that the approach to LED installation led to
savings they had not anticipated before participation in the CBP program.
62
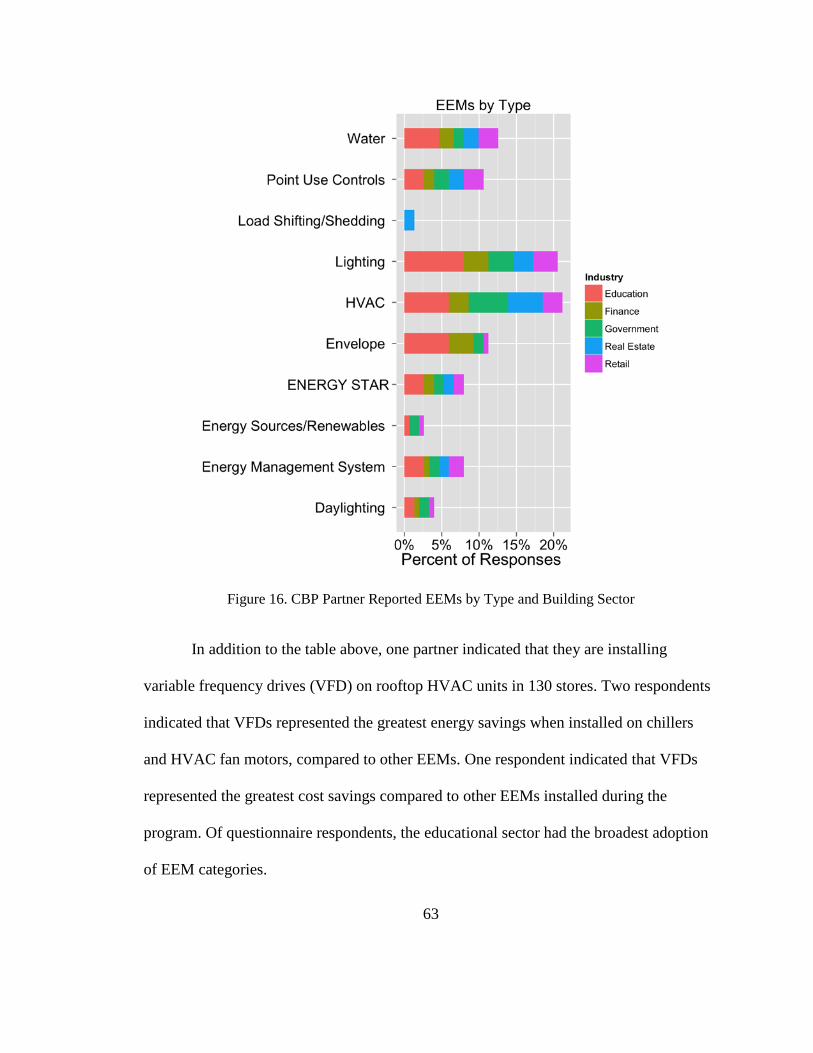
Figure 16. CBP Partner Reported EEMs by Type and Building Sector
In addition to the table above, one partner indicated that they are installing
variable frequency drives (VFD) on rooftop HVAC units in 130 stores. Two respondents
indicated that VFDs represented the greatest energy savings when installed on chillers
and HVAC fan motors, compared to other EEMs. One respondent indicated that VFDs
represented the greatest cost savings compared to other EEMs installed during the
program. Of questionnaire respondents, the educational sector had the broadest adoption
of EEM categories.
63
In the interviews conducted after the questionnaires were completed, the
following takeaways were identified by CBP partners regarding specific measures or
implementation strategies they will now replicate based on their experience with the CBP
program:
• Two partners indicated that they now have a detailed plan for M&V programs that will be rolled out to all building engineers within the organization.
• One partner indicated significant savings potential from reducing plug loads, an area that was not focused on before participation in the CBP program.
• One partner indicated that the entire package of CBP EEMs will be replicated in all buildings owned by the organization.
• Three partners indicated that LEED standards are mandated in all new construction. Specific elements from the experience gained from the CBP program will be added to their existing energy efficiency protocols.
• Three partners indicated that enhanced weather modeling and EEM package optimization were primary takeaways from program participation.
• Six partners confirmed that LED lighting technology and design will now be used in their entire building portfolios thanks to participation in the CBP program.
• One partner learned they were oversizing HVAC equipment and intends to use right-sized equipment in all new construction and replacements in their portfolio.
The primary motivation for CBP program participation, indicated in both
questionnaire and interview results, was cost reduction. In addition to realizing increased
efficiency, installation of energy efficient technologies has been determined by many
researchers to provide economic benefits. Overall building design can help achieve
energy and cost savings. For example, design solutions to existing commercial buildings
64
based on the climate zone in which the building is located has been estimated to have a
cost savings potential of 10% to 20% (Belzer, 2009), relatively consistent with the 11%
to 30% reported by CBP partners. Other studies point to economic gains from lower
operational costs of HVAC systems due to increased envelope efficiencies (Kneifel,
2010; Howarth, 2010).
Replication efforts by CBP partners depend greatly on potential cost savings and
project economics. When asked about economic analysis metrics, half of the respondents
indicated that return on investment (ROI) was their primary economic criterion. Figure
17 illustrates the primary types of economic analyses used to evaluate the investment
potential for replicating CBP measures. These measures include simple payback, savings
to investment ratio (SIR), return on investment (ROI), life-cycle cost analysis (LCC) and
building life-cycle cost analysis (BLCC). BLCC methods allow analysis of capital
investments specific to buildings. Most respondents use a form of spreadsheet or
commercial software to calculate EEM investment opportunities. Two respondents
indicated they do not utilize any financial analysis software, while the rest of the
respondents maintained they utilized in-house financial tools or packaged software suites
to evaluate the economics of EEMs.
65

Figure 17. Economic Metrics used by CBP Partners to Measure EEM Cost Effectiveness
Follow-up interviews conducted for this effort indicated the following takeaways
from the CBP program regarding cost reduction:
• All participants except one were strongly motivated by cost reduction potential;
• Five CBP partners indicated that energy costs are amongst the largest cost categories in expense budgets;
• Three participants indicated that energy modeling and monitoring techniques will be utilized henceforth to better understand the energy profile of specific buildings
66

within the organization’s portfolio. They believe that this enhanced knowledge will help them reduce energy related costs.
Motivation and Evidence of Replication
Survey and interview respondents were asked whether they have organization-
wide sustainability protocols for green building, energy efficiency and environmental
stewardship. All of the respondents indicated their organization had policies and
procedures regarding sustainability. Additionally, 75% of questionnaire respondents
indicated that they have company policies regarding implementation of EEMs (Figure
18). When asked whether these protocols impacted their participation in the CBP
program, 75% of respondents indicated yes, while 25% indicated no.
67

Figure 18. Percentage of Organizations with Policies/Procedures for EEM Implementation
This study also aimed to gain a better understanding of any benefits beyond the
energy and cost savings CBP partners realized through program participation.
Respondents were asked to rank ten different non-monetary and social benefits associated
with increased building efficiency. Figure 19 presents the cumulative results from all
respondents; the x-axis represents the number rank per respondent and the y-axis
represents the benefit. Decreased maintenance was ranked highly by more than 50% of
the questionnaire respondents. This is consistent with the reduced cost of exterior lighting
that many partners reported when switching to LED systems. Increased employee
68
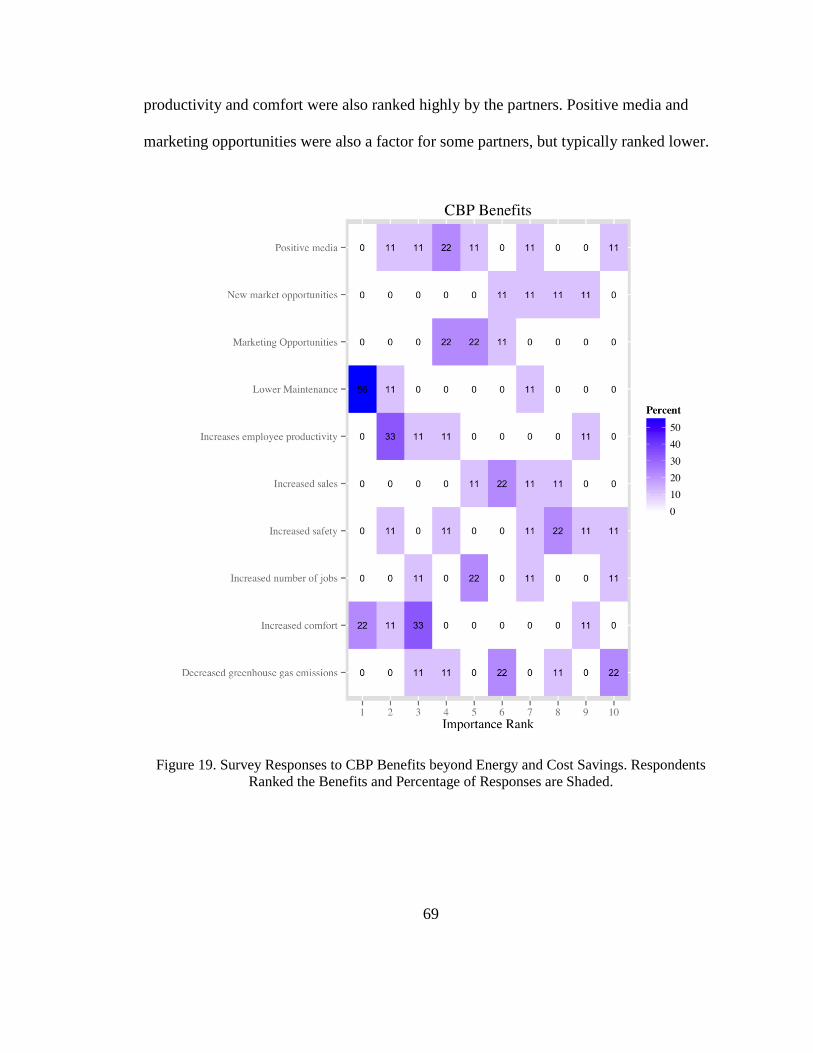
productivity and comfort were also ranked highly by the partners. Positive media and
marketing opportunities were also a factor for some partners, but typically ranked lower.
Figure 19. Survey Responses to CBP Benefits beyond Energy and Cost Savings. Respondents Ranked the Benefits and Percentage of Responses are Shaded.
69

One way to determine replication impacts over the long term is to gain insight
into protocol development, monitoring and verification (M&V) activities, and operations
plans and documentation of CBP partners. Better understanding of these organizational
structures can help provide validation and demonstration that replication is occurring, and
that it is successful and impactful when compared to the overall energy footprint of an
entire organization.
Building commissioning is a term used to describe a comprehensive project
management process for new and retrofit (retro-commissioning) construction that
provides an in-depth quality assurance process from the design through the occupancy
phase of the building project (ASHRAE, 2011). Successful building commissioning can
reduce energy costs and enhance systems operation of building projects. In an effort to
better understand long-term replication objectives, CBP partners were asked whether
their building projects were commissioned (or retro-commissioned). As noted previously,
88% responded yes. When asked whether all buildings are commissioned, 75% replied
yes, 12.5% no, and 12.5% “I don’t know.”
Respondents were also asked whether they have a documentation process for
building design and energy efficiency. Of the seven participants that responded to the
question, four indicated they did, and three indicated their organization did not. One of
the organizations that answered no to that question is a franchised property management
company, which is not involved in all their franchise’s building projects.
70
When asked about protocols for M&V, all but one respondent indicated they had
some form of M&V process, which included metering. However, three respondents
reported they did not have a process for monitoring before the CBP program. Two
respondents did not answer the question. Respondents that answered “yes” indicated
either in-house, third party or no M&V. All CBP projects are monitored by the DOE
design team for a specified period of time; this question was designed to gain insight into
how the organization plans for long-term building monitoring.
When asked about prototype plans, four partners indicated they develop and
maintain building construction prototypes. Three respondents keep the prototype plans
in-house, and one is maintained by a third party engineering firm, hired by the
organization to maintain their energy profile. In a follow-up interview, one partner
reported that their CBP project details have been passed up to high-level management,
who has adopted the building project as a prototype for future building construction. The
same organization indicated that the CBP program gave them an opportunity to enhance
and optimize measures they already employed in their building practice and fine-tune
their process for energy efficiency.
Finally, when asked about actual energy savings versus modeled or expected
savings, the majority of CBP partners reported that it was too soon to tell, as their
building projects have not had enough time to yield robust data. Three respondents
reported that they were realizing predicted energy savings, and one partner reported their
savings was very close to that predicted. One partner reported there had been a default
71

setting in the control sequence of the HVAC system, causing the system to continuously
operate. However, the issue has been corrected and they are now expecting modeled and
actual savings to align. Also in the follow-up interviews, one partner indicated that the
solar photovoltaic system, installed as part of their new construction EEM package, sent
enough electricity to the grid in May 2013 to make the building net energy positive, in
terms of electricity consumption.
Diffusion Model Analysis and Output
Two Bass models (“CBP Construction” and “Market Bass Model”) were
developed which resulted in a large difference between modeled outputs. On a personal
note, I find it appropriate to mention that a colleague of mine, Heather Dillon, helped me
with the scripts for the final model. The CBP Construction model (conservative) was
developed using data from CBP partners only, with the output representing the maximum
number of buildings impacted normalized by total number of buildings in CBP partner
portfolios. The Market Bass model (optimistic) was developed by extrapolating the
dataset out to the broader market, and represents market diffusion potential for the full
partner portfolios based on the observed diffusion of other green building programs. This
section presents outputs from the analysis.
The previous section outlines the development of a Bass diffusion model
calibrated using the most comprehensive existing database of a building-scale energy
efficiency program, USGBC LEED data. Because USGBC LEED data provided the best,
72
dataset obtainable to help define q and p, the Bass model developed for this study was
laid on top of the LEED data to see how well the model fit. After fitting the model, q and
p was adjusted using the R2 function to determine the best values for those variables. See
the Methodology Chapter for detailed discussion of the Bass Model calibration. The
calibrated Bass model was then utilized to provide a mechanism to determine the best-
case impacts of the CBP program. In order to do this, a Bass model was developed based
on building-level implementation of EEMs.
Table 4 presents the parameters for determining model inputs. Since the focus of
this analysis is on the market potential for CBP program replication, the normalizer (m),
represented by number of buildings, should focus on market potential based on maximum
number of buildings within the entire CBP portfolio. This was calculated as the quotient
of total existing CBP partner portfolio square footage and average commercial building
size in the U.S., giving an estimate of 250,709 buildings to represent the market
maximum. Because the research team only had access to data on the existing portfolios of
CBP partners, the final analysis is conservative, because it would be appropriate to
assume the partners would continue to construct new buildings. However, no method to
quantify this was obvious so a construction rate increase was omitted from this study.
Two distinct Bass diffusion models were then used to bind the eventual diffusion
of the CBP program. The “Market Bass” model is simply a projection of the Bass model
using the q and p parameters determined from the larger USGBC data set. This model is
deemed to represent the way one other building-scale energy efficiency programs have
73
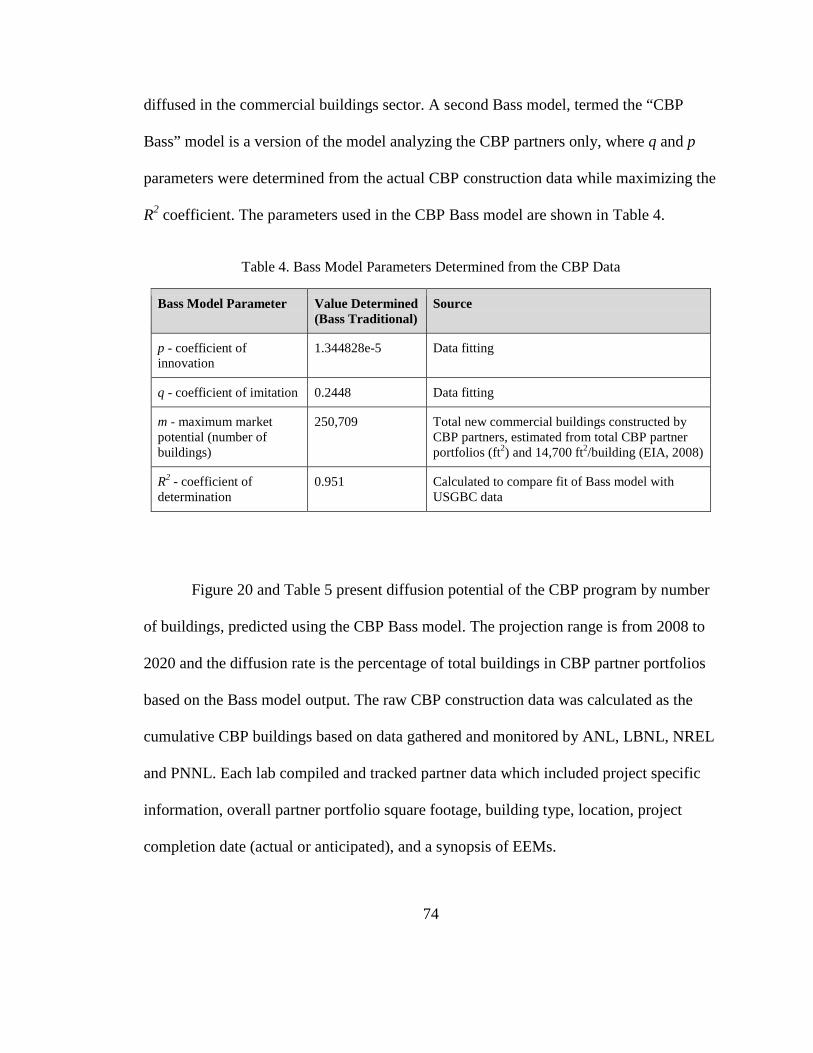
diffused in the commercial buildings sector. A second Bass model, termed the “CBP
Bass” model is a version of the model analyzing the CBP partners only, where q and p
parameters were determined from the actual CBP construction data while maximizing the
R2 coefficient. The parameters used in the CBP Bass model are shown in Table 4.
Table 4. Bass Model Parameters Determined from the CBP Data
Bass Model Parameter Value Determined (Bass Traditional)
Source
p - coefficient of innovation
1.344828e-5 Data fitting
q - coefficient of imitation 0.2448 Data fitting
m - maximum market potential (number of buildings)
250,709 Total new commercial buildings constructed by CBP partners, estimated from total CBP partner portfolios (ft2) and 14,700 ft2/building (EIA, 2008)
R2 - coefficient of determination
0.951 Calculated to compare fit of Bass model with USGBC data
Figure 20 and Table 5 present diffusion potential of the CBP program by number
of buildings, predicted using the CBP Bass model. The projection range is from 2008 to
2020 and the diffusion rate is the percentage of total buildings in CBP partner portfolios
based on the Bass model output. The raw CBP construction data was calculated as the
cumulative CBP buildings based on data gathered and monitored by ANL, LBNL, NREL
and PNNL. Each lab compiled and tracked partner data which included project specific
information, overall partner portfolio square footage, building type, location, project
completion date (actual or anticipated), and a synopsis of EEMs.
74

Figure 20. CBP Diffusion Prediction Using the Bass Model, R2=0.95
Figure 21 shows the CBP Bass and CBP Construction diffusion model predictions
through the year 2030. The Market Bass model (optimistic scenario) represents a best
case scenario for CBP diffusion based on the way the commercial building sector has
adopted another larger, but somewhat similar, whole-building energy efficiency program.
75

The CBP Bass model represents a conservative (worst case scenario) based only on the
CBP enhanced buildings constructed to date.
Table 5 shows the comparison of the two Bass models with the CBP construction
data. The CBP Bass model does an excellent job predicting the construction in 2015
(“actual” data include projections of completed buildings from LBNL, NREL and
PNNL), high by only a few buildings. The conservative model indicates that nearly 3,000
buildings will be enhanced by the CBP program by 2030. The more optimistic diffusion
model indicates that CBP enhancements could penetrate as many as 97,000 buildings by
the same year. The discrepancy between the optimistic and worse case is due to the large
difference in input data based on the normalizer (m) which represents the market
maximum number of buildings the program can diffuse into.
It is important to note that the actual number of projects presented in Table 5 and
Figure 21 below include only partner buildings directly involved in CBP, not replication
efforts already underway by partners. This implies that the Market Bass model
(optimistic scenario) may be closer to the actual number of buildings impacted by CBP.
76
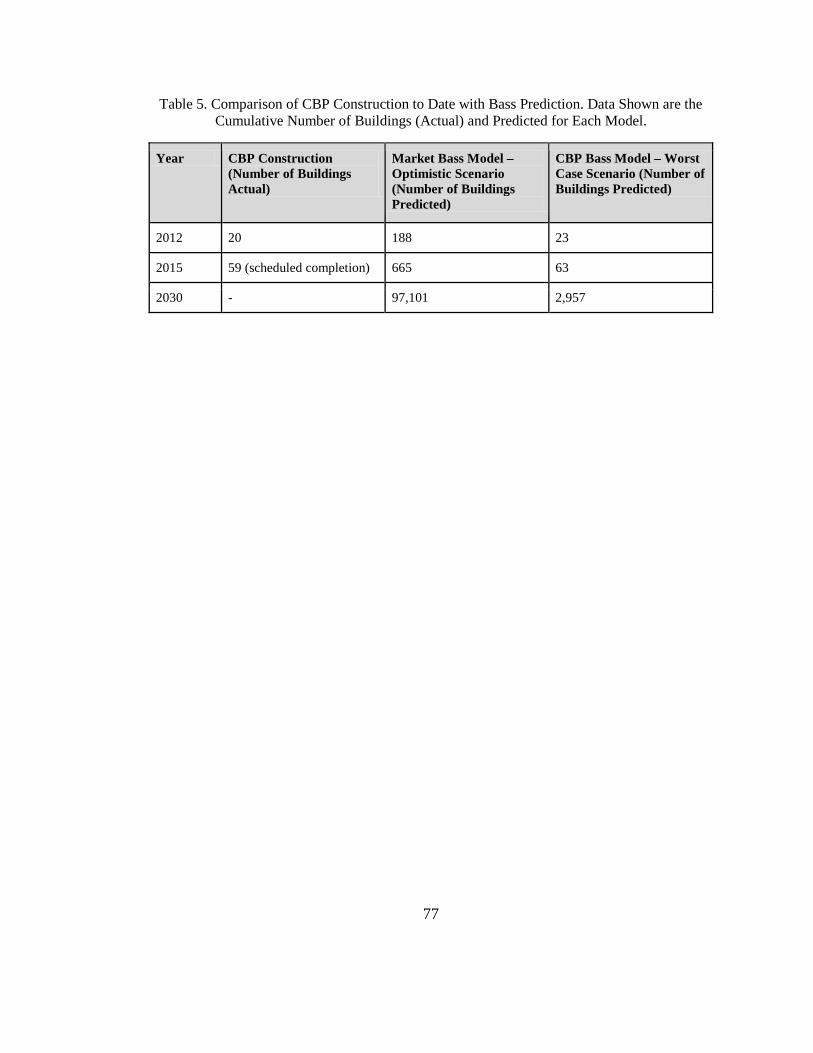
Table 5. Comparison of CBP Construction to Date with Bass Prediction. Data Shown are the Cumulative Number of Buildings (Actual) and Predicted for Each Model.
Year CBP Construction (Number of Buildings Actual)
Market Bass Model –Optimistic Scenario (Number of Buildings Predicted)
CBP Bass Model – Worst Case Scenario (Number of Buildings Predicted)
2012 20 188 23
2015 59 (scheduled completion) 665 63
2030 - 97,101 2,957
77
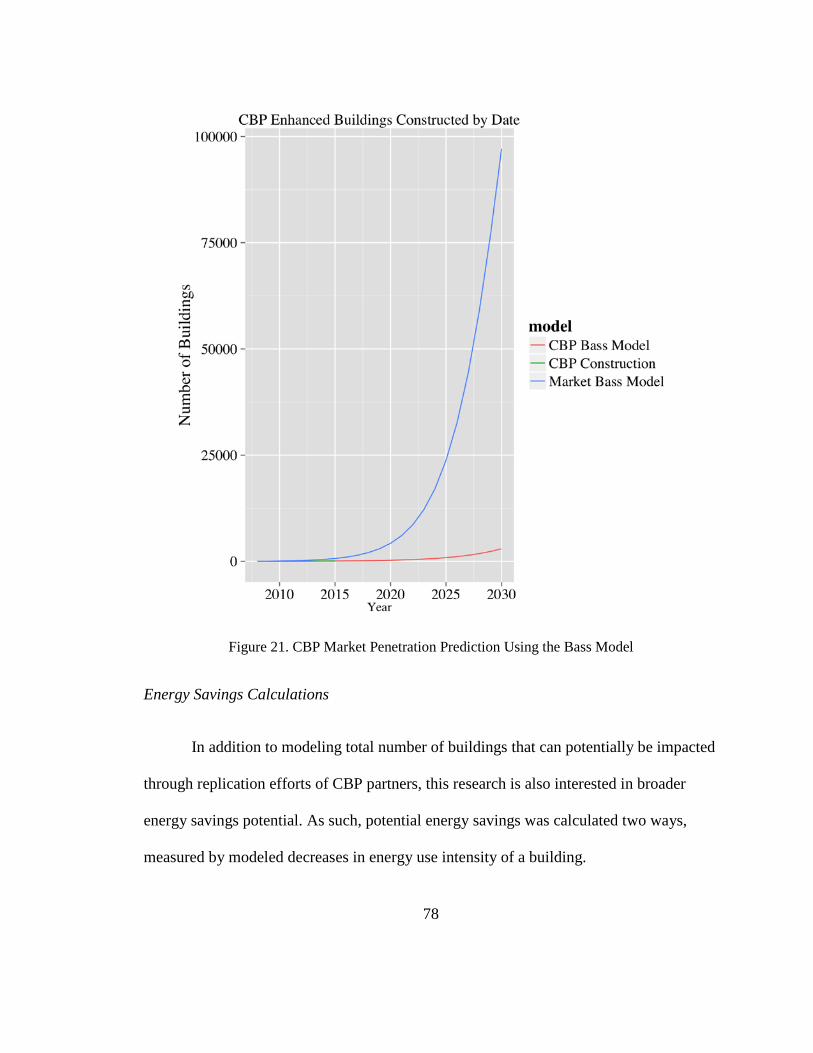
Figure 21. CBP Market Penetration Prediction Using the Bass Model
Energy Savings Calculations
In addition to modeling total number of buildings that can potentially be impacted
through replication efforts of CBP partners, this research is also interested in broader
energy savings potential. As such, potential energy savings was calculated two ways,
measured by modeled decreases in energy use intensity of a building.
78

By 2030, the diffusion model forecasts that a range of 2,957 to 97,101 buildings
will be impacted by the CBP program through partner replication efforts, representing
over 22% of all buildings in partner portfolios. This translates to between 43.5 million to
1.4 billion square feet of commercial building floor space throughout the United States.
Previous analysis efforts of CBP projects modeled energy use intensity (EUI) reductions
of 53 kBtu/ft2 for new construction projects overseen by PNNL (Baechler et al., 2012). In
an effort to extrapolate broader energy savings data, I compared this decrease in modeled
CBP EUIs with median EUI data for commercial buildings using the CBECS dataset.
Based on this analysis, the energy savings potential is between 2.3 and 77 trillion Btus
annually.
As a final part of this study, I ran a second savings calculation based on ENERGY
STAR’s portfolio manager data trends instead of CBECS. ENERGY STAR data may be
a better source for EUI numbers since it is current. CBECS data has not been updated
since 2003, so one can assume these data may be incorrect. Energy use benchmarking is
available for office, retail, K-12 school and hotel buildings, which includes median EUIs
for each building type (ENERGY STAR, 2012). I averaged the median EUI data for all
four commercial building types to use in this analysis. Note that not all building types
represented by CBP partners fall under these four categories, but it does represent the
majority of partners. The median EUIs for office, retail and hotel buildings were
averaged and calculated with EUI reductions of 53 kBtu/ft2 (from Baechler et al., 2012).
79

The resulting energy savings numbers were very similar to the comparison with CBECS,
ranging between 2.3 and 75 trillion Btus annually.
80

Chapter 7. Limitations
One of the primary limitations of this research is the small overall sample size of
CBP partners. In total, 10 respondents participated in the survey and interview data-
gathering efforts, out of a possible 11. Although small, these projects do represent
approximately 28% of the entire CBP program and approximately 1% of all commercial
building square footage in the U.S. The small sample size limited the amount of
quantitative analysis that could be done for survey and interview data, to investigate
partner replication. While still robust, the qualitative approach to the replication section
does not allow this research to speak broadly for all CBP partners, partner portfolios or
outwards to the broader commercial building market. The partners that participated in
CBP applied to the program and were chosen by DOE based on unknown criteria; these
partners may already be energy-conscious organizations compared to competitors in their
industry.
Another limitation was the fact that replication data was gathered from PNNL
CBP partners only, and not projects overseen by other national laboratories. This required
assumptions to be made regarding the approach take for energy savings and cost analysis.
The assumption that all labs would have the same recommendations regarding design of
energy efficiency and cost savings measures was made. That is to say, that it was
assumed that all labs would have assessed, modeled and implemented the same
81
technologies for each partner. Furthermore, that all labs would estimate the same energy
and cost savings. While approaches to building science are relatively synonymous,
different researchers, engineers and scientists have expertise that may sway their
preference over one technology compared to another. The same issue presents itself when
estimating cost perspectives for different technologies.
Additionally, there are potential limitations relating to spatial components of the
green building industry in the United States. Each CBP partner that participated in this
study indicated that cost savings were a primary objective, and motivation for
participating in this study. From a spatial perspective, the motivation to participate in
green building programs, or to replicate CBP measures may vary depending on a variety
of factors relating to location. These factors include variance in electricity prices,
affecting the overall cost burden of energy expenditures in the first place; firms located in
areas with low electricity prices may not be motivated by cost savings to replicate green
building measures. Similarly, spatial influences such as codes, standards, green building
programs and social norms may impact firms’ decisions whether to replicate CBP
measures. Firms located in progressive areas with many green certified buildings, or
denser urban areas may be more likely to have higher replication rates. The diffusion
model used in this study did not measure these spatial influences.
The final limitation of this research applies to the approach taken for diffusion
modeling. The greatest limitation here lies in the fact that USGBC data may not
accurately measure the coefficients for use with CBP data. There is no doubt that
82
USGBC data is the best possible option that exists, but, those data represent a program
that is different from CBP. In the first case, only new construction data was input in the
model, while the CBP program includes both new construction and existing buildings.
This was due to the fact that the overwhelming majority of USGBC data was for new
buildings, and the measurements for existing buildings was unknown when analyzing
their data. Second, the LEED program is not exactly the same as the CBP program; both
represent a whole-building approach to green building, but the CBP program does not
require a checklist-type approach to achieving certification. However, when the model
was developed, the outputs for USGBC diffusion prediction were very close to the actual
data, which justified using the dataset for this analysis.
83
Chapter 8. Conclusions
As opposed to separating conclusions based on survey/interview results and
diffusion modeling sections, this section deviates from the Findings and Discussion
Chapter by combining conclusions per the literature reviewed for this study. Thus, the
three primary sections for conclusions are: diffusion theory findings; organizational
theory, corporate social responsibility and business environmental management findings;
and energy economics findings. This approach was used in an effort to directly link the
findings of this study back to the literature and previous study in this area.
Diffusion Theory Conclusions
One of the primary findings relating to the diffusion model developed for this
analysis was an unexpected conclusion. The conclusion is that the model developed by
Bass is an effective approach to analyzing diffusion of green buildings on a whole-
building level, as opposed to individual energy efficiency measures.
When literature relating green buildings to the diffusion of technologies theory
was being reviewed, one of the primary studies found was Yudelson’s 2005 work
analyzing the market diffusion of USGBC’s LEED program (Yudelson, 2005). For his
analysis on the diffusion of USGBC LEED buildings, Yudelson used the Fisher-Pry
model for technology substitution which incorporated a 50% substitution rate into the
84
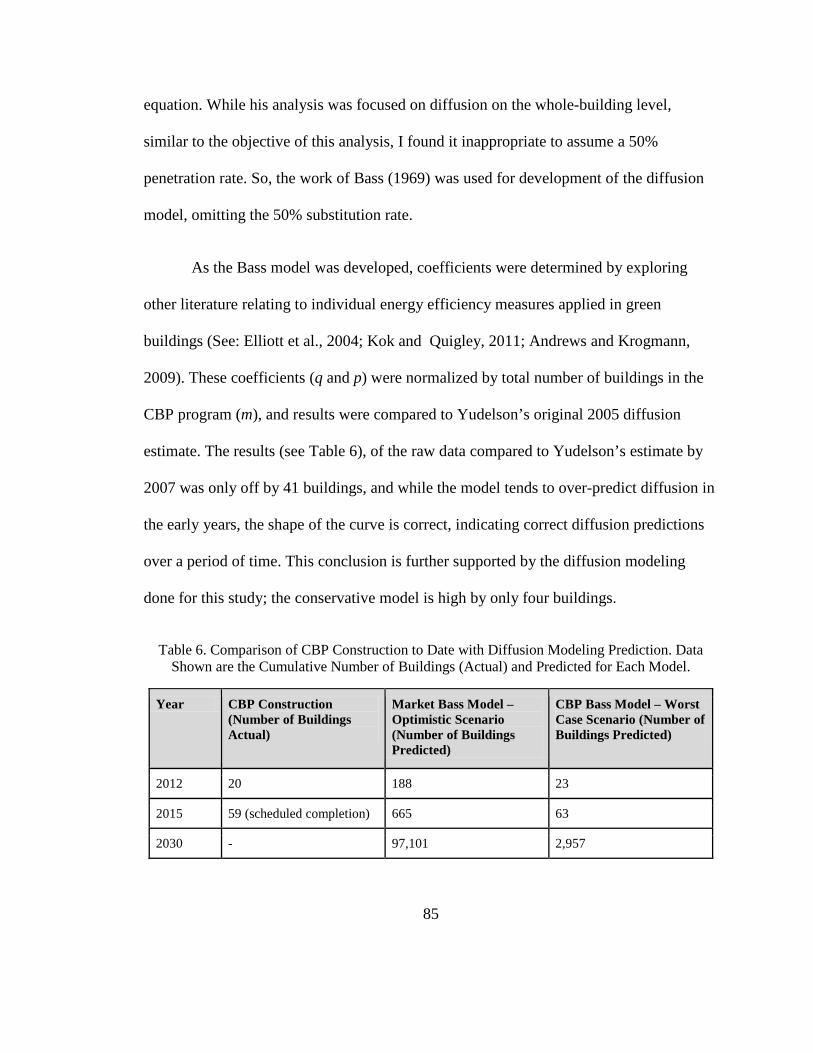
equation. While his analysis was focused on diffusion on the whole-building level,
similar to the objective of this analysis, I found it inappropriate to assume a 50%
penetration rate. So, the work of Bass (1969) was used for development of the diffusion
model, omitting the 50% substitution rate.
As the Bass model was developed, coefficients were determined by exploring
other literature relating to individual energy efficiency measures applied in green
buildings (See: Elliott et al., 2004; Kok and Quigley, 2011; Andrews and Krogmann,
2009). These coefficients (q and p) were normalized by total number of buildings in the
CBP program (m), and results were compared to Yudelson’s original 2005 diffusion
estimate. The results (see Table 6), of the raw data compared to Yudelson’s estimate by
2007 was only off by 41 buildings, and while the model tends to over-predict diffusion in
the early years, the shape of the curve is correct, indicating correct diffusion predictions
over a period of time. This conclusion is further supported by the diffusion modeling
done for this study; the conservative model is high by only four buildings.
Table 6. Comparison of CBP Construction to Date with Diffusion Modeling Prediction. Data Shown are the Cumulative Number of Buildings (Actual) and Predicted for Each Model.
Year CBP Construction (Number of Buildings Actual)
Market Bass Model –Optimistic Scenario (Number of Buildings Predicted)
CBP Bass Model – Worst Case Scenario (Number of Buildings Predicted)
2012 20 188 23
2015 59 (scheduled completion) 665 63
2030 - 97,101 2,957
85

The conclusion from the estimation of the Bass model is that it appears to
satisfactorily represent the historical cumulative construction metrics for whole-building
energy efficiency programs. The Bass model parameters developed also can provide
perspectives related to the long-term, future market diffusion of energy efficiency
programs. This conclusion was an unexpected result of this study.
Another conclusion based on diffusion analysis relates specifically to the number
of buildings potentially impacted by this program and market potential for energy
efficiency in buildings. Maximum diffusion potential for the CBP program was modeled
at over 97,000 buildings by 2030, saving between 75—77 trillion Btus of site energy
consumption annually. Market transformation occurs in the later phases of innovation,
once a particular idea has significantly penetrated the market (Lutzenhiser et al., 2001).
As CBP partners propagate energy savings into their portfolios, market transformation of
green building on a whole-building scale becomes more measureable. While green
building programs have made significant market impacts over the past decade, the CBP
program offers an optimized approach to green building as opposed to a checklist-type
approach to efficiency. This approach may promote market transformation in a broader
sense; this study can be one step in analyzing this approach.
Organizational Theory, Corporate Social Responsibility and Environmental Management Conclusions
86
The conclusions in this section are primary results of survey and interview data
relating to replication efforts by CBP partners. All participants surveyed and interviewed
for this study indicated that CSR, company culture, and sustainability initiatives played a
part in the organization’s willingness to participate in the CBP program and invest the
upfront capital necessary for efficiency upgrades in new or existing buildings. This points
to literature supporting these initiatives as discussed in the literature review. Specifically,
participation in voluntary environmental management programs must be bi-directional
since voluntary programs impact the competitiveness within an industry (Alberini and
Segerson, 2002). This means that the non-monetary motivations for partner participation
must have some sort of measurable benefits. CBP partners indicated lower maintenance,
increased employee productivity and increased comfort as the top three motivations
beyond direct cost savings. The literature points out that are environmentally minded tend
to be more willing to invest in technologies or applications that improve building or
operational efficiency (Kahanna et al., 2007, Lyon and Maxwell, 2008). This study
generally supports previous literature.
One partner interview focused specifically on company culture as being a primary
motivator for participation in the CBP program. The interview respondent noted their
organization had been promoting green building initiatives since 2004 as one of their
approaches to CSR initiatives. This respondent said that the strong company culture
towards sustainability related directly to the CEO who promoted sustainable business
development. The literature review found studies that noted companies with socially
87
conscious CEOs or upper management are also more likely to have voluntary
environmental programs (Delmas and Toffel, 2008; Ervin et al., undated; Martin et al.
2012). Findings from this study tend to support these conclusions. However, lower
maintenance and increased employee productivity, while non-monetary in terms of
energy costs, still represent overall cost savings for the organization. Cost savings,
discuss next, far outweighed any non-monetary benefits or motivations.
When asked about economic analysis metrics, half of the respondents indicated
that return on investment (ROI) was their primary economic criterion. While cost savings
were a primary motivator for most organizations, the presence of a sustainability program
may motivate these organizations to look closer at energy savings opportunities to close
the gap between base and optimal building performance. In addition to ROI assessments,
over 35% of respondents indicate a life-cycle cost analysis is conducted by the firm
speaking to this issue. Since life-cycle cost analyses focus on environmental attributes of
potential investments, organizations may be using these methods as a way to better look
at energy efficiency investments compared to traditional ones. Such analysis would
promote green building measures that may otherwise be seen as unfavorable through a
traditional ROI assessment.
Energy Economics Conclusions
Unlike the previous two conclusion sections, the findings relating to energy
economics relate to both survey and interview data, along with diffusion modeling
88
outputs. The number one conclusion reached relating to energy economics, primarily
from survey and interview results is that operating cost reductions were the primary
motivation for all organizations that participated in the CBP program. Additionally, five
CBP partners indicated that energy costs are amongst the largest cost categories in
expense budgets. The terms “triple bottom line” and “win-win-win” are used to describe
firms who are trying to maximize profits, reduce costs and protect the environment. In an
effort to achieve this, many companies aim for product differentiation and profit
maximizing potential (Reinhardt, 2000; Blackman, 2010; Lyon and Maxwell, 2008).
Participation in the CBP program allowed partners to optimize packages allowing them to
save energy and costs for their building project based directly on their location and usage
profile, supporting the literature regarding cost reduction and CSR motivations.
In addition, specific technologies were chosen by CBP partners for their cost
reduction potentials. LED lighting, energy management systems, and occupancy sensors
all had 100% replication rate. In addition, one partner indicated that they are installing
variable frequency drives (VFD) on rooftop HVAC units in 130 stores. Two respondents
indicated that VFDs represented the greatest energy savings when installed on chillers
and HVAC fan motors, compared to other EEMs. Studies have explored cost savings
related to specific technologies and climate modeling (Kneifel, 2010; Howarth, 2010;
Belzer, 2009). Technology-specific replication data from the survey and follow-up
interviews seem to be in conjunction with this.
89

One way to determine replication impacts over the long term is to gain
insight into protocol development, monitoring and verification (M&V) activities, and
operations plans and documentation of CBP partners. Better understanding of these
organizational structures can help provide validation and demonstration that replication is
occurring, and that it is successful and impactful when compared to the overall energy
footprint of an entire organization. In one sense, this can be seen as risk management
efforts for the organizations participating in the CBP program. Because each organization
had the opportunity to “test” technologies, and develop a testbed for benchmark energy
operations, these may be used in the future as a way to prove certain technologies meet
cost savings requirements of the firm, motivating them to implement the measures into
other buildings. Similarly, M&V procedures further allow organizations to monitor the
performance of these technologies over the long term. Maintaining optimal performance
of these technologies can promote more company investment in energy saving
technologies.
Although organizations were highly motivated by cost savings potential,
incentives seemed to play a small role in decision making related to replication. Only
three organizations received incentives to increase the energy efficiency of their building
project, all of them from utility programs.
Diffusion model outputs, while focused specifically on number of buildings
potentially impacted by the CBP program, did also have a cost component. Cost savings
associated with the CBP program is associated with the extrapolation of broader energy
90
savings data from model outputs. Previous analysis efforts of CBP projects modeled
energy use intensity (EUI) reductions of 53 kBtu/ft2 for new construction projects
overseen by PNNL (Baechler et al., 2012). The upper bound of energy savings potential
was calculated between 75 and 77 trillion Btus annually of site energy consumption.
While further calculations pertaining to specific cost savings potential for these amounts
were not conducted, it is fair to assume the savings associated with such large amounts is
significant.
Finally, this research may be able to help lay foundations for further study relating
structural approaches to building energy efficiency and behavior. Unlike other green
building programs, the CBP program includes a monitoring and verification period for
one year. While the program is still too young to accurately measure whether energy
savings modeled is the same as actual, it is now an objective of the management. Weber
found that energy efficiency decisions in office buildings tend to be about investments,
with specialists inside the firm being the primary decision maker (Weber, 1999). Because
the CBP program partnered with firms engineering or construction projects, and because
the program has a measurement and verification component, it may be likely that these
buildings operate closer to modeled performance.
91
Works Cited
110 USC Sec. 1305. (2007). Energy Independence and Security Act of 2007 (EISA). Public Law 110-140. Alberini, A., and Segerson, K. (2002). Assessing voluntary programs to improve environmental quality. Environmental and Resource Economics, 22(1-2), 157-184. Allcott, H., and Mullainathan, S. (2010). “Behavioral science and energy policy.” Science, 327(5970), 1204-1205. Andrews, C. J., and Krogmann, U. (2009). Technology diffusion and energy intensity in US commercial buildings. Energy Policy, 37, 541-553. ASHRAE--American Society of Heating, Refrigeration and Air Conditioning Engineers. (2011). ASHRAE Guideline 0: The Commissioning Process. 2011.09.28. Athalye, R. A., Xie, Y., Liu, B., & Baechler, M. C. (2012). A Case Study: Using Integrated Approach to Design a Net-Zero Bank Branch (No. PNNL-SA-85026). Pacific Northwest National Laboratory (PNNL), Richland, WA (US). Baechler, M., Dillon, H., and R. Bartlett. (2012). Commercial Building Partners Catalyze Energy Efficient Buildings Across the Nation. Paper presented at the 2012 ACEEE Summer Study on Energy Efficiency in Buildings, Pacific Grove, CA. Bass, F. M. (1969). A new product growth for model consumer durables. Management Science, 15 (5), 215-227. Belzer, D. B. (2009). Energy Efficiency Potential in Existing Commercial Buildings: Review of Selected Recent Studies. PNNL-18337. Pacific Northwest National Laboratory, Richland, WA. Biggart, N. W., and Lutzenhiser, L. (2007). Economic sociology and the social problem of energy inefficiency. American Behavioral Scientist, 50(8), 1070-1087. Blackman, A. (2010). Alternative pollution control policies in developing countries. Review of Environmental Economics and Policy, 4(2), 234-253.
92

Blumstein, C., Goldman, C., and G. Barbose. (2005). “Who should administer energy efficiency programs?” Energy Policy, 33(8), 1053–1067. Charles, D. (2009). Leaping the efficiency gap. Science, 325(5942), 804-811. Claudy, M. C., Michelsen, C., and O’Driscoll, A. (2011). The diffusion of microgeneration technologies–assessing the influence of perceived product characteristics on home owners' willingness to pay. Energy Policy, 39(3), 1459-1469. Delmas, M. A., and Toffel, M. W. (2008). Organizational responses to environmental demands: Opening the black box. Strategic Management Journal, 29(10), 1027-1055. Deuble, M.P. and de Dear, R.J. (2012) Green occupants for green buildings: The missing link? Building and Environment, 56, pp. 21-27. DiMaggio, P.J. and Powell, W.W.. (1991). Introduction. In Powell, W.W. and P. J. DiMaggio (Eds.). The New Institutionalism in Organizational Analysis. Chicago, IL: University of Chicago Press. Ding, G. K. (2008). “Sustainable construction—the role of environmental assessment tools.” Journal of Environmental Management, 86(3), 451-464. DOE—U.S. Department of Energy. (2013). Building Energy Codes Program. Status of State Energy Code Adoption. Energy Efficiency and Renewable Energy, U.S. Department of Energy, Washington D.C. http://www.energycodes.gov/status-state-energy-code-adoption DOE—U.S. Department of Energy. (2012a). Buildings Energy Data Book. Chapter 1: Buildings Sector. Energy Efficiency and Renewable Energy, U.S. Department of Energy, Washington D.C. http://buildingsdatabook.eren.doe.gov/ChapterIntro1.aspx?1#1. DOE—U.S. Department of Energy. (2012b). Buildings Energy Data Book. 3.2: Commercial Sector Characteristics. Energy Efficiency and Renewable Energy, U.S. Department of Energy, Washington D.C. http://buildingsdatabook.eren.doe.gov/TableView.aspx?table=3.2.1. DOE—U.S. Department of Energy. (2012c). Buildings Energy Data Book. 1.4: Environmental Data. Energy Efficiency and Renewable Energy, U.S. Department of Energy, Washington D.C. http://buildingsdatabook.eren.doe.gov/TableView.aspx?table=1.4.1. DOE—U.S. Department of Energy. 2013. Commercial Building Partnerships. http://www1.eere.energy.gov/buildings/commercial/cbp.html.
93
DOE—U.S. Department of Energy. (2011b). Commercial Building Partnerships: Mainstreaming Energy Efficient Strategies. U.S. Department of Energy, Washington D.C. http://apps1.eere.energy.gov/buildings/publications/pdfs/alliances/cbp_factsheet.pdf. DOE—U.S. Department of Energy (2011a). Federal Sustainable Building and Campus Requirements. Federal Energy Management Program, U.S. Department of Energy, Washington D.C. http://www1.eere.energy.gov/femp/program/sustainable_requirements.html EIA—U.S. Energy Information Administration. (2012). Annual Energy Review 2011. DOE/EIA-0384 (2011). U.S. Energy Information Administration, Washington, D.C. http://www.eia.gov/totalenergy/data/annual/pdf/aer.pdf. EIA—U.S. Energy Information Administration. (2008). Commercial Building Energy Consumption Survey (CBECS). U.S. Energy Information Administration, Washington, D.C. http://www.eia.gov/emeu/cbecs/cbecs2003/detailed_tables_2003/detailed_tables_2003.html. EIA—U.S. Energy Information Administration. (2008). Commercial Building Energy Consumption Survey (CBECS). Summary Table for All Buildings. U.S. Energy Information Administration, Washington, D.C. http://www.eia.gov/consumption/commercial/data/archive/cbecs/cbecs2003/detailed_tables_2003/2003set1/2003html/a1.html. ENERGY STAR. (2012). Portfolio Manager Data Trends. Retrieved from http://www.energystar.gov/buildings/about-us/research-and-reports/portfolio-manager-datatrends. EPA—U.S. Environmental Protection Agency. (2013). Design Commercial Buildings. Step 2: Set an Energy Performance Target. U.S. Environmental Protection Agency, Washington, D.C. http://www.energystar.gov/buildings/service-providers/design/step-step-process/set-target. Elliott, D. B., Anderson, D. M., Belzer, D. B., Cort, K. A., Dirks, J. A., and Hostick, D. (2004). Methodological Framework for Analysis of Buildings-Related Programs : The GPRA Metrics Effort. Pacific Northwest National Laboratory, Richland, WA. Ervin D., J. Wu, M. Khanna, C. Jones, T. Wirkala, and P. Koss “Economic and Institutional Factors Affecting Business Environmental Management” PSU Economics an ESM Working paper.
94
Fagerberg, J. (2003). Innovation: a guide to the literature. Paper presented at the Workshop “The Many Guises of Innovation: What we have learnt and where we are heading”, Ottawa, October 23-24.2003, organized by Statistics Canada. Fisher, J. C., and Pry, R. H. (1971). A simple substitution model of technological change. Technological Forecasting and Social Change, 3, 75-88. Getter, K. L., and Rowe, D. B. (2006). “The role of extensive green roofs in sustainable development.” HortScience, 41(5), 1276-1285. Gillingham, K., Newell, R. G., and Palmer, K. (2009). “Energy efficiency economics and policy” (No. w15031). National Bureau of Economic Research. Washington, D.C. http://www.rff.org/documents/rff-dp-09-13.pdf. Hägerstrand, T. (1965). A Monte Carlo approach to diffusion. European Journal of Sociology, 6(1) 43-67. Harmelink, M., Nilsson, L., and R. Harmsen. (2008). Theory-based policy evaluation of 20 energy efficiency instruments. Energy Efficiency. Vol. 1, pp. 131-148. Hoffman, A. J., and Henn, R. (2008). Overcoming the social and psychological barriers to green building. Organization & Environment, 21(4), 390-419. Howarth, B., R., Haddad, B. M., and Paton, B. (2000). The economics of energy efficiency: insights from voluntary participation programs. Energy Policy, 28 (6), 477-486. Hudson, J. C. (1969). Diffusion in a central place system. Geographical Analysis, 1(1), 45-58. ICC—International Code Council. (2012). International Energy Conservation Code. International Code Council, Washington D.C. http://www.iccsafe.org/Pages/default.aspx. International Living Future Institute. (2013). Living Building Challenge, 2.1. International Living Future Institute, Seattle WA. http://living-future.org/sites/default/files/LBC/LBC_Documents/LBC%202_1%2012-0501.pdf. Jaffe, A. B., & Stavins, R. N. (1994b). The energy-efficiency gap What does it mean? Energy policy, 22(10), 804-810. Jaffe, A., and R. Stavins (1994a). The energy paradox and the diffusion of conservation technology. Resource and Energy Economics. 16, 91-122.
95
Kibert, C. J. (1999). Reshaping the built environment: Ecology, ethics, and economics. Chicago, IL: Island Press. Khanna, M., Koss, P., Jones, C. and Ervin, D. (2007). Motivations for voluntary environmental management. Policy Studies Journal, 35, 751–772. Klemick, H. (2013). Energy-Efficiency Gap. Encyclopedia of Energy, Natural Resource, and Environmental Economics. Kline, S. J. and N. Rosenberg. (1986). An Overview of Innovation. In R. Landau and N. Rosenberg (Eds.) The Positive Sum Strategy: Harnessing Technology for Economic Growth, Washington D.C.: National Academy Press. Kneifel, J. (2010). Life-cycle carbon and cost analysis of energy efficiency measures in new commercial buildings. Energy and Buildings, 42 (3), 333-340. Kok, N., McGraw, M., and Quigley, J. M. (2011). The diffusion of energy efficiency in building. American Economic Review, 101(3), 77-82. Levine, M., S. de la Rue de Can, N. Zheng, C. Williams, J. Amann, and D. Staniaszek. (2012). Building Energy-Efficiency Best Practice Policies and Policy Packages. LBNL-6006E. Lawrence Berkeley National Laboratory, Berkeley, CA. Lutzenhiser, L., Kunkle, R., and Biggart, N. W. (2001). Market structure and energy efficiency: The case of new commercial buildings. California Institute for Energy Efficiency. Lyon, T. P., and Maxwell, J. W. (2008). Corporate social responsibility and the environment: A theoretical perspective. Review of Environmental Economics and Policy, 2(2), 240-260. Marszal, A. J., Heiselberg, P., Bourrelle, J. S., Musall, E., Voss, K., Sartori, I., and Napolitano, A. (2011). Zero Energy Building–A review of definitions and calculation methodologies. Energy and Buildings, 43(4), 971-979. Martin, R., Muûls, M., de Preux, L. B., and Wagner, U. J. (2012). Anatomy of a paradox: Management practices, organizational structure and energy efficiency. Journal of Environmental Economics and Management, 63(2), 208-223. Melton, P. (2012). Doing daylight right. Environmental Building News, 21(4).
96

Norton, J. A., and Bass, F. M. (1987). A diffusion theory model of adoption and substitution for successive generations of high-technology products. Management science, 33(9), 1069-1086. Patenaude, G. (2011). Climate change diffusion: While the world tips, business schools lag. Global Environmental Change, 21(1), 259-271. Porter, M. E., and Van der Linde, C. (1995). Toward a new conception of the environment-competitiveness relationship. The journal of economic perspectives, 9(4), 97-118. Portney, P. R. (2005). Corporate Social Responsibility. In B. Hay, R. Stavins and R. Vietor (Eds.). Environmental Protection and the Social Responsibility of Firms—Perspectives from Law, Economics, and Business. Baltimore, MD: Johns Hopkins University Press. Pred, A. R. (1975). Diffusion, Organizational spatial structure, and city-system development. Economic Geography, 51(3) 252-268. Pred, A. R. (1974). Major Job-Providing Organizations and Systems of Cities. Association of American Geographers, Commission on College Geography Resource Paper 27. Reinhardt, F. (2000). Down to Earth: Applying Business Principles to Environmental Management. Boston, MA: Harvard Business Press. Reinhardt, F. L., Stavins, R. N., and Vietor, R. H. (2008). Corporate social responsibility through an economic lens. Review of Environmental Economics and Policy, 2(2), 219-239. Retzlaff, R. (2009). Green buildings and building assessment systems: A new area of interest for planners. Journal of Planning Literature, 24(1), 3-21. Rogers, E. M. (1995). Diffusion of Innovations. Fourth Edition. New York, NY: The Free Press. Sachs, H., Nadel, S., Amann, J. T., Tuazon, M., Mendelsohn, E., Rainer, L., and Adelaar, M. (2004). “Emerging energy-saving technologies and practices for the buildings sector as of 2004.” In American Council for an Energy-Efficient Economy. Shove, E. (1998). Gaps, barriers and conceptual chasms: theories of technology transfer and energy in buildings. Energy Policy, 26(15), 1105-1112.
97

State of California. (2002). State of California's Sustainable Building Technical Group. Sustainable Building Guidelines. Retrieved from http://www.calrecycle.ca.gov/greenbuilding/design/guidelines.htm The R Project for Statistical Computing. (2013). Retrieved September 3, 2013 from http://www.r-project.org/index.html. Torcellini, P., Pless, S., Deru, M., and Crawley, D. (2006). Zero energy buildings: A critical look at the definition. Paper presented at the ACEEE Summer Study on Energy Efficient Buildings, Pacific Grove, CA. ürge-Vorsatz, D., Harvey, D., Mirasgedis, S., and M. Levine. (2007). Mitigating CO2 emissions from energy use in the world's buildings. Building Research & Information. 35(4), 2007. USGBC—U.S. Green Building Council. (2012). LEED. U.S. Green Building Council, Washington, D.C. https://new.usgbc.org/leed. USGBC—U.S. Green Building Council. (2013). LEED Rating Systems. U.S. Green Building Council, Washington, D.C. http://www.usgbc.org/leed/rating-systems. Verdolini, E. and Galeotti, M. (2010). At Home and Abroad: An Empirical Analysis of Innovation and Diffusion in Energy-Efficient Technologies. FEEM Working Paper No. 123.2009. Available at http://dx.doi.org/10.2139/ssrn.1533282 Weber, L. (1999). Beyond energy conservation: Energy-relevant decisions within office buildings. Energy efficiency and CO2 reduction: the dimensions of the social challenge. Proceedings of the 1999 ECEEE summer study, part 2. Weiss, M., Junginger, M., Patel, M. K., and Blok, K. (2010). A review of experience curve analyses for energy demand technologies. Technological Forecasting and Social Change, 77(3), 411-428. Wilson, A. (1998). Getting to know a place: Site evaluation as a starting point for green design. Environmental Building News. (No issue number). http://www.buildinggreen.com/auth/article.cfm/1998/3/1/Getting-to-Know-a-Place-Site-Evaluation-as-a-Starting-Point-for-Green-Design/ Xie, Y., Liu, B., Athalye, R., Baechler, M., and Sullivan, G. (2012). “Measuring and understanding the energy use signatures of a bank building.” Preprint. ACEEE Summer Study on Energy Efficiency in Buildings.
98

Yudelson, J. (2005). Predicting the growth of green buildings using the “Diffusion of Innovations” theory. Yudelson Associates, Tuscon, AZ.
99
Appendix A: CBP Partner Introductory Letter
100

April 15, 2013
Hello CBP Partner,
Thank you for participating in our efforts to assess replication efforts by CBP program participants. This outline provides information about the two mechanisms PNNL will be utilizing to gather feedback about replication efforts of your company. PNNL will focus on two primary questions for this study:
1. How are CBP partners replicating specific measures, treatments and processes? 2. How does the public know that these measures are being replicated?
In an effort to streamline this process and respect the limited time of each partner, PNNL has developed a two-step approach to receiving replication information from each partner. First, PNNL will be distributing an online feedback mechanism (through Survey Monkey) for each partner to complete. PNNL requests each partner complete the questionnaire and returns back to PNNL within 2 weeks. We will also schedule a 15 minute follow-up phone conversation to ask a few additional questions and to gather further information about the questionnaire. You will be speaking with Chrissi Antonopoulos, Energy Analyst with PNNL. The follow-up meeting will take no longer than 15 minutes, unless otherwise preferred by each partner. The questionnaire and phone interview contain questions that inform PNNL about your organization’s approach to implementing energy efficiency measures and how your company is replicating these measures throughout your entire building portfolios. The primary focus will be on measures implemented during the CBP program process. We are excited to hear about your experience with the CBP program and are looking forward to our discussion. All data gathered will be used for analysis only and no company will be specifically identified directly in this research.
101

The schedule for these efforts is broken out below: May 10, 2013: Feedback questionnaire distributed electronically May 24, 2013: Feedback questionnaire due back to PNNL Week of May 24, 2013: Follow-up interviews scheduled Week of June 10, 2013: Follow-up interviews concluded Feel free to contact me with any questions. __________________________________________________ Chrissi Antonopoulos Associate Energy Analyst Energy and Environment Directorate Pacific Northwest National Laboratory 620 SW 5th, Suite 800 Portland, OR, 97204 Tel: (503) 417-7543 Fax: (503) 417-2175 [email protected] www.pnnl.gov
102
Appendix B: CBP Partner Survey Instrument
103

104
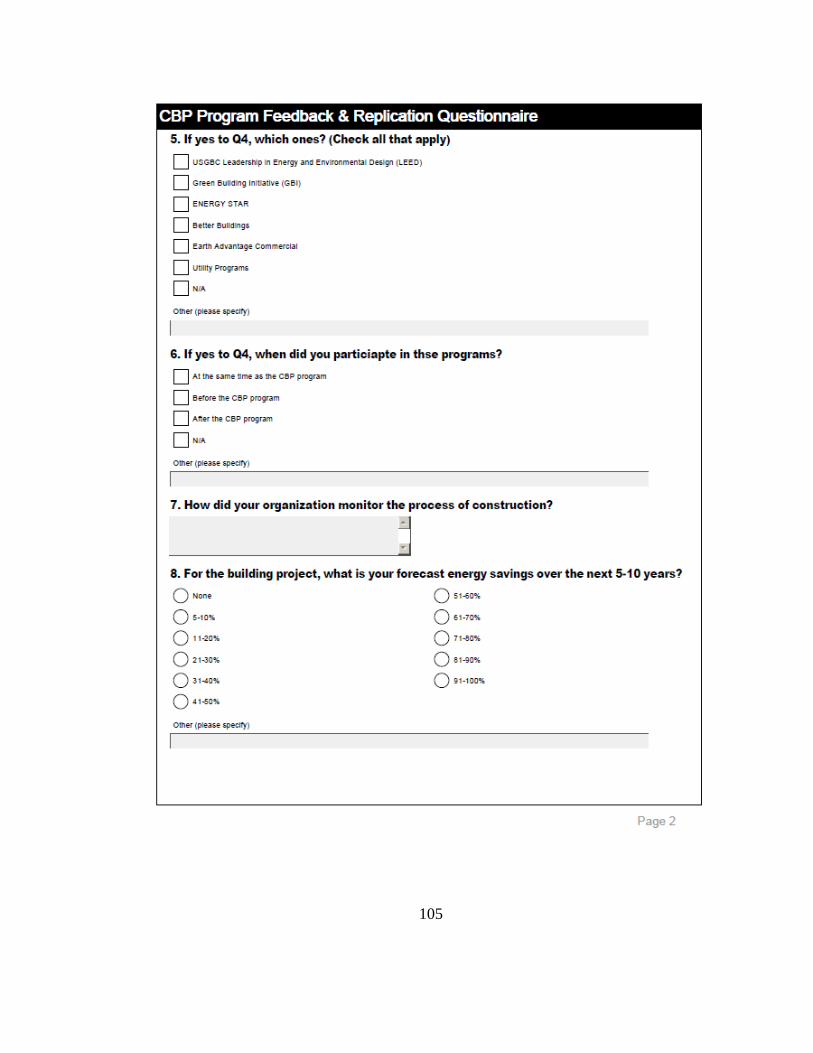
105
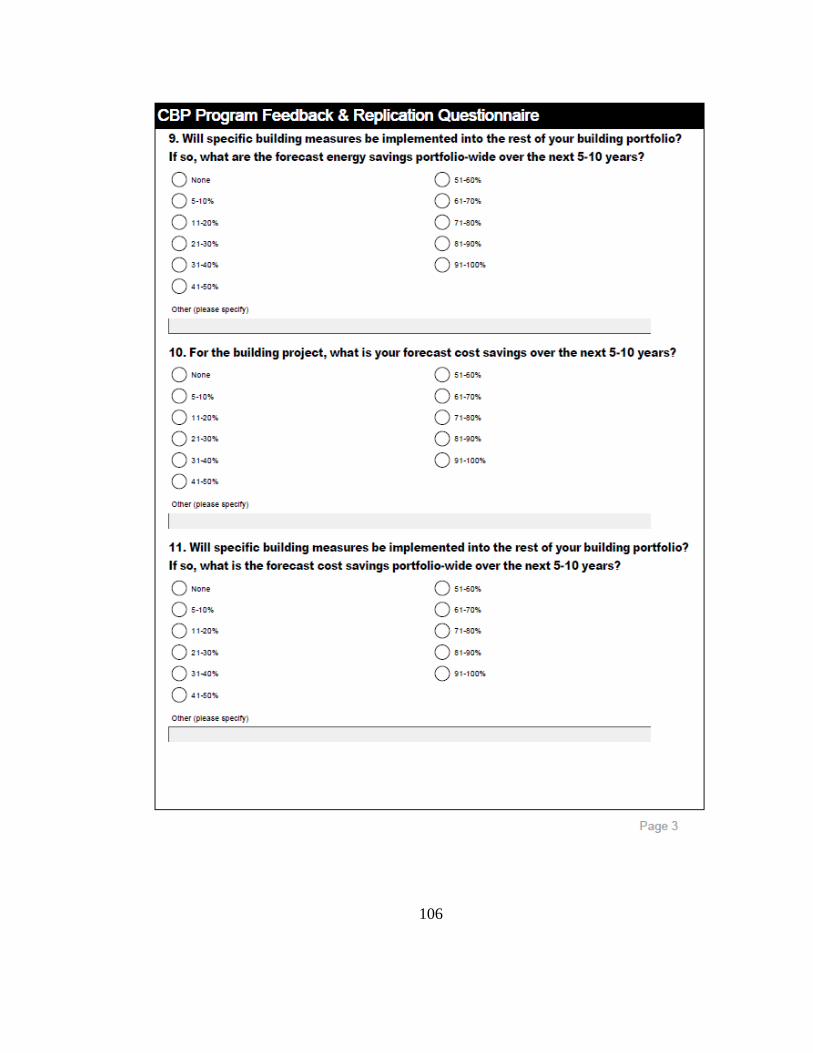
106

107

108

109

110

111
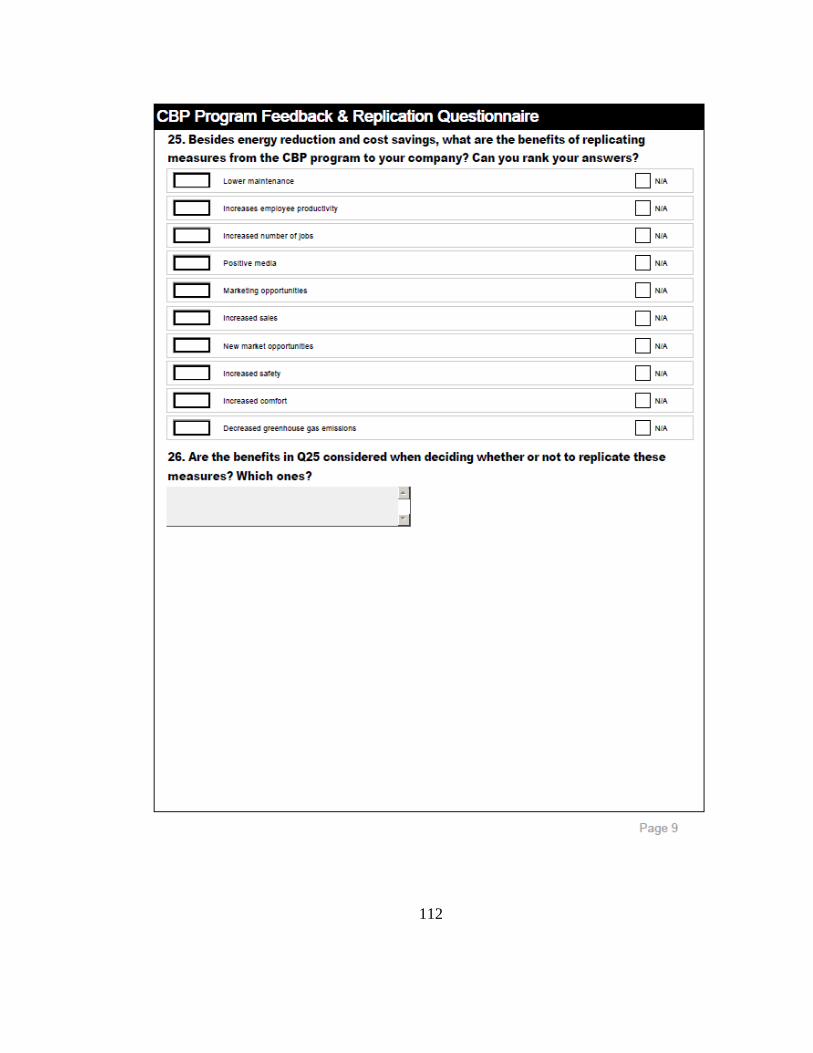
112

113

114

Appendix C: CBP Partner Follow-Up Interview Questions
115
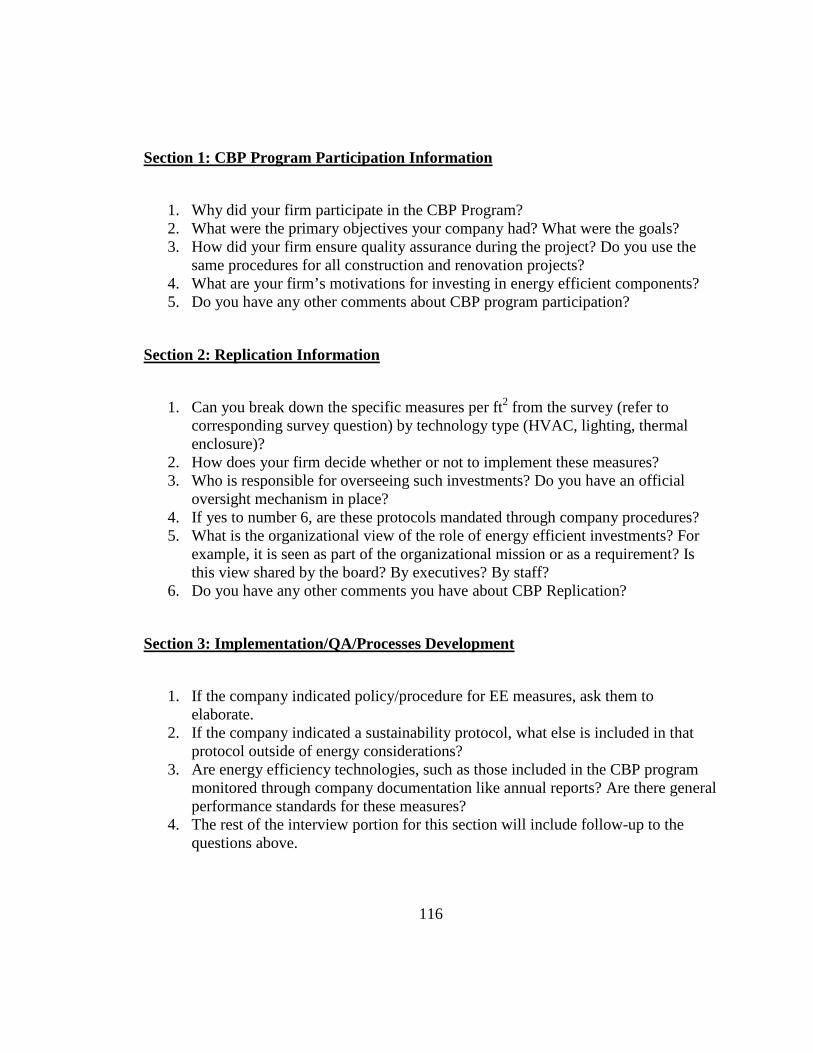
Section 1: CBP Program Participation Information
1. Why did your firm participate in the CBP Program? 2. What were the primary objectives your company had? What were the goals? 3. How did your firm ensure quality assurance during the project? Do you use the
same procedures for all construction and renovation projects? 4. What are your firm’s motivations for investing in energy efficient components? 5. Do you have any other comments about CBP program participation?
Section 2: Replication Information
1. Can you break down the specific measures per ft2 from the survey (refer to corresponding survey question) by technology type (HVAC, lighting, thermal enclosure)?
2. How does your firm decide whether or not to implement these measures? 3. Who is responsible for overseeing such investments? Do you have an official
oversight mechanism in place? 4. If yes to number 6, are these protocols mandated through company procedures? 5. What is the organizational view of the role of energy efficient investments? For
example, it is seen as part of the organizational mission or as a requirement? Is this view shared by the board? By executives? By staff?
6. Do you have any other comments you have about CBP Replication?
Section 3: Implementation/QA/Processes Development
1. If the company indicated policy/procedure for EE measures, ask them to elaborate.
2. If the company indicated a sustainability protocol, what else is included in that protocol outside of energy considerations?
3. Are energy efficiency technologies, such as those included in the CBP program monitored through company documentation like annual reports? Are there general performance standards for these measures?
4. The rest of the interview portion for this section will include follow-up to the questions above.
116