Embed Size (px)
Citation preview

Diggers and Dealers, Kalgoorlie, August 2, 2010
The Clash of Civilizations… and the Scramble for
Commodities

Credentials

The mood in the room
Basic Materials equity index compared with financial services and consumer goods
+24% YoY

So where are we?
• The West has narrowly avoided Great Depression 2.0
• Through massive fiscal and monetary stimulus• Which may yet prove insufficient to achieve
sustained recovery, but sufficient to cause fiscal crisis
• The Rest meanwhile have suffered much less• Thanks mainly to China’s sustained growth

A two-speed world
Source: IMF

The shift from West to East
Source: IMF

… now seems unstoppable
Source: Goldman Sachs
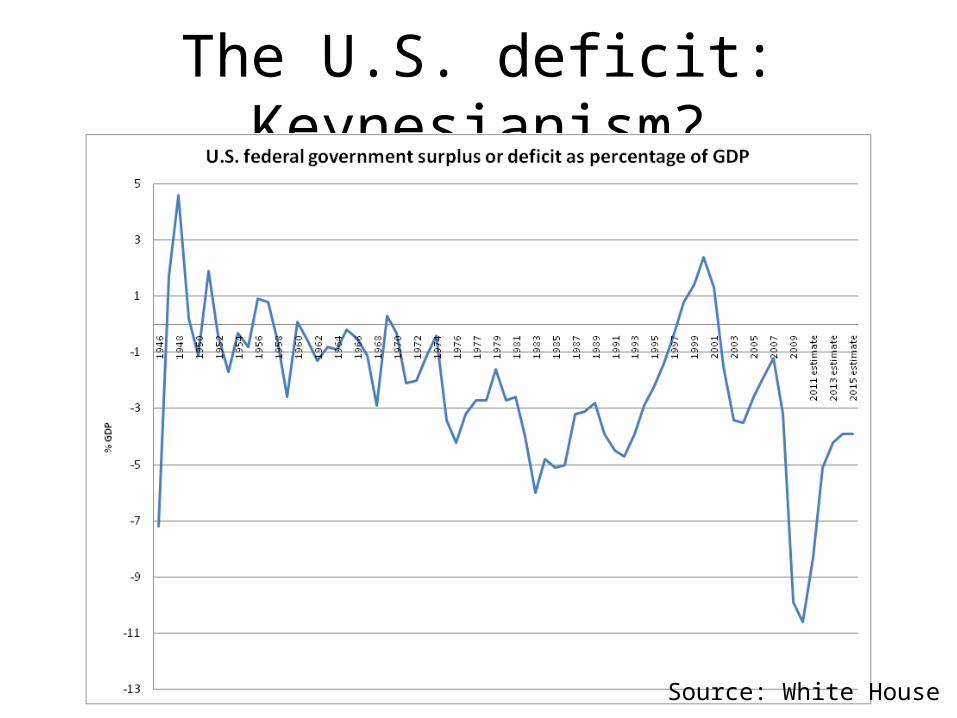
The U.S. deficit: Keynesianism?
Source: White House

Or world war finance without the war
Source: White House

America’s ticking time bomb: Debt
Source: CBO

Source: BIS
Debt/GDP projections
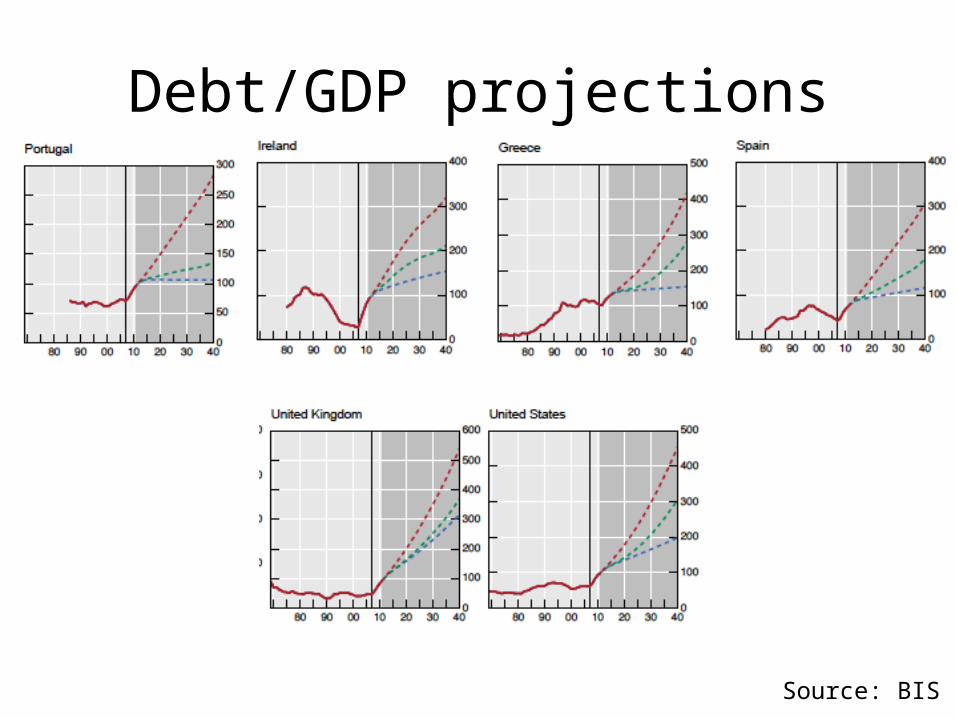
Source: BIS
Debt/GDP projections

PIGS‘R’US

Inflation can’t help the U.S.
Source: Bridgewater

The big crossover is approaching
Source: White House

But when?
2010 9%2020 15-20%2030 17-36%2040 17-58%2050 17-85%
Source: CBO

From 13% to 10% of total federal debt in public hands (-20%); from 26% to 22% of foreign holdings
Source: TIC Monthly Reports
China sells Treasuries

China: the new growth engine
Source: Bridgewater

An appetite for automobiles
Chinese auto sales have gone from 2 million per year in 2005 to a 14 million, c/w U.S. 11 million annualized. Without China, the global levels of demand for autos would be near 30-year lows.
Source: Bridgewater

An appetite for commodities
Source: Bridgewater

China: The overseas investor
• January 2010: Chinese investors made direct investment in 420 overseas enterprises in 75 countries and regions: $2.4 bn
• Asia 44.7%; Africa 41.8%• Communication & transportation 33.9%;
petrochemical 24%• Labor service personnel dispatched overseas in
January: 24,200• Total LSP overseas 770,000
Source: China.CN http://en.china.cn/content/d732706,cd7c6d,1912_6577.html

China’s alternative to Chimerica
• Reduce dependence on U.S. consumer; increase domestic consumption
• Exchange dollar reserves for commodity stockpiles and assets– Informal empire in Africa– The “axis of oil”: Iran, Sudan, Venezuela– Cultivate relations with Australia, Brazil, Canada

Australia: A target of opportunity?
• Mineral industry: 8.9% of GDP and 38% of total exports; China biggest customer
• ABARE forecasts export earnings for Australian mineral and energy commodities will increase by 18.6% to $154 bn in 2010-11
• Geoscience Australia calculates that the country's “economic demonstrated resources” of iron currently amount to 24 bntonnes
• But there’s much more than iron ore …

Source:Geoscience Australia

Blessing and curse of resource riches
• Strong growth at a time of near Depression: only one negative quarter since 2007
• Strong terms of trade as Chinese over-supply manufactures and over-buy commodities
• Happy land attractive to skilled migrants
• Dutch disease as other sectors wither
• Growing strategic dependency on China
• Parochial politics as swing voters resist “Big Australia”
• 21 million population = Shanghai plus Beijing (23 million)

Understanding the new epoch
• Chinese demand for all commodities, combined with supply bottlenecks, is creating the highest correlations in commodity prices since the world wars
• Recent price volatility and correlations incentivize China to own commodity assets
• Historically, conflicts over commodities have been at the heart of all the great imperial struggles since the 17th century (gold), 18th (sugar), 19th (coal and iron) and 20th (oil)


Industrial revolution 1.0
• North-Western industrial revolution depended on the proximity, elasticity and cheapness of the supply of coal
• It also depended on the ability to import even cheaper food and raw materials from poor primary producers
• Fossil fuels were plentiful, money scarce (gold)
• German challenge to Britain was serious partly because of her superior coal production and …
• Her ability to mount a naval (submarine) challenge to British food imports
• Plus her Japanese alliance

Industrial revolution 2.0• Asian industrial revolution is
causing fossil fuel consumption to exceed production*– OECD efforts to reduce CO2
emissions are being swamped**
– Increased ethanol production*** is a chimera
• Constraints on agricultural production are causing a food price shock round the world
• Quantitative easing means paper money is plentiful, commodities scarce
• This will increase political instability and reduce international cooperation
• Doubtful if China’s “quiet rise” can continue to harmonize with U.S. hegemony in Asia-Pacific
*72% of increased global coal consumption in 2006 **Carbon emissions up 35% since 1990 ***Up 100% 2002-6

The old face of empire

The new face of empire
© Niall Ferguson 2010