Embed Size (px)
Citation preview
1
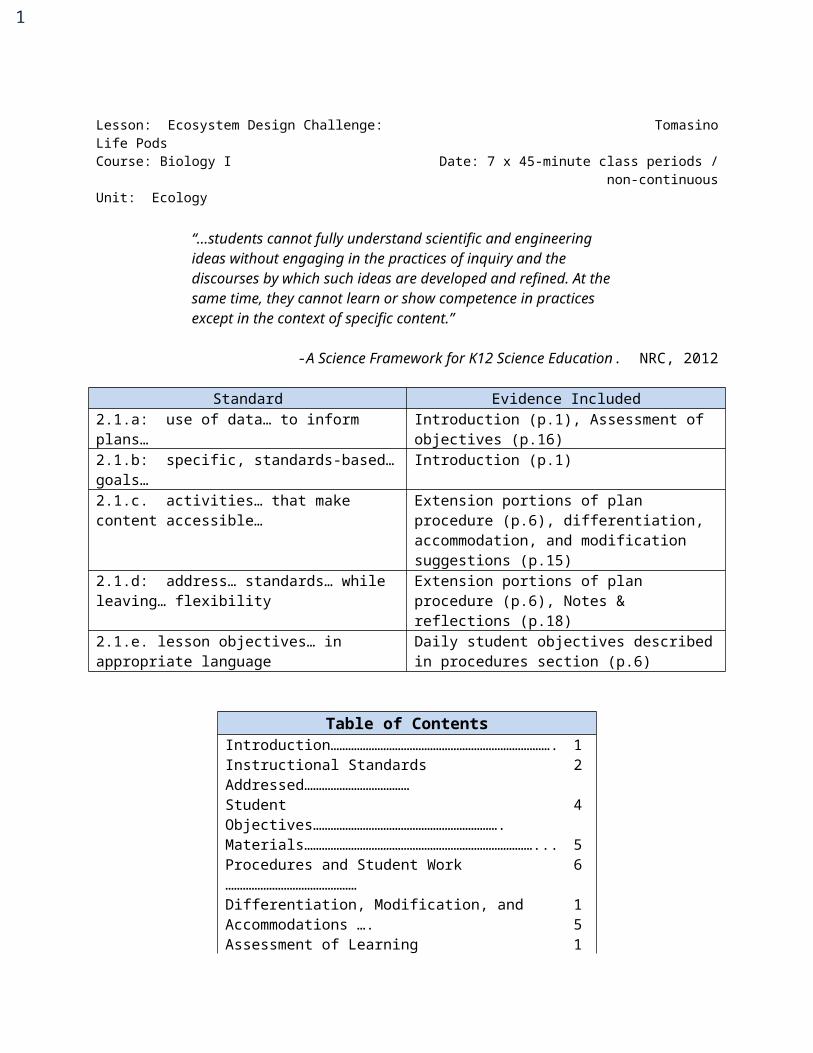
Lesson: Ecosystem Design Challenge: Life Pods TomasinoCourse: Biology I Date: 7 x 45-minute class periods / non-continuousUnit: Ecology
“…students cannot fully understand scientific and engineering ideas without engaging in the practices of inquiry and the discourses by which such ideas are developed and refined. At the same time, they cannot learn or show competence in practices except in the context of specific content.”
-A Science Framework for K12 Science Education. NRC, 2012
Standard Evidence Included2.1.a: use of data… to inform plans… Introduction (p.1), Assessment of objectives (p.16)2.1.b: specific, standards-based… goals… Introduction (p.1)2.1.c. activities… that make content accessible… Extension portions of plan procedure (p.6),
differentiation, accommodation, and modification suggestions (p.15)
2.1.d: address… standards… while leaving… flexibility
Extension portions of plan procedure (p.6), Notes & reflections (p.18)
2.1.e. lesson objectives… in appropriate language Daily student objectives described in procedures section (p.6)
Table of ContentsIntroduction…………………………………………………………………. 1Instructional Standards Addressed……………………………… 2Student Objectives………………………………………………………. 4Materials……………………………………………………………………... 5Procedures and Student Work ……………………………………… 6Differentiation, Modification, and Accommodations ….Assessment of Learning Objectives……………………………..
1516
Supporting Document Descriptions …………………………….Notes & Reflections……………………………………………………..
1718
Selected Photographs…………………………………………………… 20
Introduction
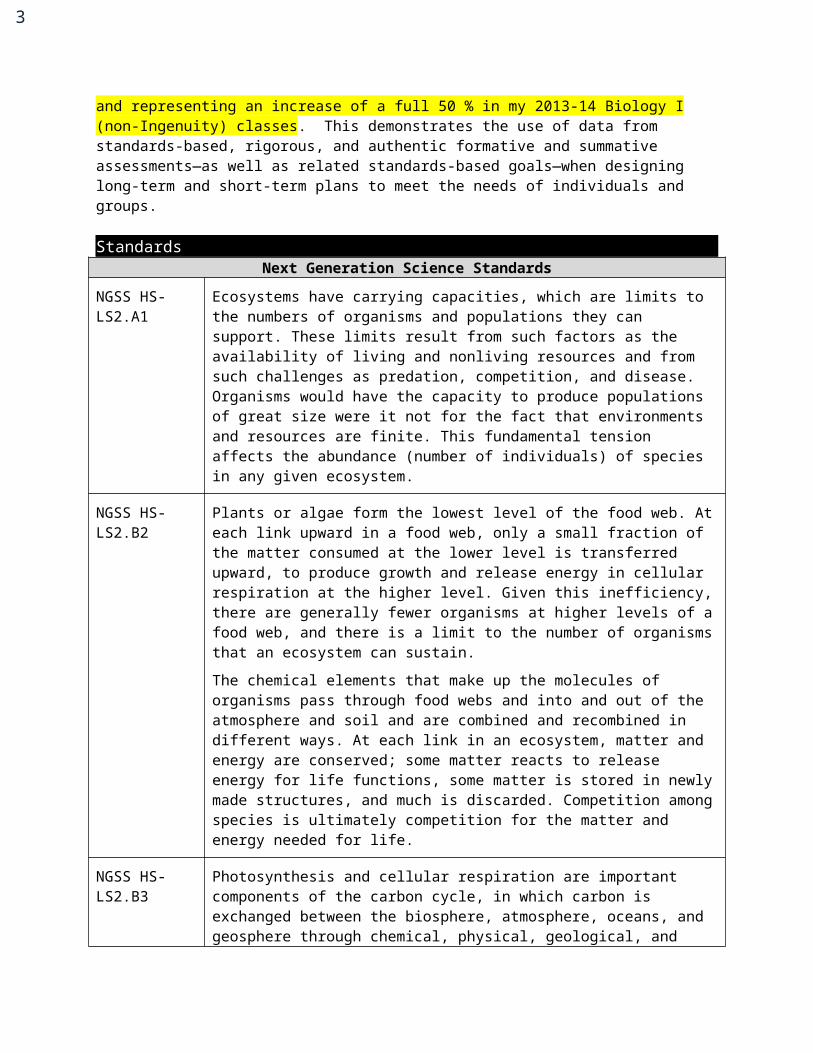
This lesson was synthesized by integrating the NGSS Science and Engineering Practices 2,3,4,6, and 7 with Disciplinary Core Idea HS-LS2: Ecosystems: Interactions, Energy and Dynamics in the context of an engineering design challenge. In this activity, student teams apply their knowledge (both prior and novel) to the task of designing a 1 L closed ecosystem. The ecosystem design is constrained by a cost structure whereby construction materials used, including organisms, must satisfy a budget. The criteria by which designed ecosystems are evaluated after two weeks of isolation are measurements of ecosystem health: stability, diversity, and productivity. The most successful designs are those that construct a biological community where the energy needs of consumer populations are properly balanced with the productivity of producers. Thus, the design challenge is very much aligned with the
2
core principles of DCI LS2, as it demonstrates the functionality of a biomass/energy pyramid and the cycling of matter and energy between the interdependent populations of a food/resource web. At the close of the activity, students propose design refinements based on the quantitative data collected by many independent teams. The features of this activity therefore make it both an authentic scientific inquiry into matter and energy flow in ecosystems and a bona fide experiential engineering challenge.
This is the primary learning experience responsible for increasing student achievement on CLG 3.5 indicators of learning in my unit plan, particularly CLG 3.5.1. CLG 3.5.1 student achievement as measured by a baseline assessment (artifact 4-2B) was the lowest of all expectation 3.5 indicators at just 32.6 %, identifying it as a worthy target for extended, project-based learning experiences1. After instruction, mean student achievement on CLG 3.5.1 items of the Ecology Unit Test was 82.6%2, exceeding an expectation of 80% success, and representing an increase of a full 50 % in my 2013-14 Biology I (non-Ingenuity) classes. This demonstrates the use of data from standards-based, rigorous, and authentic formative and summative assessments—as well as related standards-based goals—when designing long-term and short-term plans to meet the needs of individuals and groups.
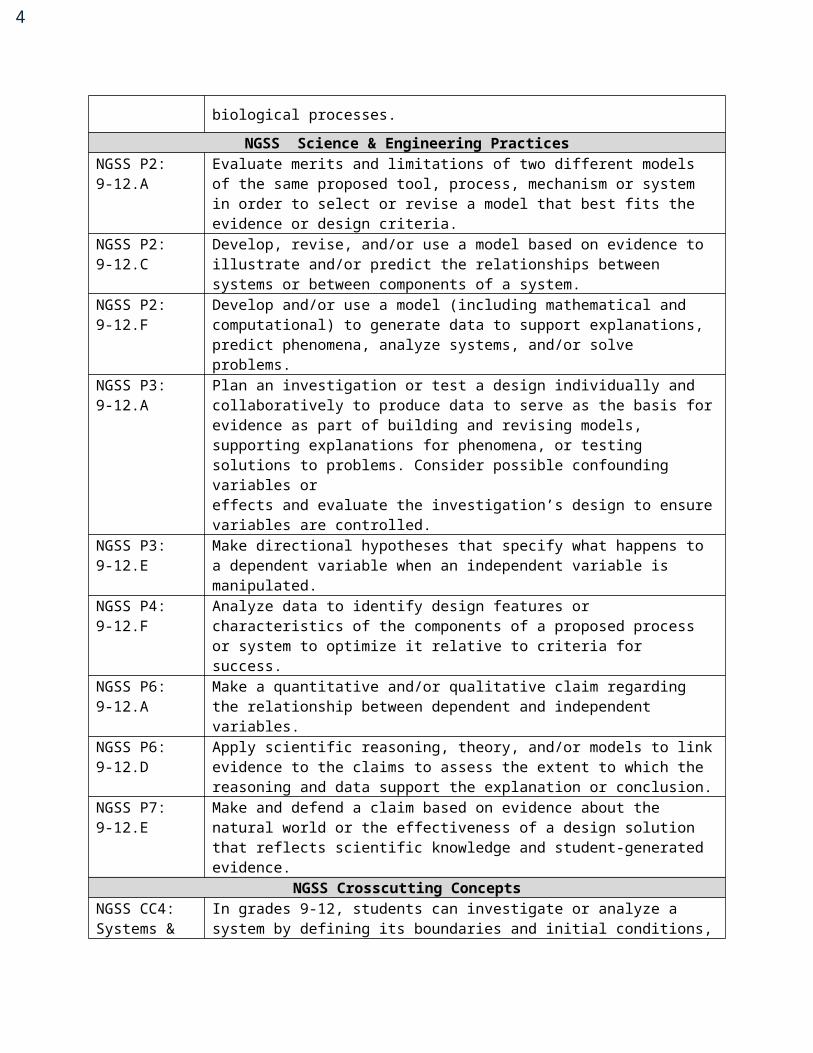
StandardsNext Generation Science Standards
NGSS HS-LS2.A1 Ecosystems have carrying capacities, which are limits to the numbers of organisms and populations they can support. These limits result from such factors as the availability of living and nonliving resources and from such challenges as predation, competition, and disease. Organisms would have the capacity to produce populations of great size were it not for the fact that environments and resources are finite. This fundamental tension affects the abundance (number of individuals) of species in any given ecosystem.
NGSS HS-LS2.B2 Plants or algae form the lowest level of the food web. At each link upward in a food web, only a small fraction of the matter consumed at the lower level is transferred upward, to produce growth and release energy in cellular respiration at the higher level. Given this inefficiency, there are generally fewer organisms at higher levels of a food web, and there is a limit to the number of organisms that an ecosystem can sustain.
The chemical elements that make up the molecules of organisms pass through food webs and into and out of the atmosphere and soil and are combined and recombined in different ways. At each link in an ecosystem, matter and energy are conserved; some matter reacts to release energy for life functions, some matter is stored in newly made structures, and much is discarded. Competition among species is ultimately competition for the matter and energy needed for life.
NGSS HS-LS2.B3 Photosynthesis and cellular respiration are important components of the carbon cycle, in which carbon is exchanged between the biosphere, atmosphere, oceans, and geosphere through chemical, physical, geological, and biological processes.
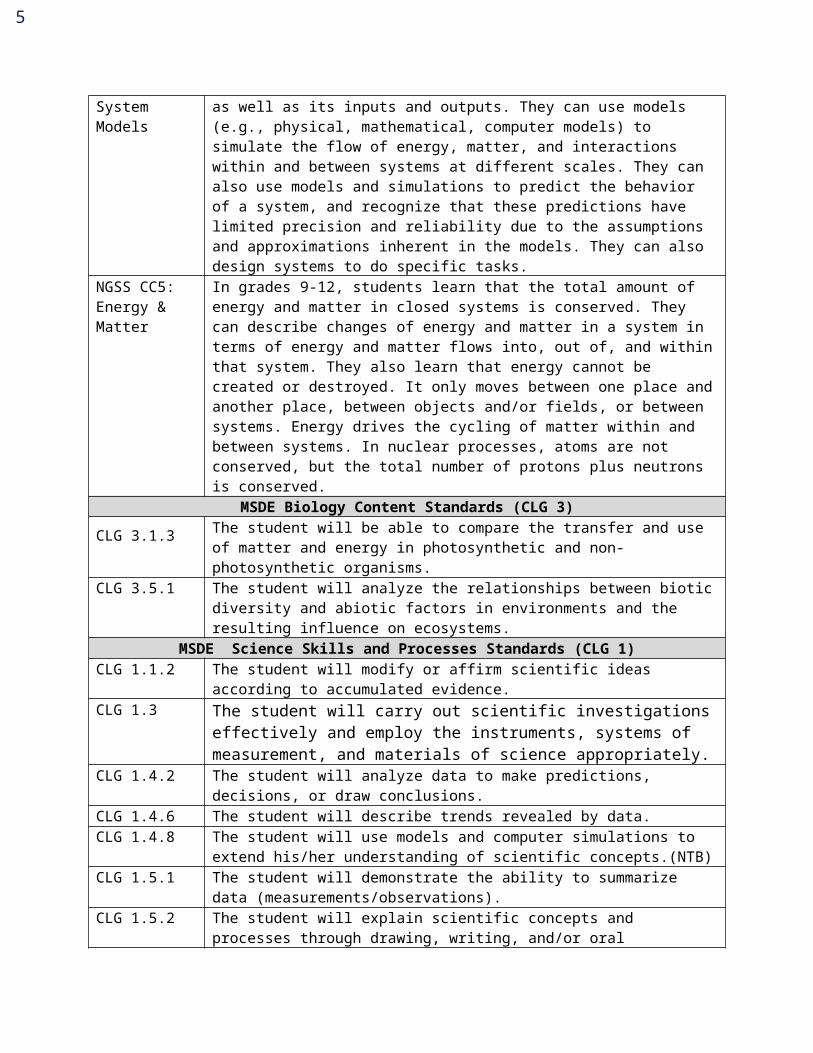
NGSS Science & Engineering PracticesNGSS P2: 9-12.A Evaluate merits and limitations of two different models of the same proposed tool,
process, mechanism or system in order to select or revise a model that best fits the
1 This indicates the use of data to determine student needs.2 Average achievement > 80% on relevant formal assessments of learning indicators indicates mastery.
3
evidence or design criteria.NGSS P2: 9-12.C Develop, revise, and/or use a model based on evidence to illustrate and/or predict
the relationships between systems or between components of a system.NGSS P2: 9-12.F Develop and/or use a model (including mathematical and computational) to
generate data to support explanations, predict phenomena, analyze systems, and/or solve problems.
NGSS P3: 9-12.A Plan an investigation or test a design individually and collaboratively to produce data to serve as the basis for evidence as part of building and revising models, supporting explanations for phenomena, or testing solutions to problems. Consider possible confounding variables oreffects and evaluate the investigation’s design to ensure variables are controlled.
NGSS P3: 9-12.E Make directional hypotheses that specify what happens to a dependent variable when an independent variable is manipulated.
NGSS P4: 9-12.F Analyze data to identify design features or characteristics of the components of a proposed process or system to optimize it relative to criteria for success.
NGSS P6: 9-12.A Make a quantitative and/or qualitative claim regarding the relationship between dependent and independent variables.
NGSS P6: 9-12.D Apply scientific reasoning, theory, and/or models to link evidence to the claims to assess the extent to which the reasoning and data support the explanation or conclusion.
NGSS P7: 9-12.E Make and defend a claim based on evidence about the natural world or the effectiveness of a design solution that reflects scientific knowledge and student-generated evidence.
NGSS Crosscutting ConceptsNGSS CC4: Systems & System Models
In grades 9-12, students can investigate or analyze a system by defining its boundaries and initial conditions, as well as its inputs and outputs. They can use models (e.g., physical, mathematical, computer models) to simulate the flow of energy, matter, and interactions within and between systems at different scales. They can also use models and simulations to predict the behavior of a system, and recognize that these predictions have limited precision and reliability due to the assumptions and approximations inherent in the models. They can also design systems to do specific tasks.
NGSS CC5: Energy & Matter
In grades 9-12, students learn that the total amount of energy and matter in closed systems is conserved. They can describe changes of energy and matter in a system in terms of energy and matter flows into, out of, and within that system. They also learn that energy cannot be created or destroyed. It only moves between one place and another place, between objects and/or fields, or between systems. Energy drives the cycling of matter within and between systems. In nuclear processes, atoms are not conserved, but the total number of protons plus neutrons is conserved.
MSDE Biology Content Standards (CLG 3)
CLG 3.1.3 The student will be able to compare the transfer and use of matter and energy in photosynthetic and non-photosynthetic organisms.
CLG 3.5.1 The student will analyze the relationships between biotic diversity and abiotic factors in environments and the resulting influence on ecosystems.
MSDE Science Skills and Processes Standards (CLG 1)CLG 1.1.2 The student will modify or affirm scientific ideas according to accumulated evidence.
4
CLG 1.3 The student will carry out scientific investigations effectively and employ the instruments, systems of measurement, and materials of science appropriately.
CLG 1.4.2 The student will analyze data to make predictions, decisions, or draw conclusions.CLG 1.4.6 The student will describe trends revealed by data.CLG 1.4.8 The student will use models and computer simulations to extend his/her
understanding of scientific concepts.(NTB)CLG 1.5.1 The student will demonstrate the ability to summarize data
(measurements/observations).CLG 1.5.2 The student will explain scientific concepts and processes through drawing, writing,
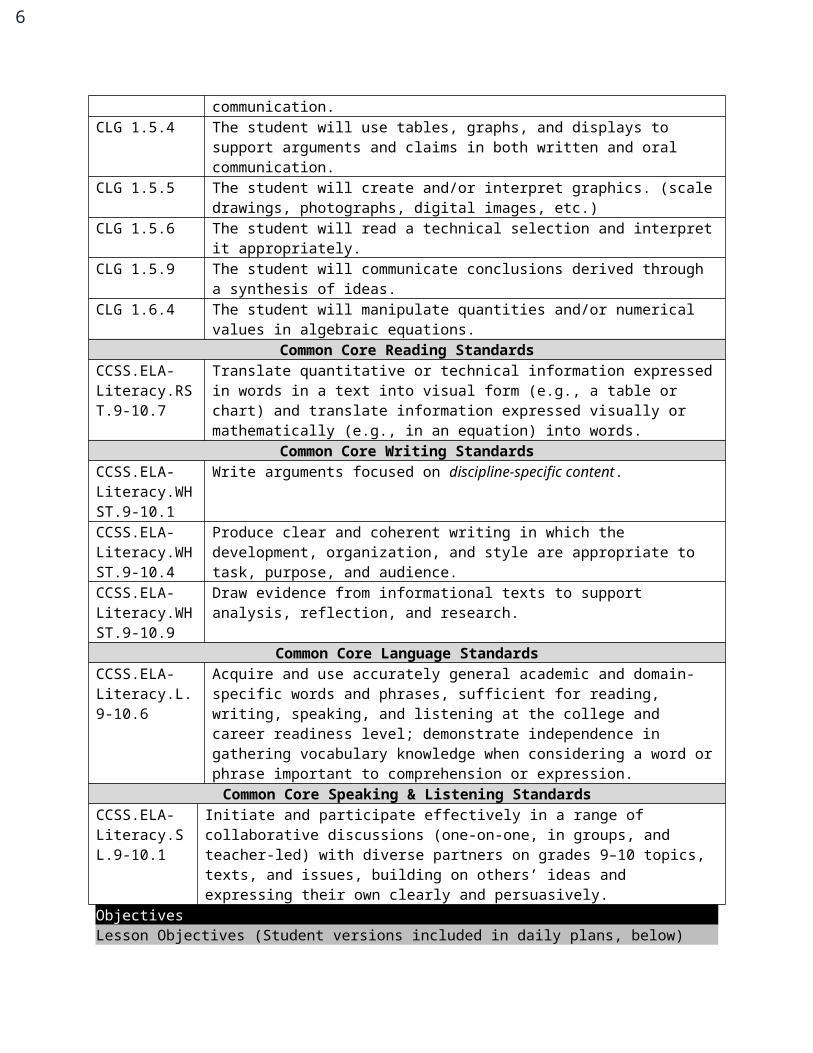
and/or oral communication.CLG 1.5.4 The student will use tables, graphs, and displays to support arguments and claims in
both written and oral communication.CLG 1.5.5 The student will create and/or interpret graphics. (scale drawings, photographs,
digital images, etc.)CLG 1.5.6 The student will read a technical selection and interpret it appropriately.CLG 1.5.9 The student will communicate conclusions derived through a synthesis of ideas.CLG 1.6.4 The student will manipulate quantities and/or numerical values in algebraic
equations.Common Core Reading Standards
CCSS.ELA-Literacy.RST.9-10.7
Translate quantitative or technical information expressed in words in a text into visual form (e.g., a table or chart) and translate information expressed visually or mathematically (e.g., in an equation) into words.
Common Core Writing StandardsCCSS.ELA-Literacy.WHST.9-10.1
Write arguments focused on discipline-specific content.
CCSS.ELA-Literacy.WHST.9-10.4
Produce clear and coherent writing in which the development, organization, and style are appropriate to task, purpose, and audience.
CCSS.ELA-Literacy.WHST.9-10.9
Draw evidence from informational texts to support analysis, reflection, and research.
Common Core Language StandardsCCSS.ELA-Literacy.L.9-10.6
Acquire and use accurately general academic and domain-specific words and phrases, sufficient for reading, writing, speaking, and listening at the college and career readiness level; demonstrate independence in gathering vocabulary knowledge when considering a word or phrase important to comprehension or expression.
Common Core Speaking & Listening StandardsCCSS.ELA-Literacy.SL.9-10.1
Initiate and participate effectively in a range of collaborative discussions (one-on-one, in groups, and teacher-led) with diverse partners on grades 9–10 topics, texts, and issues, building on others’ ideas and expressing their own clearly and persuasively.
ObjectivesLesson Objectives (Student versions included in daily plans, below)
5
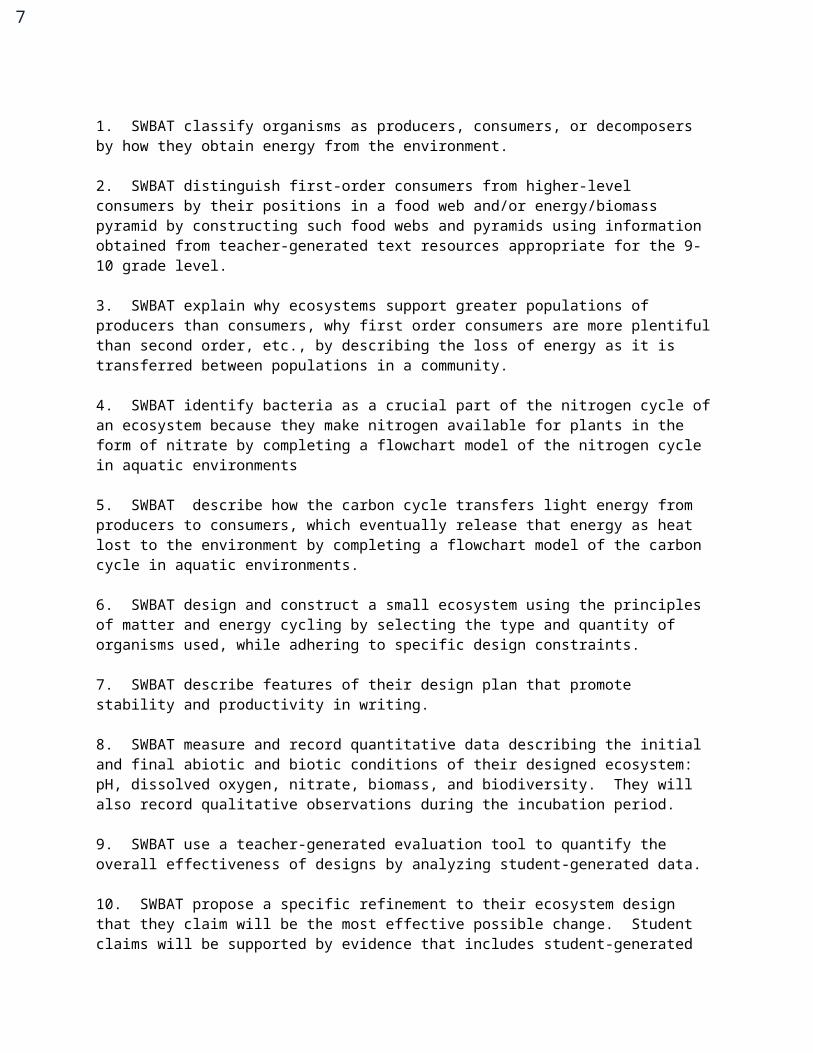
1. SWBAT classify organisms as producers, consumers, or decomposers by how they obtain energy from the environment.
2. SWBAT distinguish first-order consumers from higher-level consumers by their positions in a food web and/or energy/biomass pyramid by constructing such food webs and pyramids using information obtained from teacher-generated text resources appropriate for the 9-10 grade level.
3. SWBAT explain why ecosystems support greater populations of producers than consumers, why first order consumers are more plentiful than second order, etc., by describing the loss of energy as it is transferred between populations in a community.
4. SWBAT identify bacteria as a crucial part of the nitrogen cycle of an ecosystem because they make nitrogen available for plants in the form of nitrate by completing a flowchart model of the nitrogen cycle in aquatic environments
5. SWBAT describe how the carbon cycle transfers light energy from producers to consumers, which eventually release that energy as heat lost to the environment by completing a flowchart model of the carbon cycle in aquatic environments.
6. SWBAT design and construct a small ecosystem using the principles of matter and energy cycling by selecting the type and quantity of organisms used, while adhering to specific design constraints.
7. SWBAT describe features of their design plan that promote stability and productivity in writing.
8. SWBAT measure and record quantitative data describing the initial and final abiotic and biotic conditions of their designed ecosystem: pH, dissolved oxygen, nitrate, biomass, and biodiversity. They will also record qualitative observations during the incubation period.
9. SWBAT use a teacher-generated evaluation tool to quantify the overall effectiveness of designs by analyzing student-generated data.
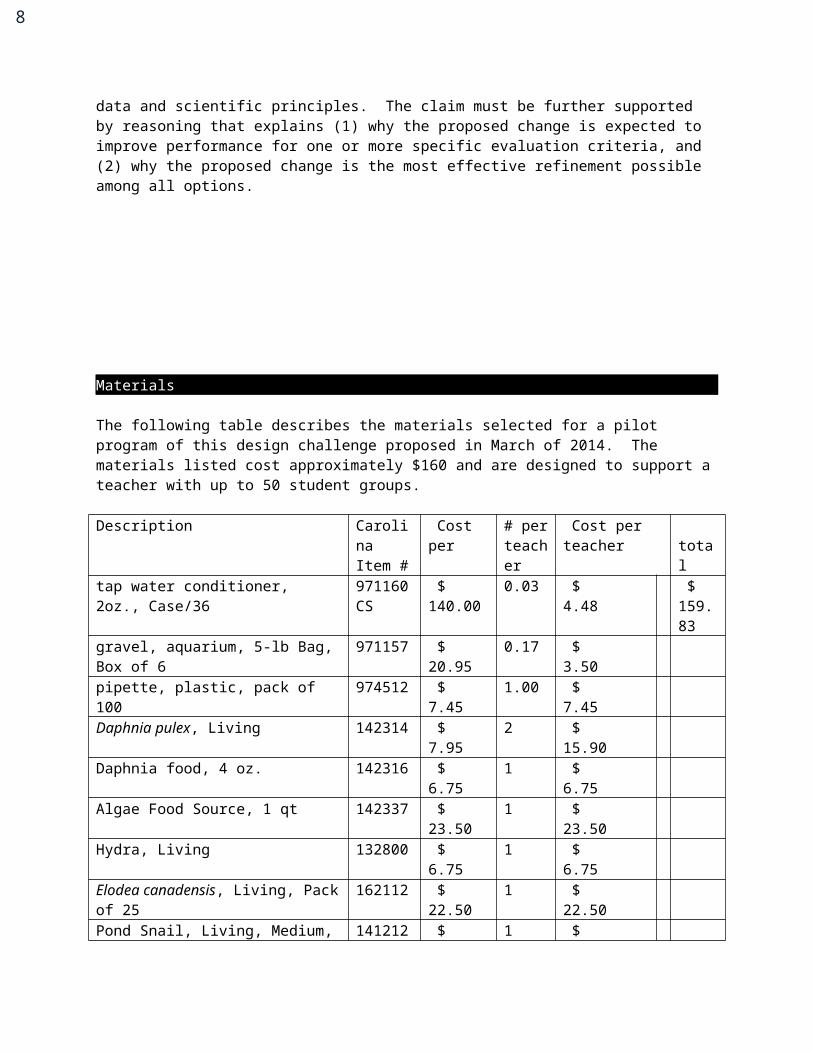
10. SWBAT propose a specific refinement to their ecosystem design that they claim will be the most effective possible change. Student claims will be supported by evidence that includes student-generated data and scientific principles. The claim must be further supported by reasoning that explains (1) why the proposed change is expected to improve performance for one or more specific evaluation criteria, and (2) why the proposed change is the most effective refinement possible among all options.
Materials
6
The following table describes the materials selected for a pilot program of this design challenge proposed in March of 2014. The materials listed cost approximately $160 and are designed to support a teacher with up to 50 student groups.
Description Carolina Item #
Cost per # per teacher
Cost per teacher
total
tap water conditioner, 2oz., Case/36 971160CS
$ 140.00 0.03 $ 4.48 $ 159.83
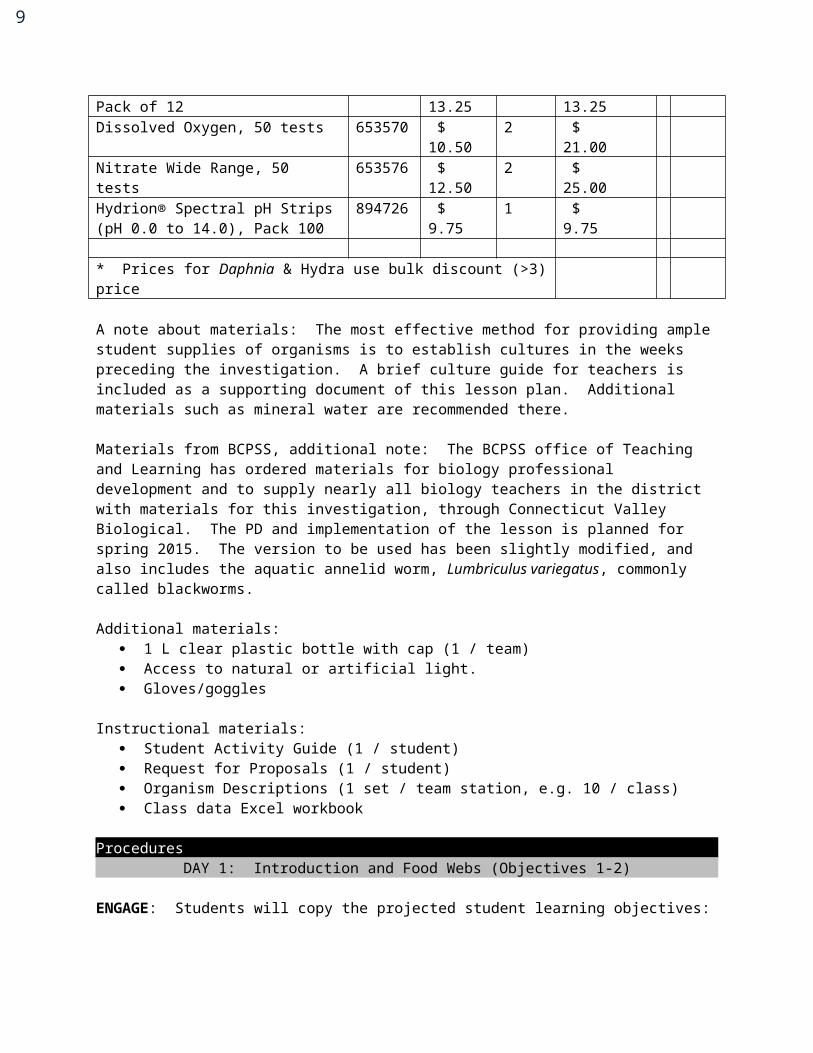
gravel, aquarium, 5-lb Bag, Box of 6 971157 $ 20.95 0.17 $ 3.50 pipette, plastic, pack of 100 974512 $ 7.45 1.00 $ 7.45 Daphnia pulex, Living 142314 $ 7.95 2 $ 15.90 Daphnia food, 4 oz. 142316 $ 6.75 1 $ 6.75 Algae Food Source, 1 qt 142337 $ 23.50 1 $ 23.50 Hydra, Living 132800 $ 6.75 1 $ 6.75 Elodea canadensis, Living, Pack of 25 162112 $ 22.50 1 $ 22.50 Pond Snail, Living, Medium, Pack of 12 141212 $ 13.25 1 $ 13.25 Dissolved Oxygen, 50 tests 653570 $ 10.50 2 $ 21.00 Nitrate Wide Range, 50 tests 653576 $ 12.50 2 $ 25.00 Hydrion® Spectral pH Strips (pH 0.0 to 14.0), Pack 100
894726 $ 9.75 1 $ 9.75
* Prices for Daphnia & Hydra use bulk discount (>3) price
A note about materials: The most effective method for providing ample student supplies of organisms is to establish cultures in the weeks preceding the investigation. A brief culture guide for teachers is included as a supporting document of this lesson plan. Additional materials such as mineral water are recommended there.
Materials from BCPSS, additional note: The BCPSS office of Teaching and Learning has ordered materials for biology professional development and to supply nearly all biology teachers in the district with materials for this investigation, through Connecticut Valley Biological. The PD and implementation of the lesson is planned for spring 2015. The version to be used has been slightly modified, and also includes the aquatic annelid worm, Lumbriculus variegatus, commonly called blackworms.
Additional materials: 1 L clear plastic bottle with cap (1 / team) Access to natural or artificial light. Gloves/goggles
Instructional materials: Student Activity Guide (1 / student) Request for Proposals (1 / student) Organism Descriptions (1 set / team station, e.g. 10 / class) Class data Excel workbook
7
ProceduresDAY 1: Introduction and Food Webs (Objectives 1-2)
ENGAGE: Students will copy the projected student learning objectives:
1. Classify organisms as producers, consumers, or decomposers by how they obtain energy from the environment.2. Distinguish first-order consumers from higher-level consumers by drawing a food web.
ENGAGE: Students will read the request for proposals, and discuss the broad contours of the project. (CCSS.ELA-Literacy.SL.9-10.1) If the student group has little or no familiarity with ecology, the discussion should be extended to include the definitions of ecology, ecosystem, population, etc. If there are significant gaps of knowledge or misconceptions, a stand-alone lesson about food webs is in order.
EXPLAIN: A brief PowerPoint presentation will define the terms producer, consumer, and decomposer, as well as describe the principles of food web diagrams. (CLG 3.1.3; CCSS.ELA-Literacy.L.9-10.6)
EXPLORE: In teams, students will read the set of organism descriptions (see “Life Pod Organism Descriptions” below) and use information provided to classify the organisms and draw a food web. (NGSS HS-LS2.B2; NGSS P2: 9-12.C; NGSS CC4; NGSS CC5; CLG 3.1.3; CLG 1.5.2; CLG 1.5.5; CLG 1.5.6; CCSS.ELA-Literacy.RST.9-10.7)
EVALUATE: The teacher will circulate among teams to assist and informally assess student achievement of learning objectives based on responses to Student Activity Guide part I, #1-2.
DAY 2: Flows of Matter and Energy (Objectives 3-5)
ENGAGE: Students will copy the projected student learning objectives:
1. Explain why there is more energy and biomass available at the bottom of a biomass/energy pyramid than the top.2. Describe how nitrogen is cycled through ecosystems, particularly the role played by bacteria.3. Describe how carbon and energy are cycled through ecosystems by photosynthesis and respiration.
ENGAGE: A warm up drill will activate student prior knowledge about biomass: “Imagine a forest ecosystem, with trees, mammals, birds, predators, and a great diversity of other organisms. If you were to somehow weigh all of the plants in the ecosystem, do you think it would weigh more or less than the weight of all of the animals? Why?” (NGSS HS-LS2.B2; CLG 3.1.3)
EXPLAIN: After discussing student responses to the warm-up task, a brief PowerPoint presentation will introduce the concept of the energy/biomass pyramid and explain the nitrogen and carbon/energy cycle flowchart activity.
EXPLORE: In teams, students will complete the energy pyramid and biogeochemical cycle activities in the Student Activity Guide (Part I, pp. 2-4). (NGSS HS-LS2.A1; NGSS HS-LS2.B2; NGSS HS-LS2.B3; NGSS
8
P2: 9-12.C; NGSS CC4: NGSS CC5; CLG 3.1.3; CLG 3.5.1; CLG 1.4.8; CLG 1.5.2; CLG 1.5.5; CCSS.ELA-Literacy.L.9-10.6)
EVALUATE: The teacher will circulate among teams to assist and informally assess student achievement of learning objectives based on responses to Student Activity Guide part I, pp. 2-4.
DAY 3: Designing the Ecosystem (Objectives 6-7)
ENGAGE: Students will copy the projected student learning objectives:
1. Use your knowledge of matter and energy flows in ecosystems to design a stable, productive Life Pod.2. Explain why specific aspects of your design will make a stable, productive ecosystem.
ENGAGE: A warm up drill will activate student learning about energy flow: “We saw yesterday that there is much more energy available to the producers in an ecosystem than to the high-level consumers. The blue whale is the largest animal known that’s ever lived on Earth, and it eats nothing but tiny krill near the bottom of the food chain. Does that make sense according to what you know about energy flow in an ecosystem? Why? ” (NGSS HS-LS2.B2; NGSS CC5; CLG 3.1.3; CLG 1.1.2)
EXPLAIN: A brief PowerPoint presentation will discuss the constraints and goals of the design challenge. The rubric that will be used to assess the performance of designs will be highlighted, so that students can construct their ecosystems knowing the value of the decisions they make, particularly with regard to the initial species diversity parameter.
EXPLORE: Student teams will discuss design proposals, and construct a consensus design plan that adheres to budget constraints. Note that the relative costs of materials can be varied by the teacher depending on availability. For example, if there are less than 10 or 20 Daphnia available per student group, the cost should be increased. Furthermore, it should go without saying that it is difficult, if not impossible, to maintain more than one hydra sustainably in a 1L ecosystem, hence the prohibitively high cost. (NGSS HS-LS2.A1; NGSS HS-LS2.B2; NGSS P2: 9-12.A; NGSS P2: 9-12.C; NGSS P2: 9-12.F; NGSS P3: 9-12.A; NGSS P3: 9-12.E; NGSS CC4: NGSS CC5; CLG 3.1.3; CLG 1.5.2; CCSS.ELA-Literacy.SL.9-10.1)
EXTEND: Working individually, students will construct a written rationale that explains why the design they have helped develop will be the most productive, stable ecosystem possible. In other words, students are expected to describe the positive effects of specific purposeful design features that their ecosystem will exhibit. N.b., student “Initial Plan” responses should match their teammates, but “Rationale for Plan” responses should be unique although produced collaboratively. (NGSS HS-LS2.A1; NGSS HS-LS2.B2; NGSS P2: 9-12.A; NGSS P3: 9-12.E; NGSS P6: 9-12.A; CCSS.ELA-Literacy.WHST.9-10.1; CCSS.ELA-Literacy.WHST.9-10.4; CCSS.ELA-Literacy.WHST.9-10.9)
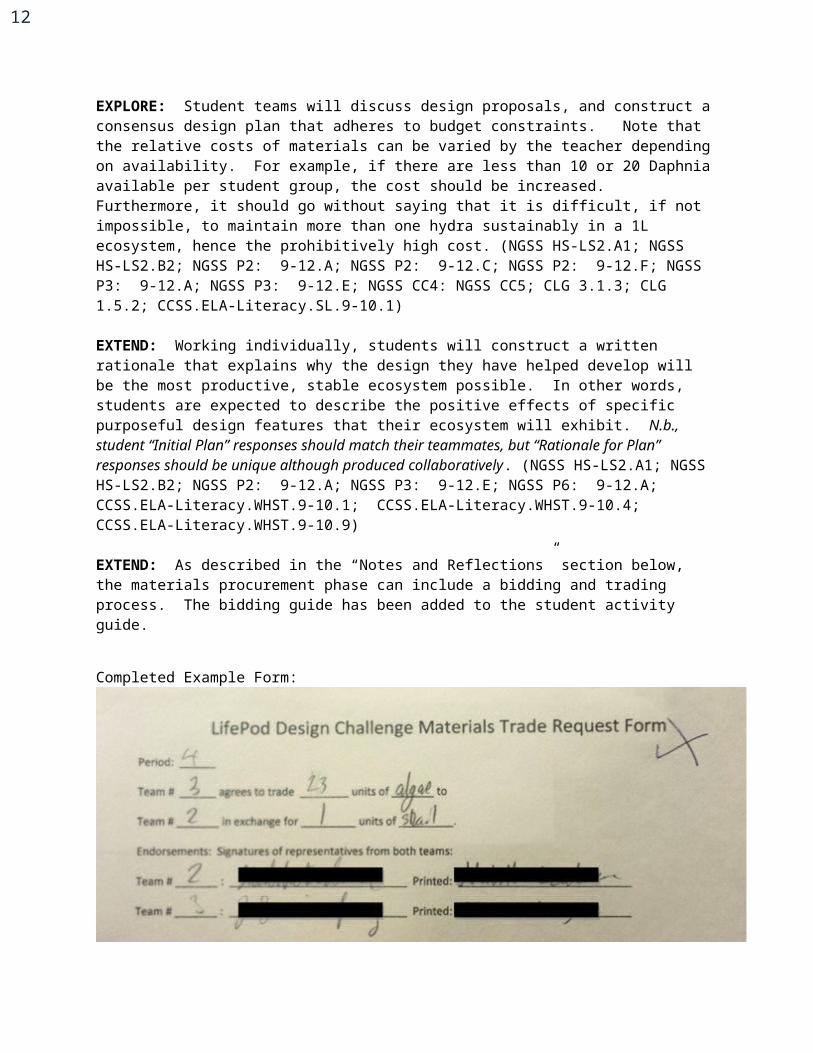
EXTEND: As described in the “Notes and Reflections” section below, the materials procurement phase can include a bidding and trading process. The bidding guide has been added to the student activity guide.
Completed Example Form:
9
EVALUATE: The teacher will circulate among teams to assist and informally assess student achievement of learning objectives based on responses to Student Activity Guide part II, p. 5. This is an important session, and the teacher is encouraged to shape student design plans toward models that are potentially successful through the use of questioning techniques tailored to the individual circumstance. E.g. if a student group is attempting to sustain a hydra with a population of one or two daphnia, they are begging a question about the relationship between first and second order consumers in a biomass/energy pyramid.
DAY 4: Building the Ecosystem (Objective 6)
ENGAGE: Students will copy the projected student learning objective:
1. Construct the ecosystem your team designed.
ENGAGE: Students will respond to the warm-up prompt: “What is your biggest concern about constructing your ecosystem?”
EXPLAIN: The teacher will provide specific, detailed instructions regarding expectations for the procurement, use, and handling of the various materials provided for ecosystem construction. The teacher will also appropriately allay concerns regarding ecosystem construction elicited during the warm-up by confidently explaining classroom procedures. Students will be reminded to count or measure the quantity of every design feature precisely, and record it in the Student Activity Guide. Furthermore, students will be given direction as to the procedure for determining the masses of elodea and snails utilized. The teacher will remind students that this procedure requires gloves and goggles to be worn, and hands to be washed afterwards, as it involves the handling of organisms.
EXPLORE: Student teams will construct ecosystems according to the designs they produced previously. Student teams will also measure or count the amount of every abiotic and biotic factor added to their Life Pod ecosystem, and record it dutifully in the Student Activity Guide (p. 6). The teacher will circulate to assist in ecosystem construction and data collection. (NGSS P2: 9-12.C; NGSS P2: 9-12.F; NGSS P3: 9-12.A; CLG 1.3; CLG 1.5.1)
10
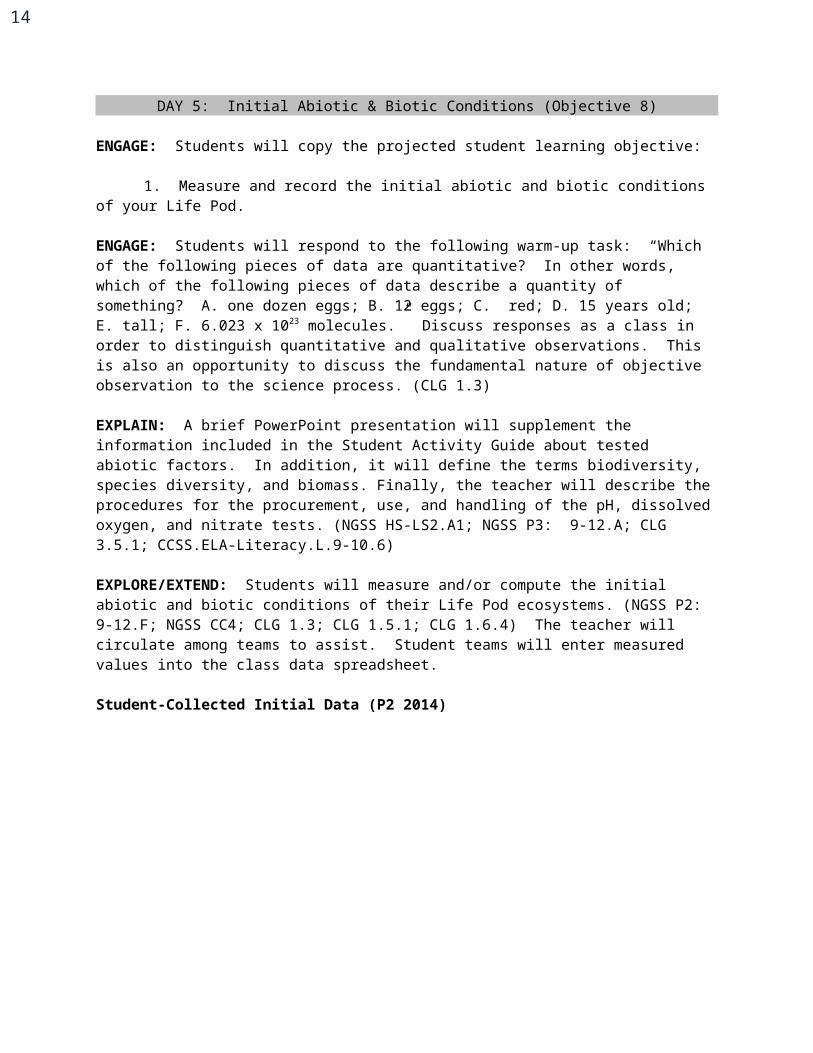
DAY 5: Initial Abiotic & Biotic Conditions (Objective 8)
ENGAGE: Students will copy the projected student learning objective:
1. Measure and record the initial abiotic and biotic conditions of your Life Pod.
ENGAGE: Students will respond to the following warm-up task: “Which of the following pieces of data are quantitative? In other words, which of the following pieces of data describe a quantity of something? A. one dozen eggs; B. 12 eggs; C. red; D. 15 years old; E. tall; F. 6.023 x 10²³ molecules.” Discuss responses as a class in order to distinguish quantitative and qualitative observations. This is also an opportunity to discuss the fundamental nature of objective observation to the science process. (CLG 1.3)
EXPLAIN: A brief PowerPoint presentation will supplement the information included in the Student Activity Guide about tested abiotic factors. In addition, it will define the terms biodiversity, species diversity, and biomass. Finally, the teacher will describe the procedures for the procurement, use, and handling of the pH, dissolved oxygen, and nitrate tests. (NGSS HS-LS2.A1; NGSS P3: 9-12.A; CLG 3.5.1; CCSS.ELA-Literacy.L.9-10.6)
EXPLORE/EXTEND: Students will measure and/or compute the initial abiotic and biotic conditions of their Life Pod ecosystems. (NGSS P2: 9-12.F; NGSS CC4; CLG 1.3; CLG 1.5.1; CLG 1.6.4) The teacher will circulate among teams to assist. Student teams will enter measured values into the class data spreadsheet.
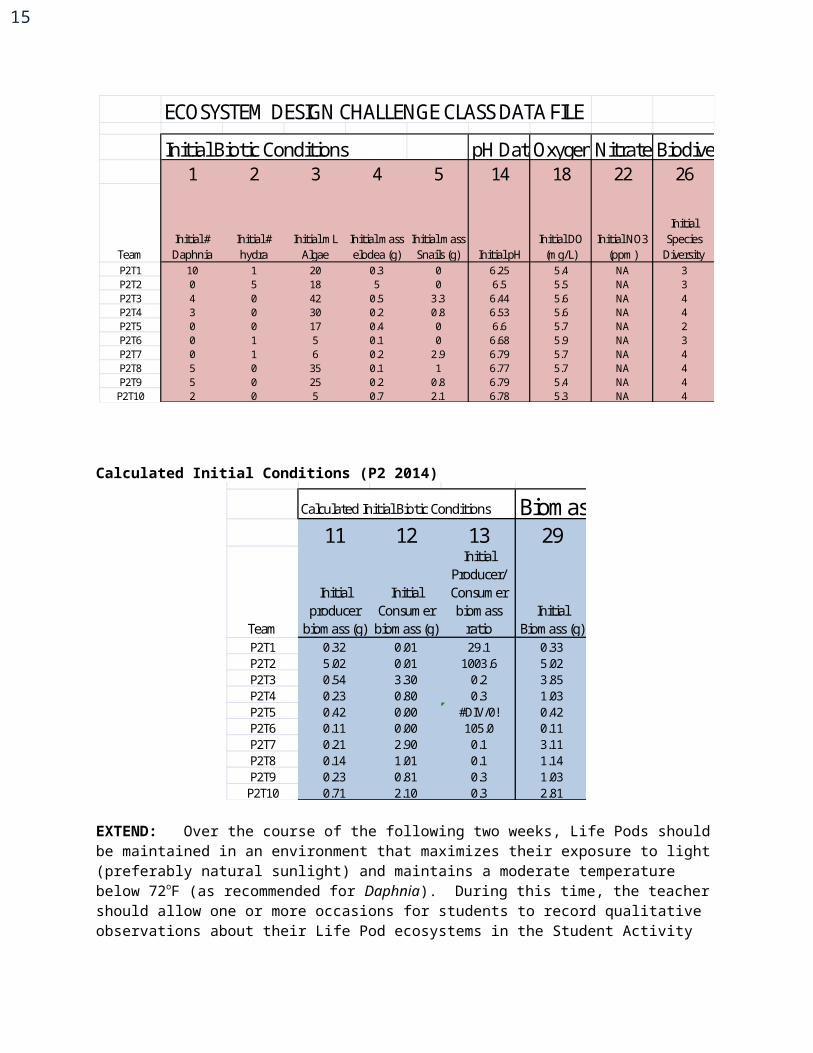
Student-Collected Initial Data (P2 2014)ECOSYSTEM DESIGN CHALLENGE CLASS DATA FILE
Initial Biotic Conditions pH DataOxygen DataNitrate DataBiodiversity Data1 2 3 4 5 14 18 22 26
TeamInitial # Daphnia
Initial # hydra
Initial mL Algae
Initial mass elodea (g)
Initial mass Snails (g) Initial pH
Initial DO (mg/L)
Initial NO3 (ppm)
Initial Species
DiversityP2T1 10 1 20 0.3 0 6.25 5.4 NA 3P2T2 0 5 18 5 0 6.5 5.5 NA 3P2T3 4 0 42 0.5 3.3 6.44 5.6 NA 4P2T4 3 0 30 0.2 0.8 6.53 5.6 NA 4P2T5 0 0 17 0.4 0 6.6 5.7 NA 2P2T6 0 1 5 0.1 0 6.68 5.9 NA 3P2T7 0 1 6 0.2 2.9 6.79 5.7 NA 4P2T8 5 0 35 0.1 1 6.77 5.7 NA 4P2T9 5 0 25 0.2 0.8 6.79 5.4 NA 4
P2T10 2 0 5 0.7 2.1 6.78 5.3 NA 4
Calculated Initial Conditions (P2 2014)
11
ECOSYSTEM DESIGN CHALLENGE CLASS DATA FILE
Calculated Initial Biotic Conditions Biomass Data11 12 13 29
Team
Initial producer
biomass (g)
Initial Consumer
biomass (g)
Initial Producer/ Consumer biomass
ratioInitial
Biomass (g)P2T1 0.32 0.01 29.1 0.33P2T2 5.02 0.01 1003.6 5.02P2T3 0.54 3.30 0.2 3.85P2T4 0.23 0.80 0.3 1.03P2T5 0.42 0.00 #DIV/0! 0.42P2T6 0.11 0.00 105.0 0.11P2T7 0.21 2.90 0.1 3.11P2T8 0.14 1.01 0.1 1.14P2T9 0.23 0.81 0.3 1.03
P2T10 0.71 2.10 0.3 2.81
EXTEND: Over the course of the following two weeks, Life Pods should be maintained in an environment that maximizes their exposure to light (preferably natural sunlight) and maintains a moderate temperature below 72oF (as recommended for Daphnia). During this time, the teacher should allow one or more occasions for students to record qualitative observations about their Life Pod ecosystems in the Student Activity Guide. This will help to maintain student engagement and investment with the project.
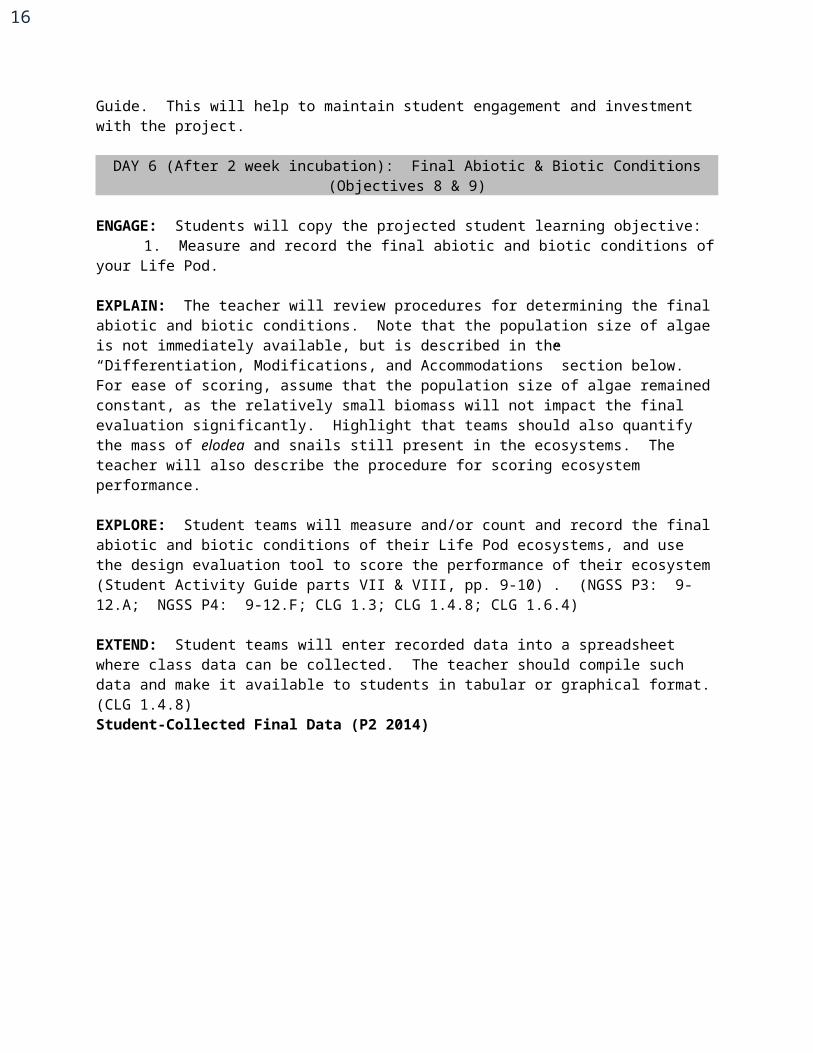
DAY 6 (After 2 week incubation): Final Abiotic & Biotic Conditions (Objectives 8 & 9)
ENGAGE: Students will copy the projected student learning objective: 1. Measure and record the final abiotic and biotic conditions of your Life Pod.
EXPLAIN: The teacher will review procedures for determining the final abiotic and biotic conditions. Note that the population size of algae is not immediately available, but is described in the “Differentiation, Modifications, and Accommodations” section below. For ease of scoring, assume that the population size of algae remained constant, as the relatively small biomass will not impact the final evaluation significantly. Highlight that teams should also quantify the mass of elodea and snails still present in the ecosystems. The teacher will also describe the procedure for scoring ecosystem performance.
EXPLORE: Student teams will measure and/or count and record the final abiotic and biotic conditions of their Life Pod ecosystems, and use the design evaluation tool to score the performance of their ecosystem (Student Activity Guide parts VII & VIII, pp. 9-10) . (NGSS P3: 9-12.A; NGSS P4: 9-12.F; CLG 1.3; CLG 1.4.8; CLG 1.6.4)
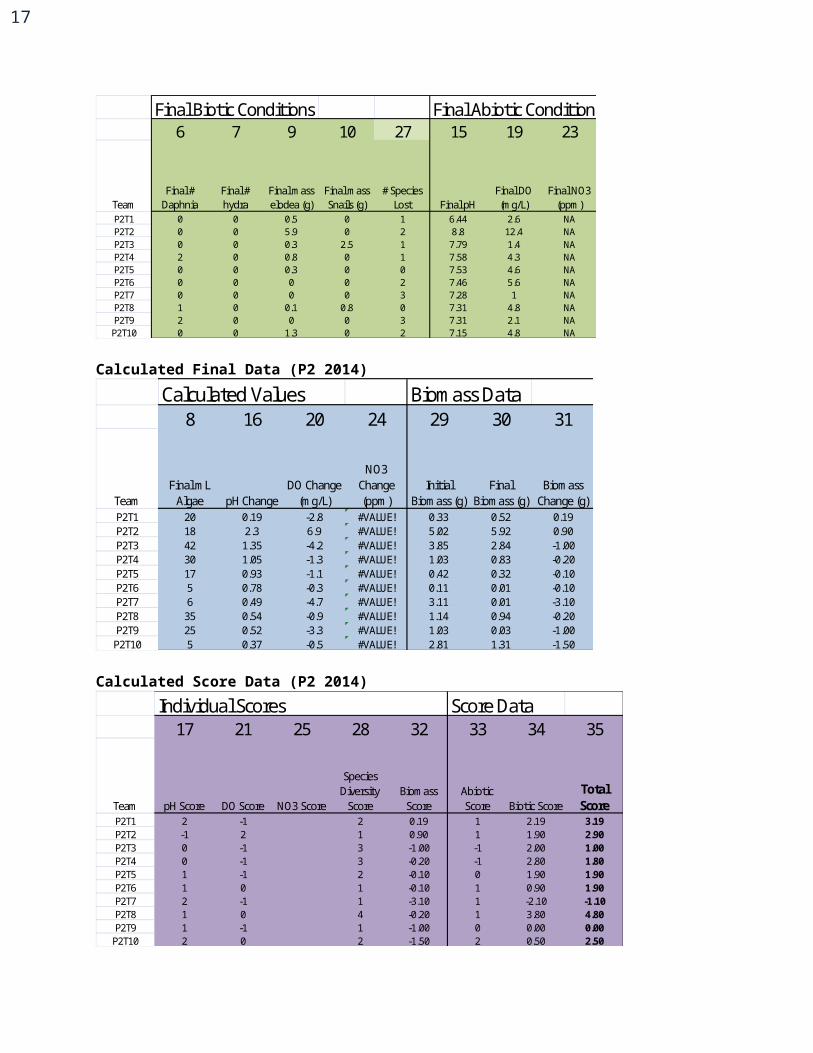
EXTEND: Student teams will enter recorded data into a spreadsheet where class data can be collected. The teacher should compile such data and make it available to students in tabular or graphical format. (CLG 1.4.8)Student-Collected Final Data (P2 2014)
12
Final Biotic Conditions Final Abiotic Conditions6 7 9 10 27 15 19 23
TeamFinal #
DaphniaFinal # hydra
Final mass elodea (g)
Final mass Snails (g)
# Species Lost Final pH
Final DO (mg/L)
Final NO3 (ppm)
P2T1 0 0 0.5 0 1 6.44 2.6 NAP2T2 0 0 5.9 0 2 8.8 12.4 NAP2T3 0 0 0.3 2.5 1 7.79 1.4 NAP2T4 2 0 0.8 0 1 7.58 4.3 NAP2T5 0 0 0.3 0 0 7.53 4.6 NAP2T6 0 0 0 0 2 7.46 5.6 NAP2T7 0 0 0 0 3 7.28 1 NAP2T8 1 0 0.1 0.8 0 7.31 4.8 NAP2T9 2 0 0 0 3 7.31 2.1 NA
P2T10 0 0 1.3 0 2 7.15 4.8 NA
Calculated Final Data (P2 2014)Calculated Values Biomass Data
8 16 20 24 29 30 31
TeamFinal mL
Algae pH ChangeDO Change
(mg/L)
NO3 Change (ppm)
Initial Biomass (g)
Final Biomass (g)
Biomass Change (g)
P2T1 20 0.19 -2.8 #VALUE! 0.33 0.52 0.19P2T2 18 2.3 6.9 #VALUE! 5.02 5.92 0.90P2T3 42 1.35 -4.2 #VALUE! 3.85 2.84 -1.00P2T4 30 1.05 -1.3 #VALUE! 1.03 0.83 -0.20P2T5 17 0.93 -1.1 #VALUE! 0.42 0.32 -0.10P2T6 5 0.78 -0.3 #VALUE! 0.11 0.01 -0.10P2T7 6 0.49 -4.7 #VALUE! 3.11 0.01 -3.10P2T8 35 0.54 -0.9 #VALUE! 1.14 0.94 -0.20P2T9 25 0.52 -3.3 #VALUE! 1.03 0.03 -1.00
P2T10 5 0.37 -0.5 #VALUE! 2.81 1.31 -1.50
Calculated Score Data (P2 2014)Score Data
17 21 25 28 32 33 34 35
Team pH Score DO Score NO3 Score
Species Diversity
ScoreBiomass
ScoreAbiotic Score Biotic Score
Total Score
P2T1 2 -1 2 0.19 1 2.19 3.19P2T2 -1 2 1 0.90 1 1.90 2.90P2T3 0 -1 3 -1.00 -1 2.00 1.00P2T4 0 -1 3 -0.20 -1 2.80 1.80P2T5 1 -1 2 -0.10 0 1.90 1.90P2T6 1 0 1 -0.10 1 0.90 1.90P2T7 2 -1 1 -3.10 1 -2.10 -1.10P2T8 1 0 4 -0.20 1 3.80 4.80P2T9 1 -1 1 -1.00 0 0.00 0.00
P2T10 2 0 2 -1.50 2 0.50 2.50
Individual Scores
DAY 7 (After 2 week incubation): Evaluation of Ecosystems & Refining Designs
13
ENGAGE: Students will copy the projected student learning objective: 1. Evaluate the effect of different starting conditions on the performance of Life Pod ecosystems by analyzing multiple sources of data, and propose a change to the design of your ecosystem that would improve its performance.
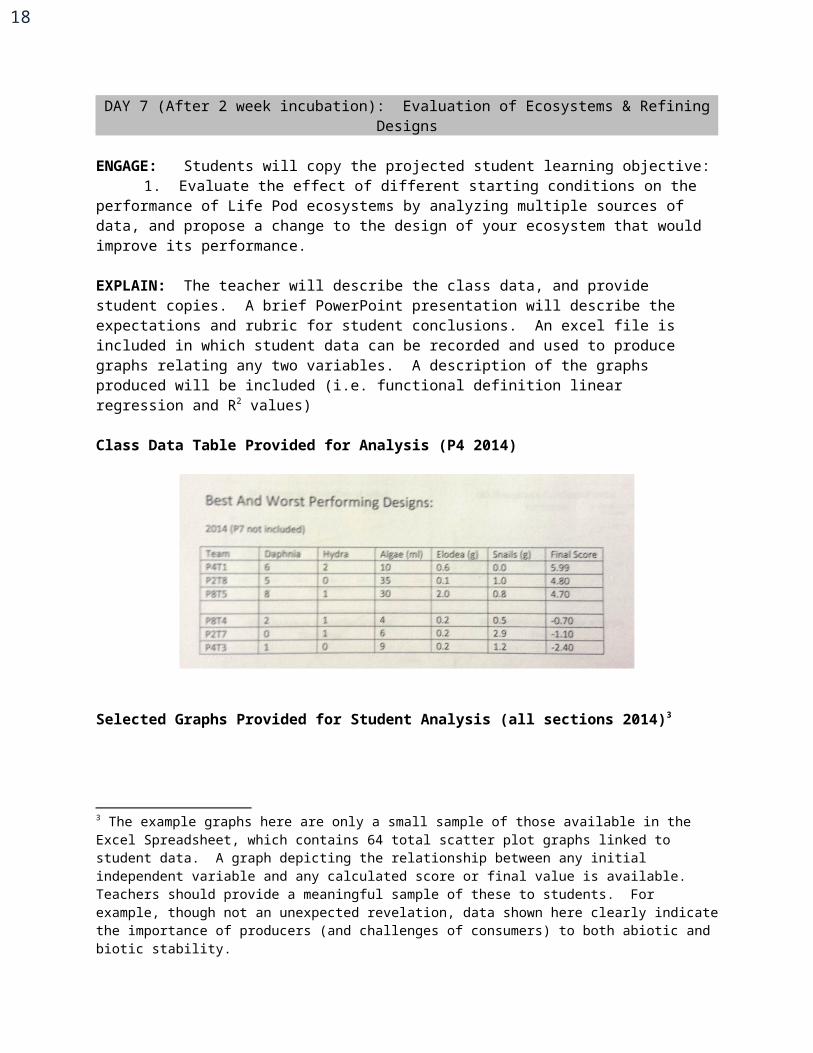
EXPLAIN: The teacher will describe the class data, and provide student copies. A brief PowerPoint presentation will describe the expectations and rubric for student conclusions. An excel file is included in which student data can be recorded and used to produce graphs relating any two variables. A description of the graphs produced will be included (i.e. functional definition linear regression and R2 values)
Class Data Table Provided for Analysis (P4 2014)
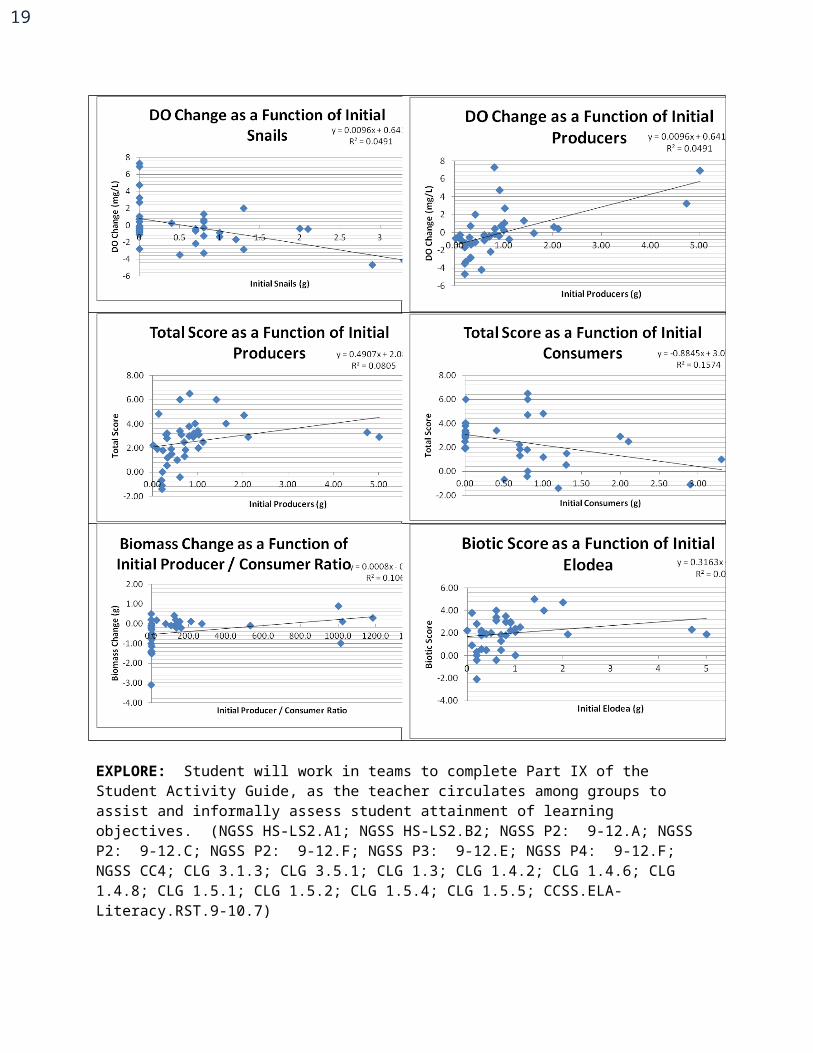
Selected Graphs Provided for Student Analysis (all sections 2014)3
3 The example graphs here are only a small sample of those available in the Excel Spreadsheet, which contains 64 total scatter plot graphs linked to student data. A graph depicting the relationship between any initial independent variable and any calculated score or final value is available. Teachers should provide a meaningful sample of these to students. For example, though not an unexpected revelation, data shown here clearly indicate the importance of producers (and challenges of consumers) to both abiotic and biotic stability.
14
EXPLORE: Student will work in teams to complete Part IX of the Student Activity Guide, as the teacher circulates among groups to assist and informally assess student attainment of learning objectives. (NGSS HS-LS2.A1; NGSS HS-LS2.B2; NGSS P2: 9-12.A; NGSS P2: 9-12.C; NGSS P2: 9-12.F; NGSS P3: 9-12.E; NGSS P4: 9-12.F; NGSS CC4; CLG 3.1.3; CLG 3.5.1; CLG 1.3; CLG 1.4.2; CLG 1.4.6; CLG 1.4.8; CLG 1.5.1; CLG 1.5.2; CLG 1.5.4; CLG 1.5.5; CCSS.ELA-Literacy.RST.9-10.7)
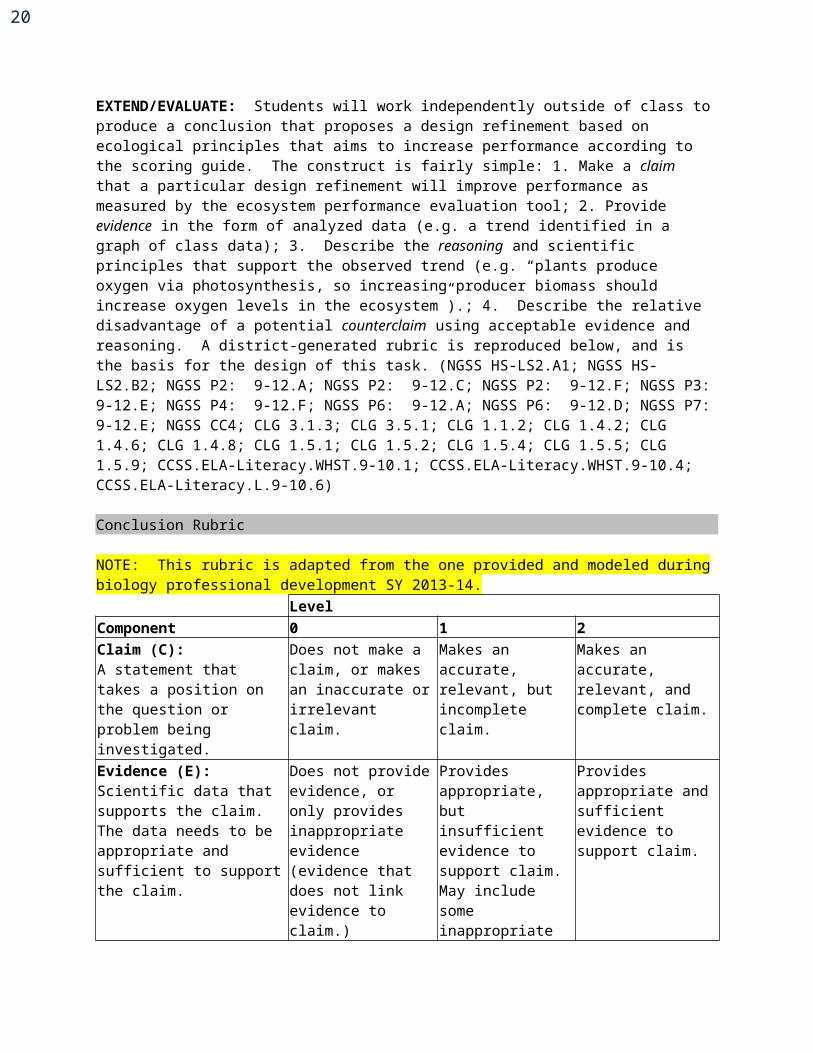
EXTEND/EVALUATE: Students will work independently outside of class to produce a conclusion that proposes a design refinement based on ecological principles that aims to increase performance according to the scoring guide. The construct is fairly simple: 1. Make a claim that a particular design refinement will improve performance as measured by the ecosystem performance evaluation tool; 2. Provide evidence in the form of analyzed data (e.g. a trend identified in a graph of class data); 3. Describe the reasoning and scientific principles that support the observed trend (e.g. “plants produce oxygen via photosynthesis, so increasing producer biomass should increase oxygen levels in the ecosystem”).; 4. Describe the relative disadvantage of a potential counterclaim using acceptable evidence and reasoning. A district-generated rubric is reproduced below, and is the basis for the design of this task. (NGSS HS-LS2.A1; NGSS HS-LS2.B2; NGSS P2: 9-12.A; NGSS P2: 9-12.C; NGSS P2: 9-12.F; NGSS P3: 9-12.E; NGSS P4: 9-12.F; NGSS P6: 9-12.A; NGSS P6: 9-12.D; NGSS P7: 9-12.E; NGSS CC4; CLG 3.1.3; CLG 3.5.1; CLG 1.1.2; CLG 1.4.2; CLG 1.4.6; CLG 1.4.8; CLG 1.5.1; CLG 1.5.2; CLG 1.5.4; CLG 1.5.5; CLG 1.5.9; CCSS.ELA-Literacy.WHST.9-10.1; CCSS.ELA-Literacy.WHST.9-10.4; CCSS.ELA-Literacy.L.9-10.6)
Conclusion Rubric
15
NOTE: This rubric is adapted from the one provided and modeled during biology professional development SY 2013-14.
LevelComponent 0 1 2Claim (C): A statement that takes a position on the question or problem being investigated.
Does not make a claim, or makes an inaccurate or irrelevant claim.
Makes an accurate, relevant, but incomplete claim.
Makes an accurate, relevant, and complete claim.
Evidence (E):Scientific data that supports the claim. The data needs to be appropriate and sufficient to support the claim.
Does not provide evidence, or only provides inappropriate evidence (evidence that does not link evidence to claim.)
Provides appropriate, but insufficient evidence to support claim. May include some inappropriate evidence.
Provides appropriate and sufficient evidence to support claim.
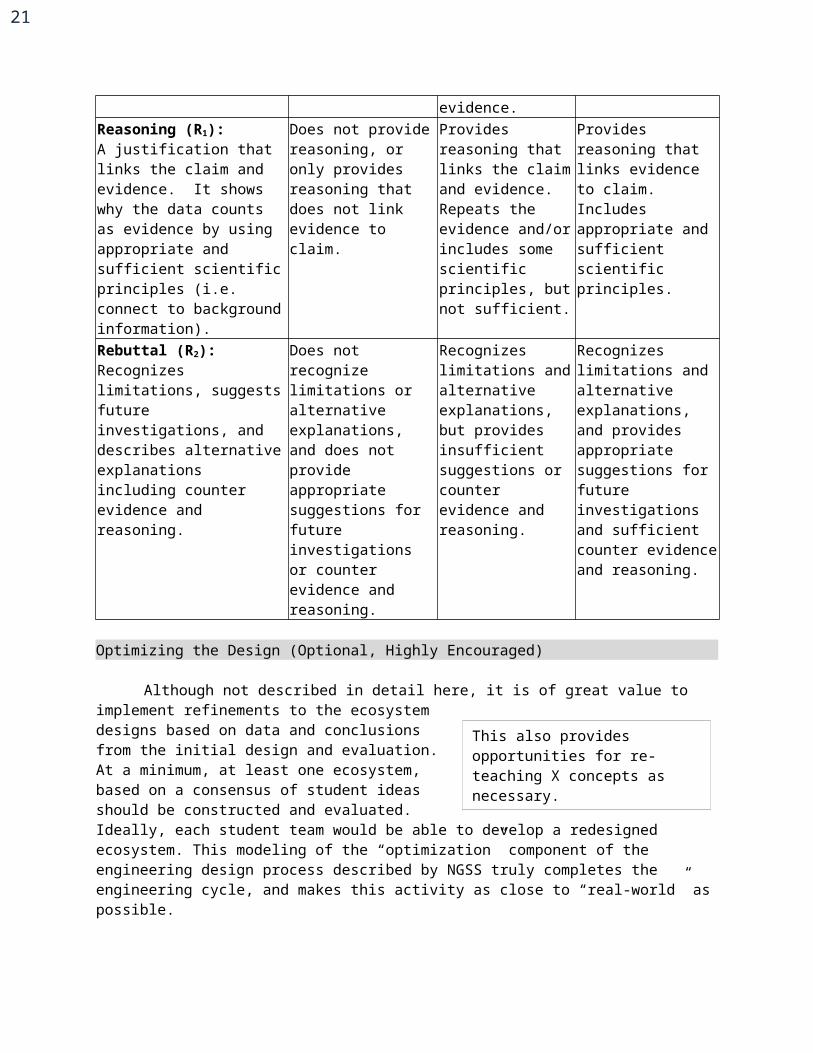
Reasoning (R1):A justification that links the claim and evidence. It shows why the data counts as evidence by using appropriate and sufficient scientific principles (i.e. connect to background information).
Does not provide reasoning, or only provides reasoning that does not link evidence to claim.
Provides reasoning that links the claim and evidence. Repeats the evidence and/or includes some scientific principles, but not sufficient.
Provides reasoning that links evidence to claim. Includes appropriate and sufficient scientific principles.
Rebuttal (R2):Recognizes limitations, suggests future investigations, and describes alternative explanations including counter evidence and reasoning.
Does not recognize limitations or alternative explanations, and does not provide appropriate suggestions for future investigations or counter evidence and reasoning.
Recognizes limitations and alternative explanations, but provides insufficient suggestions or counter evidence and reasoning.
Recognizes limitations and alternative explanations, and provides appropriate suggestions for future investigations and sufficient counter evidence and reasoning.
Optimizing the Design (Optional, Highly Encouraged)
Although not described in detail here, it is of great value to implement refinements to the ecosystem designs based on data and conclusions from the initial design and evaluation. At a minimum, at least one ecosystem, based on a consensus of student ideas should be constructed and evaluated. Ideally, each student team would be able to develop a redesigned ecosystem. This modeling of the “optimization” component of the engineering design process described by NGSS truly completes the engineering cycle, and makes this activity as close to “real-world” as possible.
Differentiation, Modifications, and Accommodations
This also provides opportunities for re-teaching X concepts as necessary.
16
Due in large part to the team-oriented nature of the endeavor and its use of highly varied instructional strategies, this lesson can be successfully undertaken by any student. There are several opportunities for differentiation and modifications that I would like to describe in some detail.
One of the challenges presented to teachers by this lesson is the requirement for at least the temporary culture of varied organisms. One method a teacher might use to deal with a shortage of one or more of the biotic factors is by implementing a bidding phase to the design process. For example, instead of a fixed schedule of costs, the teacher might propose something whereby groups submit silent bids for limited organisms, with organisms being distributed to the highest bidders first, and to progressively lower bids until supplies are gone. Creative teachers might alter the budgets available to teams based on their performance during the first two days of the lesson, for example. Finally, one other important consideration that should help allay some fears about culturing daphnia, hydra, and algae, is that that vast majority of biomass production and nutrient cycling will be done by elodea and snails in these environments anyway, and they are prodigious, weedy, macroscopic organisms. It is possible to imagine conducting the design challenge with only these two organisms, in fact.
There is at least one opportunity for teachers to differentiate the lesson presented in the direction of a more challenging task. For advanced students or teams who may be moving at a pace far ahead of their compatriots, one way to slow them down would be to require them to quantify the population size and biomass of Nannochloropsis algae used initially and at the end of the incubation period. The easiest method to do so, of course, would be to use a cell counting chamber (hemocytometer) to determine the population density directly. The mass of a single nannochloropsis cell is on the order of 10-12 g, or 1 pg. (Note that although it is truly an algae – i.e. eukaryotic – it is tiny, with a diameter of only 2-3 µm.) The calculations embedded in the class data file assume a population density of 109 /mL, and therefore calculate algal biomass as 0.001 g / mL. This is very much a ballpark estimate, and could easily be off by a factor of 10, or even 100 or more depending on the state of the algal culture stock used.
The other huge assumption or simplification made about the algae in this procedure is that the population size remains constant during the two-week incubation period. Clearly, this may not be true at all, and students may notice a distinct qualitative change in water color that is not reflected in the quantitative data – potentially a serious crisis of legitimacy. An advanced student team could greatly increase the validity and precision of results by quantifying the population density (and consequently size and biomass) after incubation by use of a hemocytometer. My final thought on the subject is to suggest that it is possible to establish a relationship between optical density and population density if spectrophotometry data and microscope observations are correlated with one another. By use of such a method, once the relationship has been established, it would be possible for every student team to make a measurement of algal population density using spectrophotometry (very fast and easy!) if a spectrophotometer is available.
Assessment of Learning ObjectivesObjective Embedded
Assessment (Mastery = > 80%)
1. SWBAT classify organisms as producers, consumers, or decomposers by how they obtain energy from the environment.
Student Activity Guide, (SAG) Part I, #1
2. SWBAT distinguish first-order consumers from higher-level consumers by their positions in a food web and/or energy/biomass pyramid by constructing such food webs and pyramids using information obtained from teacher-generated text resources appropriate for the 9-10 grade level.
SAG, Part I #2-3
17
3. SWBAT explain why ecosystems support greater populations of producers than consumers, why first order consumers are more plentiful than second order, etc., by describing the loss of energy as it is transferred between populations in a community.
SAG, Part I, #4-6
18
4. SWBAT identify bacteria as a crucial part of the nitrogen cycle of an ecosystem because they make nitrogen available for plants in the form of nitrate by completing a flowchart model of the nitrogen cycle in aquatic environments
SAG, Part I, p.4
5. SWBAT describe how the carbon cycle transfers light energy from producers to consumers, which eventually release that energy as heat lost to the environment by completing a flowchart model of the carbon cycle in aquatic environments.
SAG, Part I, p.5
6. SWBAT design and construct a small ecosystem using the principles of matter and energy cycling by selecting the type and quantity of organisms used, while adhering to specific design constraints.
SAG, Part II “Initial Plan”
7. SWBAT describe features of their design plan that promote stability and productivity in writing.
SAG, Part II “Rationale for Plan”
8. SWBAT measure and record quantitative data describing the initial and final abiotic and biotic conditions of their designed ecosystem: pH, dissolved oxygen, nitrate, biomass, and biodiversity. They will also record qualitative observations during the incubation period.
SAG, Parts III - VII
9. SWBAT use a teacher-generated evaluation tool to quantify the overall effectiveness of designs by analyzing student-generated data.
SAG, Parts VIII & IX
10. SWBAT propose a specific refinement to their ecosystem design that they claim will be the most effective possible change. Student claims will be supported by evidence that includes student-generated data and scientific principles. The claim must be further supported by reasoning that explains (1) why the proposed change is expected to improve performance for one or more specific evaluation criteria, and (2) why the proposed change is the most effective refinement possible among all options.
SAG Part X, “Conclusion”
Supporting Documents
The following documents support this lesson plan. A brief description of each is included here, though they were not included due to page limit restrictions.
Life Pod Organism Descriptions: This is a set of informative texts designed to convey useful and interesting information about the organisms available for experimentation. They are required to complete Part I of the student activity guide.
Student Activity Guide: This is an extensive guide to the activity that includes guided notes, data tables, analysis questions, and analytical questions, as well as a description of the expectations for conclusions and supporting evidence. It is not included here for formatting reasons.
Class Data File: This is an extensive Excel file that organizes the 17 measurements, 10 calculated values, and 8 calculated scores of each student team in a student-user-friendly format. It will automatically produce 64 graphs relating each of 8 independent variables/factors (i.e. initial conditions) to 8 dependent variables/factors (i.e. scores). Graphs include linear regressions, associated slope-intercept equations, and R2 values for quick evaluation.
Notes and Reflections: Implementing the Bidding Process on Day 3.
19
The largest modification to this plan that took place during its initial implementation in my classroom in the spring of 2014 was a modification to how materials were distributed. It became apparent before beginning the lesson that using a simple price list would not guarantee student groups would receive all of the materials they purchased with their budget, because of the limited supply of organisms. Therefore, instead of a $10,000 budget to “buy” materials, student teams developed $10,000 total bids for organisms (abiotic materials were freely distributed). In this way, the limited resources were allocated to the highest bids per organism. In two sections, a follow-up to the bidding process took place whereby student teams could trade claims to organisms, which was amazing. This actually made the process much more interesting and exciting for students. With the knowledge they would be able to trade claims to organisms later, several teams developed strategies to “corner the market” on organisms they thought would be in high demand, including algae and snails, with mixed results. For the trading process, we developed an options-trading marketplace with a big board listing offers for trade and the classroom quickly began to look like the floor of the New York Stock Exchange, with team members jockeying between different teams to organize trades. On multiple occasions, spontaneous auctions of organisms developed. Even though it was largely unplanned, the addition of this bidding and trading scheme made the learning experience better in several ways. First, it increased the quality of designs, since teams could obtain needed organisms or unload organisms that were not needed after the initial bidding process. Additionally, it greatly increased student motivation and personal investment in the project. I have updated the student activity guide to include procedures for the bidding process. A simple trade request form can be found in the lesson plan procedures for day 3.
One of the biggest problems that will be corrected in the future was the relative lack of Daphnia. Because of some difficulties maintaining and growing out cultures, it was nearly impossible for teams to procure enough materials to construct an ecosystem capable of supporting a hydra, though several teams claim to have had them survive. In short, the lesson worked on a fundamental level because it
20
did clearly demonstrate the crucial importance of producers, but to develop a stable, more complex ecosystem will require much more algae and daphnia.
Finally, an interesting development occurred after the lab, and I would like to take this opportunity to describe what I believe was a case of previously undescribed symbiogenesis – the development of a new symbiotic relationship. As you may know, Hydra is typically divided into two types, brown Hydra and green Hydra which contain endosymbiotic extracellular photosynthetic algae. After the conclusion of the experiment, I disposed of excess organisms by adding them to a poorly defined “slime tank” aquarium which at that time contained no none of the organisms from this experiment, except Elodea. To my surprise, after several weeks I discovered green Hydra, which I can only assume, developed from the brown Hydra. Hydra littoralis, the species supplied by Carolina, is not known to develop symbiotic relationships with algae readily. Inspection under a microscope revealed that the green hydra from the slime tank did in fact contain symbiotic algae morphologically indistinguishable from the Nannochloropsis algae used in the experiment, and I have photographs that support this hypothesis. In the future, I would like to have a student team determine if in fact Hydra littoralis can go through symbiogenesis with Nannochloropsis by conducting experiments with better controls.
SY 2014-15
I am extremely excited for the opportunity to share this design challenge with BCPSS teachers through biology professional development in April of 2015. First and foremost, I am excited because I believe it to be a great way to demonstrate what the successful implementation of NGSS can look like, from a curricular design perspective, a teaching perspective, and a student perspective. Second, I firmly believe that student work with living organisms is a crucial part of learning about biology, and this is a phenomenal opportunity to push organisms out to classrooms across the city. Finally, it may represent the result of the best idea I’ve had in ten years of teaching, combined with countless hours of work.
Selected Photographs
21
Materials Distribution Testing Abiotic Conditions
Life Pods Under Lights Glass Bottle Variation
Happy Snail