Embed Size (px)
Citation preview
Digital BankingInvestor Relations Meeting 8th November 2014
V1
Digital BankingDigitalization seminar, 11th November 2014 Christian Bornfeld, Head of Digital Banking
1. Nordea highlights
2. Customer behaviours & competitive dynamics
3. Digital Banking & the future relationship bank
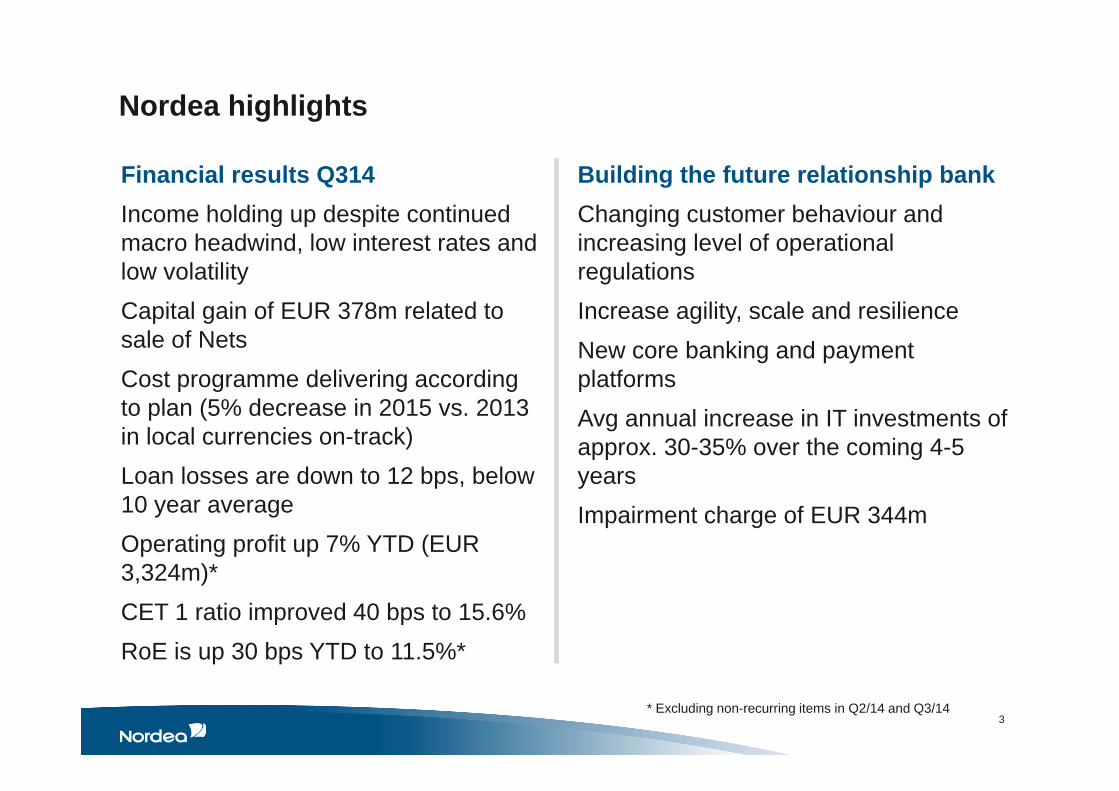
Nordea highlights
3
Financial results Q314Income holding up despite continued macro headwind, low interest rates and low volatilityCapital gain of EUR 378m related to sale of NetsCost programme delivering according to plan (5% decrease in 2015 vs. 2013 in local currencies on-track)Loan losses are down to 12 bps, below 10 year average Operating profit up 7% YTD (EUR 3,324m)* CET 1 ratio improved 40 bps to 15.6%RoE is up 30 bps YTD to 11.5%*
* Excluding non-recurring items in Q2/14 and Q3/14
Building the future relationship bankChanging customer behaviour and increasing level of operational regulationsIncrease agility, scale and resilienceNew core banking and payment platformsAvg annual increase in IT investments of approx. 30-35% over the coming 4-5 yearsImpairment charge of EUR 344m

1. Nordea highlights
2. Customer behaviours & competitive dynamics
3. Digital Banking & the future relationship bank

Customer behaviours and expectations are changing rapidly
The Internet, smartphones and apps drive customers who are increasingly
connectedknowledgeableempowered& impatient
5 •
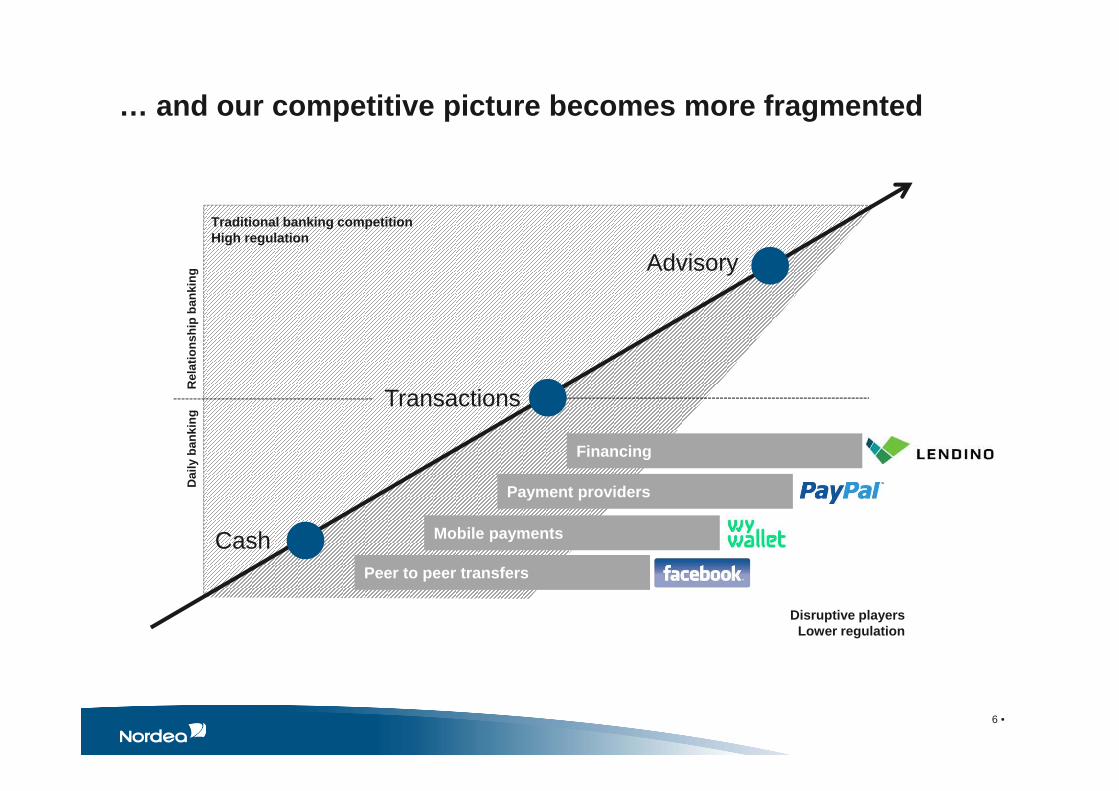
… and our competitive picture becomes more fragmented
Cash
Transactions
Advisory
Traditional banking competitionHigh regulation
Peer to peer transfers
Financing
Mobile payments
Payment providers
Disruptive playersLower regulation
Rel
atio
nshi
p ba
nkin
gD
aily
ban
king
6 •

New behaviours are impacting on all of Nordea’s touch-points
7 •

TRANSACTIONS / LOGONS, MILLIONS
8 •
High-value digital interactions / qtr
… reflected especially in a growth of digital interactions
325
30
273
5615
+1.020%-50%
Mobile trans. Mobile log-onsBranch trans.
+753%
2011 2014e
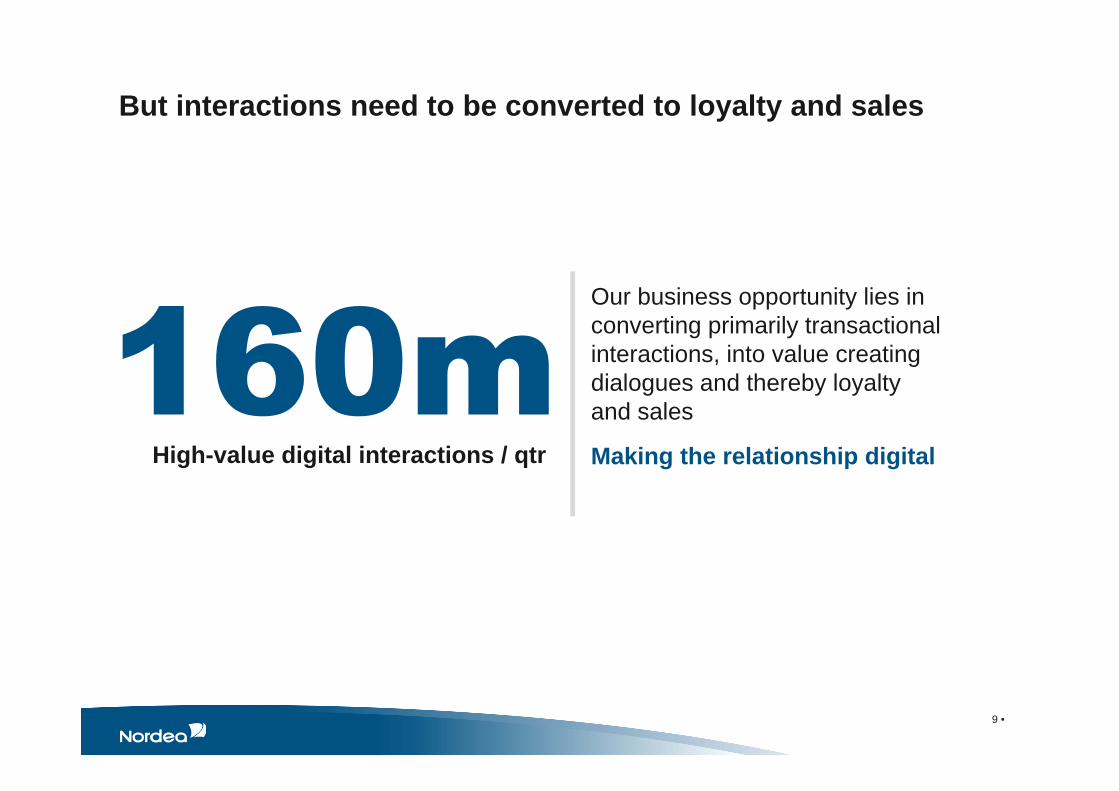
But interactions need to be converted to loyalty and sales
Our business opportunity lies in converting primarily transactionalinteractions, into value creatingdialogues and thereby loyaltyand sales
Making the relationship digital
9 •
High-value digital interactions / qtr

1. Nordea highlights
2. Customer behaviours & competitive dynamics
3. Digital Banking & the future relationship bank

We will address the well established Relational Banking model
Classic relationship banking
Personal relationship
Knowledge
Responsive
11 •

… and through digitalization, make it scalable for the future
Convenience
Personal
Trust
12 •
Analytics, learning & automation
Digitally enabledrelationship banking

… for both our personal and business segments
13 •
Analytics, learning & automation
Engaging with Nordea at the touch-point of choiceConsistent advice and services across touch-points Human interaction available when wanted
HOUSEHOLD CUSTOMERS CORPORATE CUSTOMERS
Timely, relevant and proactive adviceKnown and recognised in all touch-pointsAdaptive interfaces to Nordea
Strong security (a ”strong box” for bits and bites) Data used to improve service and adviceCompetent and sincere recommendations
CO
NV
EN
IEN
CE
PE
RS
ON
AL
TRU
ST
Tools and services supporting user work efficiencyAdvice and financial overview across touch-points Human interaction available when wanted
Timely, relevant and proactive adviceServices integrated into businesses’ value chainRole-based interfaces to Nordea
Strong security and stability Data used to improve service and adviceProfessional advice strengthening businesses

… allowing us to better serve more customer groups
BUSINESS IMPACT
14 •
Greatly widen target groups for salesIncrease loyaltyLower cost to serveImprove channel mix & productivity
Analytics, learning & automation
BREAKING THE 80 / 20 RULE
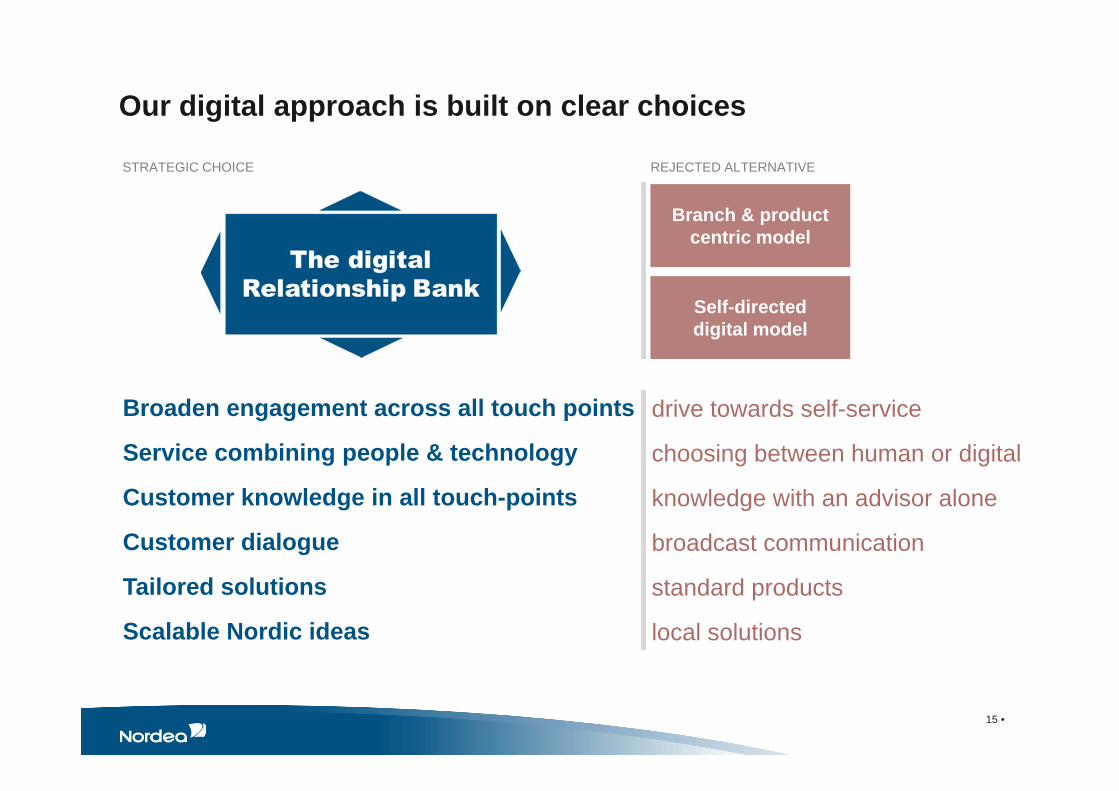
Broaden engagement across all touch points
Service combining people & technology
Customer knowledge in all touch-points
Customer dialogue
Tailored solutions
Scalable Nordic ideas
Our digital approach is built on clear choices
Branch & product centric model
Self-directed digital model
drive towards self-service
choosing between human or digital
knowledge with an advisor alone
broadcast communication
standard products
local solutions
REJECTED ALTERNATIVE
15 •
STRATEGIC CHOICE

… and enabled by establishing a dedicated business unit
Responsible for the full value chain
Combining business expertise and creativity with technical knowledge
Change agent to ensure momentum
DIGITAL BANKING SOLUTION PRINCIPLES
Think in end-to-end customer journeys
Leverage analytics and respect data privacy
No physical meetings required
Digital signing / paperless processes
Same front-end for assisted & self-service
Utilize existing public infrastructures
Mobile-first approach to Household
16 •
DIGITAL BANKING

Digital Banking will apply a mindset of learning
Exploration and curiosity
Challenge constraints / dogma
Deploy > observe > learn > adjust
Partnerships and open innovation
Evolution rather than revolution
17 •
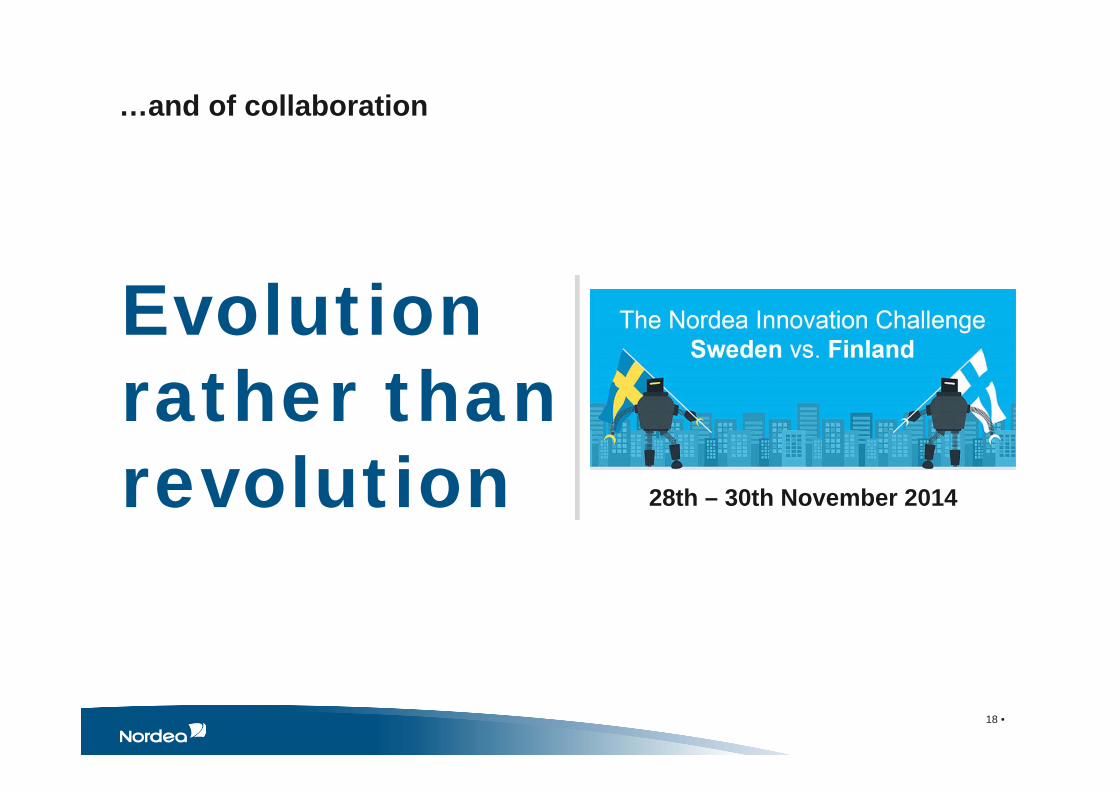
…and of collaboration
Evolution rather thanrevolution
18 •
28th – 30th November 2014

The first steps in a longer journey are being implemented
19
Additional investments in online- and mobile – significantly increasing speed of development
Remote meetings rolled out in all countries – improved flexibility for customers in terms of timing and place
Re-mortgaging process automated in Denmark – significantly reducing manual work and drastically decreasing paper send to customers (900,000 letters) and internally (3,500 kg of paper)
Data driven sales pilot in Sweden - targeting mass market customers in Sweden with strong early results
Contact centre improvements in Finland and Norway – chat services, improved identification measures, etc. improving efficiency and customer experience
1
2
3
4
5
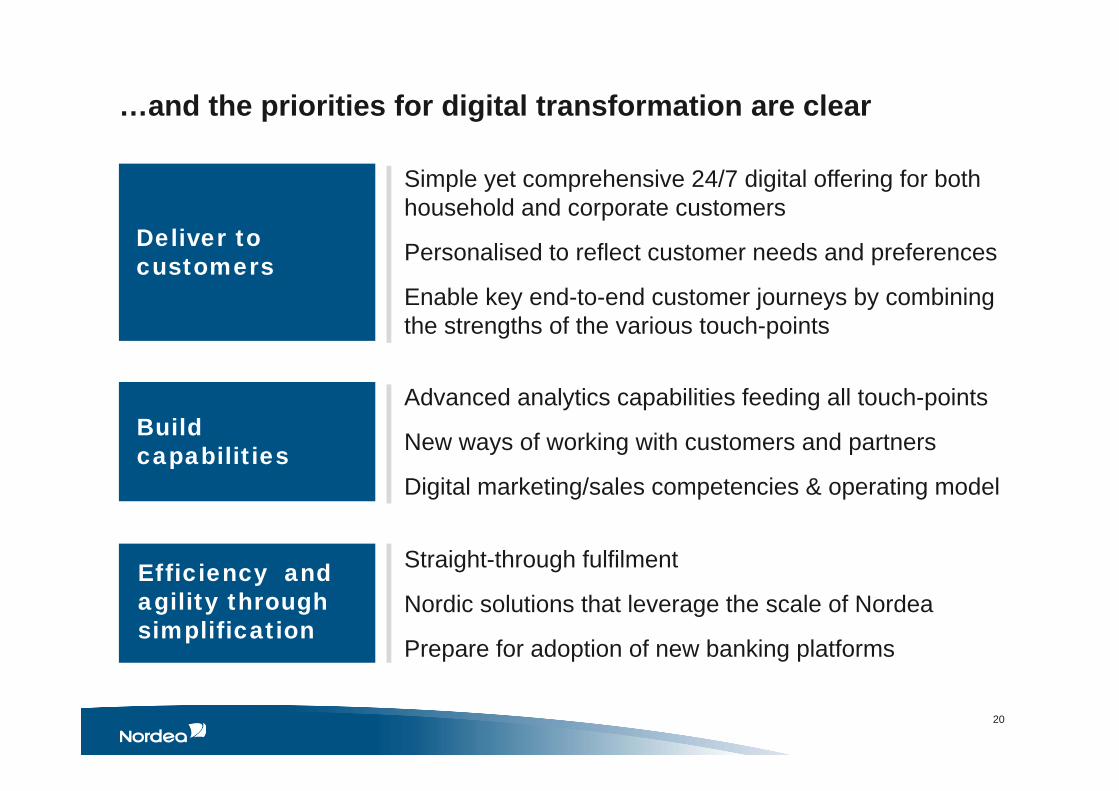
…and the priorities for digital transformation are clear
20
Deliver to customers
Build capabilities
Efficiency and agility through simplification
Advanced analytics capabilities feeding all touch-points
New ways of working with customers and partners
Digital marketing/sales competencies & operating model
Simple yet comprehensive 24/7 digital offering for both household and corporate customers
Personalised to reflect customer needs and preferences
Enable key end-to-end customer journeys by combining the strengths of the various touch-points
Straight-through fulfilment
Nordic solutions that leverage the scale of Nordea
Prepare for adoption of new banking platforms

All in all – building the future Relationship Bank
Value-creating interactions at every touch-point
Efficient and compliant delivery by a simplified and effective back-end
21 •
Customer experience
Internal complexity

22 •

Thank you!

Appendix
25
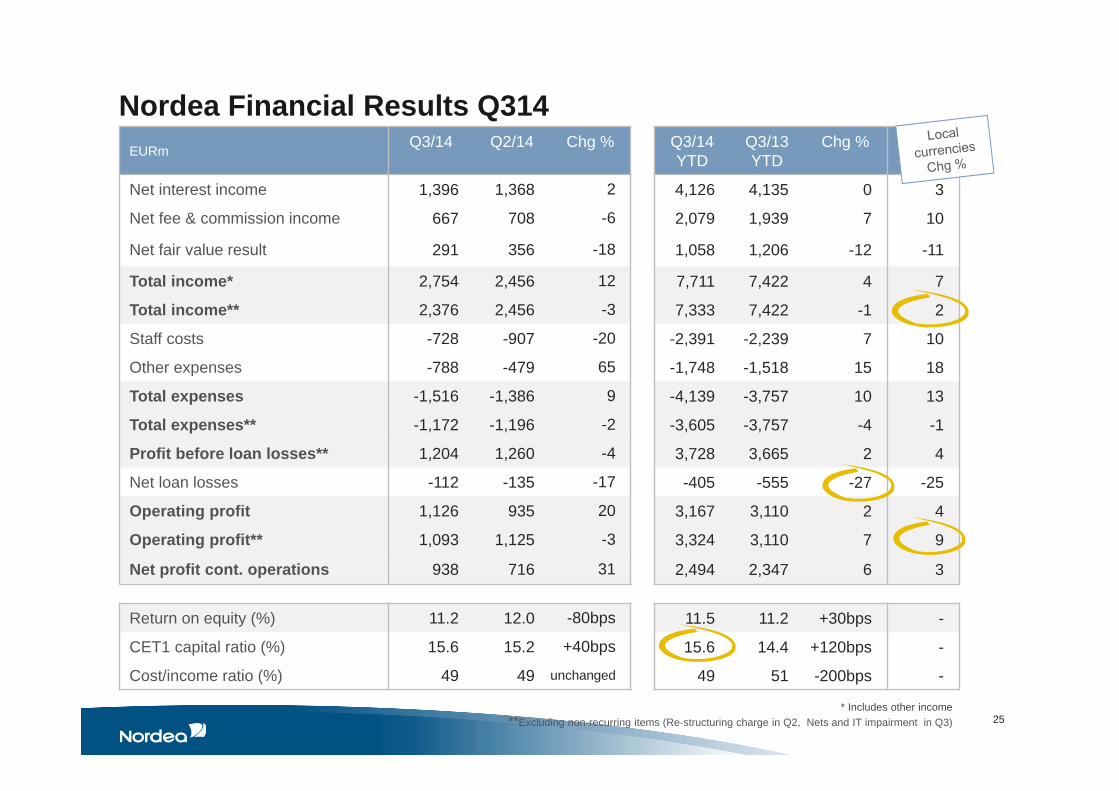
EURm Q3/14 Q2/14 Chg % Q3/14YTD
Q3/13YTD
Chg %
Net interest income 1,396 1,368 2 4,126 4,135 0 3
Net fee & commission income 667 708 -6 2,079 1,939 7 10
Net fair value result 291 356 -18 1,058 1,206 -12 -11
Total income* 2,754 2,456 12 7,711 7,422 4 7
Total income** 2,376 2,456 -3 7,333 7,422 -1 2
Staff costs -728 -907 -20 -2,391 -2,239 7 10
Other expenses -788 -479 65 -1,748 -1,518 15 18
Total expenses -1,516 -1,386 9 -4,139 -3,757 10 13
Total expenses** -1,172 -1,196 -2 -3,605 -3,757 -4 -1
Profit before loan losses** 1,204 1,260 -4 3,728 3,665 2 4
Net loan losses -112 -135 -17 -405 -555 -27 -25
Operating profit 1,126 935 20 3,167 3,110 2 4
Operating profit** 1,093 1,125 -3 3,324 3,110 7 9
Net profit cont. operations 938 716 31 2,494 2,347 6 3
Return on equity (%) 11.2 12.0 -80bps 11.5 11.2 +30bps -
CET1 capital ratio (%) 15.6 15.2 +40bps 15.6 14.4 +120bps -
Cost/income ratio (%) 49 49 unchanged 49 51 -200bps -
* Includes other income**Excluding non-recurring items (Re-structuring charge in Q2, Nets and IT impairment in Q3)
Nordea Financial Results Q314

The leading Nordic retail bank
26
EURm Q3/14 Q2/14 Chg % Q3/14YTD
Q3/13YTD
Chg %
Net interest income 963 952 1 2 854 2 862 0 3
Net fee & commission income 277 264 5 819 770 6 10
Net fair value result 75 95 -21 269 286 -6 -3
Total income 1 323 1 319 0 3 970 4 001 -1 2
Staff costs -329 -336 -2 -1 003 -1 028 -2 0
Total expenses -687 -713 -4 -2 118 -2 210 -4 -1
Profit before loan losses 636 606 5 1 852 1 791 3 7
Net loan losses -86 -119 -28 -329 -333 -1 -1
Operating profit 550 487 13 1 523 1 458 4 8
Retail Banking result Q3/14
Retail Banking contribution*
Operating income Operating profit FTE’s Lending Deposits
54% 45% 59% 67% 60%
* FY 2013

Digital BankingInvestor Relations Meeting 8th November 2014
V1
Digital BankingDigitalization seminar, 11th November 2014 Christian Bornfeld, Head of Digital Banking