Embed Size (px)
Citation preview
2002 International Conference on the Digital Divide: Technology & Politics in the Information Age
DIGITAL DIVIDE INNATIONAL INFORMATIZATION QUOTIENT:THE PERSPECTIVE OF MAINLAND CHINA
Jianbin Jin and Chengyu Xiong
School of Journalism and Communication, Tsinghua University, Beijing, PRC
Abstract
This paper introduces a new approach in assessing the digital divide. Digital divide is a
widely mentioned but conceptually confusing construct in contemporary communication
studies. Beginning with the discussion of multi-faceted nature of digital divide, we argue
that the presence of digital divide largely depends on how it is defined. National
Informatization Quotient (NIQ) is an index launched by China government to evaluate
the information and communication technologies development in different regions in
China. It is composed of six dimensions which cover 20 indicators. The structure and
computation of NIQ are introduced in detail. Utilizing the informatization development
data of 2000 published by National Informatization Evaluation Center (NIEC), the digital
divide situation in China is assessed. Specifically, the ratio of Standard Deviation to
Mean of NIQ index of all cases is tactically employed as the indicator of digital divide
level in our analysis of the digital divide. According to our analysis, there is “significant”
digital divide in China in terms of NIQ in year 2000.
The Digital Divide in Terms of National Informatization Quotient:
1
2002 International Conference on the Digital Divide: Technology & Politics in the Information Age
The Perspective of Mainland China
Laugksch (1999) pointed out that scientific literacy has become an internationally well-recognized educational slogan, buzzword, catchphrase, and contemporary educational goal. The same applies to the case of digital divide. Courtright & Robbin (2001:2) contend that “the metaphor of the ‘digital divide’ has become part of the national discourse of the United States, an abstract symbol that condenses public concerns about social inequality and evokes hopes for solutions related to the use of information technology.” In addition, “the digital divide is a potent resource whose symbolic properties and communicative power have activated a wide array of participants in the policy debates about how to create a more just society.”
According to Hoffman (2001, cf.: Arquette, 2001), the term digital divide was first used by Lloyd Morrisett who vaguely conceived of a divide between the information-haves and have-nots. However, the divide herein mainly is a gap of PC penetration in the early days of the Apple II in 1980 (Arquette, 2001). The term then grasped public’s attention with the issuance of the first National Telecommunications and Information Administration (NTIA) survey on Internet adoption and use in the US in 1994 with the catchy title: Falling Through the Net. Since then, numerous articles, either popular or academic, on this issue have been published. According to a convenient sample of newspapers, journal articles, newswires and similar mass media sources in the Lexis-Nexis database from January 1999 to December 2000 (Arquette, 2001), the increasing rate of digital divide related articles hits almost 3000%. In China, digital divide is receiving similar social saliency. A quick search with the key words “digital divide” (in Chinese) in one of China’s leading news website People’s Daily Online (peopledaily.com.cn) shows that at least 500 articles somehow related to this term are available1. On July 2001, a high-level forum on public understanding of information technology with the special topic of Pay Attention to the Digital Divide was held in Beijing. A wide range of representatives, including governmental officials, IT experts, educators, social scientists and media practitioners, presented their viewpoints and comments on this issue. Digital divide has been incorporated into people’s daily conversational discourse.
Ironically, while the term digital divide has frequently appeared in varied contexts, including academic writings, both the connotative and denotative meanings of it are confusingly incoherent. The presence of other similarly prevalent terminologies, such as digital equality, information equality, e-development, network readiness, etc., add additional confusion. People seem to debate on the issue without a shared understanding of what is meant by the digital divide. As Arquette (2001) contends, the entire “e” researcher community is plagued by a lack of definitional clarity of the concepts such as digital divide: “each researcher assumes other researchers use the same definitional frameworks for these terms” while in fact “there is no such shared meaning in nomenclature.” (p.3).
1 The website of People’s Daily is: http://www.peopledaily.com.cn, the search is conducted on July 31, 2002.
2
2002 International Conference on the Digital Divide: Technology & Politics in the Information Age
While the comment of Arquette (2001) mainly refers to the phenomenon in the English speaking world, the use of its Chinese counterpart of the term digital divide is also in a similar situation. For example, among more than 30 articles collected by the book Pay Attention to the Digital Divide in China (Leng, 2002), no consistent conceptual definition is available across the writings. While some are talking about the Internet penetration divide among different social groups categorized by age, occupation and educational level, others refer the concept to an uneven development of e-infrastructure among different areas or nations. So, whenever the term digital divide is confronted, the following question can always be raised: in terms of what?
This article intends to introduce a new approach of operationalizing digital divide from the perspective of China. We first make a brief review of different definitional perspectives of the term digital divide. Then a detailed introduction of National Informatization Quotient is presented which will be employed as the operational definition of the informatization level of a region. Finally we will investigate the geographical digital divide in China in terms of NIQ. Conceptual Review
Sartori (1984, p.22) contends that “clear thinking requires clear language,” and “in turn, a clear language requires that its terms be explicitly defined.” In the study of digital divide, a clear conceptual and operational definition of the term seems to be the essence of any meaningful conversation and communication.
Conceptualization is the process through which we specify the essential dimensions of a concept. On the other hand, operationalization involves the development of specific research procedures that enables the empirical observations representing those intended concepts in the real world (Babbie, 1998). In this section, we will briefly review the multiple conceptions around digital divide.
Digital divide is a fresh term not unfamiliar to communication scholars (Zhu, 2002). As early as 1970, a theory called knowledge gap (Tichenor, Donohue & Olien, 1970) was developedwhich has been one of the most active inquiry fields hereafter in communication studies. The supposition of knowledge gap mainly concerns the different knowledge possession through mass media by social groups with varied social-economic-status. In 1980s, with the development of ICTs, especially with the wide application of PC in diverse contexts, a divide between the information-haves and have-nots was sensitively observed and warned (Compaine, 2001). Since early 1990s, digital divide has gradually become a convenient label, or more precisely, a metaphor (Courtright & Robbin, 2001), in describing the inequality of possessing and using ICTs, especially the Internet connectedness.
3
2002 International Conference on the Digital Divide: Technology & Politics in the Information Age
We contend that the various definitions of the concept can be summarized through two clues implied by the term itself: along the meaning of “digital” and along the meaning of “divide”.
The first group of definitions varies on the concrete referents of what “digital” means. In a narrow sense of the definition, digital divide is particularly referred to the inequality of Internet access and use among different social groups or localities. US Department of Commerce’s (1995, 2001) Falling through the net reports represent the most influential version of the stream. Zhu (2002) also takes Internet penetration as the sole indicator of what “digital” means in his construction of digital divide index (DDI) while taking age, sex, education and occupation collectively as the categorizing factors. In short, in this stream of definitions, digital divide is operationalized to Internet access/penetration divide categorized by demographics and social status factors.
However, to many people, the term digital means a wide range of ICTs other than the Internet. Arquette (2001) labeled it as the concept fit2 disjuncture in the studies of digital divide, i.e., to measure global digital equality in terms of teledensity or Internet penetration. Employing the so-called Information Intelligence Quotient (IIQ) analytical framework, he uses ICT infrastructure rather than a single ICT such as Internet or telephony as the subject of the “digital”.
A second clue of conceptualizing the digital divide basically focuses on the meaning of “divide”. Many different analytical perspectives on this concern are available. Jackel (2001) exemplifies some of these:
� A macro-level-comparison of the so-called First and Third world or a comparison of rich and poor countries;
� A comparison of differences in modern societies according to the level of integration in the labor market;
� A comparison of differences in modern societies according to education groups, gender and age, more general a comparison of generations;
� A specification of differences in modern societies according to communication skills;
2 The conceptual fit describes the degree to which an operational definition approximates the conceptual definition of a variable (Frey et al., 1999; cf. Arquette, 2001).
4
2002 International Conference on the Digital Divide: Technology & Politics in the Information Age
� A comparison of different diffusion curves as a result of differing demands.
As can be seen, the dimensions identified by these perspectives are noticeably diverse.
Synthesizing the prior research on digital divide, Arquette (2001) proposed an organizational framework based on three dimensions of digital divide: ICS infrastructure, access, and use. ICS infrastructure refers to the technophysical means by which voice, audio, video and/or data communication circulates. The operationalization of the dimension involves the specification of sixteen indicators, including telephony penetration (wire line and wireless), Internet hosts, and costs of calls, etc. The second dimension is ICS access which “focuses on the ability of persons interested in using the infrastructure (regardless of that infrastructure quality or quantity) to gain access to the infrastructure.” Nineteen indicators are developed to operationalize the dimension. The third dimension of digital divide that Arquette (2001) specifies is ICS use. Use-based conceptualizations of digital divide are conceived in terms of how people employ the technologies. Another nineteen indicators are developed to measure the situation of this dimension of digital divide. In summary, IIQ is an aggregate meta-analytic framework for assessing the state of digital divide among different nations or regions.
A notable point implied by the IIQ is its consideration of the dimension of ICT use. In fact, “access is not enough” is becoming a recognizable consensus (e.g., Blau, 2002; Jackel, 2001; Nagaraj, 2002). In other words, merely connecting people and computers will not bridge the digital divide (Blau, 2002), and there’s digital discrimination among the information haves, too (Nagaraj, 2002). Jackel (2002) labels the divide among ICT haves as the second level of “divide”.
This article tends to view the digital divide in a broad sense. Similar to IIQ to some extent, we will synthetically take a couple of ICTs, other than merely Internet and computer, into consideration. In addition, some additional dimensions of the concept will be specified to reflect the special characteristics in China. This perspective of the digital divide is reified eventually through so-called National Informatization Quotient (NIQ).
The Frame and Content of NIQ
After eight years’ debates and studies, the National Informatization Quotient (NIQ) was officially launched on July 29, 2001 by the Ministry of Information Industry of China as a key index of China’s IT development. The establishment of NIQ signalized
5
2002 International Conference on the Digital Divide: Technology & Politics in the Information Age
China’s determination to establish a unified national index for scientifically evaluating national and regional informatization as well as for comparison with other countries. It is proposed and perfected under the context of China’s pursuit of promoting industrialization by developing the information industry in order to make a big leap-forward in development. According to People’s Daily (May 8, 2002), NIQ is believed to be an important index besides the gross domestic product (GDP) to demonstrate a country’s comprehensive strength in this information age.
NIQ is a composite index comprised of 20 indicators in six dimensions. It is the operational definition of the National Informatization Level (NIL). In the remaining part of the article, the digital divide is discussed in terms of this NIL which is operationally defined as NIQ.
The six dimensions of NIQ are:
� The development and application of information resources (IR): The indicators under this umbrella term include Radio and TV broadcasting hour/per 1000 people; Bandwidth per person; Telephone use frequency per person; Total capacity of Internet data base.
� Information network construction (IN). There are 4 components in this dimension, including Total length of long distance cable; Microwave channels; Total number of satellite stations; Number of telephone lines per 100 people.
� The application of information technologies (IT): the indicators for this dimension include Number of cable TV stations per 1000 people; Number of Internet users per 1 million people; Number of computers per 1000 people; Number of TV sets per 100 people; E-commerce trade volume; Proportion of investment in the information industry by enterprises to the total fixed investment .
� Information industry development (II): there are two indicators designed to reflect the situation of this dimension: Added value contributed by the information industry to the total GDP; Contributions made by the information industry to the total GDP increase.
� Human resources of informatization (HR): there are two indicators for this dimension: Proportion of university graduates per 1000 people; and Information index which refers to the proportion of expenditure other than fundamental consumption to the total expenditure.
6
2002 International Conference on the Digital Divide: Technology & Politics in the Information Age
� The environment for informatization development (EI). Two indicators are designed to measure the situation of the dimension: proportion of expenses for research and development of the information industry to the country’s total budget in R&D; Proportion of investment on the infrastructural development of the information industry to the country’s total investment in capital construction.
Compared to other index used to reflect the digital divide or ICT development in a country or region, NIQ has several characteristics:
1. It is a multi-dimensional composite index. Therefore, NIQ is a comprehensive reflection of the state informatization level rather than the development of some particular ITs.
2. As for its application in assessing digital divide, the divide it evaluates is a geographical divide rather than informatization divide among different social groups or divides defined by other factors.
3. The index covers a wide range of the aspects regarding the informatization development. Particularly, NIQ emphasizes the importance of information industry in its structure of dimensions. The proportion of indicators related to information industry is notably high which, as is depicted by Song Ling (People’s Daily, May 8, 2002), reflects the fact that NIQ will be a guideline for the promotion and adoption of IT in China.
With the introduction of NIQ, we will turn to examine the digital divide in China in terms of this index. Our research question is:
Is there a digital divide in terms of NIQ in China?
The Computation of NIQ
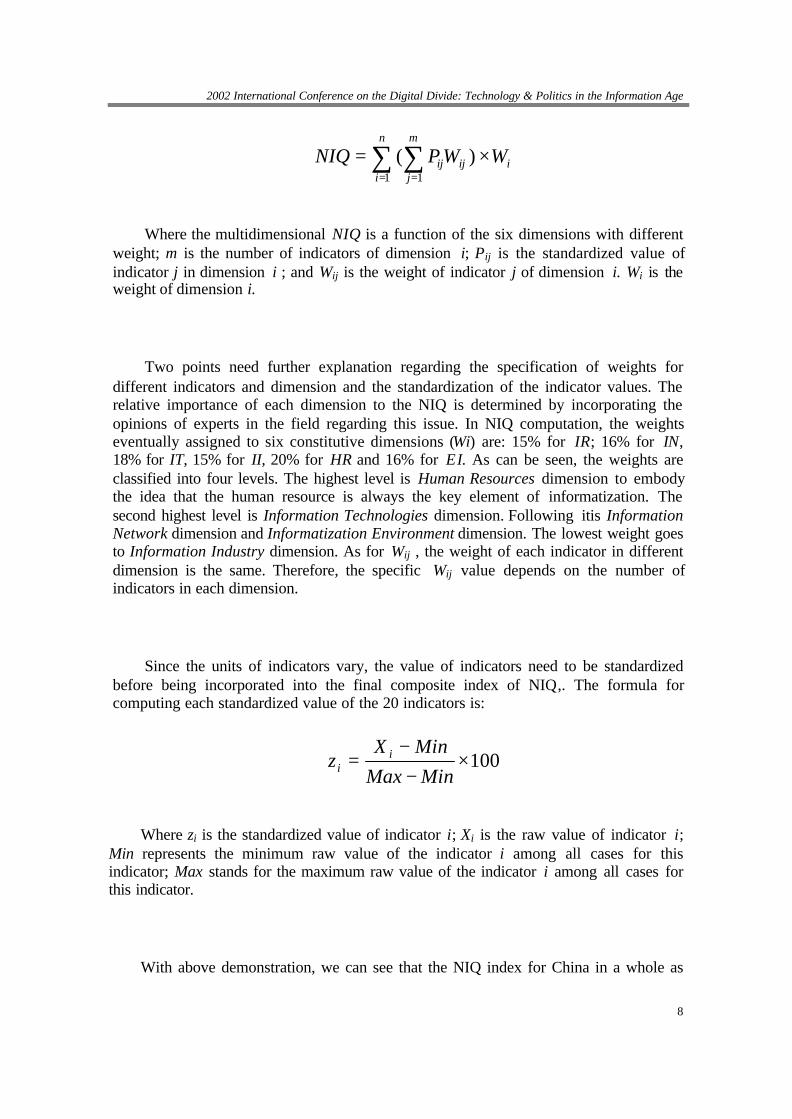
The model for computing NIQ is (National Bureau of Statistics of China, 2001):
7
2002 International Conference on the Digital Divide: Technology & Politics in the Information Age
n m
NIQ = � � W P ij ) ·W( ij i i=1 j=1
Where the multidimensional NIQ is a function of the six dimensions with different weight; m is the number of indicators of dimension i; Pij is the standardized value of indicator j in dimension i ; and Wij is the weight of indicator j of dimension i. Wi is the weight of dimension i.
Two points need further explanation regarding the specification of weights for different indicators and dimension and the standardization of the indicator values. The relative importance of each dimension to the NIQ is determined by incorporating the opinions of experts in the field regarding this issue. In NIQ computation, the weights eventually assigned to six constitutive dimensions (Wi) are: 15% for IR; 16% for IN, 18% for IT, 15% for II, 20% for HR and 16% for EI. As can be seen, the weights are classified into four levels. The highest level is Human Resources dimension to embody the idea that the human resource is always the key element of informatization. The second highest level is Information Technologies dimension. Following itis Information Network dimension and Informatization Environment dimension. The lowest weight goes to Information Industry dimension. As for Wij , the weight of each indicator in different dimension is the same. Therefore, the specific Wij value depends on the number of indicators in each dimension.
Since the units of indicators vary, the value of indicators need to be standardized before being incorporated into the final composite index of NIQ,. The formula for computing each standardized value of the 20 indicators is:
X i - Min zi = ·100
Max - Min
Where zi is the standardized value of indicator i; Xi is the raw value of indicator i; Min represents the minimum raw value of the indicator i among all cases for this indicator; Max stands for the maximum raw value of the indicator i among all cases for this indicator.
With above demonstration, we can see that the NIQ index for China in a whole as
8
-------------------------
-------------------------
--------------------------
2002 International Conference on the Digital Divide: Technology & Politics in the Information Age
well as for each province (or key cities with province status) in a particular year can be calculated. However, due to the fact that the values of indicators might change across years, we have to find a way to ensure the compatibility of the NIQs of different years. For this purpose, a reference year is assigned. Theoretically, the assignment of reference year is arbitrary. In our case, the year 1995 was chosen to be the baseline of NIQ computation. In other words, only the NIQ for year 1995 is calculated through the procedure introduced above. For the years after 1995, we first calculate the growth rate of each indicator (based on the raw values of the indicators across the years). Then we have the aggregate growth rate for each dimension of the NIQ. Finally the growth rate of NIQ based on the six dimensional growth rates is obtained. The NIQ for any year after 1995, therefore, is calculated based on the NIQ of 1995 and the growth rate of each constitutive indicator’s growth rate of the year compared to 1995. With such technical process, the NIQs of different years become compatible and therefore, comparable.
The remaining question is: how to operationally assess the digital divide situation in terms of NIQ?
Since the instrument employed in our analysis of digital divide situation is a composite index rather than a single variable, we have to take a quite different way from what Zhu (2002) proposed in his process of Digital Divide Index. In our case, the standard deviation of all provinces is devided by the means to obtain scores on digital divide among the NIQ index across the country. .
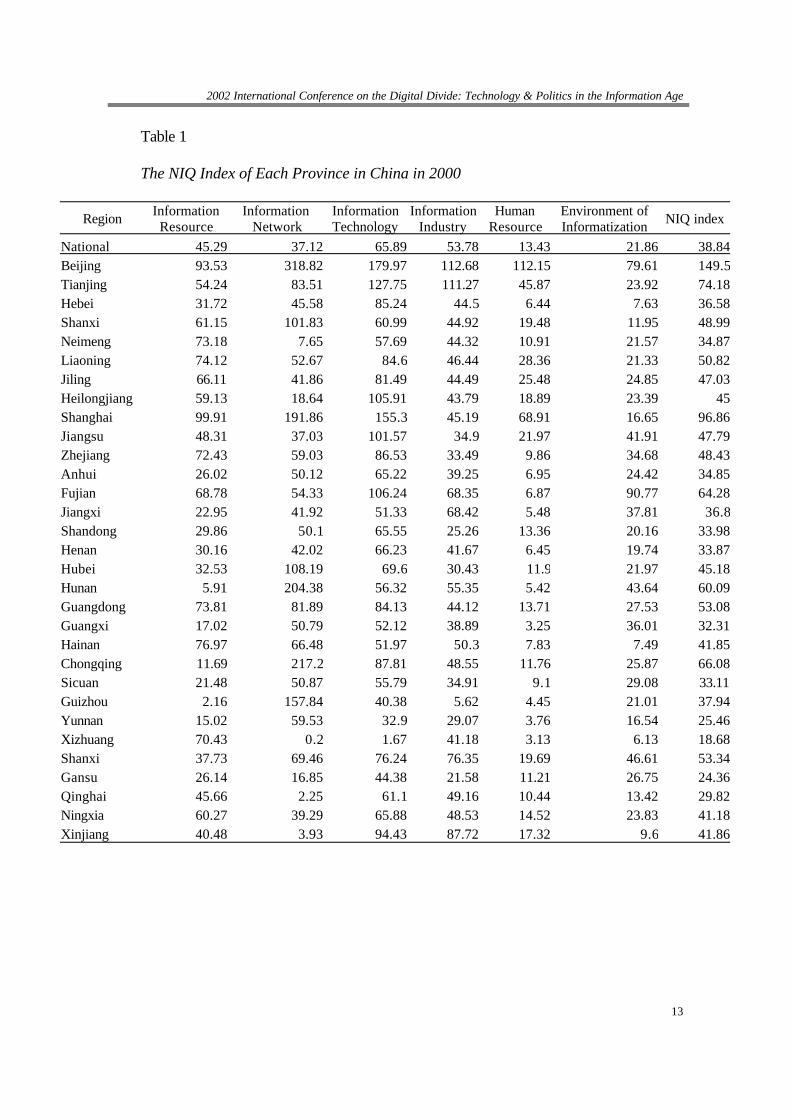
The data for this study was originally collected and issued by National Information Evaluation Center (NIEC). For simplicity, we only present the dimensional index for six dimensions of NIQ in year 2000, as is shown in Table 1.
Table 1 about here
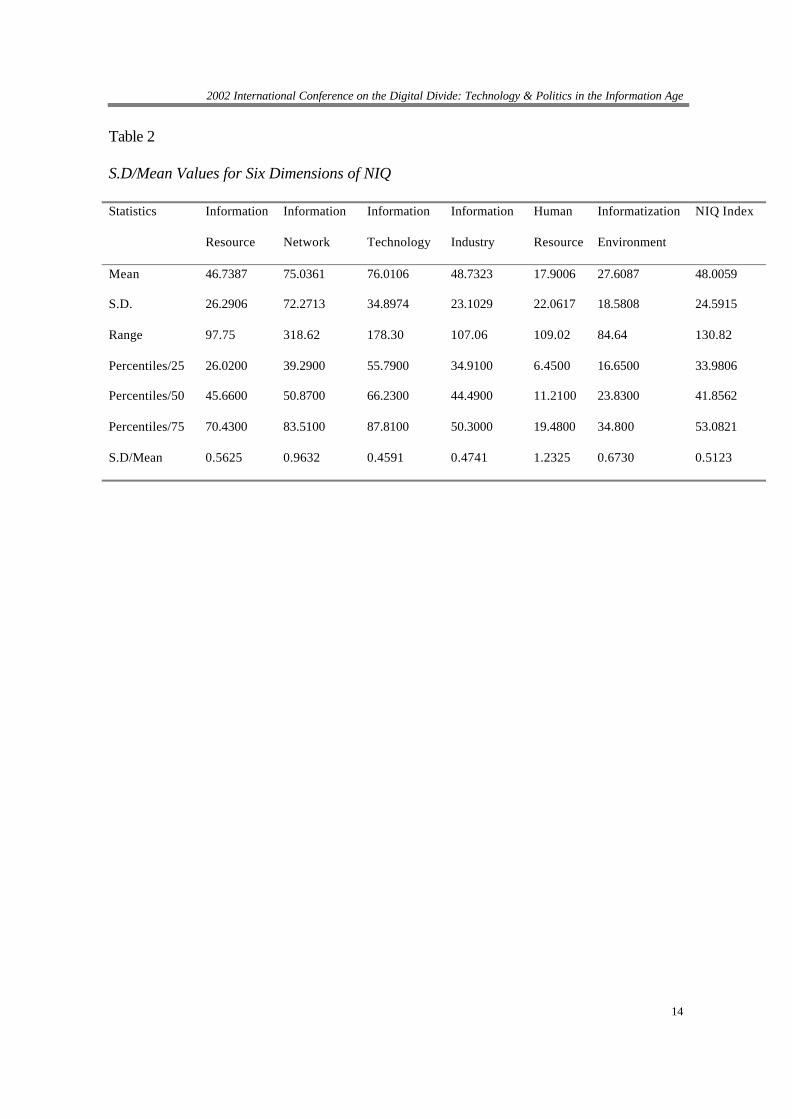
Based on above operationalization of digital divide in terms of NIQ, we investigate the digital divide situation in China for year 2000. Table 2 presents the calculated digital divide scores of six dimensions of NIQ index across the country.
9
--------------------------
---------------------------------------
----------------------------------------
----------------------------
-------------------------
2002 International Conference on the Digital Divide: Technology & Politics in the Information Age
Table 2 about here
As can be seen, the S.D/Mean of NIQ index for all the provinces in China in 2000 is 0.5123. This is pretty high considering the meaning of standard deviation and mean value of NIQ index. Since the statistics of S.D/Mean is seldom employed in previous studies, no existing criterion of judging the significance of divide is available. In this study, we tentatively propose the value 0.5 for S.D/Mean as the critical value in judging whether the “deviation” or divide is “significant”. This is a pretty conservative evaluation. Based on such proposition, we conclude that there is a significant digital divide in China in terms of NIQ in 2000.
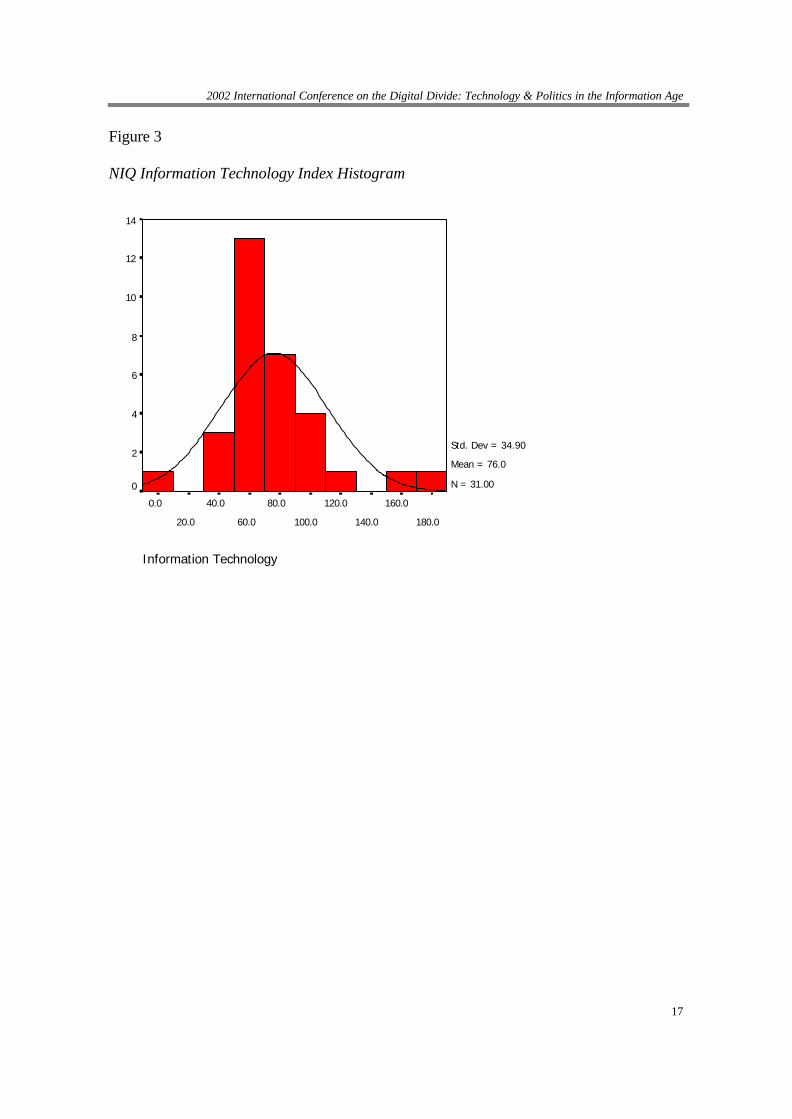
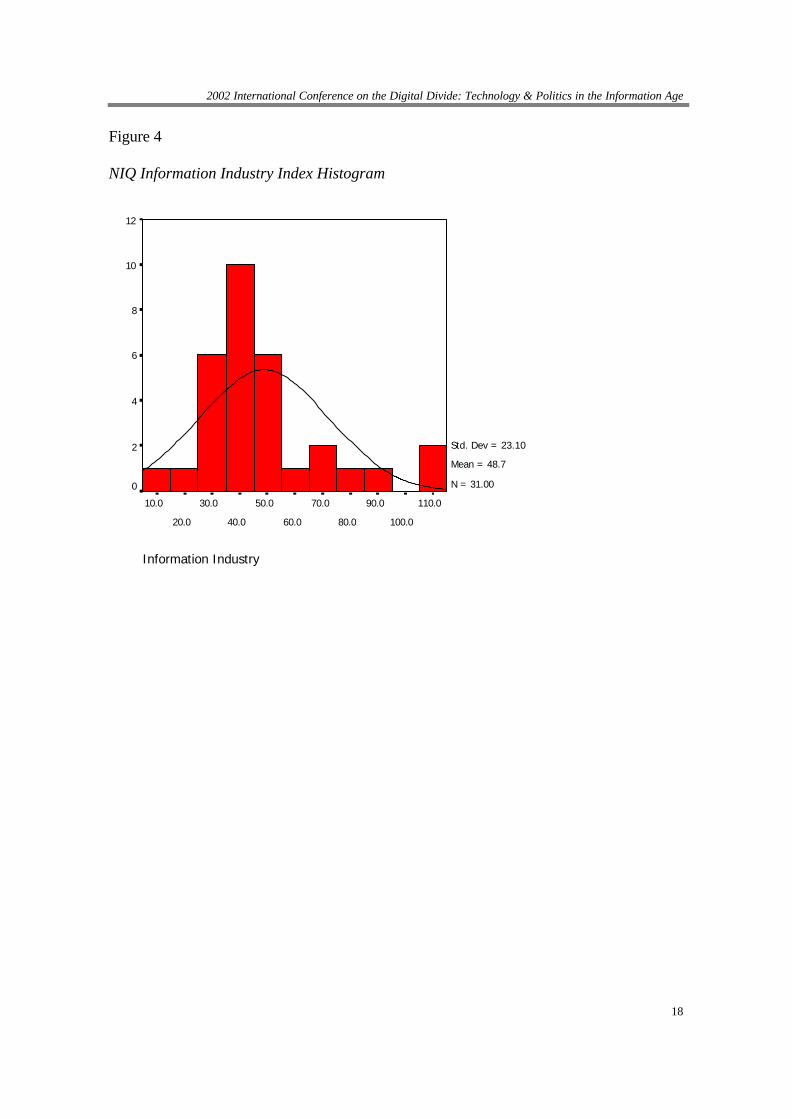
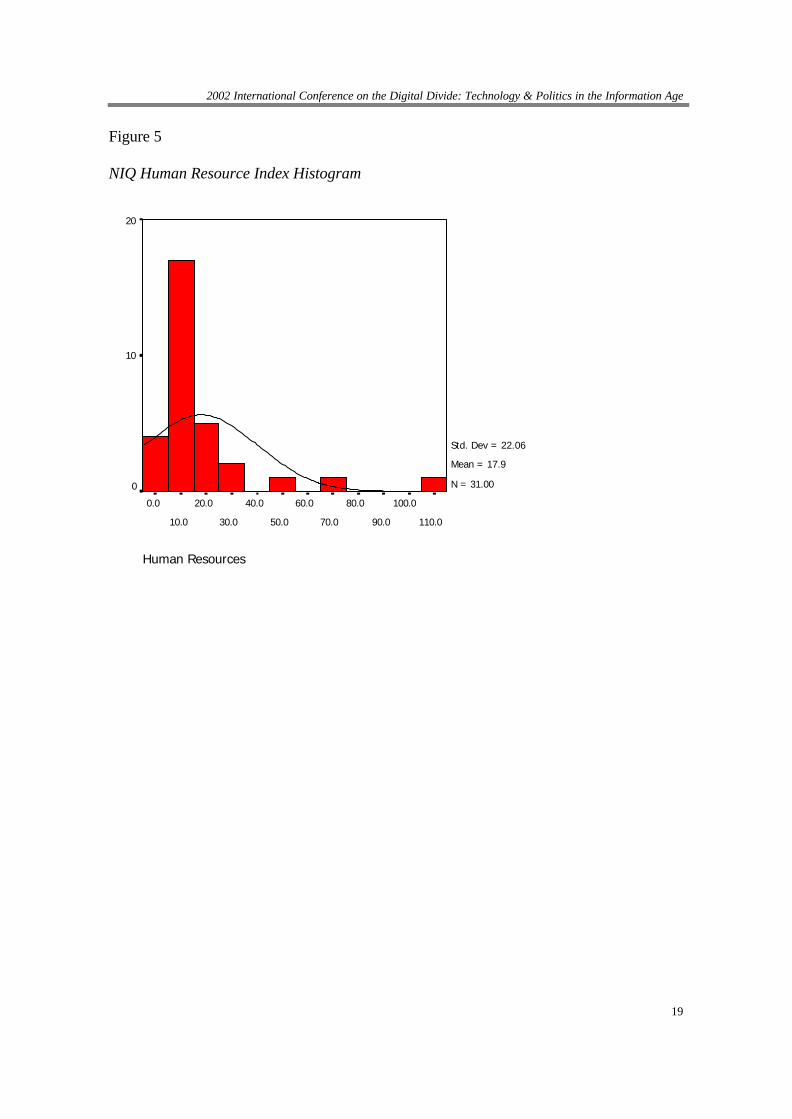
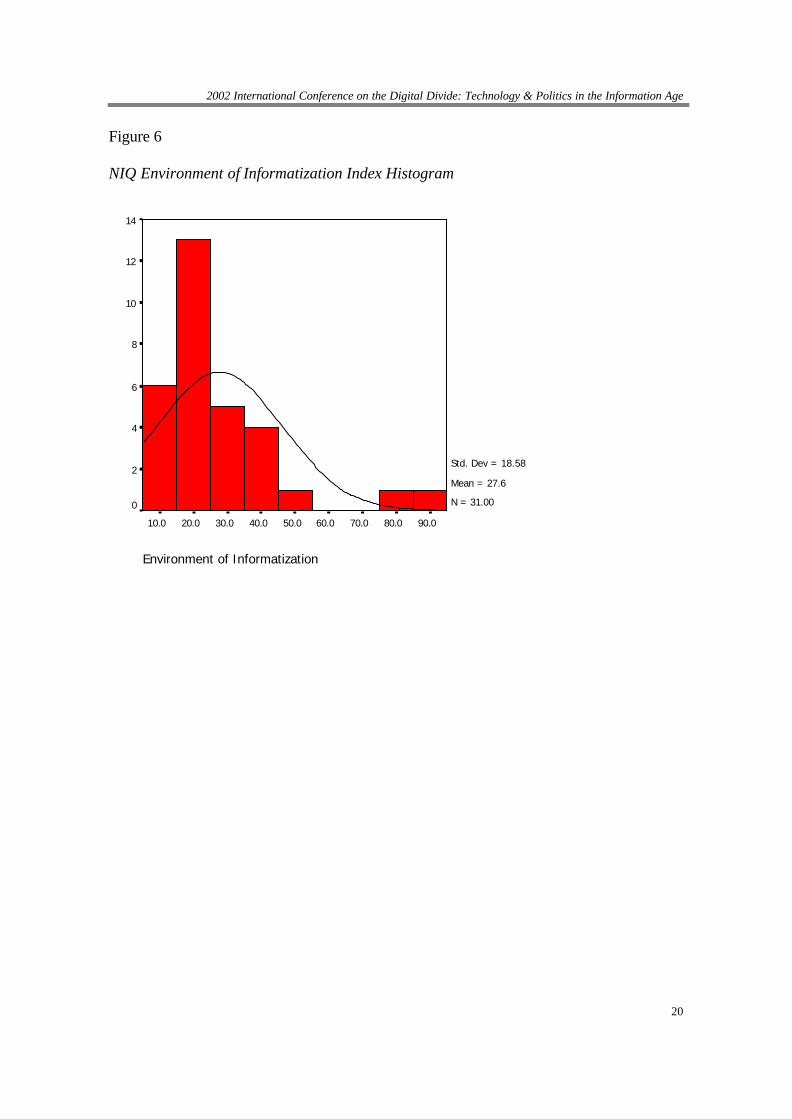
Since NIQ index is a composite index composed of six dimensions, it is revealing to investigate the S.D/Mean in the case of different dimensions respectively. As displayed in Table 2, the dispersion scores of six constitutive dimensions are greatly different. Human Resource dimension accounts to be the most divided one among six dimensions with S.D/Mean value of 1.2325. In other words, the Human Resource development of ICTs across the nation is most uneven. Information Network is the second most divided dimension with S.D/Mean value of 0.9632. Come up next is the Informatization Environment dimension whose S.D/Mean value is 0.6730. The remaining three dimensions—Information Resource, Information Technology and Information Industry— have S.D/Mean values around 0.5. According to our criterion, the digital divide in terms of Information Technology and Information Industry is not significant while in terms of other dimensions of NIQ issignificant.
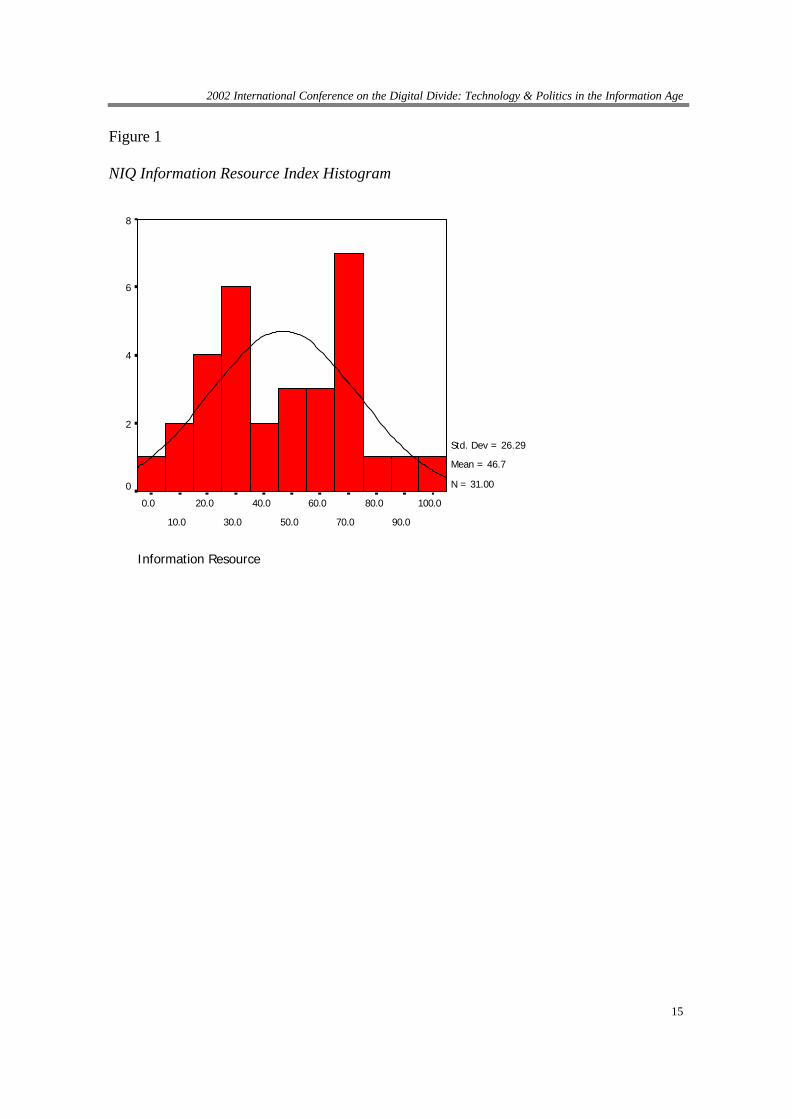
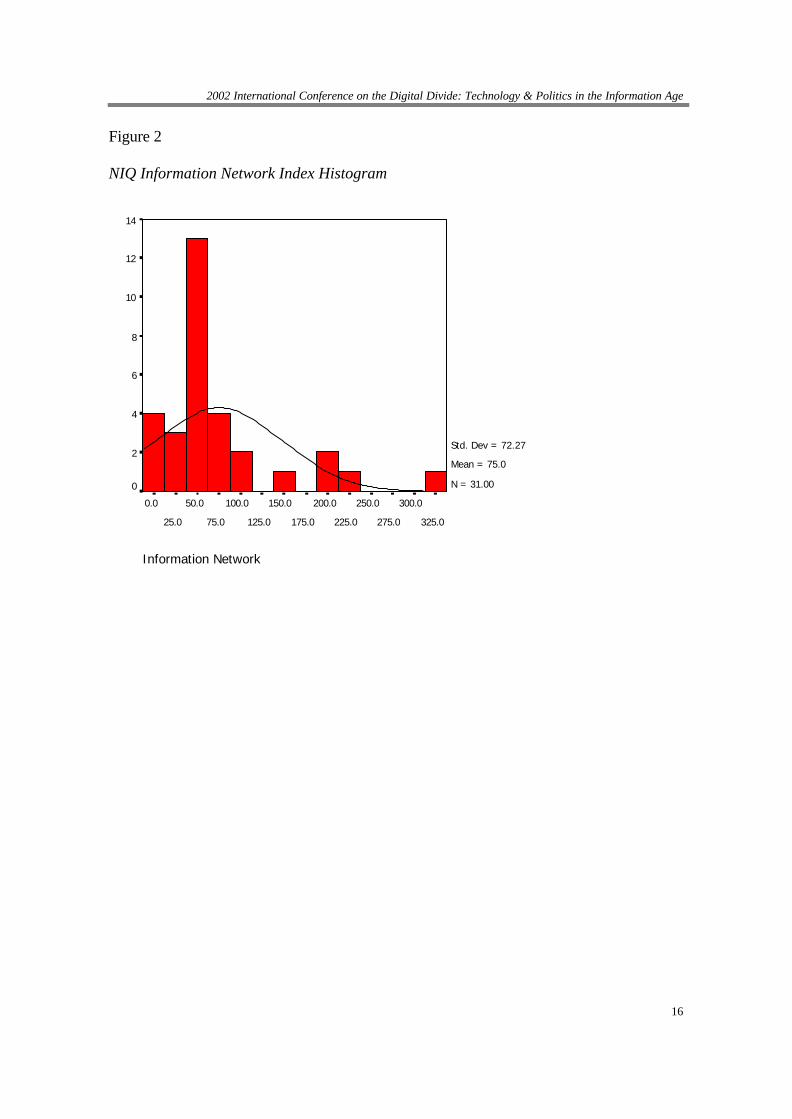
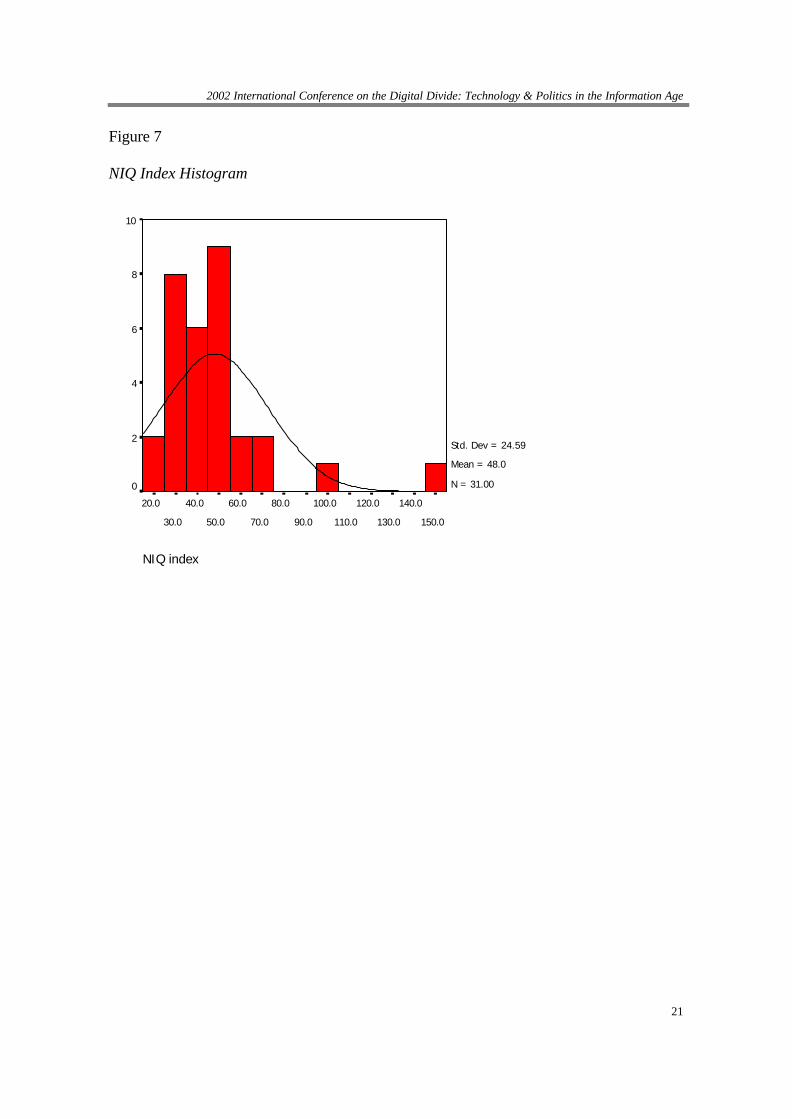
The digital divide situation in terms of each dimension can be visually demonstrated as Figure 1 to Figure 6.
Figure 1 to Figure 6 about here
From the figures, it is clear that the frequency distributions of different value intervals for Information Resource (Figure 1), Information Network (Figure 2), Human Resource (Figure 5) and Informatization Environment (Figure 6) across provinces are severely disparate, sharply bipolarized among provinces. On the other hand, the frequency distributions of different value intervals for Information Technology (Figure 3) and Information Industry (Figure 4) are much less dispersed. A vague central tendency can be found in these two figures. In general, however, the frequency distribution for NIQ index (Figure 7) is quite dispersed indicating so-called digital divide.
Figure 7 about here
10
----------------------------
---------------------------
2002 International Conference on the Digital Divide: Technology & Politics in the Information Age
Conclusion and Discussion
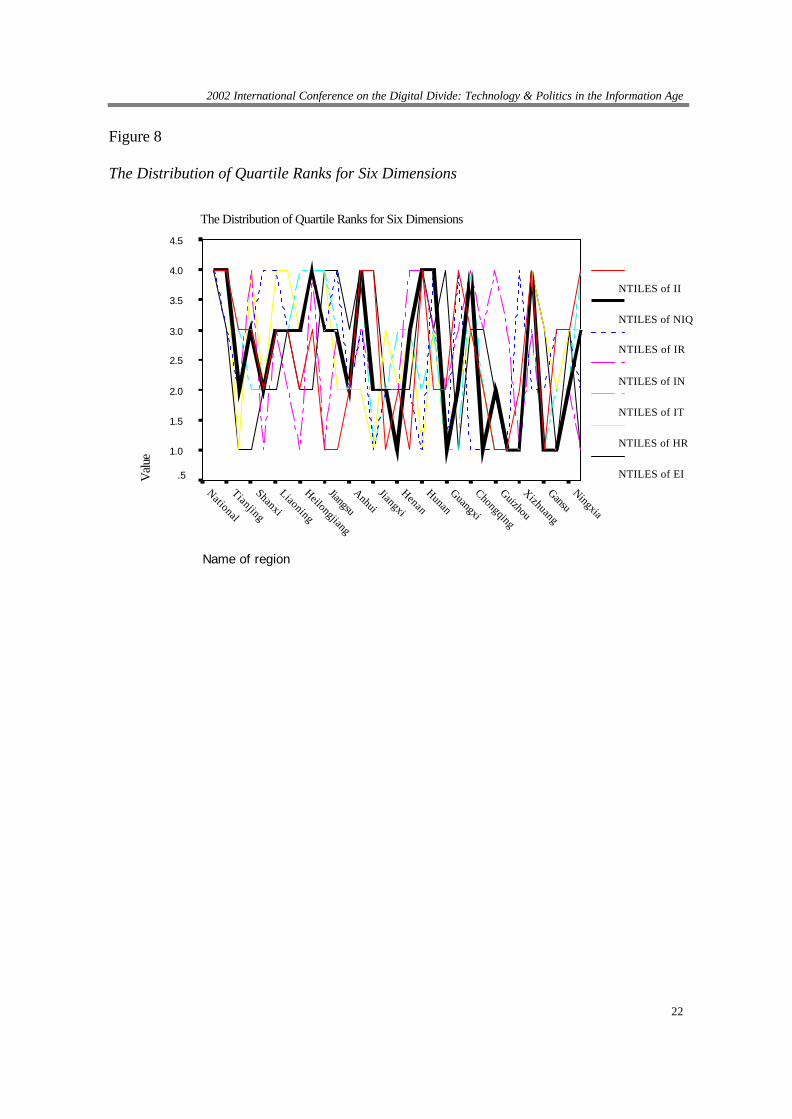
The result of this study shows that, whether there is a digital divide is subject to the definition of the issue. In terms of NIQ, both the tabular and visual results provide descriptive support for the presence of geographical digital divide in China. However, the levels of disparity of ICTs development in terms of different constitutive dimensions depict quite different pictures. Since NIQ index is composed of six conceptually distinctive dimensions, the conclusion of this study demonstrates that the strengths and weakness of different provinces in developing informatization are different. A certain province might be advanced in one dimension of NIQ while be a laggard in other aspects. For instance, if we group the provinces based on quartile set for each dimension, quite a lot of provinces will be in different quartile sets across the dimensions (Figure 8). The NIQ index is a comprehensive reflection of the multiple aspects of informatization level.
Figure 8 about here
Several points are worthy of notice. Firstly, the specification of six dimensions of NIQ is not unquestionable. The fact that the NIQ was launched after eight years of debates has demonstrated the controversies around the structuring of NIQ index. Secondly, the assignment of weight for each dimension, and even each indicator, is a tricky but important question which inevitably affect the eventual value of the index. However, the assignment procedure is intrinsically subjective and biased. Finally, as has been stated, the appropriateness of employing S.D/Mean as the practical instrument in judging the digital divide situation is open for debate and discussion. A more disputable point, of course, is the specification of 0.5 as the “critical value” of S.D/Mean for judging whether a digital divide is present.
In short, NIQ provides a new approach in understanding and measuring the digital divide among different regions. It is constructed with the consideration of cross-national comparison possibility. Therefore, a couple of key indicators in other instruments (such as in IIQ, Arquette, 2001) are also included in NIQ index. This orientation in measuring the digital divide offers a common platform for further comparative studies from a wider horizon. Future research should explore cross-national and longitudinal research strategies.
11
2002 International Conference on the Digital Divide: Technology & Politics in the Information Age
References Arquette, T. J. (2001). Assessing the digital divide: Empirical analysis of a meta-analytic
framework for assessing the current state of information and communication system development. Unpublished draft dated on September 15, 2001, Department of Communication Studies, Northwestern University.
Babbie, E. (1998). The practice of social research (8th Ed.). Belmont, CA: Wadsworth Publishing Company.
Blau, A. (2002). Access isn’t enough. American Libraries, June/July 2002: 50-52 Compaine, B. M. (Ed.) (2001) The digital divide. Facing a crisis or creating a myth?
Cambridge, MA: MIT Press Courtright, C.& Robbin, A. (2001). Deconstructing the digital divide in the United States:
An interpretive policy analytic perspective. Paper prepared for International Association of Media and Communication Research and International Communication Association “Symposium on the Digital Divide”, November 15-17, 2001, Austin, Texas, USA.
Jackel, M. (2001). Inclusion, exclusion and the diversity of interests. Is “digital divide” an adequate perspective? Paper prepared for International Association of Media and Communication Research and International Communication Association “Symposium on the Digital Divide”, November 15-17, 2001, Austin, Texas, USA.
Laugsksch, R. C. (2000) Scientific literacy: A conceptual overview. Science Education, 84(1): 71-94.
Leng, Dexi (Eds.) (2002) Guanzhu zhongguo shuzi honggou (Pay attention to the digital divide in China). Beijing: Science Press.
Nagaraj, N. (2002). The other divides. Businessline, April 24, 2002. National Bureau of Statistics of China (2001). Zhongguo xinxihua shuiping cesuan yu
bijiao yanjiu (A study of computation and comparison of China’s informatization level). In Song Ling (Eds.) Xinxihua Suiping cedu de lilun yu fangfa (The theories and methods of Informatization measurement). Beijing: Economic Science Press, pp. 3-46.
People’s Daily (May 8, 2002). China releases world’s first national IT index. Retrieved from: http://service.china.org.cn/link/wcm/Show_Text?info_id=32193&p_qry=NIQ
Sartori, G. (1984). Guidelines for concept analysis. In G. Sartoni (Ed.), Social science concepts: A systematic analysis . Beverly Hills, CA: Sage. pp. 15-85
Tichenor, P. J., Donohue, G. A., & Olien, C. N. (1970). Mass media and differential growth in knowledge. Public Opinion Quarterly, 34, 158-170.
U.S. Department of Commerce (1995). Falling through the net: A survey of the “havenots” in rural and urban American. Retrieved fromhttp://www.ntia.doc.gov/ntiahome/fallingthru.html
U.S. Department of Commerce (2001). Falling through the net: Toward digital inclusion.Retrieved from http://www.esa.doc.gov/fttn00.pdf
Zhu, J. J. H. (2002). Shuma gou zhishu zhi caozuo dingyi he chubu jianyan (The operational definition of digital divide and its primary test ). In Wu Xinxun (Eds.) Wangluo Chuanbo Yanjiu (Newwork Communication Research), Shantou: Shantou Unviersity Press, pp.202-211.
12
2002 International Conference on the Digital Divide: Technology & Politics in the Information Age
Table 1
The NIQ Index of Each Province in China in 2000
Region Information Resource
Information Network
Information Technology
Information Industry
Human Resource
Environment of Informatization NIQ index
National 45.29 37.12 65.89 53.78 13.43 21.86 38.84 Beijing 93.53 318.82 179.97 112.68 112.15 79.61 149.5 Tianjing 54.24 83.51 127.75 111.27 45.87 23.92 74.18 Hebei 31.72 45.58 85.24 44.5 6.44 7.63 36.58 Shanxi 61.15 101.83 60.99 44.92 19.48 11.95 48.99 Neimeng 73.18 7.65 57.69 44.32 10.91 21.57 34.87 Liaoning 74.12 52.67 84.6 46.44 28.36 21.33 50.82 Jiling 66.11 41.86 81.49 44.49 25.48 24.85 47.03 Heilongjiang 59.13 18.64 105.91 43.79 18.89 23.39 45 Shanghai 99.91 191.86 155.3 45.19 68.91 16.65 96.86 Jiangsu 48.31 37.03 101.57 34.9 21.97 41.91 47.79 Zhejiang 72.43 59.03 86.53 33.49 9.86 34.68 48.43 Anhui 26.02 50.12 65.22 39.25 6.95 24.42 34.85 Fujian 68.78 54.33 106.24 68.35 6.87 90.77 64.28 Jiangxi 22.95 41.92 51.33 68.42 5.48 37.81 36.8 Shandong 29.86 50.1 65.55 25.26 13.36 20.16 33.98 Henan 30.16 42.02 66.23 41.67 6.45 19.74 33.87 Hubei 32.53 108.19 69.6 30.43 11.9 21.97 45.18 Hunan 5.91 204.38 56.32 55.35 5.42 43.64 60.09 Guangdong 73.81 81.89 84.13 44.12 13.71 27.53 53.08 Guangxi 17.02 50.79 52.12 38.89 3.25 36.01 32.31 Hainan 76.97 66.48 51.97 50.3 7.83 7.49 41.85 Chongqing 11.69 217.2 87.81 48.55 11.76 25.87 66.08 Sicuan 21.48 50.87 55.79 34.91 9.1 29.08 33.11 Guizhou 2.16 157.84 40.38 5.62 4.45 21.01 37.94 Yunnan 15.02 59.53 32.9 29.07 3.76 16.54 25.46 Xizhuang 70.43 0.2 1.67 41.18 3.13 6.13 18.68 Shanxi 37.73 69.46 76.24 76.35 19.69 46.61 53.34 Gansu 26.14 16.85 44.38 21.58 11.21 26.75 24.36 Qinghai 45.66 2.25 61.1 49.16 10.44 13.42 29.82 Ningxia 60.27 39.29 65.88 48.53 14.52 23.83 41.18 Xinjiang 40.48 3.93 94.43 87.72 17.32 9.6 41.86
13
2002 International Conference on the Digital Divide: Technology & Politics in the Information Age
Table 2
S.D/Mean Values for Six Dimensions of NIQ
Statistics Information
Resource
Information
Network
Information
Technology
Information
Industry
Human
Resource
Informatization
Environment
NIQ Index
Mean 46.7387 75.0361 76.0106 48.7323 17.9006 27.6087 48.0059
S.D. 26.2906 72.2713 34.8974 23.1029 22.0617 18.5808 24.5915
Range 97.75 318.62 178.30 107.06 109.02 84.64 130.82
Percentiles/25 26.0200 39.2900 55.7900 34.9100 6.4500 16.6500 33.9806
Percentiles/50 45.6600 50.8700 66.2300 44.4900 11.2100 23.8300 41.8562
Percentiles/75 70.4300 83.5100 87.8100 50.3000 19.4800 34.800 53.0821
S.D/Mean 0.5625 0.9632 0.4591 0.4741 1.2325 0.6730 0.5123
14
2002 International Conference on the Digital Divide: Technology & Politics in the Information Age
Figure 1
NIQ Information Resource Index Histogram
8
6
4
2
Std. Dev = 26.29
Mean = 46.7
0 N = 31.00
0.0 20.0 40.0 60.0 80.0 100.0
10.0 30.0 50.0 70.0 90.0
Information Resource
15
2002 International Conference on the Digital Divide: Technology & Politics in the Information Age
Figure 2
NIQ Information Network Index Histogram
300.0250.0200.0150.0100.050.00.0
14
12
10
8
6
4
2
0
Std. Dev = 72.27
Mean = 75.0
N = 31.00
25.0 75.0 125.0 175.0 225.0 275.0 325.0
Information Network
16
2002 International Conference on the Digital Divide: Technology & Politics in the Information Age
Figure 3
NIQ Information Technology Index Histogram
160.0120.080.040.00.0
14
12
10
8
6
4
2
0
Std. Dev = 34.90
Mean = 76.0
N = 31.00
20.0 60.0 100.0 140.0 180.0
Information Technology
17
2002 International Conference on the Digital Divide: Technology & Politics in the Information Age
Figure 4
NIQ Information Industry Index Histogram
110.090.070.050.030.010.0
12
10
8
6
4
2
0
Std. Dev = 23.10
Mean = 48.7
N = 31.00
20.0 40.0 60.0 80.0 100.0
Information Industry
18
2002 International Conference on the Digital Divide: Technology & Politics in the Information Age
Figure 5
NIQ Human Resource Index Histogram
100.080.060.040.020.00.0
20
10
0
Std. Dev = 22.06
Mean = 17.9
N = 31.00
10.0 30.0 50.0 70.0 90.0 110.0
Human Resources
19
2002 International Conference on the Digital Divide: Technology & Politics in the Information Age
Figure 6
NIQ Environment of Informatization Index Histogram
14
12
10
8
6
4
2
0
Std. Dev = 18.58
Mean = 27.6
N = 31.00
10.0 20.0 30.0 40.0 50.0 60.0 70.0 80.0 90.0
Environment of Informatization
20
2002 International Conference on the Digital Divide: Technology & Politics in the Information Age
Figure 7
NIQ Index Histogram
140.0120.0100.080.060.040.020.0
10
8
6
4
2
0
Std. Dev = 24.59
Mean = 48.0
N = 31.00
30.0 50.0 70.0 90.0 110.0 130.0 150.0
NIQ index
21
2002 International Conference on the Digital Divide: Technology & Politics in the Information Age
Figure 8
The Distribution of Quartile Ranks for Six Dimensions
The Distribution of Quartile Ranks for Six Dimensions
Valu
e
4.5
4.0
3.5
3.0
2.5
2.0
1.5
1.0
.5
NTILES of II
NTILES of NIQ
NTILES of IR
NTILES of IN
NTILES of IT
NTILES of HR
NTILES of EI Heilongjiang
Liaoning
Shanxi
Tianjing
National
Chongqing
Guangxi
Hunan
Henan
Jiangxi
Anhui
Jiangsu
Xizhuang
Guizhou
Ningxia
Gansu
Name of region
22