Embed Size (px)
Citation preview
Digital Marketing Live
Digital Marketing Live
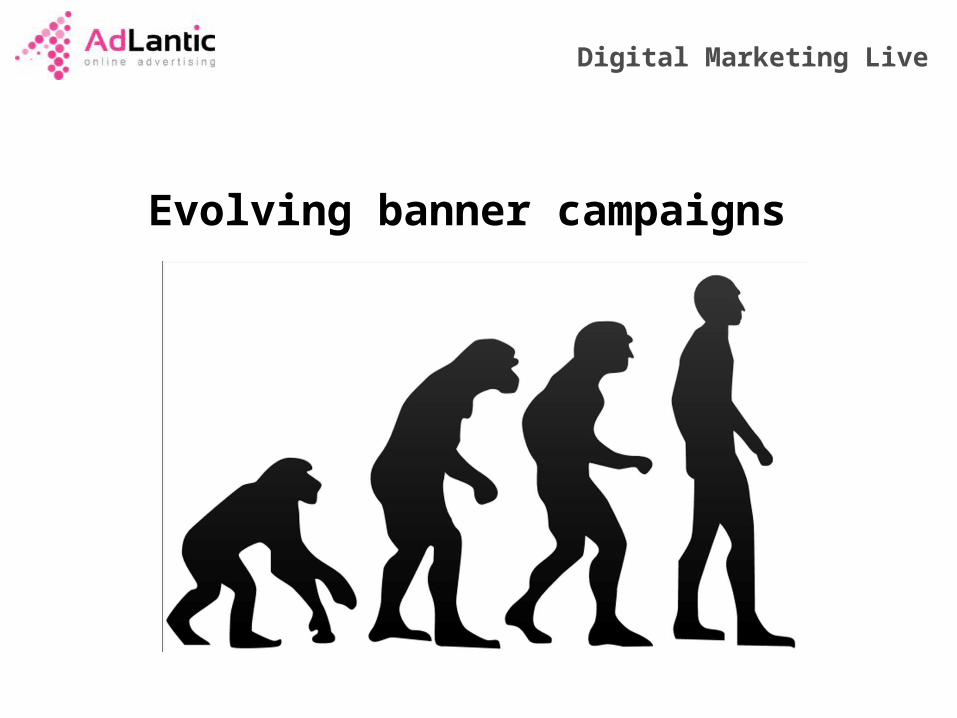
Evolving banner campaigns
• Michèlle TheeuwenKey Account manager
• Youri HarmsenProject manager
An introduction
/michelletheeuwen/youriharmsen
/adlantic
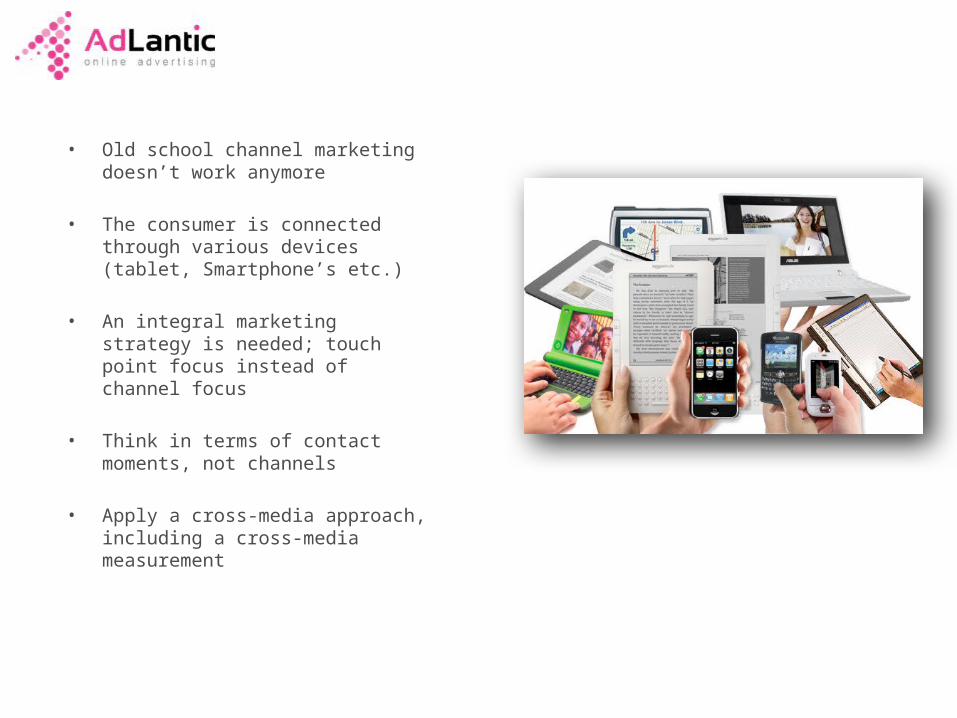
• Old school channel marketing doesn’t work anymore
• The consumer is connected through various devices (tablet, Smartphone’s etc.)
• An integral marketing strategy is needed; touch point focus instead of channel focus
• Think in terms of contact moments, not channels
• Apply a cross-media approach, including a cross-media measurement
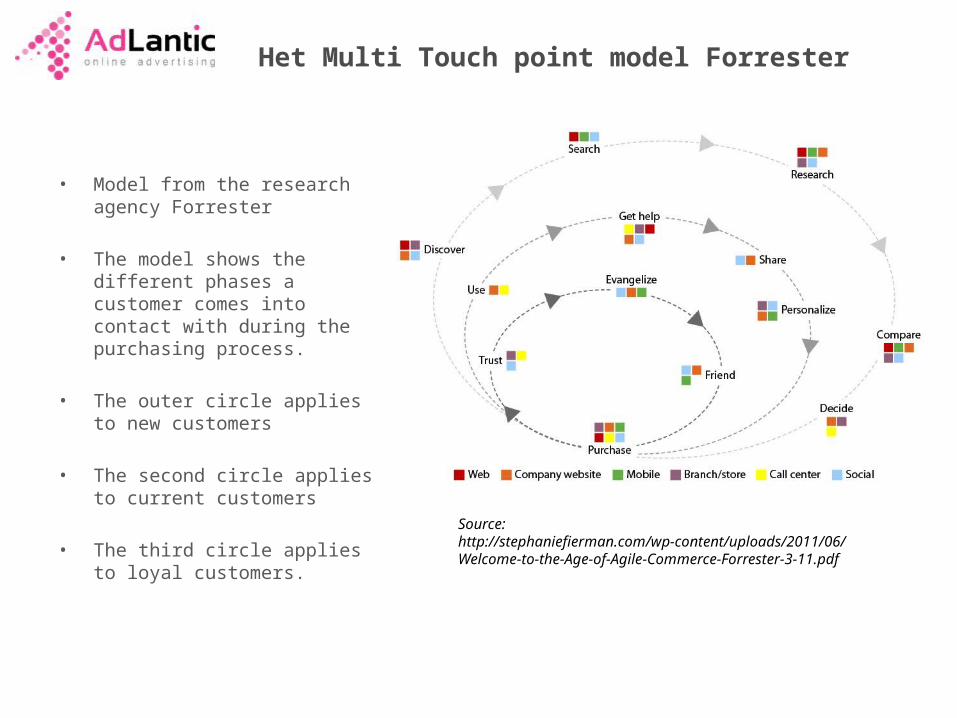
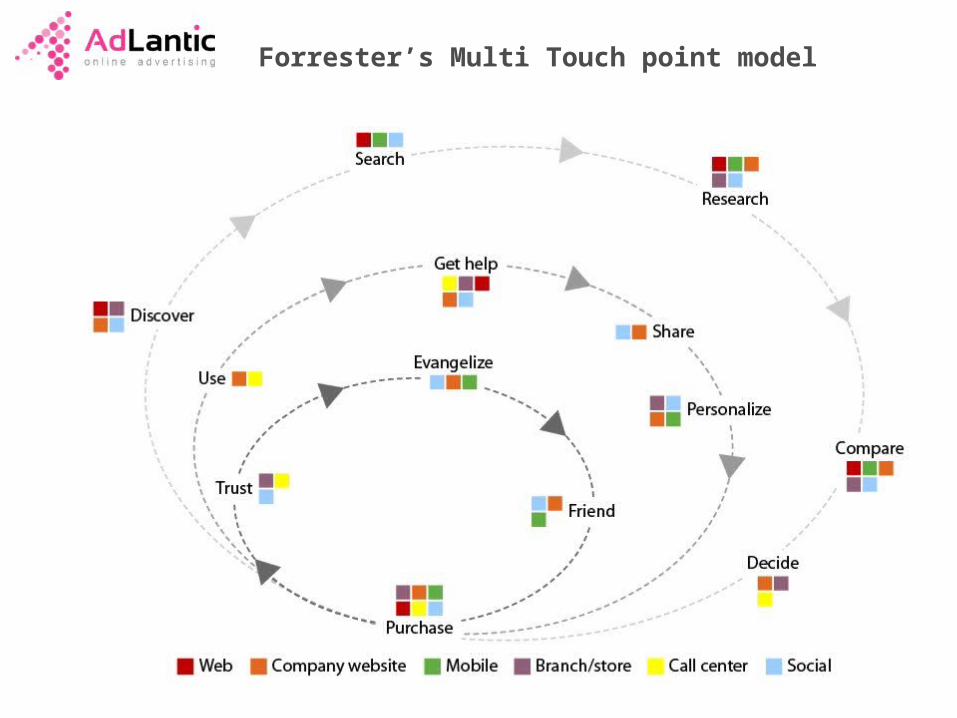
Het Multi Touch point model Forrester
• Model from the research agency Forrester
• The model shows the different phases a customer comes into contact with during the purchasing process.
• The outer circle applies to new customers
• The second circle applies to current customers
• The third circle applies to loyal customers.
Source: http://stephaniefierman.com/wp-content/uploads/2011/06/Welcome-to-the-Age-of-Agile-Commerce-Forrester-3-11.pdf
• Which role does online display play in this model?
• The art is to show the right visitor, the right message at the right moment.
The role of Display
• The problem with the model is that many contact moments can’t be measured (branding), therefore people keep returning to Last-click measurements.
• Branding campaigns have a low conversion ratio, and are therefore not cost-effective.
• As a result, a contact moment as e.g. discover becomes excluded. • Cost-effective campaigns is what remains, so its back to square
one.
• The consequence is that you don’t have any integral marketing strategies anymore, but move towards “silo-marketing”.
The measuring problem
The solution to the measurement problem is three folded:
1) Using conversion attribute models
2) Cross-Media Effect Measuring: The effect of one marketing channel on another marketing channel
3) Multi touch point measuring: Adjust KPI’s according to contact moment; let the banner evolve.
The solution
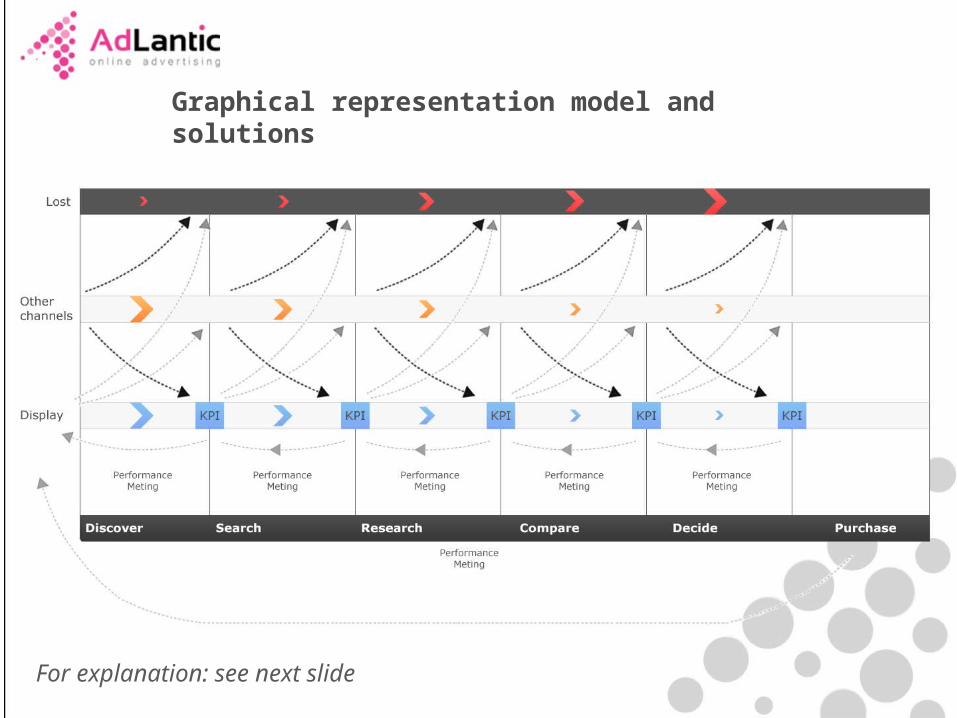
Graphical representation model and solutions
For explanation: see next slide
• Blue line represents the channel display.
• Orange line represents other marketing channels.
• The arrows in the model are the flow of visitors.
• In this way, visitors can from one contact moment to the other, be obtained by a KPI in the display channel.
• Visitors may also move on to other channels and in an arbitrarily other phase yet again come in contact with display.
• Visitors can also be lost. These visitors doesn’t convert at all or converts with a competitor.
Explanation graphical representation model
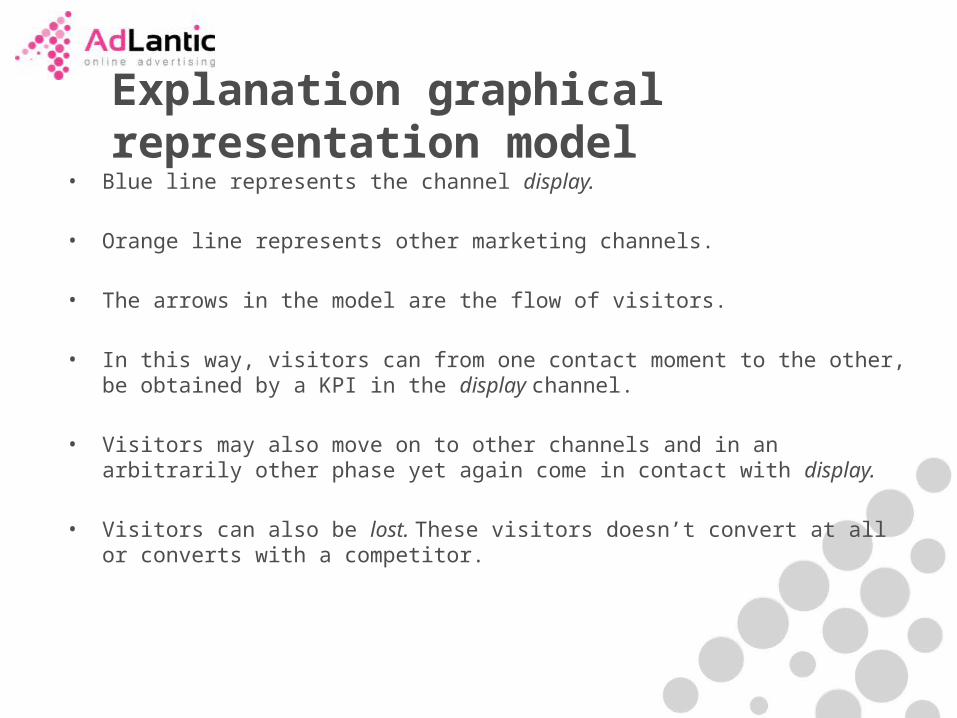
Solution 1: Conversion attribution
• With old-school last click counts the conversion would be completely accounted to social media.
• But you also want insight into which other channels contributed to the conversion.
• In this way your also analyse which the constructive defender and midfielder were.
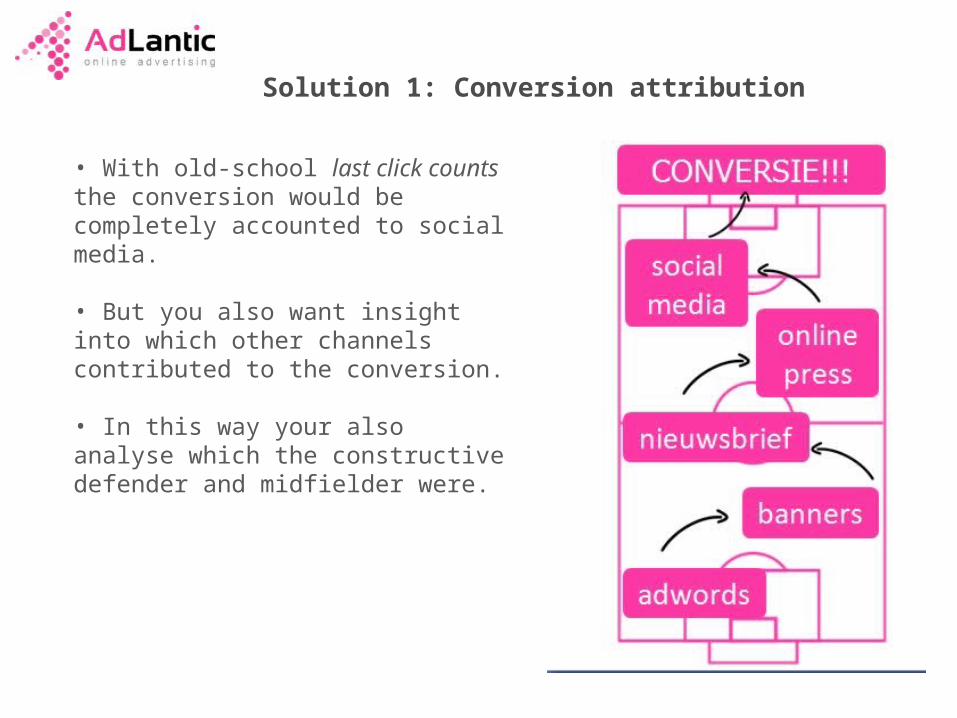
Contact moment per conversion
• This is the conversion path of a customer that booked a trip.
• The first contact moment was via Zoover the 31st of January.
• The last contact moment was via Google.
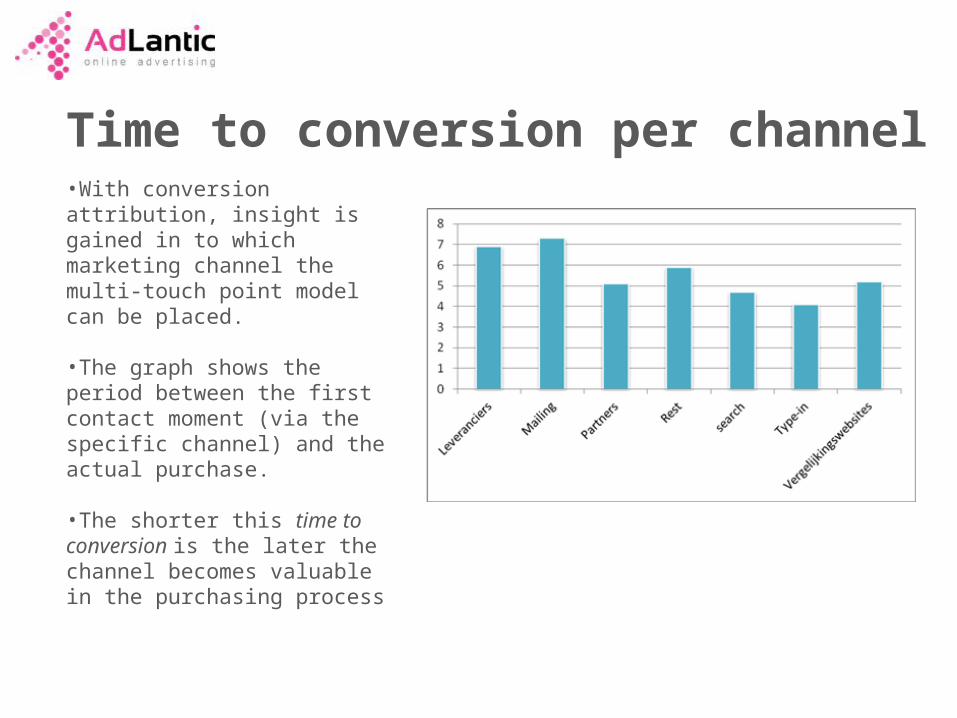
Time to conversion per channel•With conversion attribution, insight is gained in to which marketing channel the multi-touch point model can be placed.
•The graph shows the period between the first contact moment (via the specific channel) and the actual purchase.
•The shorter this time to conversion is the later the channel becomes valuable in the purchasing process
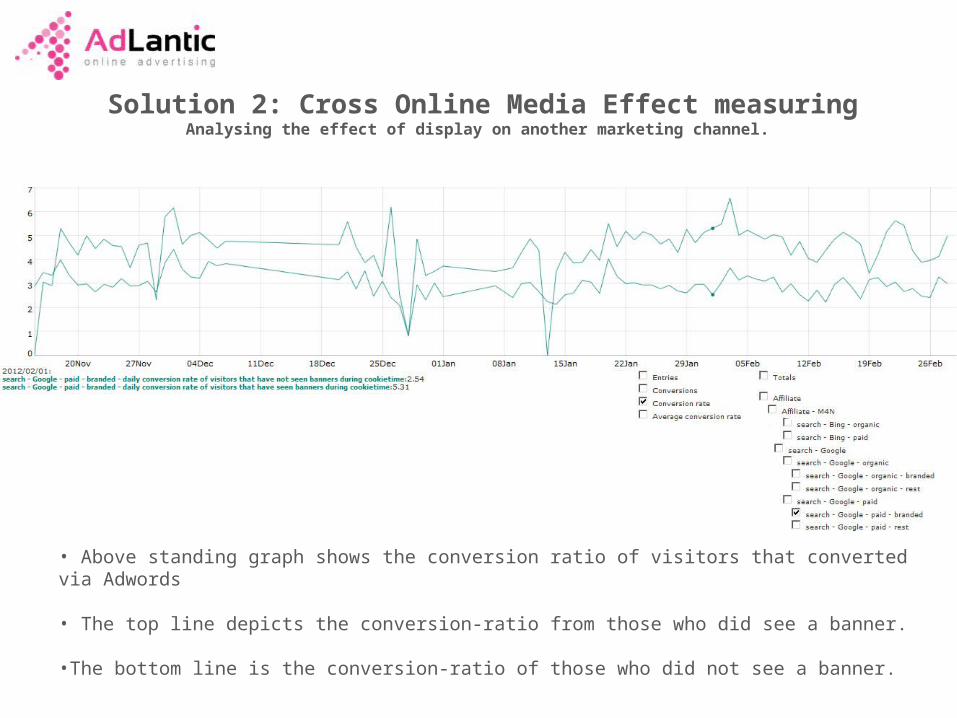
Solution 2: Cross Online Media Effect measuringAnalysing the effect of display on another marketing channel.
• Above standing graph shows the conversion ratio of visitors that converted via Adwords
• The top line depicts the conversion-ratio from those who did see a banner.
•The bottom line is the conversion-ratio of those who did not see a banner.
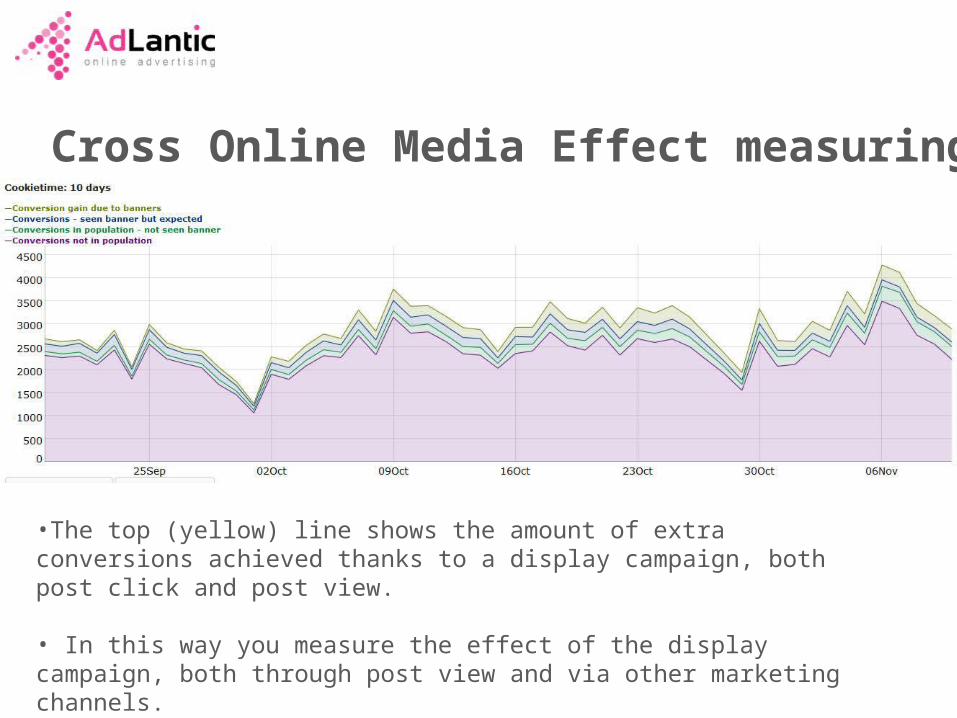
Cross Online Media Effect measuring
•The top (yellow) line shows the amount of extra conversions achieved thanks to a display campaign, both post click and post view.
• In this way you measure the effect of the display campaign, both through post view and via other marketing channels.
• Target group; who do we need to reach?
• Goals; what do you want to achieve?
• KPI; what do you want to measure?
• Creative's; what targets does the display images have to satisfy?
Solution 3: To let the banner evolve
Per contact a strategy based on 4 points:
Forrester’s Multi Touch point model
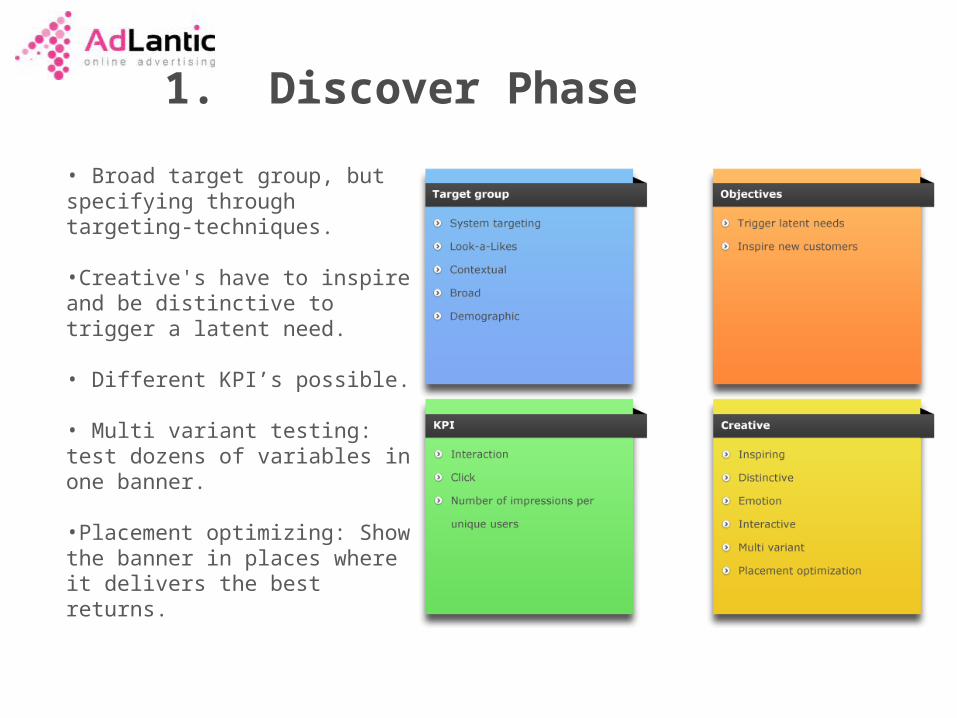
1. Discover Phase
• Broad target group, but specifying through targeting-techniques.
•Creative's have to inspire and be distinctive to trigger a latent need.
• Different KPI’s possible.
• Multi variant testing: test dozens of variables in one banner.
•Placement optimizing: Show the banner in places where it delivers the best returns.
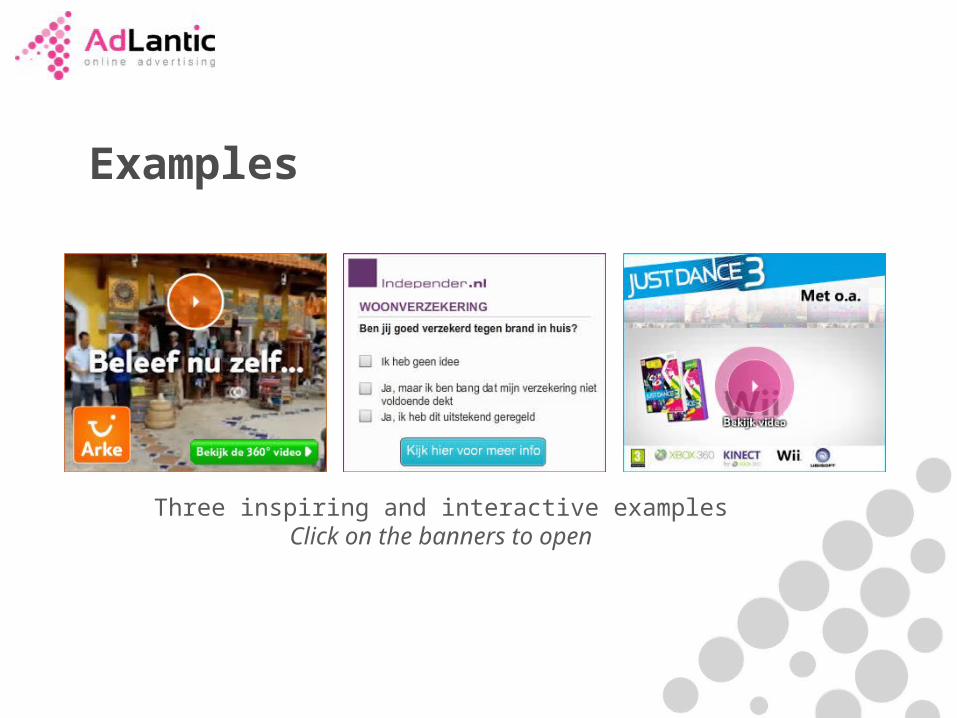
Examples
Three inspiring and interactive examplesClick on the banners to open
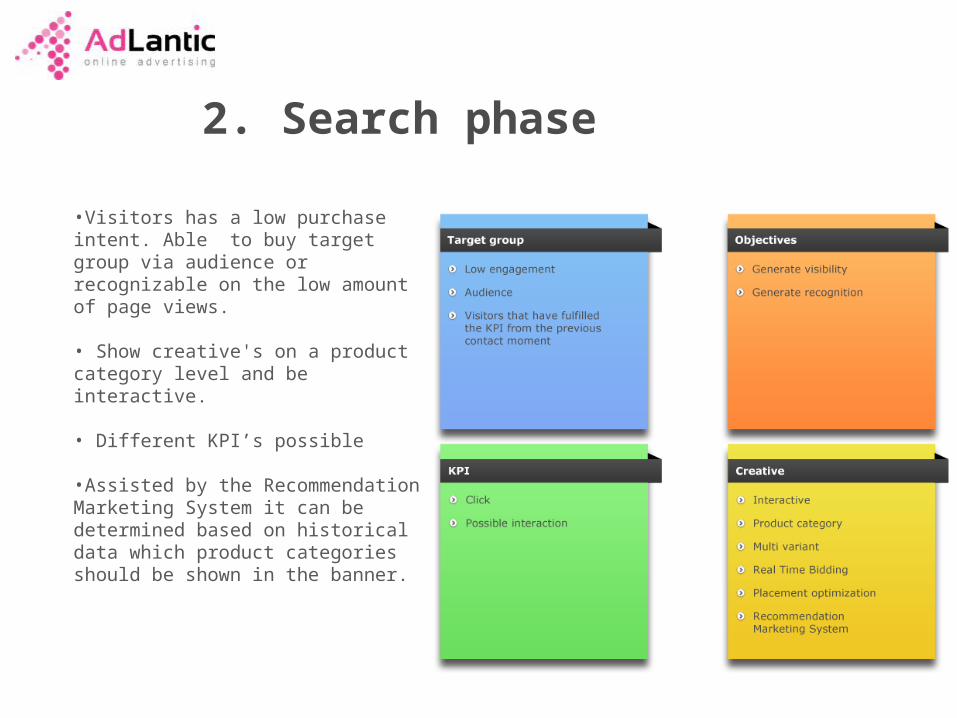
2. Search phase
•Visitors has a low purchase intent. Able to buy target group via audience or recognizable on the low amount of page views.
• Show creative's on a product category level and be interactive.
• Different KPI’s possible
•Assisted by the Recommendation Marketing System it can be determined based on historical data which product categories should be shown in the banner.
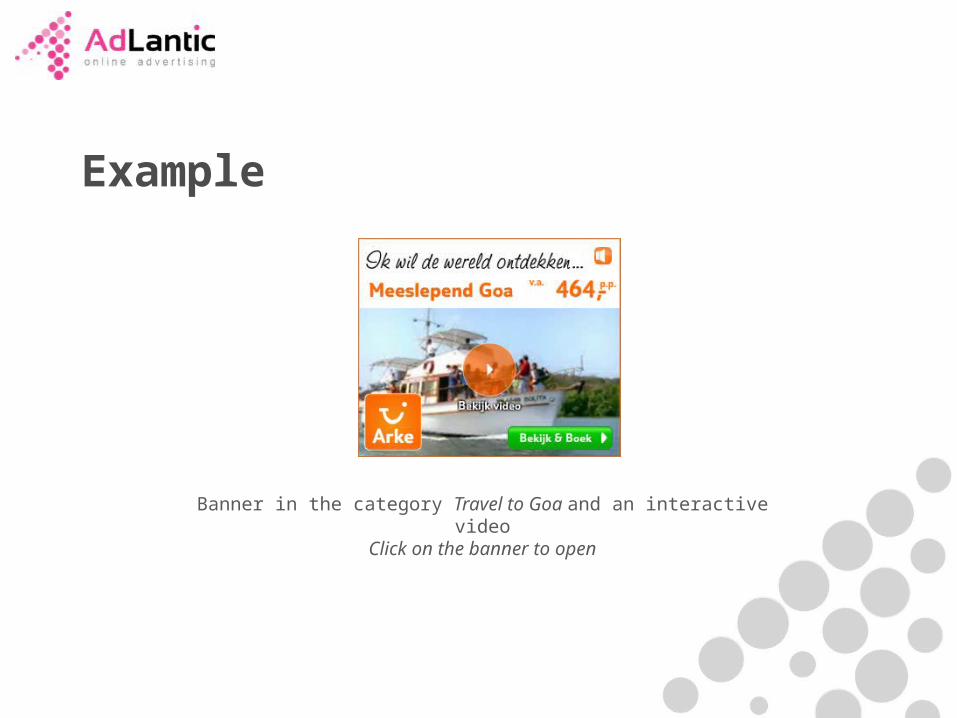
Example
Banner in the category Travel to Goa and an interactive videoClick on the banner to open
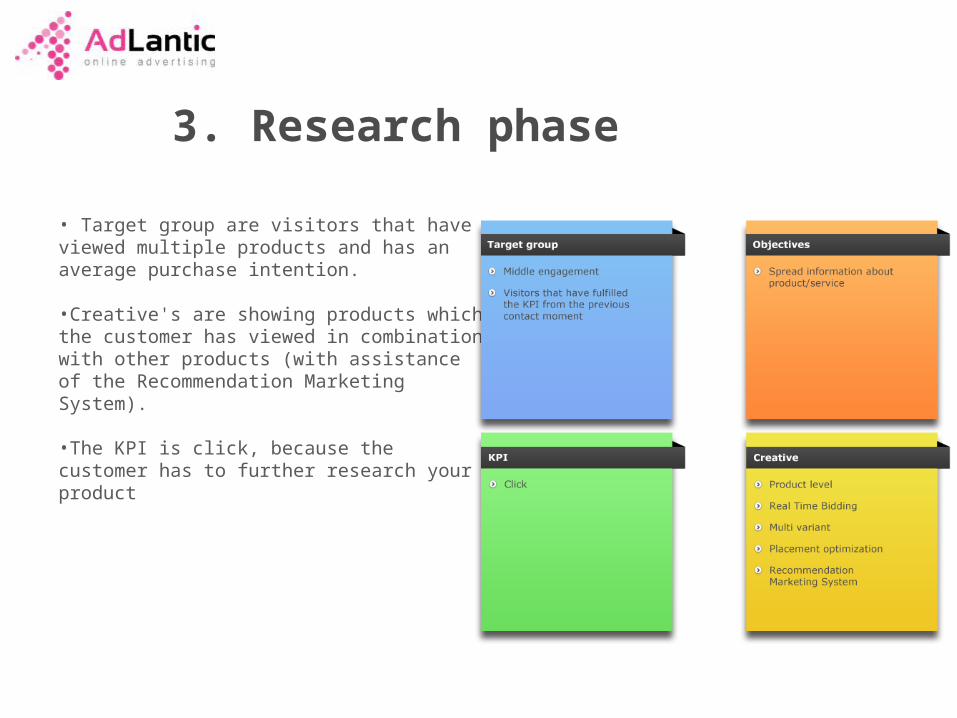
3. Research phase
• Target group are visitors that have viewed multiple products and has an average purchase intention.
•Creative's are showing products which the customer has viewed in combination with other products (with assistance of the Recommendation Marketing System).
•The KPI is click, because the customer has to further research your product
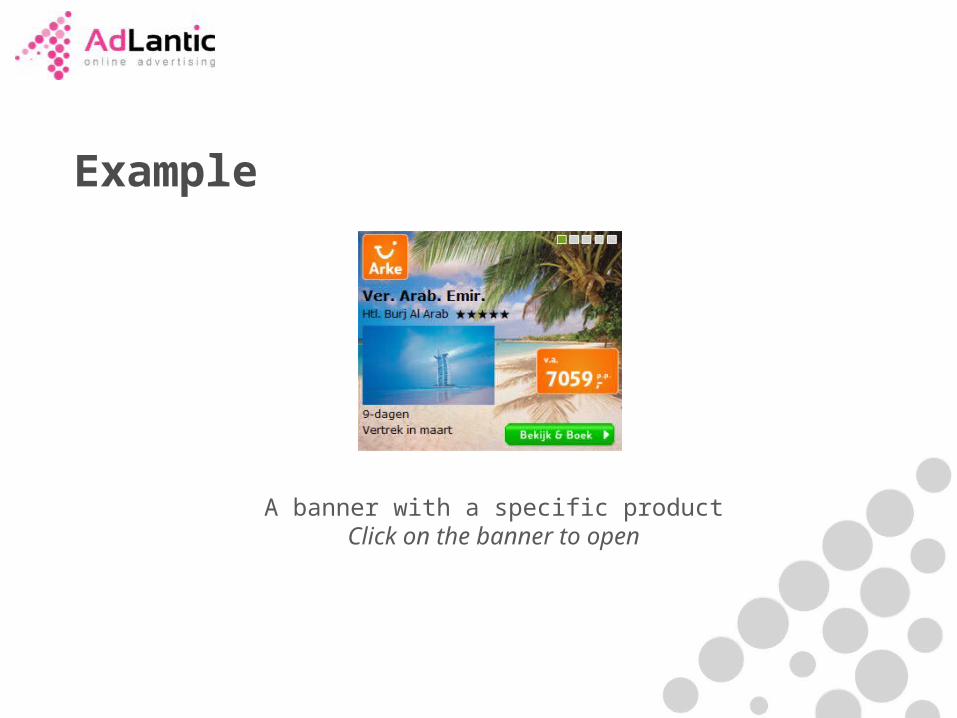
Example
A banner with a specific productClick on the banner to open
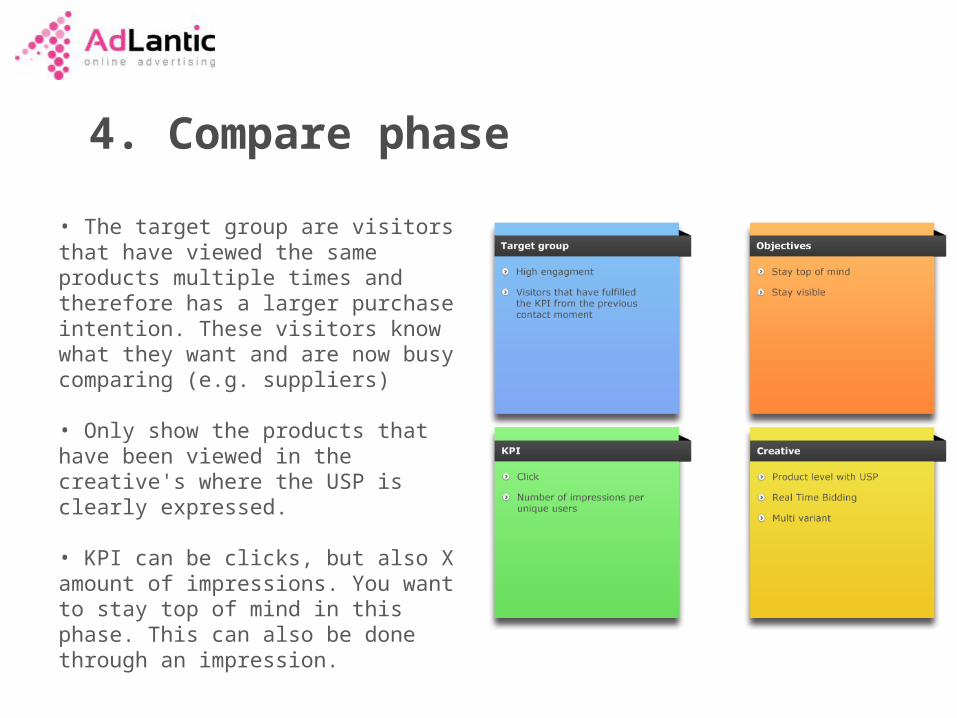
4. Compare phase
• The target group are visitors that have viewed the same products multiple times and therefore has a larger purchase intention. These visitors know what they want and are now busy comparing (e.g. suppliers)
• Only show the products that have been viewed in the creative's where the USP is clearly expressed.
• KPI can be clicks, but also X amount of impressions. You want to stay top of mind in this phase. This can also be done through an impression.
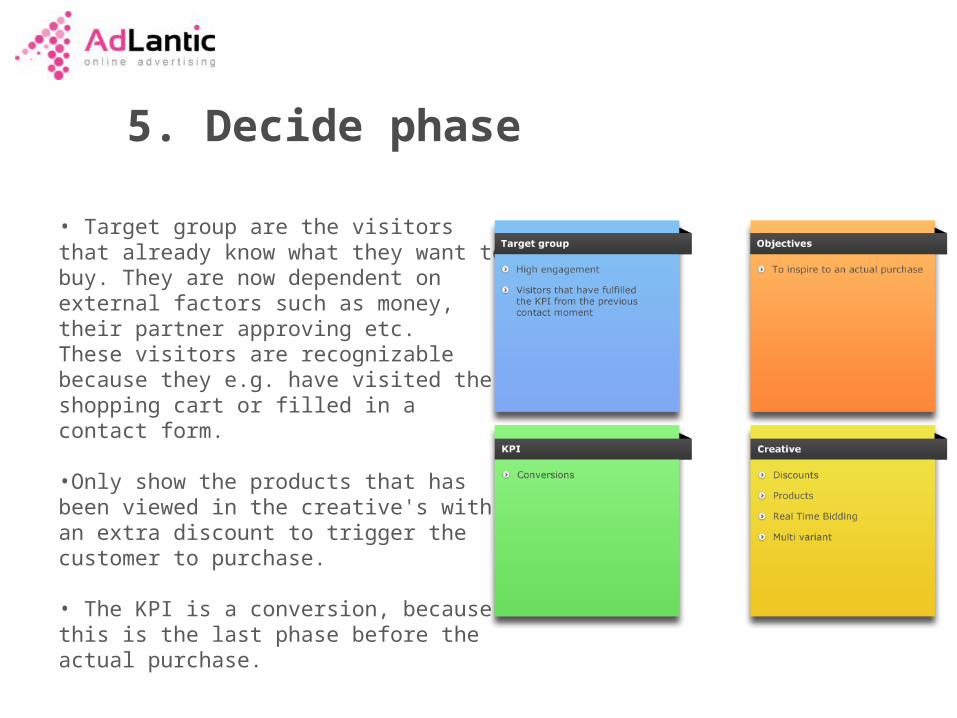
5. Decide phase
• Target group are the visitors that already know what they want to buy. They are now dependent on external factors such as money, their partner approving etc.These visitors are recognizable because they e.g. have visited the shopping cart or filled in a contact form.
•Only show the products that has been viewed in the creative's with an extra discount to trigger the customer to purchase.
• The KPI is a conversion, because this is the last phase before the actual purchase.
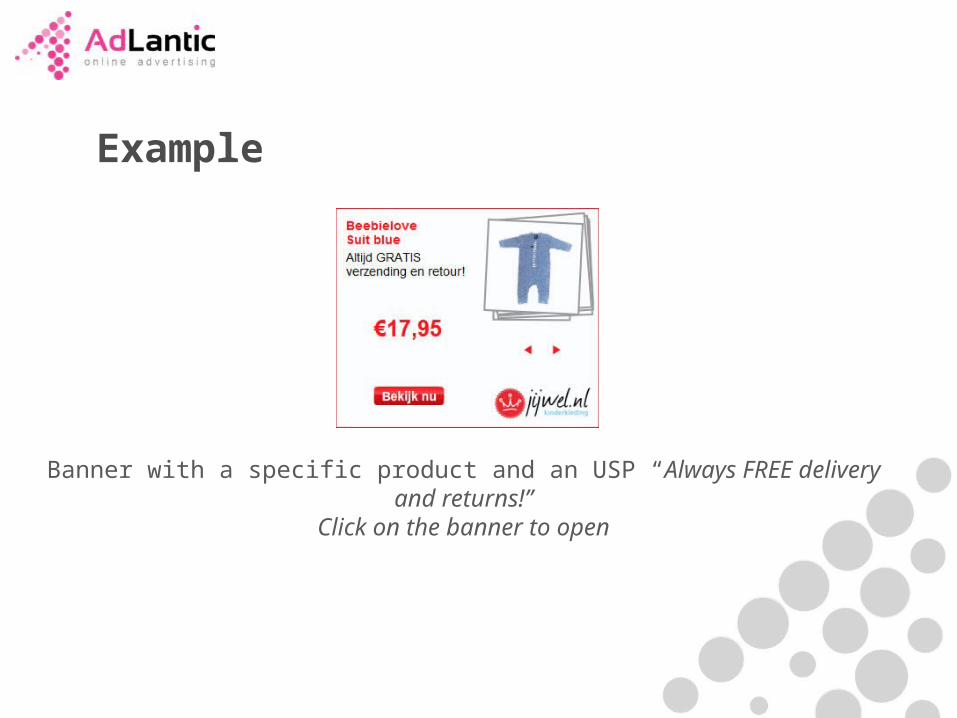
Example
Banner with a specific product and an USP “Always FREE delivery and returns!”
Click on the banner to open
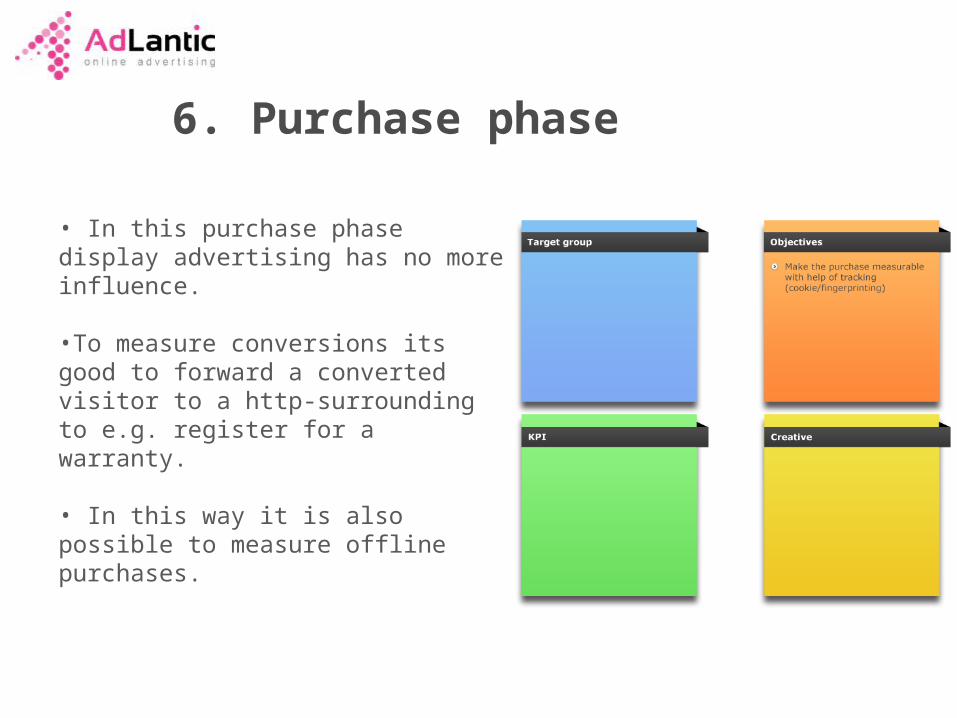
6. Purchase phase
• In this purchase phase display advertising has no more influence.
•To measure conversions its good to forward a converted visitor to a http-surrounding to e.g. register for a warranty.
• In this way it is also possible to measure offline purchases.
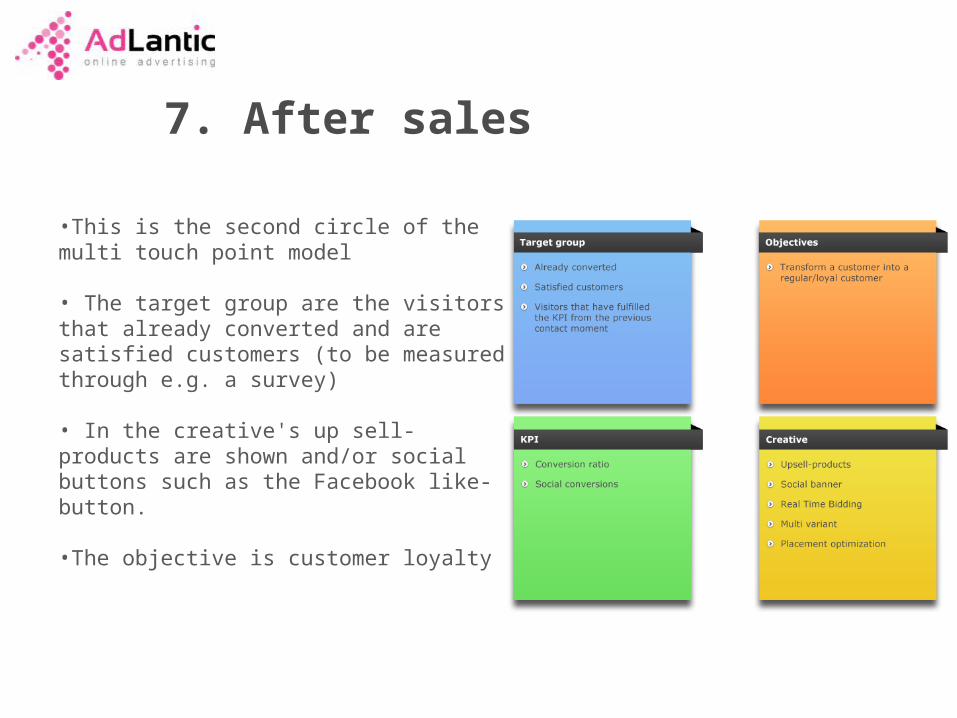
7. After sales
•This is the second circle of the multi touch point model
• The target group are the visitors that already converted and are satisfied customers (to be measured through e.g. a survey)
• In the creative's up sell-products are shown and/or social buttons such as the Facebook like-button.
•The objective is customer loyalty
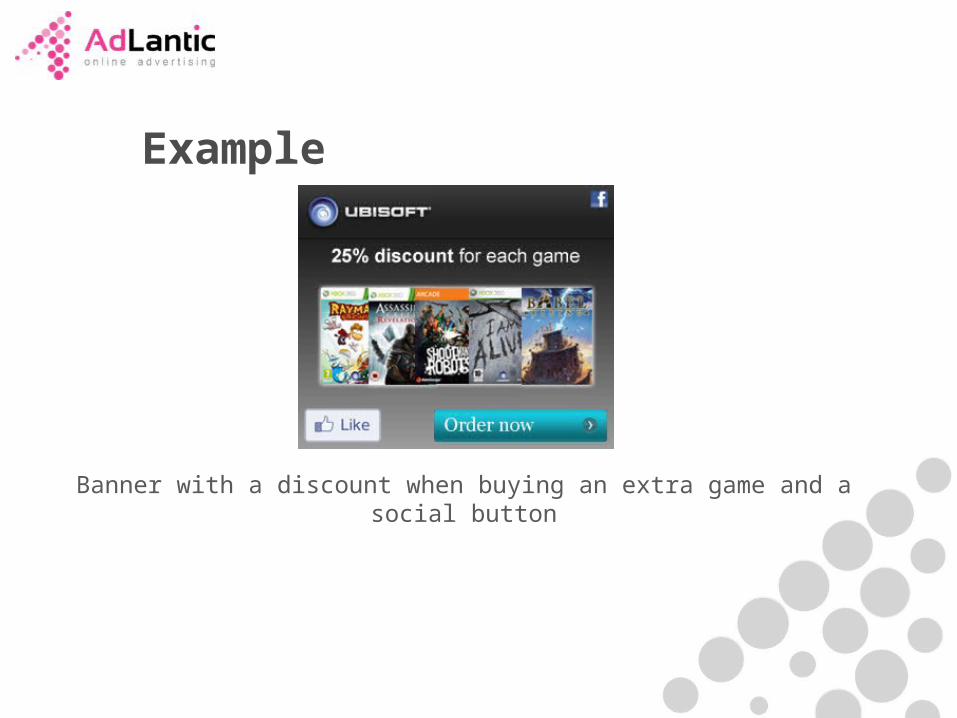
Example
Banner with a discount when buying an extra game and a social button
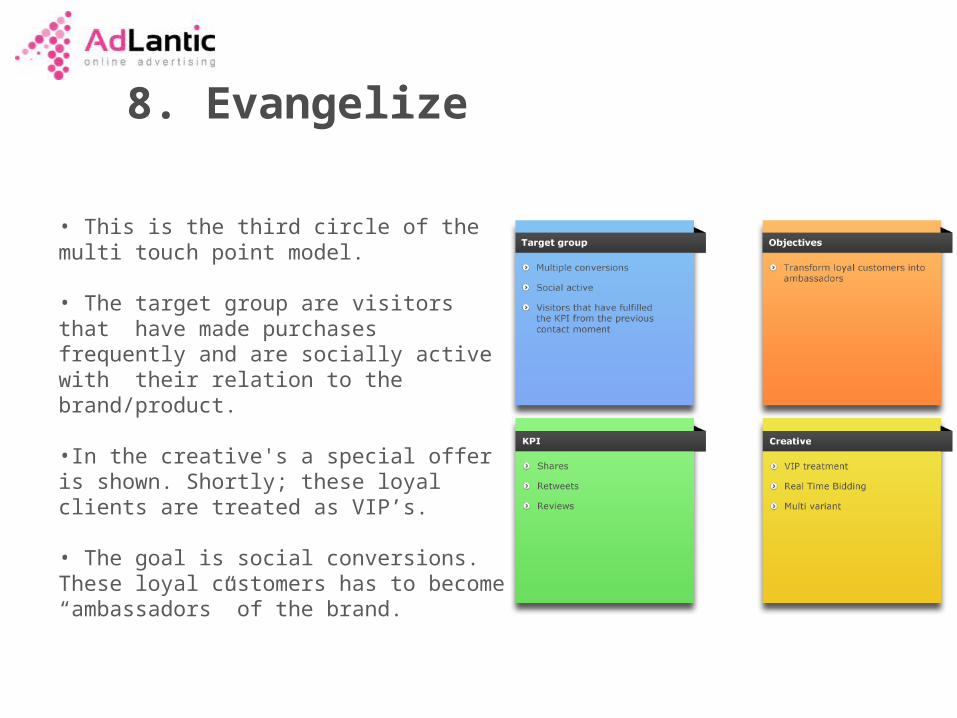
8. Evangelize
• This is the third circle of the multi touch point model.
• The target group are visitors that have made purchases frequently and are socially active with their relation to the brand/product.
•In the creative's a special offer is shown. Shortly; these loyal clients are treated as VIP’s.
• The goal is social conversions. These loyal customers has to become “ambassadors” of the brand.
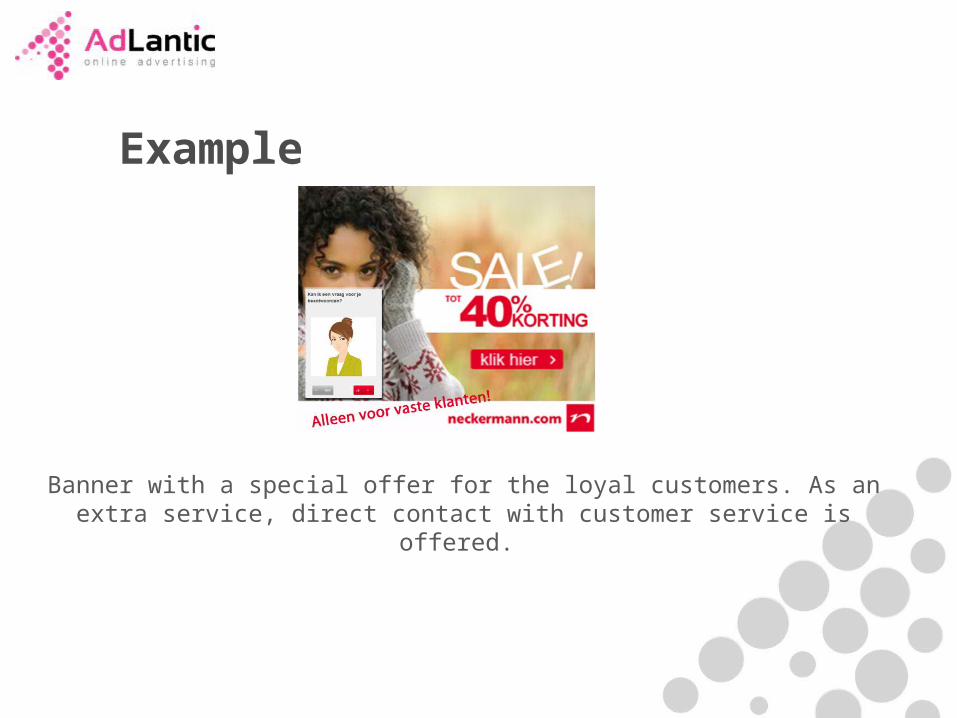
Example
Banner with a special offer for the loyal customers. As an extra service, direct contact with customer service is offered.
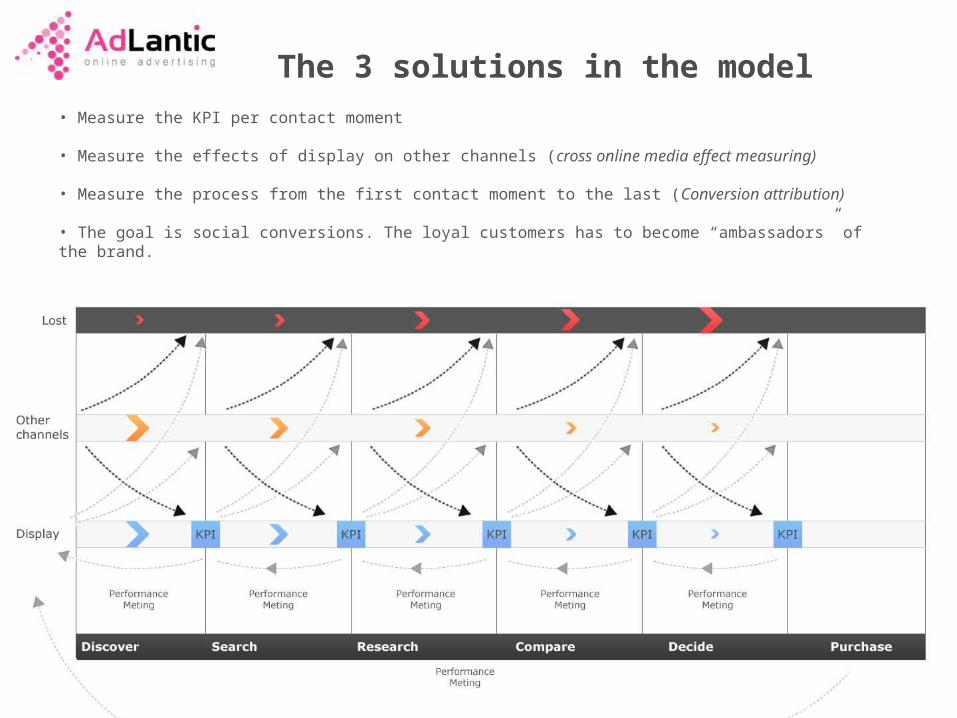
The 3 solutions in the model• Measure the KPI per contact moment
• Measure the effects of display on other channels (cross online media effect measuring)
• Measure the process from the first contact moment to the last (Conversion attribution)
• The goal is social conversions. The loyal customers has to become “ambassadors” of the brand.
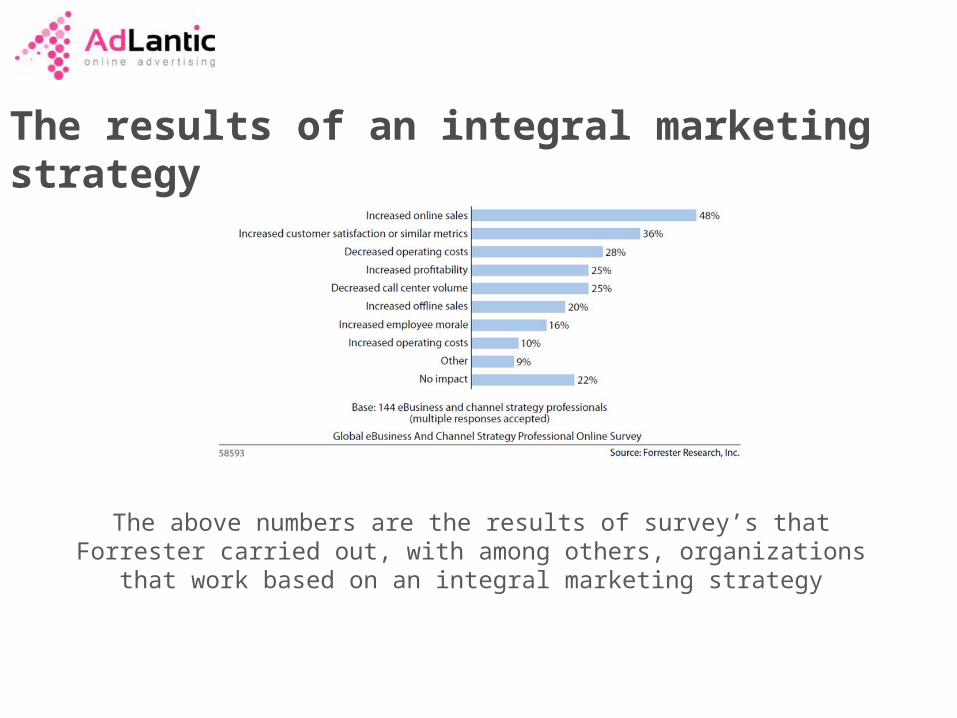
The results of an integral marketing strategy
The above numbers are the results of survey’s that Forrester carried out, with among others, organizations that work based on an integral
marketing strategy
Thank you for your attention!