Embed Size (px)
Citation preview

InternationalTelecommunicationUnion
Digital Radio in Thailand
DR market dynamics and overview of ITU work
Peter Walop
12 December 2017

Agenda
Topics
1. Radio market dynamics2. ITU/NBTC joint DR projects3. Key lessons learned
2

3
1. Radio market dynamics
• Radio is not TV• Digital Radio is efficient• FM and DR markets are correlated • Digital Radio is not only IP
4
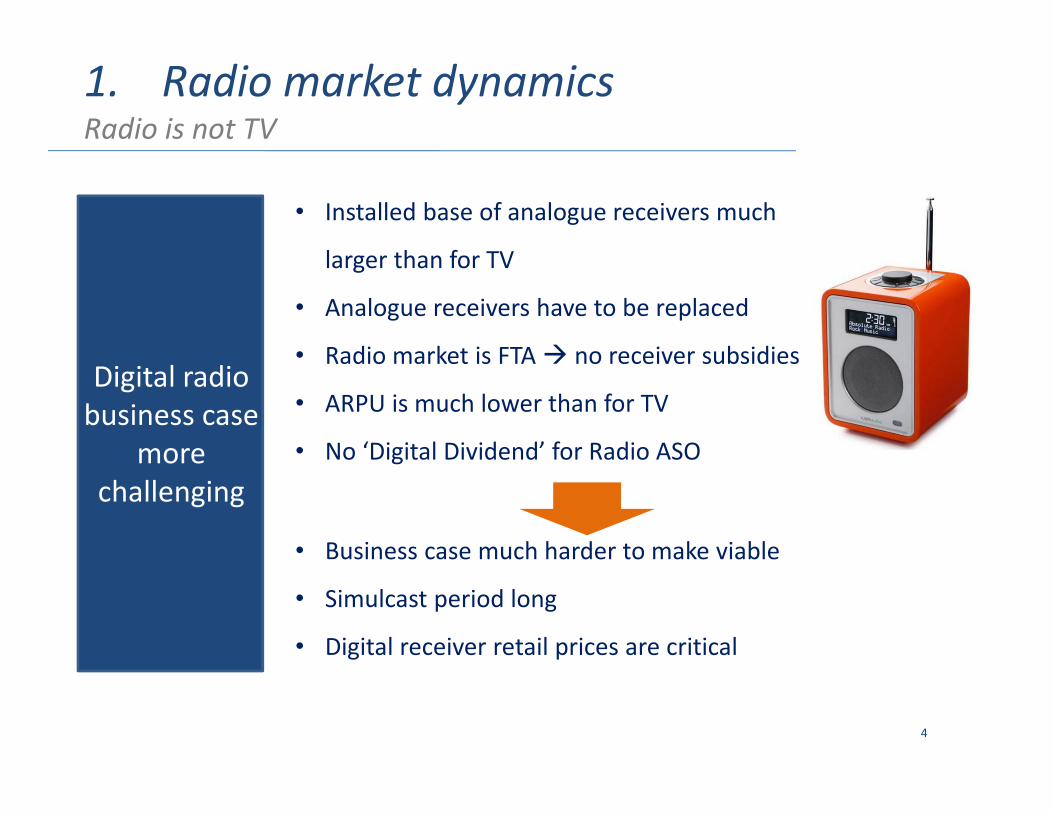
• Installed base of analogue receivers much
larger than for TV
• Analogue receivers have to be replaced
• Radio market is FTA no receiver subsidies
• ARPU is much lower than for TV
• No ‘Digital Dividend’ for Radio ASO
Digital radio business case
more challenging
• Business case much harder to make viable
• Simulcast period long
• Digital receiver retail prices are critical
1. Radio market dynamicsRadio is not TV

5
DAB DAB
FM(Main sites)
Nation‐wide DAB only
after TV ASO (in VHF band)
1. Radio market dynamicsDigital Radio is efficient (1/2)

6
1. Radio market dynamicsDigital Radio is efficient (2/2)
Audio delivered via
DAB+
Additional features,
interactivity and content delivered via
IP
logos delivered via broadcast
or IP
Programme information delivered via broadcast or IP
DLS and SLS delivered in DAB+ service PAD inc URLs
DLS and SLS delivered in DAB+ service PAD inc URLs
Slides and text delivered in
DAB+ broadcast (PAD) inc URLs
Slides and text delivered in
DAB+ broadcast (PAD) inc URLs

7
• Congestion is Severe or High mainly in central, north and east
• Due to the high number of local FM stations (~ 5,500)
• Without local FM, the 313 main FM stations are interference free
Thai FM Band
(87.0 to 108.0 MHz)
Congested
1. Radio market dynamicsFM and DR markets are correlated (1/3)

Thai radio industry under
pressure
8
1
Interference free PI reception Interfered Households
1
• Radio revenues stable (at best) and competition increasing:o Already an extreme high number of FM broadcasters (> 5,500) o Radio streaming services from (foreign) OTT providers
• Broadcasters turning to IP streaming as an alternative to FM:o To get a better reach due to poor FM coverage o To increase the number of serviceso To reach larger audiences without regulatory costs
Portable Indoor (PI) Coverage
1. Radio market dynamicsFM and DR markets are correlated (2/3)

9
1. Radio market dynamicsFM and DR markets are correlated (3/3)
Improved FM
revenues needed to invest in Digital Future

10
• Internet’s listening share is limited compared to (digital) broadcasting platforms, even in Broadband countries
• Building‐up an digital listeners base, can not be done without a broadcasting platform (FM, DAB or both)
Digital Listening Shares – UK (1)
Internet
DAB
(1) ITU ICT Development Index (2016) global ranking: 5
All Listening Shares ‐ Norway (2)
Internet
DAB
FM
(2) ITU ICT Development Index (2016) global ranking: 9
1. Radio market dynamicsDigital Radio is not only IP (1/2)

11
1. Radio market dynamicsDigital Radio is not only IP (2/2)
Digital Listening Shares – Australia

12
2. ITU/NBTC joint DR projects
• Overview of key deliverables• Key deliverables
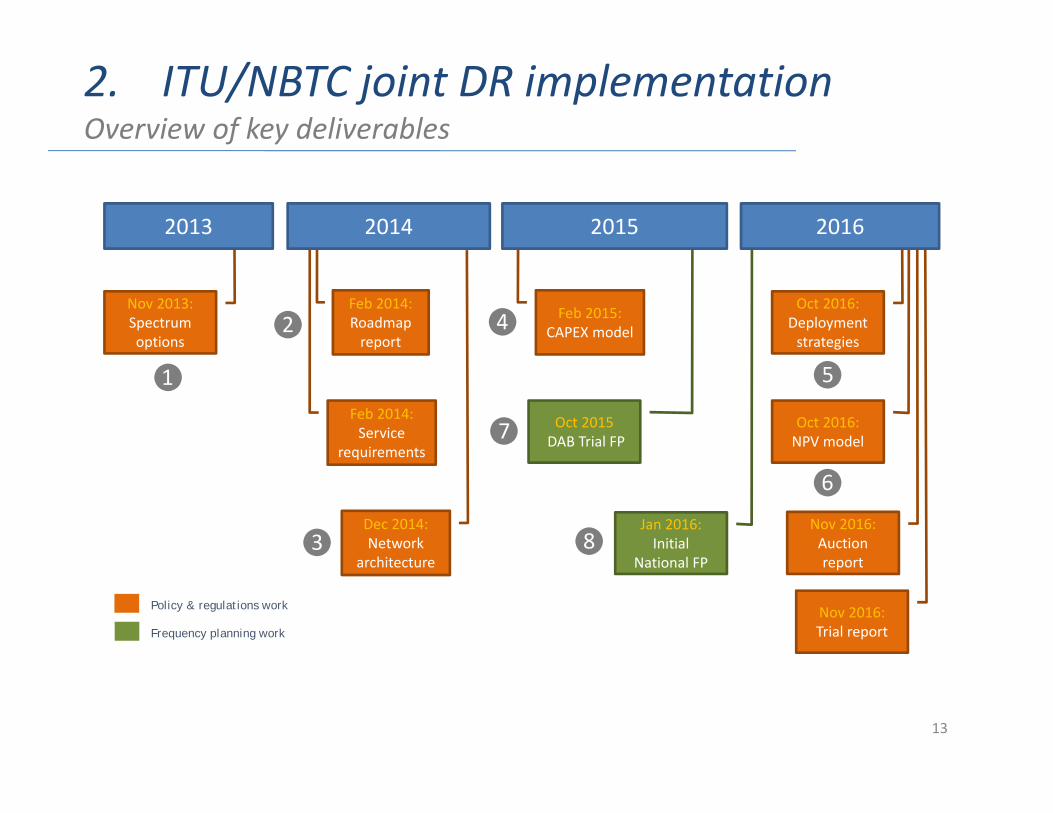
Feb 2014: Service
requirements
13
2. ITU/NBTC joint DR implementationOverview of key deliverables
Feb 2014: Roadmap report
Policy & regulations work
Frequency planning work
❶
❷
❸
❹
❺
❻
❼
Nov 2013: Spectrum options
Feb 2015: CAPEX model
Dec 2014: Network
architecture
2013 2014
Oct 2016: Deployment strategies
Oct 2016: NPV model
Nov 2016: Auction report
Nov 2016: Trial report
Oct 2015DAB Trial FP
Jan 2016:Initial
National FP
2015
❽
2016

14
2. ITU/NBTC joint DR projects❶ Spectrum options
DAB Trial to protectATV
Adjacent channel interference to be avoided
CH 12 not available for DAB in Thailand
15
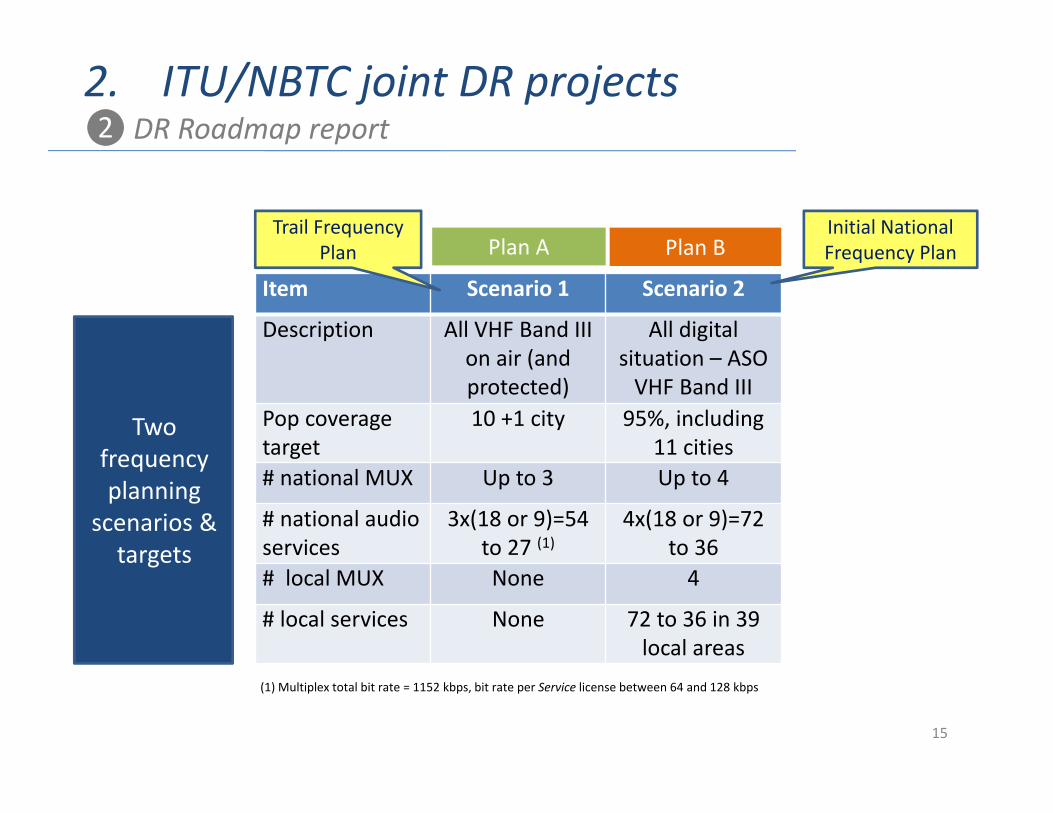
Item Scenario 1 Scenario 2
Description All VHF Band III on air (and protected)
All digital situation – ASO VHF Band III
Pop coverage target
10 +1 city 95%, including 11 cities
# national MUX Up to 3 Up to 4
# national audio services
3x(18 or 9)=54 to 27 (1)
4x(18 or 9)=72 to 36
# local MUX None 4
# local services None 72 to 36 in 39 local areas
Two frequency planning
scenarios & targets
Plan A Plan B
(1) Multiplex total bit rate = 1152 kbps, bit rate per Service license between 64 and 128 kbps
Trail Frequency Plan
Initial National Frequency Plan
2. ITU/NBTC joint DR projects❷DR Roadmap report
16
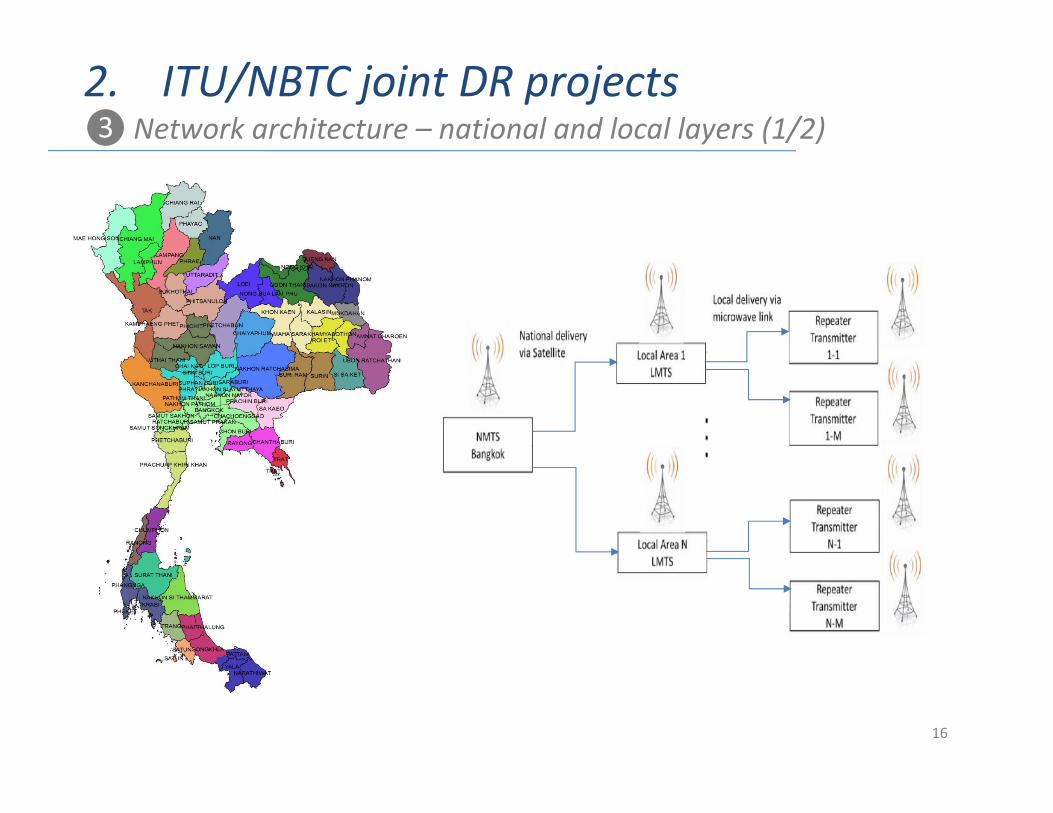
2. ITU/NBTC joint DR projects❸Network architecture – national and local layers (1/2)
17
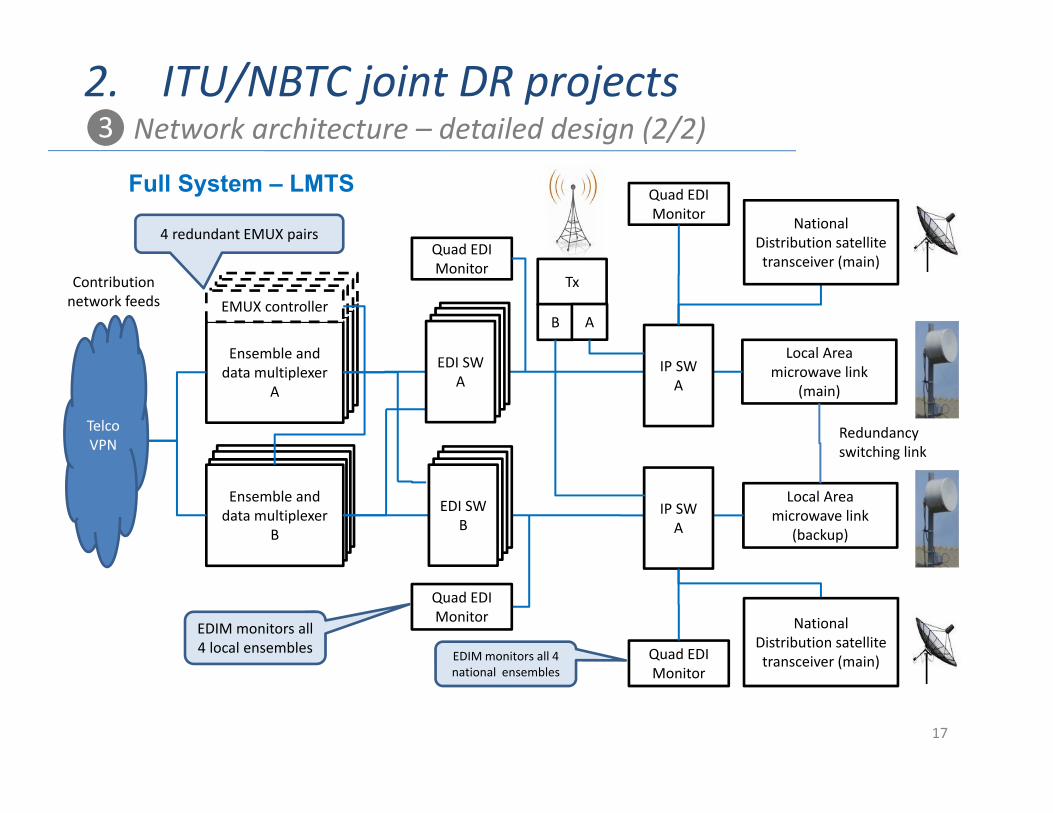
2. ITU/NBTC joint DR projects❸Network architecture – detailed design (2/2)
Full System – LMTS
Ensemble and data multiplexer
(main)
EMUX controller
Ensemble and data multiplexer
(main)
EMUX controller
Ensemble and data multiplexer
(main)
EMUX controller
Ensemble and data multiplexer
(backup)
Ensemble and data multiplexer
(backup)
Ensemble and data multiplexer
(backup)
Contribution network feeds
Ensemble and data multiplexer
A
Ensemble and data multiplexer
B
Quad EDI Monitor
Local Area microwave link
(main)
Local Area microwave link
(backup)
EMUX controller
Redundancy switching link
Telco VPN
Quad EDI Monitor
4 redundant EMUX pairs
EDIM monitors all 4 local ensembles
National Distribution satellite transceiver (main)
National Distribution satellite transceiver (main)
EDI SWEDI SWEDI SWEDI SW A
EDI SWEDI SWEDI SWEDI SW B
IP SW A
Quad EDI Monitor
Quad EDI Monitor
IP SW A
Tx
B A
EDIM monitors all 4 national ensembles

18
2. ITU/NBTC joint DR projects❹ CAPEX model (1/2)
Total
$1,402,000
Price / encoder instance Price / SP
Price / instance Price / IP RS Price / SP Price / SP Price / SP
$6,000 $0 $5,5k ‐ $ 12k $3,000 $3,200 $900 $04 National (large) 4 32 $192,000 4 $0 4 $32,000 8 $24,000 4 $12,800 8 $7,200 4 $028 National (small) 2 112 $672,000 28 $0 28 $154,000 56 $168,000 28 $89,600 56 $50,400 28 $032 144 $864,000 32 $0 32 $186,000 64 $192,000 32 $102,400 64 $57,600 32 $0
pcspcs
Encoders PAD serverInstallation & Comm.
Encoders/PAD
pcs pcs
redundantredundant
pcs
redundant
pcs
CAPEX National studios
Training Encoders/PADIP Router/Switch (VPN)SP controller Installation & Comm. VPN
# SP Service Provider services/mux
pcs# services/SP # mux
4 18
National & Local Studios
Total head‐end National distribution CAPEX Local head‐ends
$18,024,800 $2,743,600
Price / RS Price / mux Price / TXR Price / DishPrice / instance /
mux Price /mux$12,000 $28,500 $15,350 $20,000 $10,000 $2,000 $9,500
38 Local 4 18 76 $912,000 304 $8,664,000 152 $2,333,200 76 $1,520,000 38 $760,000 304 $608,000 304 $2,888,0000 0 $0 0 $0 0 $0
pcs# head‐end pcs# mux
Sub Total
# services/mux
pcs pcs pcs pcs pcs
redundant redundant redundant redundant redundant
IP Router/Switch (VPN)
Ensemble/data MUX National service (+ NMS traffic) satellite
TX/R
EDI Monitor EDI SwitchE MUX controller National service (+ NMS traffic) satellite
Dish
Price / site + $20k
Price/ head‐end
Price / NTP / head‐end
Price / Head‐end
Price / Head‐end
Price / Head‐end
Price / Head‐end Price / NO
$1,000 $3,000 $8,000 $3,600 $17,000 $5,000 $6,000 $0502 $522,000 38 $114,000 76 $608,000 76 $273,600 38 $646,000 38 $190,000 76 $456,000 38 $0
$522,000 38 $114,000 76 $608,000 76 $273,600 38 $646,000 38 $190,000 76 $456,000 38 $0
Training MUX & NMSNMS (per monitored site + installation) ‐
redundant
MSTS & Set of Racks & mounting parts
GPS/NTP server Installation & Commissioning VPN
Installation & Commissioning MUX/controller
Installation & Commissioning
Satellite
No‐break power supply (UPS) ‐ 6 kVA
redundantredundant
pcspcs pcs pcs pcs pcs pcspcs
National & Local Head‐ends
Total Distribution National & Local
$60,705,400
Price / pair Price / RSPrice / Head‐
end Price / UPS Price / Gen Price / site Price / site
# of non main sites $20,000 $3,000 $1,000 $6,000 $35,000 $15,000 $900463 926 $18,520,000 926 $2,778,000 463 $463,000 926 $5,556,000 502 $17,570,000 463 $6,945,000 926 $833,400
926 $18,520,000 926 $2,778,000 463 $463,000 926 $5,556,000 502 $17,570,000 463 $6,945,000 926 $833,400
pcs
MW pair IP Router/Switch (VPN)
Total # sites502
Totals
Installation & Commissioning MW
redundant
pcs
Power Generator ‐ 50 kVA
pcs
Installation & Commissioning VPN
redundant
pcspcs pcs pcs
redundant redundant
racks for VPN & MW UPS ‐ 6 kVA (incl. Installation)
# Greenfields
Price / tower
Price / tower Price / tower
$100,000 $300,000 $40,000201 $0 € 0 201 € 8,040,000
201 0 $0 0 $0 201 $8,040,000
Guy tower & facilities (120m) ‐ ground space 5
rai
pcspcs pcs
SS tower & facilities (60m)
SS tower & facilities (120m)
Distribution

19
2. ITU/NBTC joint DR projects❹ CAPEX model (2/2)
Dashboard
Total Transmission National & Local
$497,776,900
Price / TX Price / TX Price / TX Price / TX Price / grp of sites
# sites tot # mux/site $151,000 $132,000 $80,000 $35,000 7%50 0 8 0 $0 0 $025 0 8 0 $0 0 $010 150 8 1350 $108,000,000 80 $7,560,0005 0 8 0 $0 0 $02 130 8 1170 $40,950,000 16 $2,866,5001 222 8 1998 $69,930,000 8 $4,895,100
0 $0 0 $0 1350 $108,000,000 3168 $110,880,000 $15,321,600
kW ERPkW ERP
6.5 ‐6.0 kW 5.2 ‐ 4.0 kW 2.6 ‐ 2.0 kW 0.7 ‐ 0.5 kW
DAB Transmitters (incl. Cooling, GPS)TX installation & commissioning
Tot ERP / site
redundant redundantredundant redundant
Tot ERP / site
pcs pcsTot ERP / site
pcsTot ERP / siteType of site
Gapfil ler
Totals
kW ERPkW ERP
kW ERPkW ERP
pcs
Price / system Price / system Price / system Price / system Price / system Price / system Price per port
$40,000 $55,000 $140,000 $140,000 $193,000 $193,000 20% 25% $37,5000 $0 0 $0 0 $0 0 $0 0 $0 0 $0 $0 0 $00 $0 0 $0 0 $0 0 $0 0 $0 0 $0 $0 0 $00 $0 0 $0 0 $0 150 $21,000,000 0 $0 0 $0 $4,200,000 1350 $50,625,0000 $0 0 $0 0 $0 0 $0 0 $0 0 $0 $0 0 $00 $0 130 $7,150,000 0 $0 0 $0 0 $0 0 $0 $1,787,500 1170 $43,875,000
222 $8,880,000 0 $0 0 $0 0 $0 0 $0 0 $0 $2,220,000 1998 $74,925,000
222 $8,880,000 130 $7,150,000 0 $0 150 $21,000,000 0 $0 0 $0 $4,200,000 $4,007,500 4518 $169,425,000
Antenna system installation & Commissioning
Antenna system 10 kW total power (side
mount)20
pcspcs
10
Antenna system 200 kW total power (panel)
200
pcs
50
pcs
100
pcs
Antenna system 100 kW total power (panel)
Antenna system 20 kW total power (side
mount)
Antenna system 50 kW total power
(panel)
Price / grp of sites
Antenna system 400 kW total power (panel)
400
pcs pcs
Combiner system (including installation)
/transport stream Price / mux
Price (USD)/NO
Price (USD)/NO
$2,150 $7,750 $10,000 $3,0000 $0 0 $0 40 $400,000 40 $120,0000 $0 0 $0
2400 $5,160,000 1200 $9,300,0000 $0 0 $0
2080 $4,472,000 1040 $8,060,0003552 $7,636,800 1776 $13,764,000
8032 $17,268,800 4016 $31,124,000 40 $400,000 40 $120,000
Training TXTraining Antenna
systemEDI monitor
pcs
TX monitor
pcs pcs pcs
redundant
Frequency Plan Theoretical 95% 61,750,000 CAPEX / Nat. SP CAPEX / Local SPTotal # sites 502 parameter should be "LS Trial" when Trial Studio equipment $43,813 $40,500
Number of National MUX (layer) 4 NATIONAL layer LOCAL layerNumber of Local MUX (layer) 4 parameter should be "0" when Trial CAPEX / MUX CAPEX / MUX / LA
Number of Local areas 39 parameter should be "0" when Trial Head‐end $253,150 $118,496Distribution $8,221,925 $194,569
Number of audio services in national ensemble 18 Transmission $62,222,113 $1,595,439Number of audio services in local ensemble 18 parameter should be "0" when Trial Total $70,697,188 $1,908,504
% greenfield sites 40% parameter should be "0" when Trial Total CAPEX Nat ‐ local $282,788,750 $297,726,55049% 51%
National Local Total CAPEXRedundant encoder yes yes check = ok
Redundant multiplexer yes yes Network CAPEX/per pop covered $1.145 $1.205Redundant distribution yesRedundant transmitter yes
DAB CAPEX Dashboard
Pop coverage
Output
$580,515,300
No Rule Worksheet
1 IF [Encoders] are selected redundant THEN [IP router/switch] AND [Installation] are made redundant
National Studios
Local Studios
2 IF the [MUX] is selected redundant THEN [IP router/switch] AND [EDI monitor] are made redundant
National Head‐end
Local Head‐end
3 IF the [MUX] AND [Distribution] are selected redundant THEN [EDI switch] AND [UPS] are made redundant
National Head‐end
Local Head‐end
4 IF [Distribution] is selected redundant THEN [IP router/switch] AND [UPS] AND [Installation] are made redundant
Distribution
5 IF [Distribution] is selected redundant THEN [EDI monitor] are made redundant
Transmission
Redundancy rules
Transmission

20
Advertising income (ADEX)
Incumbents(e.g. RTA, MCOT, PRD)
Network Operator JVC
Incumbents Pool (Others)
Trial seed funding
Facility licensees
Industry funding
Service licensees
Network licensee
Pay for capacity(regulated network rental fee)
Incumbents Others
Pay for facilities(subcontracted by JVC)
3rd party broadcasters(e.g. GMM, RS, BEC,
ICN)
2. ITU/NBTC joint DR projects❺Deployment strategy (1/2)

21
Option 1: JVC members get “Package” by Invitation + JVC closed
JVC members
MUX 1 MUX 2
JVC members Pool (Others)
e.g. 50% of capacity
Service licensees (SL)
Network licensee (NL)
Option 2: JVC members get “Package” by Invitation + later JVC open to Pool
Option 3: as option 1 or 2 but “Package” assigned by Public Tender
e.g. 50% of capacity + 100% JVC
JVC members + Pool members
MUX 1 MUX 2
JVC members Pool (Others)
e.g. 50% of capacity + 50% JVC
Service licensees (SL)
Network licensee (NL)
e.g. 50% of capacity + 50% JVC
Package
Package
2. ITU/NBTC joint DR projects❺Deployment strategy (2/2)

22
2. ITU/NBTC joint DR projects❻NPV model
$‐
$50,000,000
$100,000,000
$150,000,000
$200,000,000
$250,000,000
$300,000,000
ADEX FM&AM Radio ADEX DAB Radio ADEX Internet Radio
DAB Revenues/ADEX
Ref. # sites
Pop %
# MUX
# SPs Total CAPEX NPV total market
NPV / Nat. SP
NPV / Local SP
N1 200 95% 2+0 18+0 $84,702,880 $190,502,461 $10,583,470 NA
N2 90 80% 2+0 18+0 $37,973,880 $266,538,766 $14,807,709 NA
N3 200 95% 3+0 27+0 $131,831,770 $67,201,171 $2,488,932 NA
N4 90 80% 3+0 27+0 $59,252,770 $204,157,121 $7,561,375 NA
NL1 200 95% 2+1 18+351 $146,869,070 ‐$434,513,538 $6,710,995 ‐$1,149,838
NL2 90 80% 2+1 18+351 $74,290,070 ‐$297,557,588 $11,411,848 ‐$1,000,720
NPV scenarios

23
2. ITU/NBTC joint DR projects❼ Trial DAB FP
Interference analysis DAB>ATV
Interference analysis ATV>DAB

24
2. ITU/NBTC joint DR projects❽ Initial National DAB FP
DAB coverage with 171 DTTB sites
Additional sites to complete
coverage to 95%
# Number of sites
Example network topology
ERP Mean ERP per site
Household coverage
Remaining HH to
reach 95%
Household coverage %
1 171 DTTB topology All sites 10 kW, except Bangkok 20 kW
10.06 kW 21,291,221 403,757 93.2%
2 200 DTTB topology plus 29 additional sites
All sites 10 kW, except Bangkok 20 kW
10.05 kW 21,863,987 ‐169,009 95.7%
3 225 DTTB topology plus 54 additional sites
All sites 10 kW, except Bangkok 20 kW
10.04 kW 21,978,392 ‐283,414 96.2%

25
3. Key lessons learned
26
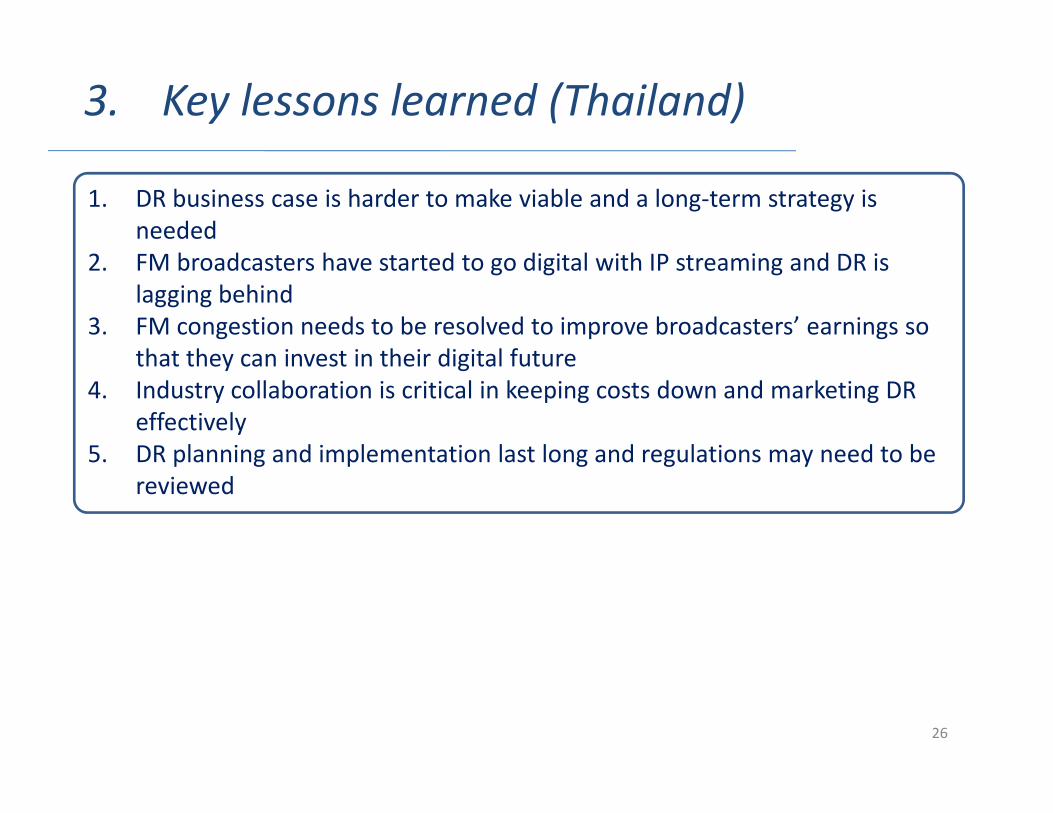
3. Key lessons learned (Thailand)
1. DR business case is harder to make viable and a long‐term strategy is needed
2. FM broadcasters have started to go digital with IP streaming and DR is lagging behind
3. FM congestion needs to be resolved to improve broadcasters’ earnings so that they can invest in their digital future
4. Industry collaboration is critical in keeping costs down and marketing DR effectively
5. DR planning and implementation last long and regulations may need to be reviewed