Embed Size (px)
Citation preview

Digital Signal Processing of ECG signals to Diagnose Heart
Diseases
by
Asrith Krishna Chakka
A thesis submitted in partial fulfillment of the requirements for the degree of Master of Engineering in
Microelectronics and Embedded systems
Examination Committee: Dr. Mongkol Ekpanyapong (Chairperson)
Assoc. Prof. Erik L.J. Bohez
Dr. A.M. Harsha S. Abeykoon
Nationality: Indian
Previous Degree: Bachelor of Technology in
Electronics and Communications Engineering
Jawaharlal Nehru Technological University Hyderabad
Telangana, India
Scholarship Donor: AIT Fellowship
Asian Institute of Technology
School of Engineering and Technology
Thailand
December 2017
ii
ACKNOWLEDGEMENTS
I, Asrith Krishna Chakka, would like to profusely thank my advisor, Dr. Mongkol
Ekpanyapong, for his generous gratitude, attentive support and interest in this field. Besides,
he even recommended me about the special study in the topic of “ECG Signals to Diagnose
Diseases” which is used here in thesis.
I would also like to extend my gratitude and sincere thanks to Dr. A. M. Harsha S Abeykoon
and Assoc. Prof. Erik L.J. Bohez for their kind support, guidance and willingness to serve as
the examination committee members.
Furthermore, I would like to thank my family for the support they have extended, without
which this thesis would not have been possible.

iii
ABSTRACT
As per the data given by WHO many people die due to heart diseases and it is considered as
the second greatest killer. So, any upgradations or improvements in treatments or diagnosis
tools would be of great help to the society and are most encouraged in the medical field.
Electrocardiogram (ECG) is considered as the most useful tool for diagnosing heart patients.
This is operated by recording the electrical signals that heart emits and these emitted signals
are recorded using electrodes that are placed on the chest and limbs. The main purpose of the
project is to classify heart diseases by digital signal processing of ECG signals and
diagnosing those diseases. Those diseases that can be classified by digital signal processing
of ECG signals include arrhythmia, heat block, cardiomyopathy, bundle branch block etc. So,
our main objective is to classify some of these diseases and diagnose them. Pan Tompkins
algorithm is used for the purpose of detecting QRS complex and discrete wavelet transform
for wave decomposition, for classifying these signals we used k- Nearest Neighbor algorithm.
Using MATLAB these ECG signals are digital signal processed. ECG signals that are used in
this paper are obtained from PTB Diagnostic database of physionet.org.
Keywords: ECG (Electrocardiogram), Pan Tompkins algorithm, DWT (Discrete
Wavelet Transform), k-NN classifier, PTB database.

iv
TABLE OF CONTENTS (Cont’l)
CHAPTER TITLE PAGE
TITLE PAGE i
ACKNOWLEDGEMENTS ii
ABSTRACT iii
TABLE OF CONTENTS iv
LIST OF FIGURES vi
LIST OF TABLES vii
LIST OF ABBREVATIONS ix
1. INTRODUCTION 1
1.1. Background 1
1.2. Statement of the problem 2
1.3. Objectives 2
1.4. Scope and limitations 3
1.5. Research Outline 3
2. LITERATURE REVIEW 4
2.1. Review 4
2.2. Detection and Classification of heart diseases 4
2.2.1. Early prediction of cardiovascular diseases using ECG Signals 4
2.2.2. Classification of Cardiac vascular disease from ECG signals 5
2.2.3. Removal of noise from ECG signals using digital 7
Signal Processing
2.2.4. ANN based Arrhythmia Diagnosis 8
2.2.5. Diagnosis of CAD using nonlinear features extracted from 10
ECG signals
2.2.6. Classification of Heart diseases using k-NN and genetic 11
algorithm
2.2.7. Medical Decision Support System for Diagnosis of 13
Cardiovascular Disease using DWT and k-NN
2.2.8. Diagnosing of heart disease patients by applying kNN 14
2.2.9. QRS Detection using k-Nearest Neighbor algorithm (KNN) 15
and Evaluation of standard ECG database
2.2.10.Performance analysis of ANN for cardiac arrhythmia detection 17
2.3. Diseases Diagnosed 17
2.3.1. Cardiomyopathy 17
2.3.2. Myocardial Infarction 18
2.3.3. Dysrhythmia 19
2.3.4. Bundle branch block 20
2.3.5. Healthy ECG signals 21
3. METHODOLOGY 23
3.1. Databases 23
3.2. Pre-processing 24

v
3.3. Features Extraction 24
3.3.1 Pan Tompkins algorithm 24
3.3.2 Discrete Wavelet Transform 26
3.4. Classification of ECG signals 27
3.4.1 Classification using k-NN 27
3.5 Process of Execution 28
3.6 Comparison 29
4. RESULTS 30
4.1 Testing of Cardiomyopathy 30
4.2 Testing of Myocardial Infarction 35
4.3 Testing of Dysrhythmia 40
4.4 Testing of Bundle branch block 45
4.5 Testing of Healthy signals 50
4.6 Accuracy 55
5. CONCLUSIONS AND RECOMMENDATIONS 57
5.1 Conclusions and Recommendations 57
REFERENCES 58

vi
LIST OF FIGURES (Cont’l)
FIGURE TITLE PAGE
Figure 1 Shape of normal ECG, including a U wave 1
Figure 2 Cardiovascular Abnormality Diagnosis Process 5
Figure 3 Feature extraction technique 6
Figure 4 Block diagram of heart disease classification through ANFIS 7
Figure 5 Results for normal data 8
Figure 6 Results for abnormal data 8
Figure 7 ANN based classification of ECG 9
Figure 8 Graph showing performances of the classification 10
Figure 9 Proposed computer aided diagnostic system 10
Figure 10 The algorithm proposed in the paper 12
Figure 11 Accuracy comparison with and without GA 12
Figure 12 Accuracies of various data sets for different K values 13
Figure 13 Graphical representation of accuracies achieved by using k-NN 14
Classifiers
Figure 14 k=7 nearest neighbor accuracy comparison 15
Figure 15 Schematic Representation of intermediate steps for KNN algorithm 15
implementation
Figure 16 Results obtained at each step of algorithm for lead V6 of record 15
M01_036 of CSE database a. raw ECG, b. filtered ECG,
c. gradient of ECG curve, d. QRS locations
Figure 17 ECG for a patient suffering from cardiomyopathy 18
Figure 18 ECG of a patient suffering from Myocardial Infarction 19
Figure 19 ECG of a patient suffering from dysrhythmia 20
Figure 20 ECG signals of the patient suffering from LBBB 21
Figure 21 ECG signals of the patient suffering from RBBB 21
Figure 22 ECG signals of normal people 22
Figure 23 All the 15 ECG signals recorded for every patient, the same way 23
in the PTB diagnostic database
Figure 24 Steps for Pan Tompkins method 24
Figure 25 Decomposition of Signal into sub-bands 26
Figure 26 Knn classifier function declaration in MATLAB 28
Figure 27 Raw Extracted ECG signal of Cardiomyopathy 30
Figure 28 Pan Tompkins algorithm output for cardiomyopathy 31
Figure 29 a. filtered signal with QRS points, b. MVI signal with QRS points 32
c. Pulse train of the found QRS on ECG signal of cardiomyopathy
Figure 30 QRS extracted ECG signal for cardiomyopathy 33
Figure 31 a. 1st differentiation, b. 2nd differentiation, c. cumulative 34
differentiation of cardiomyopathy signal
Figure 32 Dialog box showing that ECG suffers from Cardiomyopathy 34
Figure 33 Raw Extracted ECG signal of myocardial infarction 35
Figure 34 Pan Tompkins algorithm output for myocardial infarction 36
Figure 35 a. filtered signal with QRS points, b. MVI signal with QRS points 37

vii
c. Pulse train of the found QRS on ECG signal of myocardial
Figure 36 QRS extracted ECG signal of myocardial infarction 38
Figure 37 a. 1st differentiation, b. 2nd differentiation, c. cumulative 39
differentiation of myocardial infarction
Figure 38 Dialog box showing that ECG suffers from myocardial 39
Figure 39 Raw Extracted ECG signal of dysrhythmia 40
Figure 40 Pan Tompkins algorithm output for dysrhythmia 41
Figure 41 a. filtered signal with QRS points, b. MVI signal with QRS points 42
c. Pulse train of the found QRS on ECG signal of dysrhythmia
Figure 42 QRS extracted ECG signal of dysrhythmia 43
Figure 43 a. 1st differentiation, b. 2nd differentiation, c. cumulative 44
differentiation of dysrhythmia
Figure 44 Dialog box showing that ECG suffers from dysrhythmia 44
Figure 45 Raw Extracted ECG signal of bundle branch block 45
Figure 46 Pan Tompkins algorithm output for bundle branch block 46
Figure 47 a. filtered signal with QRS points, b. MVI signal with QRS points 47
c. Pulse train of the found QRS on ECG signal of BBB
Figure 48 QRS extracted ECG signal of bundle branch block 48
Figure 49 a. 1st differentiation, b. 2nd differentiation, c. cumulative 49
differentiation of bundle branch block
Figure 50 Dialog box showing that ECG suffers from BBB 49
Figure 51 Raw Extracted ECG signal of healthy signals 50
Figure 52 Pan Tompkins algorithm output for healthy signals 51
Figure 53 a. filtered signal with QRS points, b. MVI signal with QRS points 52
c. Pulse train of the found QRS on ECG signal of healthy signals
Figure 54 QRS extracted ECG signal of healthy signals 53
Figure 55 a. 1st differentiation, b. 2nd differentiation, c) cumulative 54
differentiation of healthy signals
Figure 56 Dialog box showing that ECG is healthy 54

viii
LIST OF TABLES
TABLE TITLE PAGE
Table 1 Table showing feature ranking of normal and CAD 11
Table 2 Results of evaluating the KNN algorithm using CSE database 16
Table 3 Results of evaluating the KNN algorithm using MIT-BIH 16
Arrhythmia database
Table 4 Confusion matrix obtained when the value of k=1 55
Table 5 Confusion matrix obtained when the value of k=3 ` 55
Table 6 Confusion matrix obtained when the value of k=5 55

ix
LIST OF ABBREVATIONS
ECG Electrocardiogram
CAD Coronary Artery Disease
EST Exercise Stress Test
DWT Discrete Wavelet Transform

1
CHAPTER 1
INTRODUCTION
1.1 Background
ECG stands for electrocardiogram. It is also abbreviated as EKG in some countries. The
things that can be expected from an ECG are: it provides an evidence to support diagnosis,
for managing any cardiac rhythms that are abnormal, it also helps in diagnosing patients with
chest pain, etc. Electrocardiogram is a procedure of medical diagnosing which records the
heart electrical activity and shows it as a waveform. ECG is also considered as a painless,
noninvasive way to help diagnosing many heart problems for people of all ages. However,
ECG is an important tool but not as an end. The electric potential measured by an
instrumentation amplifier at various points of the body connected via leads to the body that
are attached to electrodes is termed as Electrocardiogram (ECG). There are basically three
types of ECG. They are
3-lead electrocardiogram, serves the purpose in transport monitors, and it focuses mainly on
two regions of the heart (lateral and inferior).
5-lead electrocardiogram, mostly serves the purpose in an ICU, in this type it also monitors
on the third area (anterior)
12-lead electrocardiogram known for its detailed information at three areas of the heart (the
front part is the anterior, the side part is the lateral, the back part is the inferior).
The heart’s electrical picture is called as a lead.
Figure 1: Shape of normal ECG, including a U wave
The atria muscle mass is small when it is compared to that of ventricles. The electrical
change in the contraction of the atria is also considered as small. The ECG wave called
‘P’ is associated with the contraction of atria. The mass of ventricles is considered large, a
large deflection can be seen in the ECG when the ventricles are depolarized: it is called as
the ‘QRS’ complex. The ‘T’ wave of the ECG is associated with the return of the
2
ventricular mass to its resting electrical state (‘repolarization’). In some ECGs, an extra
wave can be seen on the end of the T wave, and this is called a U wave.
The six limb leads (1, 2, 3, VR, VL, VF) look at the heart from the sides and the feet in a
vertical plane. The chest or V leads look at the heart from the front and the left side in a
horizontal plane. Lead V1 is positioned over the right ventricle, and lead V6 over the left
ventricle.
1.2 Statement of the problem
As per the data given by WHO many people die due to heart diseases and it is considered as
the second greatest killer. So, any upgradations or improvements in treatments or diagnosis
tools would be of great help to the society and are most encouraged in the medical field. For
the treatment of heart diseases, several diagnostic tools are available. The tests available for
diagnosing include EST (Exercise stress test), Tread mill test, Electrocardiogram (ECG),
Echocardiogram and cardiac catheterization. Cardiac catheterization considered as the most
invasive method and time consuming as well, a lot of care is to be taken while catheters are
placed in the patient arteries or veins. Cardiac catheterization is considered as the most
painful method and patients also suffer with irritation. In some diagnostic tests, such as EST
and treadmill, electrophysiological data is recorded that is overstressed and this data is
obtained using ECG. Sometimes these tests are so dangerous that they may cause cardiac
arrest. For detection of CAD, standard ECG is obtained using physiological systems. For
identifying particular cardiac disease type ECG signals with subtle changes are picked up. It
is difficult for identifying minute changes visually in ECG signals. Some diagnostic tools that
are computer aided can help in improving cardiac health diagnosis accuracy by detection of
those small variations that occur in electrocardiogram signals.
Here in this project we detect diseases from the ECG signals by digital signal processing
them. Once the diseases are detected then appropriate diagnosis will be given. So, this will be
of great help to the patients as well as doctors as everything is done by the system and just a
pre check by the doctor would be enough. There are various cardiovascular diseases that can
be detected and classified using ECG signals.
1.3 Objectives
The objectives of this thesis are:
Classification of electrocardiogram signals using machine learning.
Digital signal processing of the prerecorded ECG signals that are obtained from
physionet.org for diagnosing of cardiomyopathy, myocardial infarction, myocarditis,
dysrhythmia and healthy signals.
The detection of features is to be done so that these features are taken into reference
for the comparison with the training dataset.

3
1.4 Scope and limitations
This research study will help in classifying 5-6 heart diseases and diagnosing them. We are
limiting the detection and classification for only limited number of diseases. In the future, this
processing can be done for detecting and classifying more number of various other cardiac
diseases and this classification can be a reference to the doctor. Only those 5-6 diseases
mentioned will be triggered correctly and any other disease will be classified to the disease
which has almost similar ECG signals. Any disease that is to be classified should be trained,
then only it can be classified otherwise it gets classified to the disease having similar ECG
signals of those that are already trained.
1.5 Research Outline
The outline of this thesis is
In chapter 2, literature review of some of previous related studies are provided in brief.
In chapter 3, the methodology of this thesis paper is provided.
In chapter 4, the implementation and results are provided for classification of diseases
In chapter 5, conclusion and recommendations are provided.
4
CHAPTER 2
LITERATURE REVIEW
2.1 Review
“Most of the heart functioning is monitored using the ECG signals, since they show
how every part of the heart is functioning in a clear graphical manner. These ECG
signals are measured using different ways. Some of the types are 3 lead ECG, 5 lead
ECG and 12 lead ECG. Doctors on seeing these ECG signals say what is the defect in
the person’s heart and doctors get to know that by the variations in the P wave, QRS
complex, T wave. Usually in hospitals the ECG type that is mostly used is 12 lead
ECG where it gives information about all the three areas of the heart i.e anterior,
lateral and inferior. These ECG signals are normally printed on grids. Time is
represented by the horizontal axis and voltage is represented by the vertical axis. So,
ECG signals play a crucial role when it comes to heart checkup and it is better to
check ECG whenever a patient’s health is so serious. Diagnosing disease using ECG
signals is of much important application and that can save a lot of time for the doctors
if the information of disease is printed on the ECG sheet itself.”
2.2 Detection and Classification of heart diseases
There are various methods in which we can detect and classify ECG signals. In all
methods proposed so far detect or classify only one or two disease using various
algorithms. Mostly used methods for detecting are Pan Tompkins, Daubechies
Wavelet transform, etc, and for classification there are algorithms like k-Nearest
Neighbor (k-NN), Probabilistic Neural Network (PNN), Support Vector Machine
(SVM), ANN (Artificial Neural Network), Fuzzy Logic System and many other. ECG
signals are detected and classified using several methods are shown as follows:
2.2.1 Early prediction of cardiovascular diseases using ECG Signals
[1] The early stage is said to be when the patient is suffering from chest pain
and angina. For early prediction, the researcher used the database provided by
PhysioNet.org. From the database of PhysioNet.org the obtained signals are
preprocessed where the noise and artifact contamination is removed and for
this preprocessing IIR filter for example Chebyshev Type 1, Elliptic filter and
Butterworth filter are used. After the preprocessing is done then they went for
feature extraction. The main purpose of feature extraction is to select and
retain relevant information from the preprocessed signals. In this method for
the purpose of feature extraction the algorithm used is Pan Tompkins
algorithm as used in various research papers. Using this algorithm the QRS
complex is detected in the ECG signals. In this paper the classification of
abnormal CVDs that are caused due to the traditional risk factors such as
tobacco smoking are classified using the Support Vector Machine (SVM)

5
technique. This paper would be of help to make faster the diagnosis
procedures since it is early prediction.
2.2.2 Classification of Cardiac vascular disease from ECG signals
[2] In this paper the abnormalities that are found in ECG signals are used for
identifying diseases like arrhythmia, bradycardia, tachycardia and ischemia.
These diseases are classified using the Adaptive Neuro Fuzzy Interference
System (ANFIS). For the feature extraction, they used Daubechies Wavelet
Transform and for the purpose of compressing the algorithm used is Huffman
coding, the reason for compressing to be used here is for sending this
diagnosed signal and the results to the nearby health center.
In this paper, they followed three steps: In the first step, they identify and
annotate the ECG signal for normal, bradycardia, tachycardia and ischemia
characteristic. In the second step, they presented the strategy for extracting the
features of each sample of heart disease using the Discrete Wavelet
Transform. In the last step, they went through the classification using
Adaptive Neural Fuzzy Interference System modeling.
The methodology or the process used in this paper is shown in the following
schematic:
Figure 2: Cardiovascular Abnormality Diagnosis Process
6
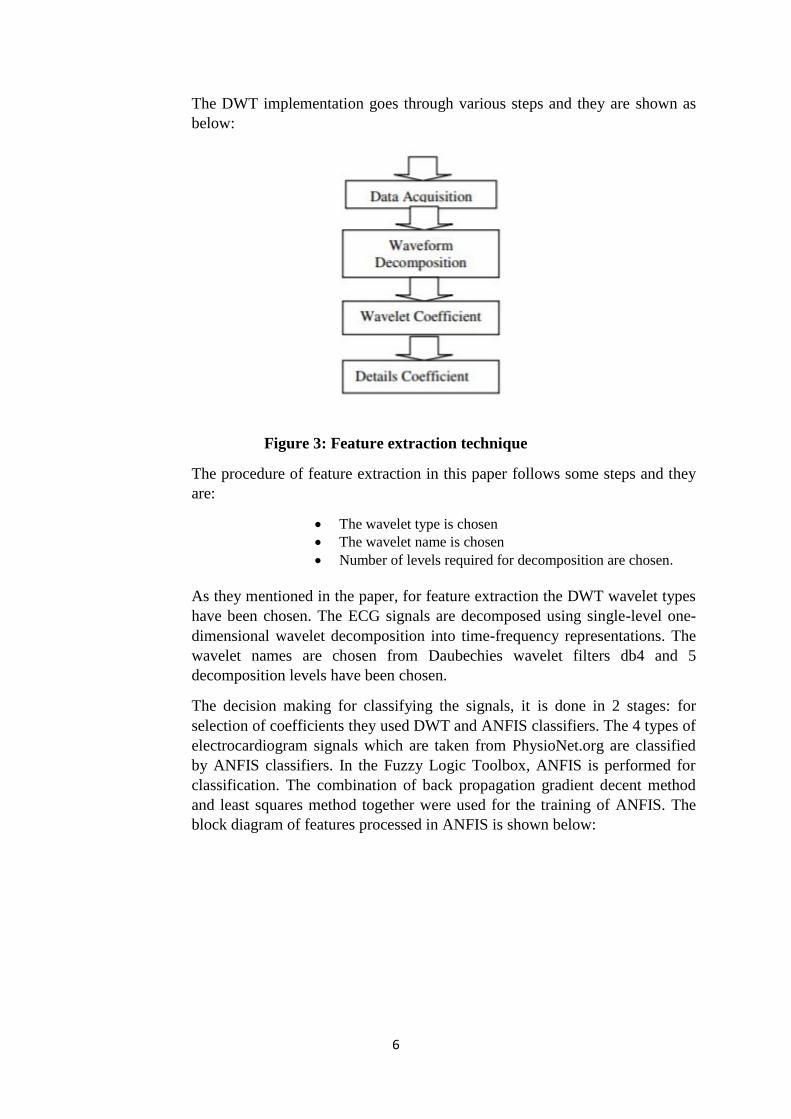
The DWT implementation goes through various steps and they are shown as
below:
Figure 3: Feature extraction technique
The procedure of feature extraction in this paper follows some steps and they
are:
The wavelet type is chosen
The wavelet name is chosen
Number of levels required for decomposition are chosen.
As they mentioned in the paper, for feature extraction the DWT wavelet types
have been chosen. The ECG signals are decomposed using single-level one-
dimensional wavelet decomposition into time-frequency representations. The
wavelet names are chosen from Daubechies wavelet filters db4 and 5
decomposition levels have been chosen.
The decision making for classifying the signals, it is done in 2 stages: for
selection of coefficients they used DWT and ANFIS classifiers. The 4 types of
electrocardiogram signals which are taken from PhysioNet.org are classified
by ANFIS classifiers. In the Fuzzy Logic Toolbox, ANFIS is performed for
classification. The combination of back propagation gradient decent method
and least squares method together were used for the training of ANFIS. The
block diagram of features processed in ANFIS is shown below:
7
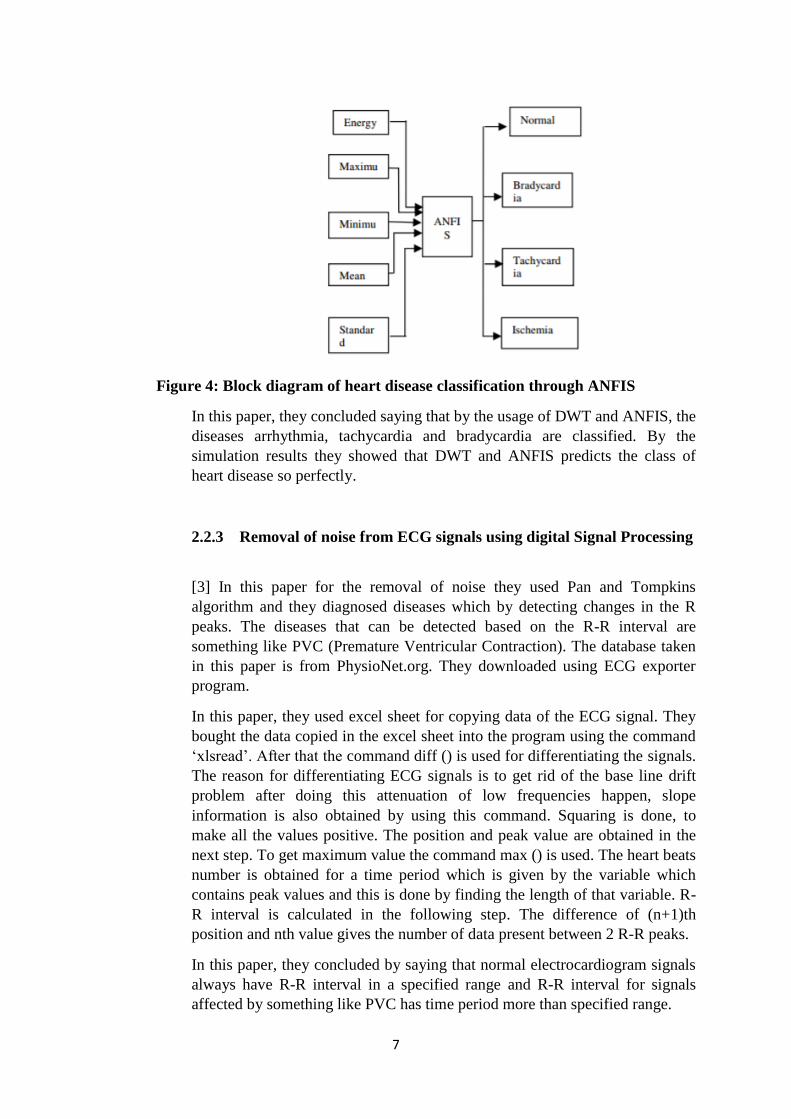
Figure 4: Block diagram of heart disease classification through ANFIS
In this paper, they concluded saying that by the usage of DWT and ANFIS, the
diseases arrhythmia, tachycardia and bradycardia are classified. By the
simulation results they showed that DWT and ANFIS predicts the class of
heart disease so perfectly.
2.2.3 Removal of noise from ECG signals using digital Signal Processing
[3] In this paper for the removal of noise they used Pan and Tompkins
algorithm and they diagnosed diseases which by detecting changes in the R
peaks. The diseases that can be detected based on the R-R interval are
something like PVC (Premature Ventricular Contraction). The database taken
in this paper is from PhysioNet.org. They downloaded using ECG exporter
program.
In this paper, they used excel sheet for copying data of the ECG signal. They
bought the data copied in the excel sheet into the program using the command
‘xlsread’. After that the command diff () is used for differentiating the signals.
The reason for differentiating ECG signals is to get rid of the base line drift
problem after doing this attenuation of low frequencies happen, slope
information is also obtained by using this command. Squaring is done, to
make all the values positive. The position and peak value are obtained in the
next step. To get maximum value the command max () is used. The heart beats
number is obtained for a time period which is given by the variable which
contains peak values and this is done by finding the length of that variable. R-
R interval is calculated in the following step. The difference of (n+1)th
position and nth value gives the number of data present between 2 R-R peaks.
In this paper, they concluded by saying that normal electrocardiogram signals
always have R-R interval in a specified range and R-R interval for signals
affected by something like PVC has time period more than specified range.

8
The results in this paper are as shown below:
Figure 5: Results for normal data Figure 6: Results for abnormal data
2.2.4 ANN based Arrhythmia Diagnosis
[4] In this paper, they concentrated on classifying 2 types of arrhythmias
LBBB (Left bundle branch block) and Right bundle branch block (RBBB)
with healthy signal. As in all the research papers, this paper also first de noised
the ECG signal and the required features are detected from the pure signal.
The signal from which features are extracted is then given to the ANN
algorithm for classifying the two types of arrhythmia that are mentioned. For
this classification, electrocardiogram signals are taken from the
electrocardiogram MIT-BIH arrhythmias database.
In feature extraction, R peaks are detected initially. The samples taken from
the database are submitted to DWT which produces the coefficients of the
wave. Here the feature vector is created and is processed using Artificial
Neural Network (ANN) by error back propagation method for classifying
cardiac arrhythmia. “The patterns of the ECG signals are taken as neurons in
ANN. The neurons are organized in a feed forward network as a layered
structure and are connected strictly in a feed forward manner.

9
Figure 7: ANN based classification of ECG
ANN is a network inspired biologically which is suitable in classifying
biomedical data. The number of parameters decides the precision of
classification results. The number of parameters that are selected for
classification equals the neurons number in the input layer. Training of ANN’s
is done by the parameters extracted. Typically for the classification, multilayer
feed forward network is used for configuration along with activation function
Log-sigmoid, for minimizing the squared error between the ANN’s actual
output and desired output the training is done using back propagation method.
Some important steps in BP algorithm are as follows:
Begin
Initiation of network
Learning sample is initialized
Computation of each neuron in network layer
Train error computing
Network weight is modified
Meet the error precision = 0.0001
End of process.
When the square errors sum for the segments is < or = .0001 then the training
of the ANN (Artificial Neural network), said to be completed. The vectors
taken as inputs of the ANNs classification are based on feature vectors
extracted using DWT from R wave. The success and error recognition of ANN
is determined by usage in testing phase.
The classification performances are expressed in terms of accuracy, precision,
sensitivity and specificity. The results are as follows:

10
Figure 8: Graph showing performances of the classification
2.2.5 Diagnosis of CAD using nonlinear features extracted from ECG
signals
[5]In this paper, CADs are detected and classified from the normal signals.
Automated diagnosis of CAD is done using DWT and nonlinear feature
extraction techniques like: Tsallis entropy, renyi entropy and Multivariate
Multi-Scale Entropy (MMSE). Based on t-value the extracted features that are
obtained after DWT are ranked and fed to Support Vector Machine (SVM),
Decision Tree (DT), Probabilistic Neural Network (PNN) and K Nearest
Neighbor (KNN) for classification of CAD and normal classes.
In this paper the computer aided tool that is proposed includes acquisition of
signals, pre-processing, discrete wavelet transform, feature extraction, feature
selection, feature ranking and classification. The ECG signals that are
acquired, fed into de-noising technique which is wavelet based for baseline
removal. Using Pan Tompkins algorithm, the R peak detection is carried out.
Using detected R peaks the ECG signals are segmented. The ECG beats
acquired are subjected to DWT and are decomposed up to 4 levels. From
DWT coefficients features such as Multivariate Multi-Scale Entropy (MMSE),
Tsallis entropy and Renyi entropy are extracted. Using t-value the features are
ranked. The features that are ranked are then fed to classifiers such as k-
Nearest Neighborhood (KNN), Probabilistic Neural Network (PNN), Support
Vector Machine (SVM) and Decision Tree (DT) for determining the best
performing classifier. The following figure shows the computer aided tool for
diagnosis:
Figure 9: Proposed computer aided diagnostic system

11
In the preprocessing stage the noise is removed from the ECG signals using
wavelet based denoising method. R-peak detection is done using Pan
Tompkins algorithm. This algorithm undergoes differentiation, squaring and
moving integrator. For beat segmentation the R point is considered as a
reference point. For feature extraction, various techniques are used as
mentioned. The technique MMSE is a univariate technique that regulates
intrinsic correlations that are nonstationary in the ECG signals and the amount
of correlation in the time series signal is improved. The physical behavior of a
system is described by Tsallis Entropy. It characterizes systems with long time
interactions, long range memory outcomes and multi fractal space time
constraints. The general form of Shannon entropy is Renyi entropy. The Renyi
entropy is used since Shannon entropy failed to illustrate the sudden changes
in the time series data. Higher entropy has flat and broad probability
distribution. Low entropy has narrow and peak distribution. Based on feature
ranking methods significant features along with necessary information are
selected. Based on their t-value, the features are ranked. For classifying
normal and CAD subjects using ECG signals the above-mentioned classifiers
are used. The results mentioning about the ranking of features for normal and
CAD are as shown below:
Table 1: Table showing feature ranking of normal and CAD
2.2.6 Classification of Heart diseases using k-NN and genetic algorithm
[15] In this paper, they used data mining which is extracting knowledgeable
information from large amount of data. They classified heart diseases using k-
NN classification and genetic algorithm. Their approach of combining k-NN
and genetic algorithm helped in improving classification accuracy of heart
12
disease data set. The classification algorithm is built taking evaluated
attributed into consideration. Their classifier is trained to shoe the output
whether the person is sick or healthy. The algorithm used is divided into two
parts.
In the first part, genetic search is used for evaluating attributes.
In the second part, classifier is built and accuracy of the classifier is
measured.
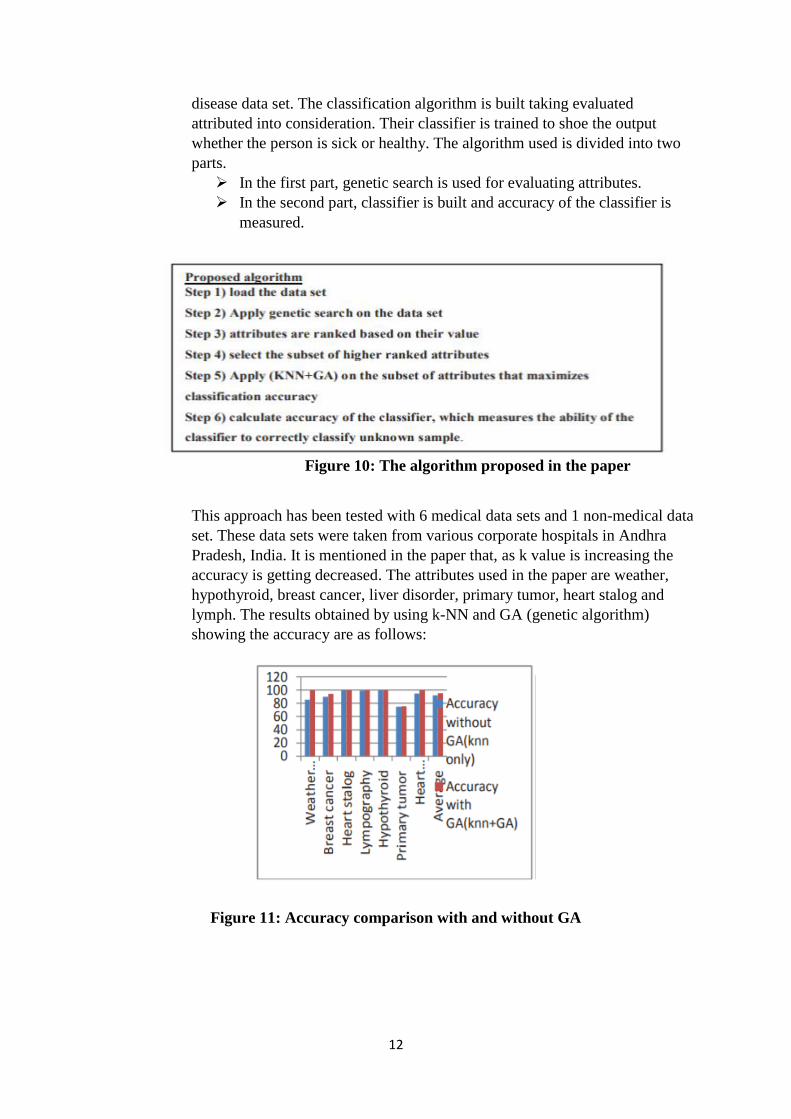
Figure 10: The algorithm proposed in the paper
This approach has been tested with 6 medical data sets and 1 non-medical data
set. These data sets were taken from various corporate hospitals in Andhra
Pradesh, India. It is mentioned in the paper that, as k value is increasing the
accuracy is getting decreased. The attributes used in the paper are weather,
hypothyroid, breast cancer, liver disorder, primary tumor, heart stalog and
lymph. The results obtained by using k-NN and GA (genetic algorithm)
showing the accuracy are as follows:
Figure 11: Accuracy comparison with and without GA
13
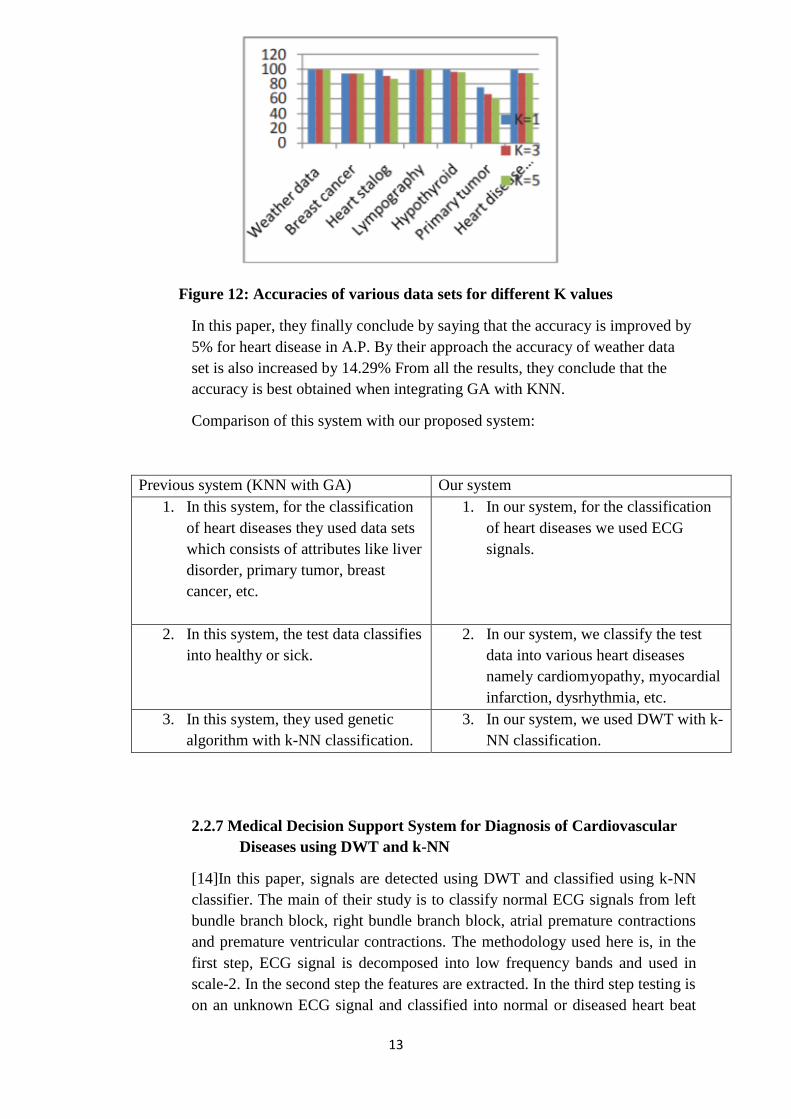
Figure 12: Accuracies of various data sets for different K values
In this paper, they finally conclude by saying that the accuracy is improved by
5% for heart disease in A.P. By their approach the accuracy of weather data
set is also increased by 14.29% From all the results, they conclude that the
accuracy is best obtained when integrating GA with KNN.
Comparison of this system with our proposed system:
Previous system (KNN with GA) Our system
1. In this system, for the classification
of heart diseases they used data sets
which consists of attributes like liver
disorder, primary tumor, breast
cancer, etc.
1. In our system, for the classification
of heart diseases we used ECG
signals.
2. In this system, the test data classifies
into healthy or sick.
2. In our system, we classify the test
data into various heart diseases
namely cardiomyopathy, myocardial
infarction, dysrhythmia, etc.
3. In this system, they used genetic
algorithm with k-NN classification.
3. In our system, we used DWT with k-
NN classification.
2.2.7 Medical Decision Support System for Diagnosis of Cardiovascular
Diseases using DWT and k-NN
[14]In this paper, signals are detected using DWT and classified using k-NN
classifier. The main of their study is to classify normal ECG signals from left
bundle branch block, right bundle branch block, atrial premature contractions
and premature ventricular contractions. The methodology used here is, in the
first step, ECG signal is decomposed into low frequency bands and used in
scale-2. In the second step the features are extracted. In the third step testing is
on an unknown ECG signal and classified into normal or diseased heart beat

14
using k-NN classifier. They used three different k-NN classifiers and
compared the results obtained in three different classifiers. For this
classification, the database is obtained from MIT-BIH arrhythmia database
which is the most common database used in many previous researches. They
used 48 records for the total classification. They focused mostly on the k-NN
classifiers than on disease detection. The different k-NN classifiers used in this
paper are lbk, Kstar and LVL. The results show that LVL is able to get the
best accuracy out of the three.
Figure 13: Graphical representation of accuracies achieved by using k-NN Classifiers
2.2.8 Diagnosing of heart disease patients by applying kNN
[13] In this paper, focus is on investigating the integration of voting with kNN
classifier to diagnose heart disease patients and improve the accuracy. They
make this integration of k-NN and voting, apply it on benchmark dataset so as
to compare the accuracy obtained by using other techniques that are used on
same data set. Voting is a technique that combines the decisions from multiple
classifiers. The training data divides into equal, smaller subsets and one is
built for each subset of data. The majority voting is considered the simplest
form of voting where each classifier contributes a single vote. The class
getting the maximum votes is considered as the final prediction. The data used
in this paper is the benchmark Cleveland Clinic Foundation Heart disease data
set. It has 76 raw attributes. Applying voting to k-NN did not increase any
accuracy but applying it to the decision tree increased accuracy.

15
Figure 14: k=7 nearest neighbor accuracy comparison
2.2.9 QRS Detection using K-Nearest Neighbor algorithm (KNN) and
Evaluation of standard ECG database
[12] In this paper, K-NN classifier is used and QRS complex is detected in
signals. This algorithm is tested on 2 databases namely MIT-BIH arrhythmia
and CSE. To reduce the false detection and interference of noise, they used a
digital band pass filter. For QRS detection, they used gradient of the ECG
signal. In this a comparison is made between the accuracies obtained on the
proposed algorithm and previous research works. The algorithm used in this
paper and results obtained are as shown below:
Figure 15: Schematic Representation of intermediate steps for KNN algorithm
implementation
Figure 16: Results obtained at each step of algorithm for lead V6 of record M01_036 of
CSE database a. raw ECG, b. filtered ECG, c. gradient of ECG curve, d. QRS locations

16
In this paper, they mainly focused on detection of QRS complex than on
diagnosing diseases. The detection in this paper is like if the algorithm
correctly detects QRS complex then it is true positive (TP), if the algorithm
fails to detect then it is said to be false negative (FN), if the algorithm detects
QRS complex even there is no QRS complex then it is false positive (FP).
Detection rate is given the equation as follows
Table 2: Results of evaluating the KNN algorithm using CSE database
Table 3: Results of evaluating the KNN algorithm using MIT-BIH Arrhythmia database

17
The present paper shows much research on algorithmic consideration, some
methodological aspects related to classification, the capabilities of detecting
QRS complexes.
2.2.10 Performance analysis of ANN for cardiac arrhythmia detection
[11] The main goal of researcher in this paper is to evaluate the performance
of various classifiers. The classifiers whose performance is evaluated are k-
NN, Naïve Bayes Classifier (NBC), Multi-Class Support Vector Machine
(MSVM). In this paper, Pan Tompkins algorithm is applied to the raw ECG
signal for the detection of QRS complex and the features extraction is done.
After the feature extraction, the signal is classified using three classifiers as
mentioned and is then classified as normal or abnormal.
Comparison:
2.3 Diseases Diagnosed
2.3.1 Cardiomyopathy
This disease totally refers to that related to heart muscle. When this disease
occurs, it shows many signs and symptoms. In this, we could see an enlarged,
thick heart muscle. In some cases, the heart’s muscle tissue should be replaced by
a scar tissue. The ventricles are enlarged and weaken in dilated cardiomyopathy.
Previous System (Performance
analysis system)
Our system
In this system, the focus is to
evaluate the performance of
various classifiers.
In our system, the focus is to
classify the ECG signal into
various diseases.
In this system, the output is
shown as normal or abnormal
In our system, the output
shown is the disease that ECG
holds.
They used only Pan
Tompkins and classified.
In our system, we even used
DWT for wave
decomposition.
They used MIT-BIH
arrhythmia database.
In our system, PTB diagnostic
database is used.
They only used 20 ECG
records for collecting various
beats.
In our system, more 100
records are used for collecting
various beats.

18
In the worse stage of cardiomyopathy, the heart becomes so weak. It's ability
to pump the blood decreases through the body and maintains a normal
electrical rhythm with difficulty. This may sometimes lead to failure of
heart or some arrhythmia where the heartbeats are irregular. This failure of
heart may also lead to build up fluid in some major parts of the body namely
lungs, abdomen, etc,. The also shows heart valve problems because of
weakening of heart.
Cardiomyopathy is of two types and they are acquired and inherited. For those
who are not born with this but they develop due to other diseases or conditions
are said to be "Acquired". For those who are passed the gene from the parents
are said to be "Inherited". Most of the times, what caused cardiomyopathy is
not known. This disease shows result on people of different ages. However,
different age groups show different types of cardiomyopathy.
Figure 17: ECG for a patient suffering from cardiomyopathy
2.3.2 Myocardial Infarction
Like in any muscle in humans, the heart needs to be supplied with oxygen and
nutrients. The oxygenated blood gets delivered to the heart muscle by the
branching arteries. If any one of the coronary arteries or branches get blocked,
then that portion of the heart starves of oxygen and this condition is called
“cardiac ischemia.”
In this type of cardiac ischemia which shows up for a long time, that portion of
heart tissue which is starving of oxygen dies. It is generally called as heart
attack, which is known by the name myocardial infarction” – literally, “death
of heart muscle.”
There are number of tests which help in the diagnosis of myocardial infarction
and some of those tests include blood tests, electrocardiograms (ECGs) and
coronary angiography. An ECG which is considered as the recording of
electrical activity of heart, if ST elevation is present then it may confirm an ST
elevation Myocardial Infarction (STEMI).

19
Treatment of MI is time critical. For a suspected MI, the most immediate and
appropriate treatment is Aspirin. In those with low oxygen levels or shortness
of breath, Supplemental oxygen should be used. Chest pain is the most
common symptom seen in acute myocardial infarction.
Figure 18: ECG of a patient suffering from Myocardial Infarction
2.3.3 Dysrhythmia
An abnormal heart beat is considered as a cardiac dysrhythmia. In this the
rhythm is irregular in its pacing or there may be low or high heart rate. Some
type of dysrhythmias is considered as potentially life threatening where as
some are considered normal (such as sinus arrhythmia).
There are different types of dysrhythmias and these are classified based on
origin (atria and ventricles) and heart rate.
If the heart rhythm is more than normal heart rate (over 100 beats per
minute) is considered as tachycardia. Tachycardia can originate either
from atria or ventricles. Those that originate from atria are called
supraventricular dysrhythmias and these include
a. Atrial fibrillation
b. Atrial flutter
c. Wolff-Parkinson-White Syndrome
d. Paroxysmal Supraventricular tachycardia
Those that begin from ventricles are called as Ventricular
dysrhythmias and these include
a. Premature ventricular contractions
b. Ventricular fibrillation
c. Long QT syndrome
If the heart rhythm is less than normal heart beat (under 60 beats per
minute) is considered as bradycardia.

20
For testing of dysrhythmia there are various methods like holter monitor,
ECG, stress tests, event monitors, cardiac catheterization, etc.
Figure 19: ECG of a patient suffering from dysrhythmia
2.3.4 Bundle branch block
Bundle branch block is a condition in which there’s a delay or obstruction
along the pathway that electrical impulses travel to make heartbeat. The
blockage or delay may occur on the pathway that sends electrical impulses to
the left or right side of the bottom chambers (ventricles) of the heart. The
bundle branch block makes it harder for the heart to pump blood through the
circulatory system. There is no complete treatment for bundle branch alone but
any health condition which caused bundle branch block is need to be treated. It
doesn’t cause any symptoms in most of the people and they don’t even know
that they are having bundle branch block. In some people signs and symptoms
such as fainting and feeling as if they are going faint is seen.
There are two types of bundle branch block. One is RBBB (Right Bundle
Branch Block) and the other one is LBBB (Left Bundle Branch Block). Any
problem in the right side of the heart is indicated by RBBB, when the QRS
complex are with normal duration in a RBBB then they are considered healthy
only. LBBB is always considered to be an indication of heart disease, mostly
of left ventricle. Whenever RBBB is detected we need to first think about
atrial septal defect. Whenever LBBB is detected we need to think about
ischaemic disease and aortic stenosis. No action is required if the patient is
asymptomatic. LBBB indicate acute MI, if the patient was suffering from
chest pain.

21
Figure 20: ECG signals of the patient suffering from LBBB
Figure 21: ECG signals of the patient suffering from RBBB
2.3.5 Healthy ECG signals
The ECG showing no abnormalities are considered as healthy. Some of the
physical features of these healthy signals are as follows:
P wave: In leads I, aVF and V3- V6 it is completely upright. The duration of
this wave less than or equal to 0.11 sec. It should not be peaked or notched and
must generally be smooth.
PR interval: The duration of this wave should be between 012 and 0.20 sec.
For QRS complex: The time period is < 0.12 sec, amplitude should be > .5mV
in atleast a lead which is standard, at least one precordial lead should have
amplitude greater than 1.0mV. In general, there should be proceeding from V1
to V6, the R waves become taller whereas the S waves become smaller. At V3
or V4, the waves S and R become equal. This is also called as transitional
zone.

22
In ST segment: In a normal ECG, this should be isoelectric and slanting
upwards to the T wave. It is not depressed > 0.5mm in any lead.
For T wave: Its deflection should also be in the same direction of the QRS
complex for at least 5 of the 6 limb leads. In leads V2-V6, this should be
upright and inverted in aVR. In leads V3 and V4, there should be an amplitude
of at least 0.2mV and in leads V5 and V6 there should be at least 0.1mV.
QT interval: This interval should be less than 0.40 secs for males and for
females it should be 0.44 secs.
Figure 22: ECG signals of normal people

23
CHAPTER 3
METHODOLOGY
3.1 Databases
As we are using the pre-recorded ECG signals in this paper, we are able to get them from
PHYSIONET.ORG. PhysioNet website is a site that is completely dedicated to medical data
of different diseases. In this paper, we are mainly focusing on diagnosis of heart diseases that
to on diseases which can be detected using ECG signals. So for this purpose we chose “The
PTB (Physikalisch- Technische Bundesanstalt) Diagnostic ECG database” from the National
Metrology Institute of Germany, which has provided to all the users the compilation of
digitized ECGs for the purpose of research, algorithmic benchmarking or teaching. This
database contains 549 records from 290 patients (aged from 17 to 87). Each record includes
15 simultaneously measured signals: the 12 leads (I, II, III, aVR, aVL, aVF, v1, v2, v3, v4, v5, v6)
together with three frank lead ECGs (vx, vy, vz). In this database, they also provide us with
header file which contains the complete detailed clinical summary which include age, gender,
diagnosis, ventriculography, echocardiography and hemodynamics.
Figure 23: All the 15 ECG signals recorded for every patient, the same way
in the PTB diagnostic database
24
3.2 Pre-processing
Pre-processing is an important part to be done for the ECG signals obtained from the website
PhysioNet.org. To remove the artifact contamination and noise present in the ECG signals,
preprocessing is done which otherwise would affect the clinical information used for
interpretation. For ECG preprocessing many researchers used different types of filters. These
filters remove the unwanted signals and get the signal that is needed for the extraction of
desired features. Since we took the signals from an open database, it may contain noise,
powerline interference and artifacts. Therefore, it is necessary for preprocessing the signals
and for this some basic filters are used for filtering of noise and artifact.
3.3 Features Extraction
For retaining and selecting information from electrocardiogram signal, the feature extraction
serves the purpose. There are different ways in which this feature extraction can be done.
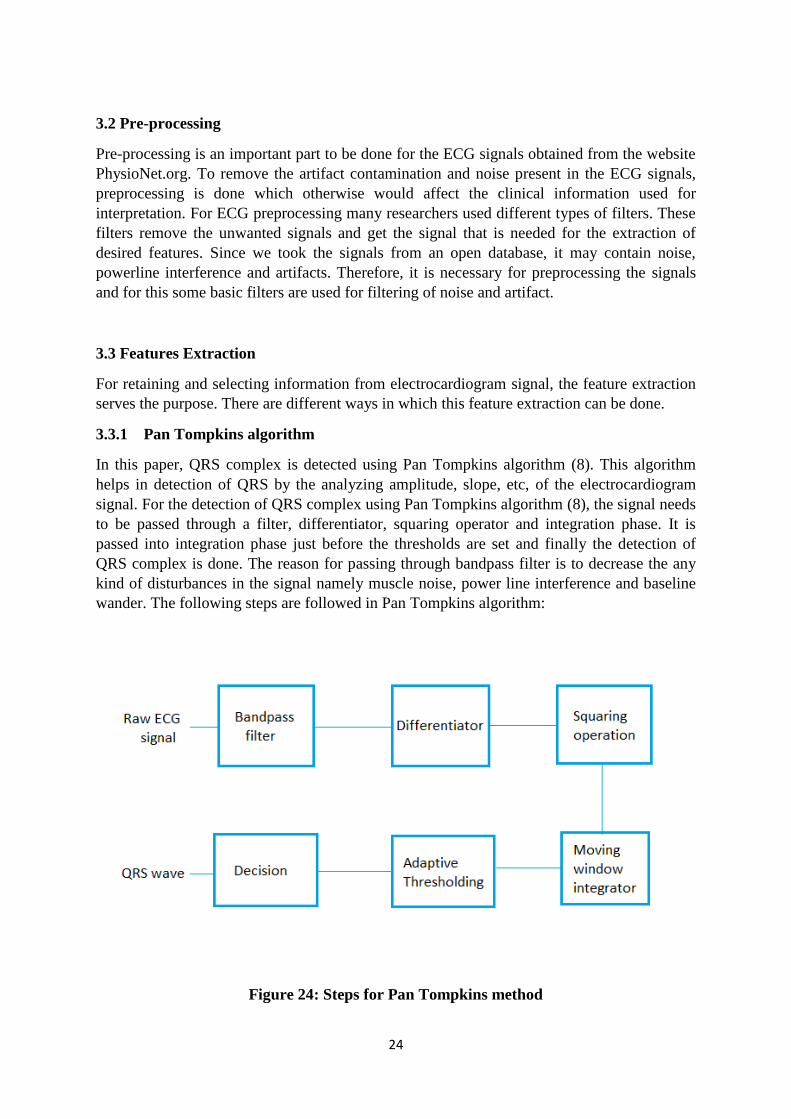
3.3.1 Pan Tompkins algorithm
In this paper, QRS complex is detected using Pan Tompkins algorithm (8). This algorithm
helps in detection of QRS by the analyzing amplitude, slope, etc, of the electrocardiogram
signal. For the detection of QRS complex using Pan Tompkins algorithm (8), the signal needs
to be passed through a filter, differentiator, squaring operator and integration phase. It is
passed into integration phase just before the thresholds are set and finally the detection of
QRS complex is done. The reason for passing through bandpass filter is to decrease the any
kind of disturbances in the signal namely muscle noise, power line interference and baseline
wander. The following steps are followed in Pan Tompkins algorithm:
Figure 24: Steps for Pan Tompkins method
25
Band pass Filtering
The band pass filter for the QRS detection algorithm reduces noise in the ECG signal by
matching the spectrum of the average QRS complex. This attenuates noise due to muscle
noise, power line interference, baseline wander, T wave interference. The pass band that
maximizes the QRS energy is in the 5Hz-35Hz range. The filter implemented in this
algorithm is composed of cascaded high pass and low pass Butterworth IIR filters.
Differentiator
The next processing step is differentiation, standard technique for finding the high slopes that
normally distinguish the QRS complexes from other ECG waves. The derivative procedure
suppresses the low frequency components of P and T waves, and provides a large gain to the
high-frequency components arising from the high slopes of the QRS Complex.
Derivative filter is given by the following equation:
(1)
Squaring Operation
The squaring operation makes the result positive and emphasizes large differences resulting
from QRS complexes; the small differences arising from P and T waves are suppressed. The
high frequency components in the signal related to the QRS complex are further enhanced.
This is a nonlinear transformation that consists of point by point squaring of the signal
samples.
Squaring operation is given by the following equation:
(2)
Moving Window Integration
The squared waveform passes through a moving window integrator. This integrator sums the
area under the squared waveform over a suitable interval, advances one sample interval, and
integrates the new predefined interval window. The half-width of window has been chosen as
27 to include the time duration of extended abnormal QRS complexes, but short enough that
it does not overlap both a QRS complex and a T-wave. MA (moving average) filter extracts
features in addition to the slope of the R wave.
Moving average is given by
(3)
Pan Tompkins algorithm is used in this paper by the function:
[qrs_amp_raw, qrs_i_raw, delay] = pan_tompkin(ecg,fs,gr)
For this function above the inputs are:
ecg: it is the raw ecg vector signal
fs: sampling frequency
gr: this is the flag to plot or not plot (to have a plot, it is set to 1 otherwise to 0)

26
Outputs are
qrs_amp_raw: gives the R waves amplitudes
qrs_i_raw: index of R waves
delay: due to filtering the signal is delayed by number of samples
3.3.2 Discrete Wavelet Transform
In this as we are using Discrete Wavelet Transform for extraction of features. Wavelet
concept is used as it helps in analyzing data more accurately. Wavelets exist for a finite
duration. Wavelets come in different sizes and shapes. They are chosen based on the
application. Normally, for analysis of non-stationary signal component, wavelet transform is
used as a tool. It helps in the decomposition of signals into various sub-bands and at varying
resolutions. The band limited signals which are used here are decomposed into approximation
(A1, A2, A3, A4, A5, A6, A7, A8) and detail (D1, D2, D3, D4, D5, D6, D7, D8) by using a
8-level wavelet decomposition and a Daubechies (db6) wavelet. The decomposition is done
as shown in the figure below. For extraction of information from ECG signals we used
wavedec() function in MATLAB which is for Multilevel 1-D wavelet decomposition. This
multilevel is used for extracting information from large data or images, etc.
Figure 25: Decomposition of Signal into sub-bands
For a signal x, DWT is calculated by passing the signal through a series of filters.
First they are passed through a low pass filter having impulse response g which results in
convolution of two:
(4)
This signal is also decomposed using a high-pass filter h, simultaneously. The outputs
obtained from the high pass filter are detail coefficients and from low pass filters,

27
approximation coefficients are obtained. Here, half of the samples are discarded since half the
frequencies of the signal have been removed per Nyquist’s rule. The filter output of low pass
filter g (A1) is then subsampled by 2 and further processed by passing it again through a new
low pass filter and a high pass filter with about half the cut-off frequencies of the previous
one, i.e.:
(5)
(6)
This wave decomposition halves the resolution as only half of each filter’s output is
characterized by the signal. Each output has only half the frequency band of the input, so now
the frequency resolution is doubled.
At each level in the fig 18, the signal gets decomposed into high and low frequencies.
Due to the decomposition process, the input signal should be a multiple of 2^n where n
denotes number of levels.
The wavelet decomposition in MATLAB is called by the function:
[C, L] = wavedec(X, N, ‘wname’)
The above equation returns decomposition of wavelet for a signal X at level N, using
‘wname’.
The ‘wname’ is chosen based on the application.
C is wavelet decomposition vector, L is the bookkeeping vector which contains the number
of coefficients by level.
3.4 Classification of ECG signals
3.4.1 Classification using k-NN
In this project for the purpose of classification of ECG signals we used k-nearest neighbors
algorithm (k-NN). In pattern recognition, the k-NN algorithm is a non-parametric method
used for classification and regression. In both cases, the input consists of the k closest
training examples in the feature space. The output depends on whether k-NN is used for
classification or regression. Here in our project since we are using k-NN for classification, so
the output is a class membership. An object is classified by a majority vote of its neighbors,
with the object being assigned to the class most common among its k nearest neighbors (k is
a positive integer, typically small). If k=1, then the object is simply assigned to the class of
that single nearest neighbor. The best choice of k depends upon the data; generally larger
values of k reduce the effect of noise on the classification, but makes boundaries between
classes less distinct.
The reason for using k-NN is that it is automatically non-linear, it can detect linear or non-
linear distributed data, tends to perform very well even with lot of data points. Since the data
in our project is more I went for k-NN as it is more effective if the training data is large.

28
The default behavior is to use majority rule. That is, a sample point is assigned to the class
from which the majority of the K nearest neighbors are from. When using the consensus
option, points where not all of the K nearest neighbors are from the same class are not
assigned to one of the classes. Instead the output CLASS for these points is NaN for
numerical groups, '' for string named groups or <undefined> for categorical groups. When
classifying to more than two groups or when using an even value for K, it might be necessary
to break a tie in the number of nearest neighbors. Options are 'random', which selects a random tiebreaker, and 'nearest', which uses the nearest neighbor among the tied groups to
break the tie. The default behaviour is majority rule, nearest tie-break.
The knn classifier in MATLAB is declared as shown below:
Fig 26: Knn classifier function declaration in MATLAB
Class = knnclassify(Sample, Training, Group)
Where the sample we used is the output that we obtained from the wave decomposition of
extracted raw ECG signal i.e test_feat.
3.5 Process of Execution
The above Pan Tompkins algorithm (8), Discrete Wavelet Transform, k-NN classification
and databases are used to get the output. We can detect diseases namely cardiomyopathy,
myocardial infarction, bundle branch block, dysrhythmia and healthy normal from the ECG
signals provided by the PhysioNet.org. To check whether there the signal is a diseased one or
not we need to follow the below two steps:
We need to train the database files to the system designed for classification and this
training should be repeated every time if any new file is updated to the database.
In the Outset of this we will see the creation of .mat files which will hold the
properties of the ECG data signals that help us in the stage of classification, and we
need not always carry the database signals, it will be enough if we have these .mat
files which are saved under the Dataset folder.
Under testing we need to select anyone signal that needs to be classified on type of
disease it has. After testing is done we get a dialog box showing whether the tested
signal has some disease or not.

29
3.6 Comparison

30
CHAPTER 4
RESULTS
Training is something same like learning. In this paper, we are training ECG signals, to
predict the test ECG signal based on all trained ECG signals.
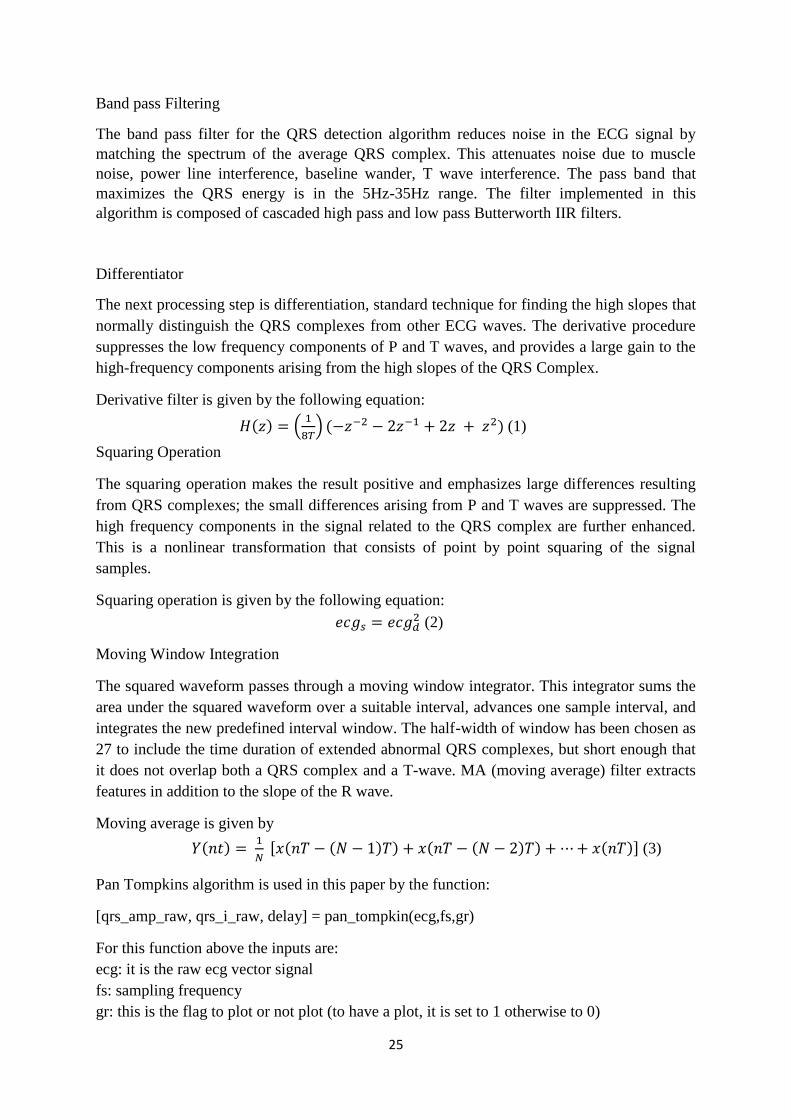
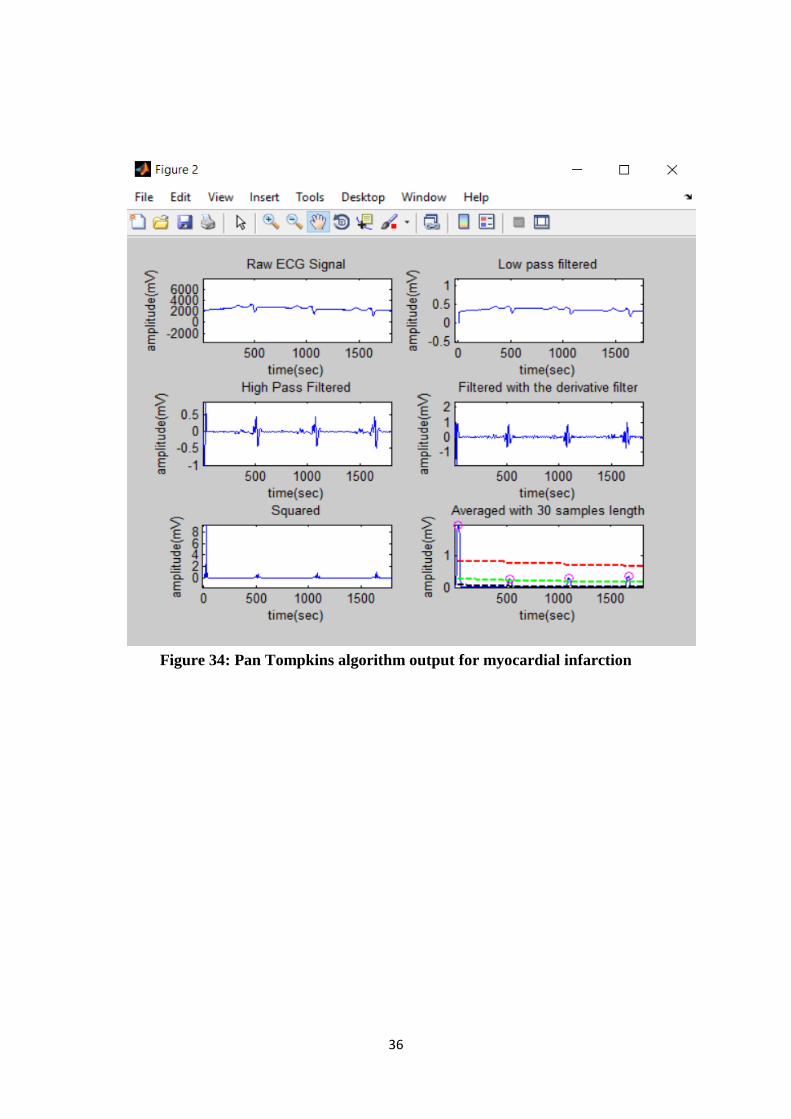
After the training is done, we go for testing of ECG signals, when testing is done we get raw
extracted ECG signal, Pan Tompkins algorithm (8) output for each signal which shows raw
ECG signal, output of low pass filter, output of high pass filter, output obtained after filtering
with derivative filter, output of squaring function, output averaged with 30 samples length,
QRS on filtered signal, QRS on MVI signal, Pulse train of the found QRS on ECG signal,
QRS extracted ECG signal, first differentiation, second differentiation, cumulative
differentiation on ECG signal, Dialog box showing that ECG suffers from particular disease.
4.1 Testing of Cardiomyopathy
Figure 27: Raw Extracted ECG signal of Cardiomyopathy
31
Figure 28: Pan Tompkins algorithm output for cardiomyopathy
32
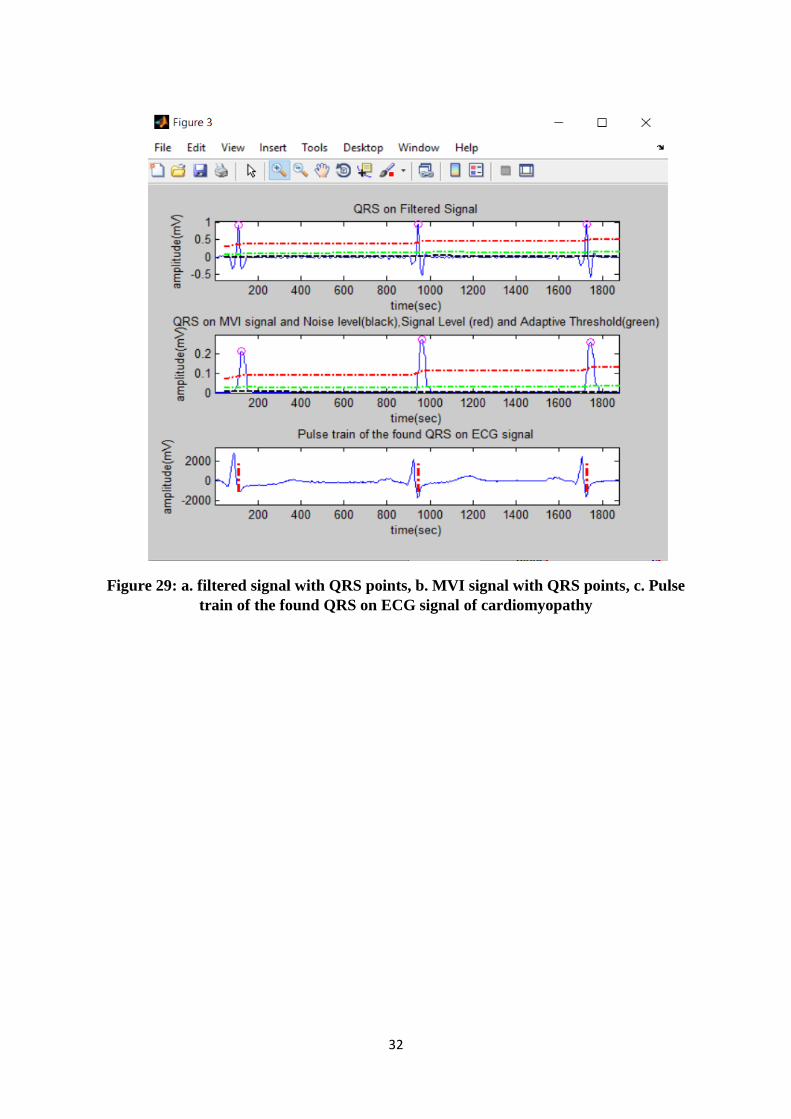
Figure 29: a. filtered signal with QRS points, b. MVI signal with QRS points, c. Pulse
train of the found QRS on ECG signal of cardiomyopathy

33
Figure 30: QRS extracted ECG signal for cardiomyopathy

34
Figure 31: a. 1st differentiation, b. 2nd differentiation, c. cumulative
differentiation of cardiomyopathy signal
Figure 32: Dialog box showing that ECG suffers from Cardiomyopathy

35
4.2 Testing of Myocardial Infarction
Figure 33: Raw Extracted ECG signal of myocardial infarction
36
Figure 34: Pan Tompkins algorithm output for myocardial infarction

37
Figure 35: a. filtered signal with QRS points, b. MVI signal with QRS points, c. Pulse
train of the found QRS on ECG signal of myocardial

38
Figure 36: QRS extracted ECG signal of myocardial infarction

39
Figure 37: a. 1st differentiation, b. 2nd differentiation, c. cumulative differentiation of
myocardial infarction
Figure 38: Dialog box showing that ECG suffers from myocardial

40
4.3 Testing of Dysrhythmia
Figure 39: Raw Extracted ECG signal of dysrhythmia

41
Figure 40: Pan Tompkins algorithm output for dysrhythmia

42
Figure 41: a. filtered signal with QRS points, b. MVI signal with QRS points, c. Pulse
train of the found QRS on ECG signal of dysrhythmia
43
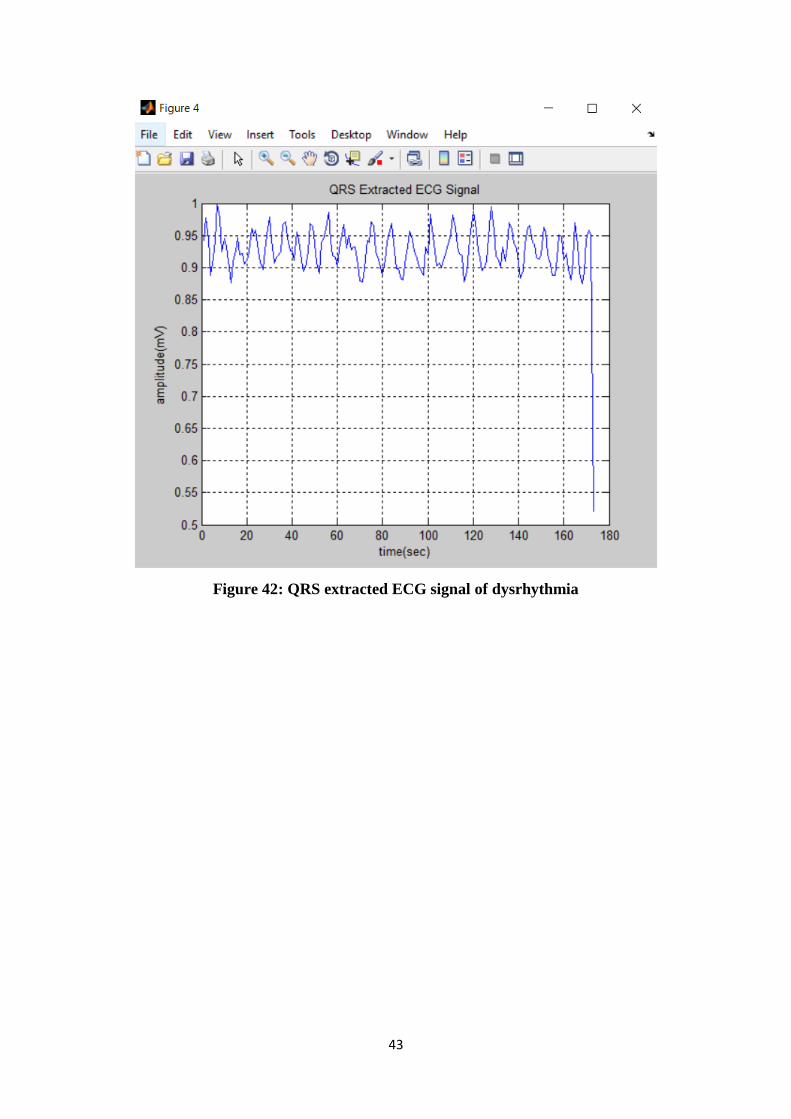
Figure 42: QRS extracted ECG signal of dysrhythmia

44
Figure 43: a. 1st differentiation, b. 2nd differentiation, c. cumulative
differentiation of dysrhythmia
Figure 44: Dialog box showing that ECG suffers from dysrhythmia

45
4.4 Testing of Bundle branch block
Figure 45: Raw Extracted ECG signal of bundle branch block

46
Figure 46: Pan Tompkins algorithm output for bundle branch block

47
Figure 47: a. filtered signal with QRS points, b. MVI signal with QRS points, c. Pulse
train of the found QRS on ECG signal of BBB
48
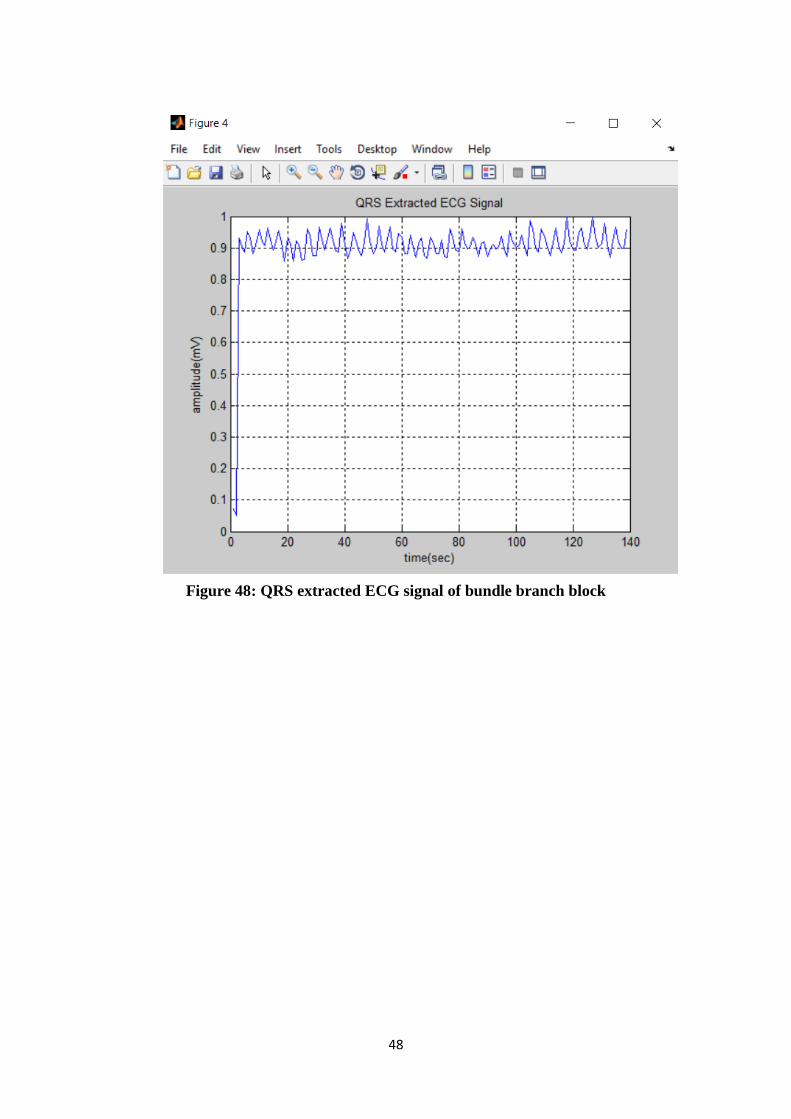
Figure 48: QRS extracted ECG signal of bundle branch block

49
Figure 49: a. 1st differentiation, b. 2nd differentiation, c. cumulative
differentiation of bundle branch block
Figure 50: Dialog box showing that ECG suffers from BBB

50
4.5 Testing of Healthy signals
Figure 51: Raw Extracted ECG signal of healthy signals

51
Figure 52: Pan Tompkins algorithm output for healthy signals

52
Figure 53: a. filtered signal with QRS points, b. MVI signal with QRS points, c.
Pulse train of the found QRS on ECG signal of healthy signals

53
Figure 54: QRS extracted ECG signal of healthy signals

54
Figure 55: a. 1st differentiation, b. 2nd differentiation, c. cumulative
differentiation of healthy signals
Figure 56: Dialog box showing that ECG is healthy

55
4.6 Accuracy
(7)
(8)
(9)
Table 4: Confusion matrix obtained when the value of k=1
Accuracy obtained when k=1 is 71.947
Table 5: Confusion matrix obtained when the value of k=3
Accuracy obtained when k=3 is 66.043
Table 6: Confusion matrix obtained when the value of k=5
Accuracy obtained when k=5 is 62.796

56
For the above obtained data, the input is taken as follows:
A - Myocardial Infarction – 50 signals
B – Cardiomyopathy – 5 signals
C – Dysrhythmia – 4 signals
D – Bundle branch block – 4 signals
E – Healthy signals – 12 signals
57
CHAPTER 5
CONCLUSIONS AND RECOMMENDATIONS
5.1 Conclusions and Recommendations
With the proposed system, we can classify 5 ECG signals into respective diseases.
The diseases we focused in this paper are cardiomyopathy, myocardial infarction,
bundle branch block, dysrhythmia and healthy signals. The reason for focusing only
on these 5 signals is that I could obtain the database of these five diseases itself. If
many types of diseases database are provided we could work on that and classify
those diseases as well. For obtaining more perfect results, more number of signals are
required so that each disease can be trained more effectively.
Only those diseases mentioned in this paper can be classified and any other diseased
signal is tested the algorithm would provide nearest result. That is one limitation in
this paper.
One biggest recommendation is that the results are obtained with best accuracy when
there are many signals which can be used for the training purpose.
So, finally I want to conclude the paper by bringing into readers view that all the
objectives mentioned in this paper are achieved successfully.

58
REFERENCES
1. Nurul Hikmah Kamaruddin, M.Murugappan and Mohammad Iqbal Omar, “Early
Prediction of Cardiovascular Diseases using ECG signal: Review” 2012 IEEE Student
Conference on Research and Development.
2. K. Vimala and Dr. V. Kalaivani, “Classification of Cardiac Vascular Disease from
ECG signals for Enhancing Modern Health Care Scenario”, Health Informatics - An
International Journal (HIIJ) Vol.2, No.4, November 2013.
3. Mahalakshmi and N.Nithya, “Removal of Noise and Diagnosis of Heart Diseases
using ECG Signal Processing,” International Conference on Trends in Mechanical,
Aeronautical, Computer, Civil, Electrical and Electronics Engineering (ICMACE14).
4. S. P. Kulkarni and Dr. K. V. Kulhalli, “DWT and ANN Based Heart Arrhythmia
Disease Diagnosis from MIT-BIH ECG signal data”, Volume: 3, Issue: 1,
International Journal on recent and Innovation Trends in Computing and
Communication.
5. Chaitra Sridhar, U Rajendra Acharya, Hamido Fujita, G. Muralidhar Bairy,
“Automated diagnosis of Coronary Artery Disease using nonlinear features extracted
from ECG signals”, Systems, Man, and Cybernetics (SMC), 2016 IEEE International
Conference.
6. M. Vijayavanam, V. Rathikarani and Dr. P. Dhanalakshmi, “Automatic Classification
of ECG signal for Heart Disease Diagnosis using morphological features.”
International Journal of Computer Science and Engineering Technology (IJCSET).
7. Sedghamiz. H, "Matlab Implementation of Pan Tompkins ECG QRS detector.",
March 2014.
8. PAN.J, TOMPKINS. W.J,"A Real-Time QRS Detection Algorithm" IEEE
Transactions on Biomedical Engineering, VOL. BME-32, NO. 3, MARCH 1985.
9. Duck Hee Lee, Jun Woo Park, Jeasoon Choi, Ahmed Rabbi and Reza Fazel-Rezai,
“Automatic Detection of Electrocardiogram ST Segment: Application in Ischemic
Disease Diagnosis”, International Journal of Advanced Computer Science and
Applications, Vol. 4, No. 2, 2013.
10. Sneha L.Patne and S. R. Khope, “ECG Denoising and Disease Detection”, Volume 6,
Issue No. 6, IJESC.

59
11. Nasreen Sultana, Yedukondalu Kamatham, Bhavani Kinnara, “Performance Analysis
of Artificial Neural Networks for Cardiac Arrhythmia Detection”, Advanced
Computing (IACC), 2016 IEEE 6th
International Conference.
12. Indu Saini, Dilbag Singh and Arun Khosla, “QRS detection using K-Nearest
Neighbor algorithm (KNN) and evaluation on Standard ECG databases”, Journal of
Advanced Research on 2012 July 6.
13. Mai Shouman, Tim Turner and Rob Stocker, “Applying k-Nearest Neighbour in
Diagnosing Heart Disease Patients”, International Journal of Information and
Education Technology, Vol. 2, No. 3, June 2012.
14. Emina Alickovic, Abdulhamit Subasi, “Medical Decision Support System for
Diagnosis of Cardiovasular Diseases using DWT and k-NN”, International Burch
University, Faculty of Engineering and Information Technologies.
15. M. Akhil jabbar, B.L. Deekshatulu, Priti Chandra, “Classification of Heart Disease
using K- Nearest Neighbor and Genetic Algorithm”, International Conference on
Computational Intelligence: Modeling Techniques and Applications (CIMTA) 2013.
16. Henry Ford health system. “EKG can show false positive readings for diagnosis heart
condition.” Science daily. 17 November 2009.
17. Ms. Kanwade A. B, Prof. Dr. Patil S. P and Prof. Dr. Bormane D. S, ”Wireless ECG
monitoring system.”
18. P.Khanja , S.Wattanasirichaigoon , J.Natwichai , L.Ramingwong , S.Noimanee,”A
web based system for ECG data transferred using Zigbee/IEEE technology” The 3rd
International Symposium on Biomedical Engineering (ISBME 2008)page no 109-112.
19. Elaheh Sayari, Mahdi Yaghoobi, “A model presented for classification ECG signals
on Case-Based Reasoning”, Journal of Soft Computing and Application 2013 (2013)
1-9.
20. The ECG Made Easy 8E (2013) by John R. Hampton.
![WorkinProgress: ANewApproachtoStudentLearningofReal ......DigiScope are a library of sampled ECG signals from the PhysioNet ECG database [1]. Once a filter is designed in DigiScope](https://img.pdfslide.net/doc/110x75/5e8eb63b10d1c91b4836c19d/workinprogress-anewapproachtostudentlearningofreal-digiscope-are-a-library.jpg)


![Biometric Identification Using JPEG2000 Compressed ECG Signals · Fig.1 Block diagram of the 2-D ECG compression scheme[14]. Fig.2 Typical ECG waveform in time-domain. 2.1 Signal](https://img.pdfslide.net/doc/110x75/5f087eac7e708231d4224a9b/biometric-identiication-using-jpeg2000-compressed-ecg-signals-fig1-block-diagram.jpg)