Embed Size (px)
Citation preview

Market Data / Supplier Selection / Event Presentations / User Experience Benchmarking / Best Practice / Template Files / Trends & Innovation
Digital Trends in Financial Services How industry leaders are responding to digital disruption In association with Adobe

Digital Trends in Financial Services In association with Adobe
Econsultancy London
4th Floor, Wells Point
79 Wells Street
London W1T 3QN
United Kingdom
Telephone:
+44 207 269 1450
http://econsultancy.com
Econsultancy New York
350 7th Avenue, Suite 307
New York, NY 10001
United States
Telephone:
+1 212 971 0630
All rights reserved. No part of this publication may be
reproduced or transmitted in any form or by any means,
electronic or mechanical, including photocopy, recording
or any information storage and retrieval system, without
prior permission in writing from the publisher.
Copyright © Econsultancy.com Ltd 2016
Published March 2016

Digital Trends in Financial Services In association with Adobe Page 3
All rights reserved. No part of this publication may be reproduced or transmitted in any form or by any means, electronic or mechanical, including photocopy, recording or any information storage
and retrieval system, without prior permission in writing from the publisher. Copyright © Econsultancy.com Ltd 2016
Contents
1. Foreword by Adobe ................................................... 4
2. Executive summary ................................................... 5
2.1. Methodology ......................................................................... 7
2.2. About Econsultancy .............................................................. 7
3. State of digital in financial services ........................... 8
4. Priorities, personalization and the customer experience ................................................................. 13
5. The digital sales imperative ..................................... 20
6. Digital budgets rise with the opportunity ............... 24
7. Priority and investment in marketing technology .. 26
8. Broker/Agent digital enablement ........................... 29
9. Appendix: Respondent Profiles ............................... 32

Digital Trends in Financial Services In association with Adobe Page 4
All rights reserved. No part of this publication may be reproduced or transmitted in any form or by any means, electronic or mechanical, including photocopy, recording or any information storage
and retrieval system, without prior permission in writing from the publisher. Copyright © Econsultancy.com Ltd 2016
1. Foreword by Adobe Digital Technology has never been easier than it is today and as Financial Services companies
execute on their Digital Marketing Strategy, the customer expectations and experience is center
stage. Customers demand to be delighted in real time whether they are engaged in mobile
banking, digital borrowing, e-trading or securing insurance products.
This is the era of the connected consumer. People today are consuming more content across more
devices than ever before in our history.
As a result, there is an explosion of data flowing through devices, servers and the cloud. More is
known about us than ever before: our demographics, purchase history, location, browsing
behavior online, and interactions with wearables, car, house and refrigerator. This flood of data is
overwhelming for many companies trying to understand what data to collect and how to leverage
this data back to the customer in order to be relevant to individual demands for a real time digital
experience.
In this new edition of the Digital Marketing Trends in Financial Services Report from
Econsultancy and Adobe, we surveyed over 330 executives in marketing and management
working in the financial services industry across North America and EMEA on the topics of
digital, disruption and the challenges in connecting the customer experience.
It’s important that we focus on financial services industry as retail banks, investment firms and
insurance companies have unique challenges in achieving and accelerating digital maturity in
2016 and beyond.
As the second in a series, this report takes advantage of year-over-year perspectives, but is also
very much concerned with new ideas, new trends and new questions. It also takes advantage of
comparison data from other cross-sector reports published by Econsultancy.
To help readers learn from their peers, this year’s findings also draw an important distinction
between companies that are ahead of the curve and those in the “mainstream.” The research
explores many useful and inspiring differences between these groups.
One year can make a real difference. Marketers in financial services report feeling significantly
more pressure from disruptive digital forces than they did in 2015, and that’s refining their views
on what they’ve achieved so far and their priorities for tomorrow.
At Adobe we believe that independent research is important to the industry as it informs and
challenges us. Just as importantly, studies like this act as a catalyst for conversations about the
state of financial services and its digital evolution. We hope this report is a help to you and your
organization moving forward.
Regards,
Violet Bell
Head of Financial Services, Adobe Digital Marketing

Digital Trends in Financial Services In association with Adobe Page 5
All rights reserved. No part of this publication may be reproduced or transmitted in any form or by any means, electronic or mechanical, including photocopy, recording or any information storage
and retrieval system, without prior permission in writing from the publisher. Copyright © Econsultancy.com Ltd 2016
2. Executive summary The financial services sector is under pressure. After a long period of relative stability, marketers
in retail banking, insurance and similar lines of business increasingly report that digital is
changing their competitive landscape.
Just last year, respondents to a similar survey were less likely than any other sector to say they
were threatened by disruptive forces. In twelve months, that figure has risen by 30%.
This report was produced by Econsultancy in partnership with Adobe. It explores the challenges
and opportunities that the digital shift presents to marketers in financial services and insurance
companies. It is based on a global survey of more than 330 executives based in North America
and the United Kingdom.1
Throughout the report, the wider industry is compared with a subset of companies that are at the
forefront of the industry. As the companies creating the change to which others are responding,
this group is referred to as “leaders.” A useful lens for comparison and inspiration, leaders display
important differences from the rest of the sample, dubbed the “mainstream.”
An industry in its digital teen years
With some variation by sectors, financial services resoundingly describes itself as being
in the early stages of digital maturity. With the narrow exception of investment firms, more
than half of other sectors’ respondents say that they are “Just getting started” or worse, that they
“Haven’t left the gate.”
Every company in the study has room to advance. As in other sectors, there’s not one perfectly
mature digital organization. However, the path to maturity is lit by the actions of the industry
leaders. Their investment in digital capabilities, technology and experimentation is detailed
throughout this report.
Reason to grow up
Wherever they are on the maturity spectrum, marketers in financial services understand that
digital readiness is their overarching priority because their path to growth is online. They’ve
already seen digital channels and content exert an increasing influence on sales, but their role in
direct sales is growing as well.
For the Mainstream, digital is an important source of revenue, producing more than one-quarter of their sales. For Leaders, it’s on the verge of being the most important source as digital channel contribution approaches 50%. While offline sources will remain vital for all types of financial
1 Please see the Appendix for more detail about the profile of responding organizations.
36%
46%
55%
27% 27%
37%
0%
15%
30%
45%
60%
Sales from digital channels2014
Sales from digital channels2015
Sales from digital channels –three year projection
Leaders Mainstream

Digital Trends in Financial Services In association with Adobe Page 6
All rights reserved. No part of this publication may be reproduced or transmitted in any form or by any means, electronic or mechanical, including photocopy, recording or any information storage
and retrieval system, without prior permission in writing from the publisher. Copyright © Econsultancy.com Ltd 2016
services company, looking ahead to the medium term future reveals that digital will be the defining channel for customer engagement and revenue growth.
Challenges defining financial services marketing organizations
The historical model of the industry relied on one-to-one interactions in person or over the
phone. Many younger people are fundamentally different from their parents in how they view
certain financial products and the companies providing them. They expect an easy, fast and
largely virtual customer experience. Appealing to this generation of customers is
overwhelmingly the top issue for the Mainstream.
Although that’s also a significant concerns for Leaders, compensating for new consumer habits
has already been baked into their current strategy. They have at least decided on new approaches,
if not solved the problem. For them, the threat is in the unknown or newly emergent
competition. Leaders may be driving change through innovation in products or processes, but
they’re highly aware that new territories can be claimed by anyone with an advantage in speed,
price or customer experience. New entrants have an enormous advantage in their singular focus
and ability to build from the start with that focus in mind.
Investing in a digital future
Many traditional routes to new customers are falling away. Brand advertising is losing efficiency
and in-person account management is giving way to a more virtual relationship. Marketers are
looking to and spending online to compensate. Online budgets in financial services have risen
steadily, and while 40% are keeping spending roughly level, 56% are increasing their 2016
budget, by an average of 20%.
More in Digital Trends in the Financial Services Sector
Where do executives see their key competitive threats emerging in the near term?
What are the benchmarks for digital budgets, digital traffic and digital influence?
Where are leading organizations investing in capability and technology?
How do marketers assess the component parts of customer experience for their impact and
difficulty?
What is the single most exciting opportunity for financial services marketers in 2016?
How are companies enabling and activating their broker/agent networks with digital tools
and marketing?
17%
37%
20%
26%
57%
43%
4%
32%
33%
36%
38%
57%
0% 10% 20% 30% 40% 50% 60%
Other
Less ability to support price premiums
Less demand for our types of product/servicedue to changing consumer habits
Eroding brand relationship/disintermediationfrom customers
Loss of market share to new players
Inability to appeal to new generations ofconsumers
Mainstream Leaders

Digital Trends in Financial Services In association with Adobe Page 7
All rights reserved. No part of this publication may be reproduced or transmitted in any form or by any means, electronic or mechanical, including photocopy, recording or any information storage
and retrieval system, without prior permission in writing from the publisher. Copyright © Econsultancy.com Ltd 2016
2.1. Methodology This report is based on an online survey conducted in December of 2015 and January of 2016,
using third-party providers for distribution as well as some internal Econsultancy lists.
Respondents from third-parties were offered an incentive to complete the survey. It closed on
January 17th with 283 qualified responses. The sample was comprised of executives in varied
financial services with the largest concentrations in retail banking, investment and insurance.
Senior managers make up 36% of the sample, which was limited to the United Kingdom and
North America.
Respondents were disqualified from the sample based on their knowledge in relevant areas,
geographic location and seniority. More information about the respondents can be found in the
Appendix at the end of this report.
2.2. About Econsultancy Econsultancy’s mission is to help its customers achieve excellence in digital business, marketing
and ecommerce through research, training and events.
Founded in 1999, Econsultancy has offices in New York, London and Singapore.
Econsultancy is used by over 600,000 professionals every month. Subscribers get access to
research, market data, best practice guides, case studies and elearning – all focused on helping
individuals and enterprises get better at digital.
The subscription is supported by digital transformation services including digital capability
programmes, training courses, skills assessments and audits. We train and develop thousands of
professionals each year as well as running events and networking that bring the Econsultancy
community together around the world.
Subscribe to Econsultancy today to accelerate your journey to digital excellence.
Call us to find out more:
New York: +1 212 971 0630
London: +44 207 269 1450
Singapore: +65 6653 1911
Digital Trends in Financial Services In association with Adobe Page 8
All rights reserved. No part of this publication may be reproduced or transmitted in any form or by any means, electronic or mechanical, including photocopy, recording or any information storage
and retrieval system, without prior permission in writing from the publisher. Copyright © Econsultancy.com Ltd 2016
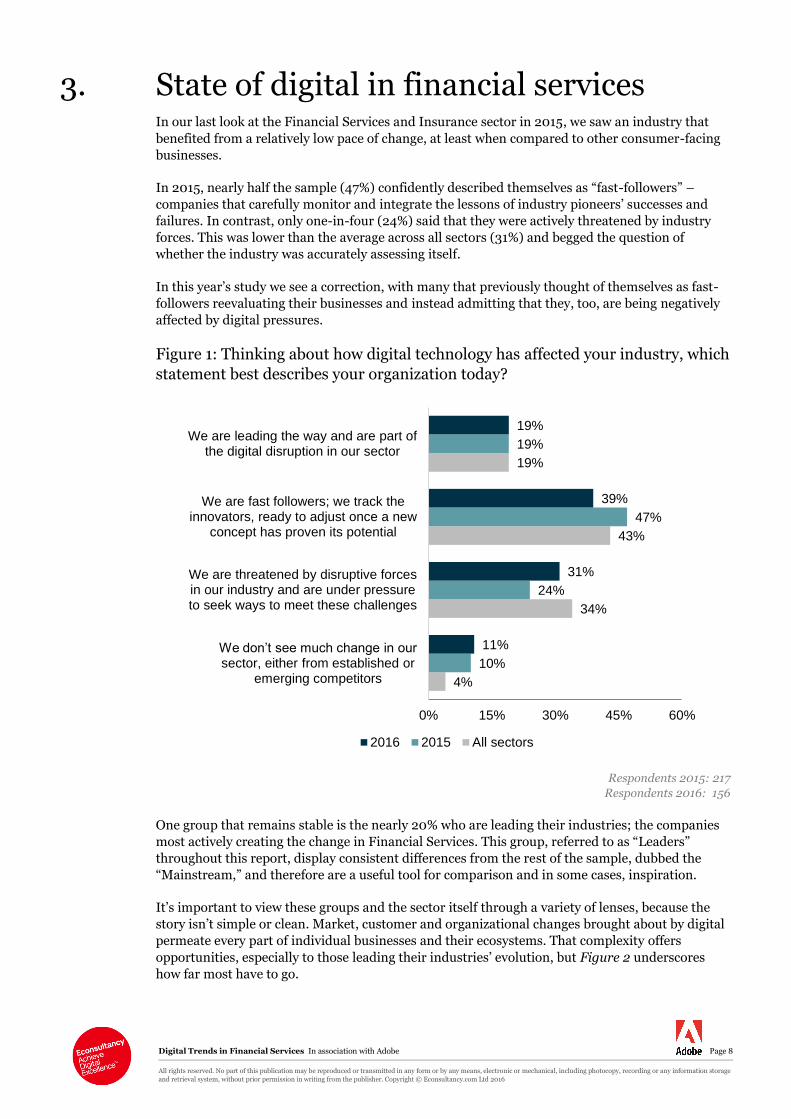
3. State of digital in financial services In our last look at the Financial Services and Insurance sector in 2015, we saw an industry that
benefited from a relatively low pace of change, at least when compared to other consumer-facing
businesses.
In 2015, nearly half the sample (47%) confidently described themselves as “fast-followers” –
companies that carefully monitor and integrate the lessons of industry pioneers’ successes and
failures. In contrast, only one-in-four (24%) said that they were actively threatened by industry
forces. This was lower than the average across all sectors (31%) and begged the question of
whether the industry was accurately assessing itself.
In this year’s study we see a correction, with many that previously thought of themselves as fast-
followers reevaluating their businesses and instead admitting that they, too, are being negatively
affected by digital pressures.
Figure 1: Thinking about how digital technology has affected your industry, which
statement best describes your organization today?
Respondents 2015: 217
Respondents 2016: 156
One group that remains stable is the nearly 20% who are leading their industries; the companies
most actively creating the change in Financial Services. This group, referred to as “Leaders”
throughout this report, display consistent differences from the rest of the sample, dubbed the
“Mainstream,” and therefore are a useful tool for comparison and in some cases, inspiration.
It’s important to view these groups and the sector itself through a variety of lenses, because the
story isn’t simple or clean. Market, customer and organizational changes brought about by digital
permeate every part of individual businesses and their ecosystems. That complexity offers
opportunities, especially to those leading their industries’ evolution, but Figure 2 underscores
how far most have to go.
4%
34%
43%
19%
10%
24%
47%
19%
11%
31%
39%
19%
0% 15% 30% 45% 60%
We don’t see much change in our sector, either from established or
emerging competitors
We are threatened by disruptive forcesin our industry and are under pressureto seek ways to meet these challenges
We are fast followers; we track theinnovators, ready to adjust once a new
concept has proven its potential
We are leading the way and are part ofthe digital disruption in our sector
2016 2015 All sectors

Digital Trends in Financial Services In association with Adobe Page 9
All rights reserved. No part of this publication may be reproduced or transmitted in any form or by any means, electronic or mechanical, including photocopy, recording or any information storage
and retrieval system, without prior permission in writing from the publisher. Copyright © Econsultancy.com Ltd 2016
With some variation by sectors, financial services resoundingly describes itself as being in the
relatively early stages of digital maturity. With the exception of Investment Firms, more than half
of other sectors’ respondents say that they are “Just getting started” or worse, that they “Haven’t
left the gate.”
The most extreme examples come from insurance, where the vast majority are still trying to
understand their play in digital. That’s related to its limited role beyond the initial research and
quote phase. The question for them is how to use one product as a beachhead for a long-term and
expanded relationship. The potential for personalization and optimization of content is
significant, and is an opportunity for those that get ahead of the industry.
Figure 2: Where is your company in its journey to digital maturity?
Respondents: 150
Why are these self-descriptions important? Besides providing an easy way for readers to
benchmark and evaluate themselves, the last two charts pointed out the opportunity that’s buried
in the complexity reforming for a digital future; that companies don’t have to emerge fully
transformed to be successful. Many “Leaders” describe themselves as early in their digital
journeys, and yet they are winning with discrete, specific steps in the right direction.
9% 7% 7% 8%
36%
79%
50%42%
42%
10%
37%
29%
9%
3% 7%
21%
3%
0%
10%
20%
30%
40%
50%
60%
70%
80%
90%
100%
Investment firm Insurance company Retail bank Other financialservices
Haven’t left the gate Just getting started Halfway there
We can see the finish line We are at our end state

Digital Trends in Financial Services In association with Adobe Page 10
All rights reserved. No part of this publication may be reproduced or transmitted in any form or by any means, electronic or mechanical, including photocopy, recording or any information storage
and retrieval system, without prior permission in writing from the publisher. Copyright © Econsultancy.com Ltd 2016
Figure 3: Thinking about disruption in your industry, what are your primary
concerns? Top two. Leaders vs mainstream
Respondents: 256
Nearly every respondent to the survey has faced changes in how their customers’ perceive their
industry in general and their brands specifically. That’s true in every sector, but financial services
has experienced higher than average turbulence, evident in its top concerns.
Appealing to a new generation of customers is overwhelmingly the top issue for the
Mainstream. The historical model of the industry relied on one-to-one interactions in person or
over the phone. Many younger people are fundamentally different from their parents in how they
view certain financial products and the companies providing them. They expect an easy, fast and
largely virtual customer experience.
It’s possible to view products and services individually, based on usability and price factors,
without seeing them in the context of a brand relationship. 36% cite concern with their eroding
connection to consumers in their top two challenges. In retail banking, for example, the
customer’s ideal is to minimize visits to physical branches, instead relying increasingly on website
and mobile apps. This creates opportunities for cost savings and digital up-selling, but it’s also
dangerous to companies without that digital agility.
Further complicating things for the mainstream is that people under 40 also behave differently as
shoppers and customers. Mobile lifestyles mean that even online experiences are short, small and
highly directed. Creating a great customer experience has as much to do with brevity as relevance,
setting up a challenging dynamic for marketers seeking to tell a story or even communicate a
simple message about new or complimentary products.
Although these are significant concerns for Leaders, compensating for new consumer habits
appears to have been largely baked into their current strategy. They have at least decided on new
approaches, if not solved the problem. For them, the threat is in the unknown or newly
emergent competition. Leaders may be driving change through innovation in products or
processes, but they’re highly aware that new territories can be claimed by anyone with an
advantage in speed, price or customer experience. New entrants have an enormous advantage in
their singular focus and ability to build from the start with that focus in mind.
17%
37%
20%
26%
57%
43%
4%
32%
33%
36%
38%
57%
0% 10% 20% 30% 40% 50% 60%
Other
Less ability to support price premiums
Less demand for our types ofproduct/service due to changing consumer
habits
Eroding brandrelationship/disintermediation from
customers
Loss of market share to new players
Inability to appeal to new generations ofconsumers
Mainstream Leaders

Digital Trends in Financial Services In association with Adobe Page 11
All rights reserved. No part of this publication may be reproduced or transmitted in any form or by any means, electronic or mechanical, including photocopy, recording or any information storage
and retrieval system, without prior permission in writing from the publisher. Copyright © Econsultancy.com Ltd 2016
Figure 4: What would have the biggest impact on the advancement of your
company’s digital maturity? Select your top three choices.
Respondents: 246
Financial Services marketers identify a variety of needs, but when they think about the
capabilities that tie into their digital maturity, their top choices align with the goal of customer-
centrism; understanding and speaking effectively to the end consumer.
First is the goal of establishing a practical, single customer view to rein in the complexity of
modern marketing. It’s a daunting challenge, especially for those companies with years of
acquisitions in their history and all of the accompanying systems and databases those deals
brought with them. This a clear area of advantage for start-ups in financial services, who are
unencumbered by their past and who can build to suit from the outset.
Even the most advanced companies are challenged by artfully joining up online with offline
data. Fortunately for many financial services companies, they have an advantage many don’t; a
rich supply of accurate data about their customers. From their initial applications through to their
interactions on desktop and mobile devices, financial services customers make sure that their
providers have the most up to date and accurate information possible.
At virtually the same level of priority is content management and deployment, which is the
natural expression of a customer-centric view. There’s little point to understanding the needs and
habits of customers if there’s not a capability in serving them with relevant, useful content. At
some companies the challenge is producing valuable content, but as digital businesses mature
they find that surfacing and managing content is the long-term issue.
39%
40%
49%
53%
55%
62%
0% 15% 30% 45% 60% 75%
Organizational alignment and/or executivesponsorship
Cross-channel campaign management
Personalization/1-to-1 targeted messagingon web and mobile sites
Efficient content management anddeployment
Multi-channel analytics – combine online and offline data
Single view of the customer/unifiedcustomer profile

Digital Trends in Financial Services In association with Adobe Page 12
All rights reserved. No part of this publication may be reproduced or transmitted in any form or by any means, electronic or mechanical, including photocopy, recording or any information storage
and retrieval system, without prior permission in writing from the publisher. Copyright © Econsultancy.com Ltd 2016
Figure 5: Where do you see the greatest competitive threats emerging in the
next 24 months? Leaders vs the rest
Respondents: 246
The distinction in where companies see threats is sharp and telling. The mainstream is looking
left and right at its traditional competitors for danger. Leaders are looking above, below and
behind for start-ups that are targeting their core businesses from a new, digital angle.
Those squarely in the mainstream may take this as cautionary inspiration. The first question to
ask is whether those traditional players truly constitute the most profound competition. Are they
offering improvements on the norm or real advancements?
Taking it further, if today’s competitors were overcome, what will tomorrow’s look like? By
reframing the threat from traditional players doing things better to emerging players doing new
things, organizations can instill a more innovative mindset.
57%
22%
16%
5%
37%
20%
40%
3%
0%
10%
20%
30%
40%
50%
60%
Competition fromtraditional players
Competition fromnew economy giants(Google, Microsoft,
Apple, etc.)
Competition fromstart-ups
Other
Mainstream Leaders

Digital Trends in Financial Services In association with Adobe Page 13
All rights reserved. No part of this publication may be reproduced or transmitted in any form or by any means, electronic or mechanical, including photocopy, recording or any information storage
and retrieval system, without prior permission in writing from the publisher. Copyright © Econsultancy.com Ltd 2016
4. Priorities, personalization and the
customer experience In last year’s study, we saw two strategic priorities dominate; attracting new clients and
improving the experience for existing ones. In this new survey, that dominance has grown and
equalized. Customer experience has grown in importance to statistically tie in terms of first choice
votes.
Undoubtedly, the drive to improve customer experience reflects some of the key challenges to
growth unearthed in Figure 2; appealing to new generations of customers and maintaining strong
brand relationships are increasingly seen as goals to be addressed by customer experience as
much if not more so than advertising.
Figure 6: What are your organization’s top priorities?
Respondents: 256
The focus on customer experience is warranted, especially for younger consumers who appear to
have less brand affinity than previous generations. For example, 68% of Millennials were more
likely than other age groups to switch financial institutions for reasons associated with access to
advanced and mobile technology.2
Approached as a discipline rather than simply an extension of user experience design, customer
experience management can, and should, positively impact many of the priorities in Figure 6,
above. But it’s a challenge to bridge the chasm to younger customers whose expectations around
customer experience can be markedly different and higher than their predecessors.
2 Makovsky Wall Street Reputation Study, 2015
5%
9%
7%
13%
32%
33%
9%
12%
15%
25%
18%
21%
8%
18%
21%
22%
15%
16%
23%
39%
43%
60%
64%
70%
0% 15% 30% 45% 60% 75%
Reduce costs to service customers
Deepen existing customer relationships(cross-sell, up-sell.)
Increase profit margin per customer
Increase customer retention
Provide consistent high-quality customerexperiences
Grow client base
First choice Second choice Third choice

Digital Trends in Financial Services In association with Adobe Page 14
All rights reserved. No part of this publication may be reproduced or transmitted in any form or by any means, electronic or mechanical, including photocopy, recording or any information storage
and retrieval system, without prior permission in writing from the publisher. Copyright © Econsultancy.com Ltd 2016
Figure 7: Which one area is the single most exciting opportunity for your
organization in 2016?
Respondents: 141
The things that excite us change as we mature. Looking at how the mainstream and leaders differ
in what they consider their most exciting opportunities, there’s an analogous difference. The
mainstream is still focused on more basic approaches to digital marketing, while the leaders have
shifted their focus to some of the more advanced possibilities.
Mainstream Leaders
Optimizing customer experience Real time personalization across channels
Data driven marketing Mobile
Cross channel marketing Marketing automation
Maturation is a process for most organizations. While some vault ahead using a broad technology
implementation or transformational effort, most proceed in an additive and often irregular way.
For example, the underpinnings of data driven marketing are fundamentally necessary to
successfully implement real-time personalization. Likewise automation is typically underutilized
without the knowledge that comes with customer experience optimization.
6%
3%
3%
14%
9%
11%
11%
9%
11%
23%
1%
4%
6%
7%
8%
8%
9%
10%
18%
29%
0% 10% 20% 30% 40%
Video to increase brand engagement
Location-based services that add placeand time to the customer relationship
Social marketing
Personalization of our marketing channelsin real-time
Creating compelling content for digitalexperience
Reaching and understanding our mobilecustomers
Using marketing automation to increaseefficiency and yield
Cross-channel marketing
Data-driven marketing that focuses on theindividual
Optimizing the customer experience
Mainstream Leaders

Digital Trends in Financial Services In association with Adobe Page 15
All rights reserved. No part of this publication may be reproduced or transmitted in any form or by any means, electronic or mechanical, including photocopy, recording or any information storage
and retrieval system, without prior permission in writing from the publisher. Copyright © Econsultancy.com Ltd 2016
Figure 8: Which one area is the single most exciting opportunity for your
organization in 2016?
Europe respondents: 84
North America respondents: 141
In many respects we see Europe and North America well aligned. The priorities and challenges of
financial services companies in both regions are far more similar than they are different. The
main area of difference is data. The technology and processes for creating, managing and
deploying marketing that’s controlled by companies’ first-party data is seen by European
respondents as their most exciting opportunity, in contrast with US companies’ focus on CX.
This isn’t a difference in philosophy, but in how respondents have approached digital marketing
technology and their own evolution. The pressure to associate marketing with empirical results
has grown quickly across the globe, but nowhere faster than in North America. Investment in
data-related technologies was pushed early in the region by external necessity and internal
demands.
A focus on customer experience is a focus on data-driven marketing, because the latter means
building the capability to collect customer inputs and learn from them. The next stage is to
expand from how data drives marketing to how it empowers the customer experience and
relationship.
1%
4%
6%
8%
8%
9%
9%
9%
10%
35%
1%
5%
6%
10%
6%
8%
12%
10%
26%
17%
0% 10% 20% 30% 40%
Video to increase brand engagement
Location-based services that add place andtime to the customer relationship
Social marketing
Personalization of our marketing channelsin real-time
Creating compelling content for digitalexperience
Reaching and understanding our mobilecustomers
Using marketing automation to increaseefficiency and yield
Cross-channel marketing
Data-driven marketing that focuses on theindividual
Optimizing the customer experience
Europe North America

Digital Trends in Financial Services In association with Adobe Page 16
All rights reserved. No part of this publication may be reproduced or transmitted in any form or by any means, electronic or mechanical, including photocopy, recording or any information storage
and retrieval system, without prior permission in writing from the publisher. Copyright © Econsultancy.com Ltd 2016
Figure 9: Which of the following statements best describes your company’s
ability to deliver personalized customer experiences?
Respondents: 257
Personalization is at the heart of marketers’ idea of the modern customer experience, and perhaps
the most important difference between the Mainstream and Leaders.
In theory, technology and data can combine with smart marketing and service to serve each
customer as an individual, but on a massive scale. In practice, the discipline of personalization is
still maturing. The challenges of merging data and knowing what to do with it are significant.
While optimizing communications in a single channel can be relatively straightforward, there’s
enormous complexity in bringing personalization to multiple channels. This is especially true
when attempting to personalize in meaningful way using first-party data; it means overcoming
disparate systems, varied data definitions and in most cases, organizational structure itself.
23%20%
45%
12%
51%
29%
17%
3%
0%
10%
20%
30%
40%
50%
60%
Multichannelpersonalization
based on digital andCRM data
Significantpersonalization, but
based mostly ondigital data
Somepersonalization but
limited to one or twochannels (e.g.
website and email)
No personalization
Mainstream Leaders

Digital Trends in Financial Services In association with Adobe Page 17
All rights reserved. No part of this publication may be reproduced or transmitted in any form or by any means, electronic or mechanical, including photocopy, recording or any information storage
and retrieval system, without prior permission in writing from the publisher. Copyright © Econsultancy.com Ltd 2016
Figure 10: Please rank the difficulty in mastering the following elements of
customer experience from 1 to 5, where 5 is “Most difficult” – Share of top rankings
Respondents: 144
Customer experience isn’t any one skill, capability or priority. It’s a collection of many elements
that involves an entire organization if it’s to be the focal point of growth. Many companies make
the mistake of defining customer experience narrowly, as a near synonym for usability. That
definition misses the point, because it’s focused on the individual moment, and not the
relationship as a whole.
Figures 10 and 11 compare how Leaders and the Mainstream view components of customer
experience through the lenses of difficulty and impact.
On top of both lists and for both groups is data, the underpinning of other activities and
fundamental to analysis and management of customer experience. Although the percentages are
similar, it’s of note that Leaders have a higher standard for how they use data, focusing on
advanced capabilities like real-time analytics and personalization.
Although process rates near the top of the difficulty rankings, it’s near the bottom for impact. If
done right, process should recede into the background from a customer’s perspective, but many
respondents may be overrating their mastery of building processes. In studies of organizational
transformation, research suggests that processes are too rarely evaluated for efficiency and can
outlast change management efforts.
For Leaders, culture is ranked as a strong second in its impact on customer experience. Culture
has many meanings in business, but in this context it’s about focus. Culture is how a company
expresses its true nature. If there’s a genuine priority to put the customer at the heart of every
47%
40%
33%
32%
40%
47%
47%
60%
33%
37%
37%
41%
41%
44%
45%
57%
0% 10% 20% 30% 40% 50% 60% 70%
Design – having well designed user journeys that facilitate clear communication and a seamless
transaction
Skills – combining digital marketing skills with analytics and technology
Culture – a cross-team approach with the customer at the heart of all initiatives
Collaboration - having tools that allow forstreamlined workflows between creative and content
marketers/web teams
Strategy – the cohesive plan, long-term view and executive support for the future of our customer
Technology – the tools to use data to create compelling, personalized, real-time experiences
Process – having the means and methods to ensure strategy is carried out efficiently
Data – having access and control over customer and marketing application data
Mainstream Leaders

Digital Trends in Financial Services In association with Adobe Page 18
All rights reserved. No part of this publication may be reproduced or transmitted in any form or by any means, electronic or mechanical, including photocopy, recording or any information storage
and retrieval system, without prior permission in writing from the publisher. Copyright © Econsultancy.com Ltd 2016
initiative it’s manifest in the culture. Teams work together more easily because they know they’re
working to the same ultimate purpose. The small expressions of friction that often accompany
cross-departmental collaboration disappear, and real problems are discussed frankly.
Finally is the curious case of design, where there’s significant discrepancy between Leaders, the
Mainstream and marketers from other sectors. Leaders say strongly that they find it difficult to
master the design of user journeys that work well and facilitate communication when they fail,
while the mainstream does not rank it highly. Both groups put design near the bottom for its
impact on success, and that’s where another interesting contrast arises. Marketers from all
sectors, when average, are 100% more likely to give design high marks for impact.
Figure 11: Please rank the importance of these elements of the customer
experience from 1 to 5, where 5 is “Most important to success” – Share of top
rankings
Respondents: 144
19%
19%
19%
25%
31%
31%
44%
56%
20%
22%
23%
31%
34%
38%
38%
51%
0% 10% 20% 30% 40% 50% 60%
Collaboration - having tools that allow forstreamlined workflows between creative
and content marketers/web teams
Design – having well designed user journeys that facilitate clear communication
and a seamless transaction
Process – having the means and methods to ensure strategy is carried out efficiently
Skills – combining digital marketing skills with analytics and technology
Technology – the tools to use data to create compelling, personalized, real-time
experiences
Strategy – the cohesive plan, long-term view and executive support for the future of
our customer
Culture – a cross-team approach with the customer at the heart of all initiatives
Data – having access and control over customer and marketing application data
Mainstream Leaders

Digital Trends in Financial Services In association with Adobe Page 19
All rights reserved. No part of this publication may be reproduced or transmitted in any form or by any means, electronic or mechanical, including photocopy, recording or any information storage
and retrieval system, without prior permission in writing from the publisher. Copyright © Econsultancy.com Ltd 2016
Figure 12: What role will mobile play in new account origination in the next 3
years? Leaders vs the rest
Can mobile really drive the purchase of complex, high value products and services? That’s an
important and enduring question in financial services, where the nature of the product set has
mitigated the impact of the mass migration from desktop to handheld device.
Among Leaders, the answer is a resounding “yes.” Fully two-thirds say that mobile will be a major
or primary source of new accounts in three years’ time, in contrast with the Mainstream, where
roughly that same share sees mobile as a limited or contributing channel, but not as a key driver.
Based on lifestyle and media usage patterns, the Mainstream may be overestimating the role of
traditional and desktop-digital channels. In contrast, Leaders are tracking (and committing to) a
much higher share of mobile driven accounts
Many companies create mobile enabled sites and/or applications and then rest easy. That’s not a
strategy for mobile, merely a must-have for doing business. In other sectors where mobile has
already penetrated every part of the sales cycle, organizations have already paid the price for
lagging in addressing the deeper questions of growth in a mobile world.
Financial services marketers are fortunate in that they have more time to adjust. But every day
that passes sees mobile traffic and conversion numbers rise. That means that today is a better
time to experiment, to learn and to fail than tomorrow.
25%
42%
25%
8%
13%
20%
33%34%
0%
5%
10%
15%
20%
25%
30%
35%
40%
45%
Mobile will be theprimary source
Mobile will be amajor source,
overtaking otherchannels in volume
Mobile will be asource equal toother options for
opening accounts
Mobile will be alimited source for
new accountopenings
Leaders Mainstream
Digital Trends in Financial Services In association with Adobe Page 20
All rights reserved. No part of this publication may be reproduced or transmitted in any form or by any means, electronic or mechanical, including photocopy, recording or any information storage
and retrieval system, without prior permission in writing from the publisher. Copyright © Econsultancy.com Ltd 2016
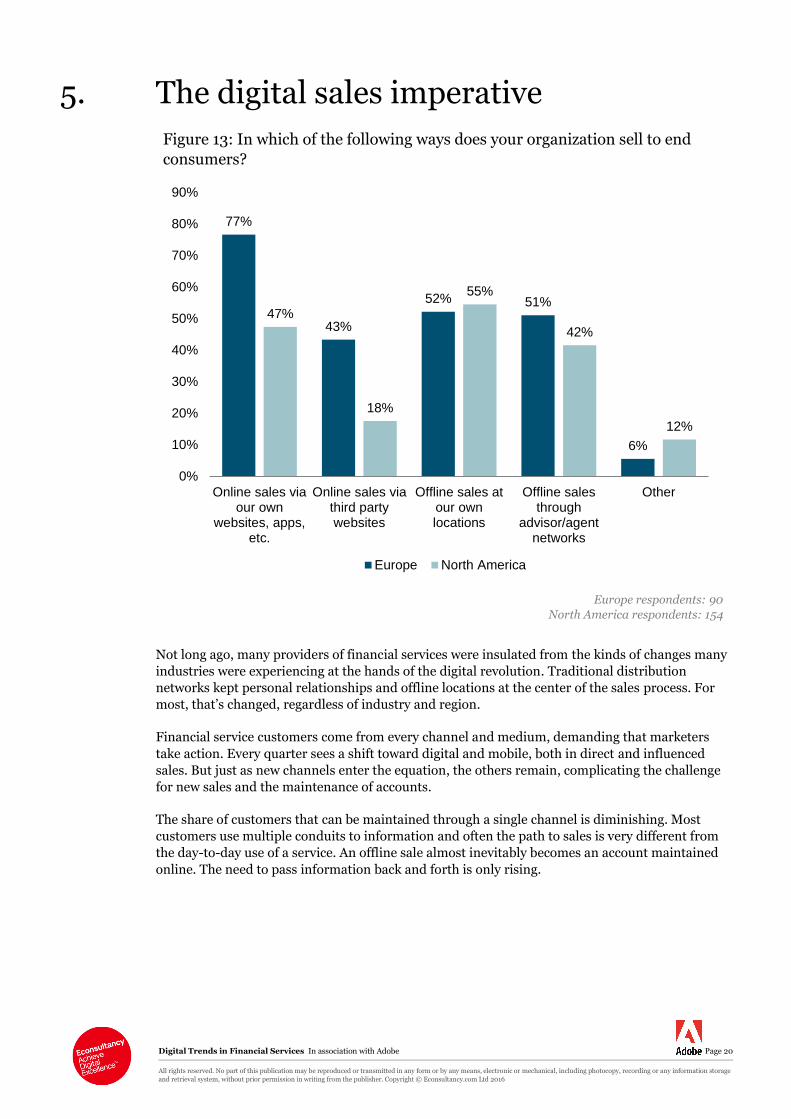
5. The digital sales imperative
Figure 13: In which of the following ways does your organization sell to end
consumers?
Europe respondents: 90
North America respondents: 154
Not long ago, many providers of financial services were insulated from the kinds of changes many
industries were experiencing at the hands of the digital revolution. Traditional distribution
networks kept personal relationships and offline locations at the center of the sales process. For
most, that’s changed, regardless of industry and region.
Financial service customers come from every channel and medium, demanding that marketers
take action. Every quarter sees a shift toward digital and mobile, both in direct and influenced
sales. But just as new channels enter the equation, the others remain, complicating the challenge
for new sales and the maintenance of accounts.
The share of customers that can be maintained through a single channel is diminishing. Most
customers use multiple conduits to information and often the path to sales is very different from
the day-to-day use of a service. An offline sale almost inevitably becomes an account maintained
online. The need to pass information back and forth is only rising.
77%
43%
52% 51%
6%
47%
18%
55%
42%
12%
0%
10%
20%
30%
40%
50%
60%
70%
80%
90%
Online sales viaour own
websites, apps,etc.
Online sales viathird partywebsites
Offline sales atour ownlocations
Offline salesthrough
advisor/agentnetworks
Other
Europe North America

Digital Trends in Financial Services In association with Adobe Page 21
All rights reserved. No part of this publication may be reproduced or transmitted in any form or by any means, electronic or mechanical, including photocopy, recording or any information storage
and retrieval system, without prior permission in writing from the publisher. Copyright © Econsultancy.com Ltd 2016
Figure 14: What percentage of your sales (new accounts from prospects and
existing customers) are ‘from’ and ‘influenced by’ digital channels?
Respondents: 208
Figures 14 - 18 clearly show that digital is already integral to sales in financial services and suggest
that the shift is accelerating. In the year since our last study, the share of sales influenced by
digital has risen significantly; today 36% say that it influences more than half of their sales, up
33% from 27% in 2015.
For the Mainstream, 27% of sales are directly from digital channels, unchanged from last year’s
study. But that figure rises to 46% for Leaders, who have increased online sales by 27% in the
interim.
Column Heading Sales from digital channels 2014
Sales from digital channels 2015
Sales from digital channels – three year projection
Leaders 36% 46% 55%
Mainstream 27% 27% 37%
Looking ahead, Leaders see digital as driving the majority of sales within three years. This is the
statistic that stands out, because it’s a window to the future. Leaders may be more digitally
focused by definition, but the innovative models and approaches they are pursuing today are the
template for the Mainstream’s tomorrow. Most telling perhaps is that over one-third of lagging
companies report obtaining less than 10% of sales from digital channels, compared to fewer than
one in ten among the Leaders.
This is a gap in time as well as revenue. With every passing month, Leaders learn more about
their digital customers and themselves. They become more facile with mobile, with empowering
31%
20%
14%13%
4%
6%5%
6%
3%
5%
20%
13%15%
11%
9% 9%
7% 8%
4%
8%
0%
5%
10%
15%
20%
25%
30%
35%
From digital channels Influenced by digital channels

Digital Trends in Financial Services In association with Adobe Page 22
All rights reserved. No part of this publication may be reproduced or transmitted in any form or by any means, electronic or mechanical, including photocopy, recording or any information storage
and retrieval system, without prior permission in writing from the publisher. Copyright © Econsultancy.com Ltd 2016
partners with digital, with analytics and managing customer experience…just to name a handful
of the skills and capabilities that will increasingly mean the difference between growth and
decline.
Figure 15: What percentage of your sales (new accounts from prospects and
existing customers) are ‘influenced by’ digital channels?
Respondents 2015: 182
Respondents 2016: 192
Figure 16: What percentage of your sales (new accounts from prospects and
existing customers) are ‘from’ digital channels?
Respondents: 192
11%
19%18%
14%13%
8%
5%6%
4%
2%
20%
13%15%
11%
9% 9%
7% 8%
4%
8%
0%
5%
10%
15%
20%
25%
2015 2016
9%
19%
9%
13%
6%
9%
3%
19%
3%
9%
34%
19%
14%12%
3%5% 5%
3% 2%3%
0%
5%
10%
15%
20%
25%
30%
35%
40%
Leaders Mainstream

Digital Trends in Financial Services In association with Adobe Page 23
All rights reserved. No part of this publication may be reproduced or transmitted in any form or by any means, electronic or mechanical, including photocopy, recording or any information storage
and retrieval system, without prior permission in writing from the publisher. Copyright © Econsultancy.com Ltd 2016
Figure 17: What percentage of your sales (new accounts from prospects and existing
customers) are ‘influenced by’ digital channels?
Respondents: 192
The role of digital is a dividing line between European and North American respondents. Looking
ahead three years, respondents in EMEA are far more likely to see digital being their primary
source of new sales, while those in the U.S. predict an increase that continues to be part of the
puzzle of sources.
Figure 18: What is your three-year percentage goal for sales (new accounts from
prospects and existing customers) from digital channels?
Respondents North America: 112
Respondents Europe: 69
7%
3%
17%
14%
7%
3%
10% 10% 10%
17%
34%
19%
14%12%
3%5% 5%
3% 2%3%
0%
5%
10%
15%
20%
25%
30%
35%
40%
0-10% 11-20% 21-30% 31-40% 41-50% 51-60% 61-70% 71-80% 81-90% 91-100%
Leaders Mainstream
4%
6%
10% 10% 10%
14%
5%
10%9%
4%
16%
21%
13%
10%
6%
5%
6%
2% 2%
5%
0%
5%
10%
15%
20%
25%
0-10% 11-20% 21-30% 31-40% 41-50% 51-60% 61-70% 71-80% 81-90% 91-100%
Europe North America

Digital Trends in Financial Services In association with Adobe Page 24
All rights reserved. No part of this publication may be reproduced or transmitted in any form or by any means, electronic or mechanical, including photocopy, recording or any information storage
and retrieval system, without prior permission in writing from the publisher. Copyright © Econsultancy.com Ltd 2016
6. Digital budgets rise with the opportunity
Figure 19: Are you planning to increase or decrease your digital marketing budget
in 2016?
Respondents: 234
Many traditional routes to new customers are falling away. Brand advertising is losing efficiency.
Marketers are looking and spending online to compensate. Online budgets in financial services
have risen steadily, and while they’re levelling off for roughly 40%, a larger share is continuing to
increase their investment. A mere 4% are cutting digital spending.
The increase is roughly 20%, with European average of 19% and 18% in North America. Leaders,
not surprisingly, are boosting digital budgets faster than the Mainstream, projecting an average
increase of 27% for 2016.
56%
39%
4%
Increase No change Decrease

Digital Trends in Financial Services In association with Adobe Page 25
All rights reserved. No part of this publication may be reproduced or transmitted in any form or by any means, electronic or mechanical, including photocopy, recording or any information storage
and retrieval system, without prior permission in writing from the publisher. Copyright © Econsultancy.com Ltd 2016
North America vs Europe
Figure 20: What percentage of your total marketing budget for 2015 will be spent
on digital marketing?
Respondents North America: 109
Respondents Europe: 67
7% 7%
10%
19%21%
16%
7%
4% 4%
1%
28%
19%
17%
14%
6% 6%
4% 4%2%
1%
0%
5%
10%
15%
20%
25%
30%
Europe North America
Figure 21: What percentage of your total marketing budget for 2015 will be
spent on digital marketing?
Respondents: 128
9%
19%
9%
13%
6%
9%
3%
19%
3%
9%
34%
19%
14%12%
3%5% 5%
3% 2%3%
0%
5%
10%
15%
20%
25%
30%
35%
40%
Leaders Mainstream

Digital Trends in Financial Services In association with Adobe Page 26
All rights reserved. No part of this publication may be reproduced or transmitted in any form or by any means, electronic or mechanical, including photocopy, recording or any information storage
and retrieval system, without prior permission in writing from the publisher. Copyright © Econsultancy.com Ltd 2016
7. Priority and investment in marketing
technology Figure 22: “Which of the following digital marketing technologies is your
company currently using?” and “What are your company’s top three priority
areas for technology investment over the next 12 months?”
Respondents: 192
Figure 22 compares the digital marketing technologies in use today with those in respondents’
twelve-month plans.
The greatest expected movement is in marketing automation and data management. Automation
appears to be a strong natural fit for financial services, given the complexity of products, long
buying cycles and varied buyer personas.
Implemented with accurate data and good strategy, marketing automation can address several of
the key challenges to financial services marketing – improving lead qualification and flow,
reducing marketing inefficiency and taking advantage of segmentation and personalization.
One surprise on the lower end is the low projection for programmatic buying and re-targeting in
2016 budgets, with only 8% placing it among their top priorities. Across most sectors the
capability to effectively work with programmatic media has been a key area for investment. Even
for those companies who are essentially limited to retargeting, the practice has proven successful
enough to warrant increased spending.
22%
23%
25%
28%
28%
28%
30%
30%
37%
42%
57%
12%
26%
26%
8%
8%
18%
21%
23%
18%
22%
21%
0% 10% 20% 30% 40% 50% 60% 70%
Marketing attribution/media mix modeling
Data management platform (DMP)
Marketing automation
Video advertising and analytics
Programmatic buying and re-targeting
Digital asset management
Multichannel analytics
Cross-channel campaign management
Responsive or adaptive design for mobile
Testing, targeting and optimization software
Social media platform (publishing, monitoring,etc.)
Currently using Top priority area

Digital Trends in Financial Services In association with Adobe Page 27
All rights reserved. No part of this publication may be reproduced or transmitted in any form or by any means, electronic or mechanical, including photocopy, recording or any information storage
and retrieval system, without prior permission in writing from the publisher. Copyright © Econsultancy.com Ltd 2016
Figure 23: Which of the following digital marketing technologies is your
company currently using?
Respondents: 197
The broad lesson of Figure 23 is clear. Modern marketing depends on having the right tools for
the job and Leaders have built that into their strategies and spending. They are not only outpacing
the Mainstream in specific areas, but in almost every case. They see the practice of digital
marketing as weaving a variety of interrelated strands of skills, capabilities and technologies.
Specifically, marketers making their case for next year’s budget allocations should look at
Leaders’ use of technologies for testing, targeting and optimization. These three capabilities
capture what’s different about digital marketing and what’s most exciting for any organization
with a complex sale that takes weeks or months to complete. Great marketing in this context isn’t
about big wins, but small ones. It’s iterative, with each new program or campaign variation
benefiting from the lessons of accurate data.
29%
32%
32%
35%
38%
38%
41%
41%
41%
59%
59%
28%
21%
21%
24%
29%
26%
28%
36%
25%
39%
57%
0% 10% 20% 30% 40% 50% 60% 70%
Digital Asset management
Marketing attribution/media mix modeling
Data management platform (DMP)
Marketing automation
Cross-channel campaign management
Video advertising and analytics
Multichannel analytics
Responsive or adaptive design for mobile
Programmatic buying and re-targeting
Testing, targeting and optimizationsoftware
Social media platform (publishing,monitoring, etc.)
Mainstream Leaders

Digital Trends in Financial Services In association with Adobe Page 28
All rights reserved. No part of this publication may be reproduced or transmitted in any form or by any means, electronic or mechanical, including photocopy, recording or any information storage
and retrieval system, without prior permission in writing from the publisher. Copyright © Econsultancy.com Ltd 2016
Figure 24: What are your company’s top three priority areas for technology
investment over the next 12 months?
With an advantage over the Mainstream in the technologies they’ve already got in place, there are
only three areas where Leaders’ priorities significantly outstrip their peers.
Unless data is handled by a trusted partner, most companies will find themselves investing in
some variation of a data-management platform in the near future. Put simply, DMPs are
specialized versions of the enterprise databases and data warehouses most companies have
employed for years. They are marketing-specific and allow the collection/importing of data,
before segmenting it and distributing across whatever media/network is desired. Nearly 40% of
Leaders put this capability among their top priorities for 2016.
Done right, marketing attribution can radically improve marketing efficiency. Many
organizations still practice limited attribution that over-values activities at the top or bottom of
the funnel, but increasingly more nuanced approaches are being adopted. The challenges of
attribution are significant, even as technology has eased the pain of implementation. The
analytical skills to take advantage of strong attribution capabilities are every bit as necessary as
the tools, whether they are brought in-house or found in a third-party.
Finally, as noted in Figure 22, only 8% of Mainstream marketers plan on adding more capability
in programmatic media buying. Leaders clearly see that benefit. 41% have already integrated
tools around programmatic/retargeting, with another 18% planning on joining them in 2016.
7%
18%
17%
22%
25%
19%
20%
17%
7%
11%
25%
11%
11%
14%
14%
14%
14%
18%
18%
18%
29%
39%
0% 15% 30% 45%
Video advertising and analytics
Testing, targeting and optimizationsoftware
Digital asset management
Cross-channel campaign management
Marketing automation
Multichannel analytics
Social media platform (publishing,monitoring, etc.)
Responsive or adaptive design for mobile
Programmatic buying and re-targeting
Marketing attribution/media mix modeling
Data management platform (DMP)
Leaders Mainstream

Digital Trends in Financial Services In association with Adobe Page 29
All rights reserved. No part of this publication may be reproduced or transmitted in any form or by any means, electronic or mechanical, including photocopy, recording or any information storage
and retrieval system, without prior permission in writing from the publisher. Copyright © Econsultancy.com Ltd 2016
8. Broker/Agent digital enablement Broker / agent distribution models play an important role for roughly half of the companies in
this survey. Their ability to drive sales isn’t just a question of the products and service they
represent; it also depends on how they are supported with tools, best practice information and
content.
Figure 25: To what degree does digital play a role in enabling brokers
/networks/advisors today?
Respondents: 100
Today, enabling partners at any scale is a digital enterprise. 73% of respondents say that digital’s
role is important or vital, but as we’ll see in Figure 26, there’s enormous room for improvement.
Producing and distributing great content, keeping up to date and providing easy to use tools for
brokers or agents is difficult, but it makes the difference between programs that help drive growth
and those that lie fallow.
What does excellence in this area look like? It can take many forms, but it should accomplish
several key objectives;
1. Use data to drive insights into how customers behave, what they want and how to provide it.
2. Use digital tools to minimize rote work and reduce error rates in data entry.
3. Manage and distribute content to augment advisor offerings to clients.
4. Offer tools to help advisors learn best practice and new, relevant skills.
5. Quickly and accurately answer advisor questions about products, service, processes and any
other information they need.
26%
47%
21%
6%
0%
5%
10%
15%
20%
25%
30%
35%
40%
45%
50%
Vital to enable them Important in enablingthem
In the mix of how weenable them
Not an importantcomponent of our
partner enablement

Digital Trends in Financial Services In association with Adobe Page 30
All rights reserved. No part of this publication may be reproduced or transmitted in any form or by any means, electronic or mechanical, including photocopy, recording or any information storage
and retrieval system, without prior permission in writing from the publisher. Copyright © Econsultancy.com Ltd 2016
Figure 26: What digital methods do you use in enabling your advisor networks
today and what are planned for 2016?
Respondents: 94
Advisor enablement in financial services is lagging behind its potential. One clear sign is that
intentions (those support systems planned for 2016) outpace reality (what’s used today) by
significant margins in some cases. Another is that the most basic program on the list, providing
information via email newsletters, is only offered by 53% of companies, even though they are easy
to create and inexpensive to provide.
It may be that those in charge of partner relationships don’t see sufficient impact of the programs
they’ve already put in place. It’s not enough to provide resources; the real challenge is getting
them to be used. Perhaps that explains the high level of interest in those methods that can help
partners with tactical issues.
Digital forms not only speed the process for the customer, they save time for partners in data
input. Perhaps more importantly, they also decrease the error rate of the data collected. In a time
when marketers are fixated on providing custom, personalized service using data management,
data quality is an enormous variable.
Applications on mobile devices assist partners in eliminating paper work and data entry, but
these tools have the potential to do much more. By studying the ways in which customers seek
information and proceed through the buying process, designers can design the experience to
minimize friction and assist the agent with information.
37%
40%
40%
43%
44%
49%
68%
51%
53%
55%
57%
45%
43%
53%
0% 10% 20% 30% 40% 50% 60% 70% 80%
Mobile optimized content
Mobile /tablet based applications withinteractive client facing content (research,
videos) and pitch presentations
Reports with popular content/content typesfor advisors' clients
Digital forms to expedite client on-boarding
Leads sourced from digital channels
Portals with custom content, productinformation and sales materials
Email newsletters
Used today Planned for 2016

Digital Trends in Financial Services In association with Adobe Page 31
All rights reserved. No part of this publication may be reproduced or transmitted in any form or by any means, electronic or mechanical, including photocopy, recording or any information storage
and retrieval system, without prior permission in writing from the publisher. Copyright © Econsultancy.com Ltd 2016
Figure 27: What are the challenges to using digital to enable youradvisor
networks?
Respondents: 100
As Figure 27 shows, the real devil in partner enablement is workflow.
Process is how an organization copes with changing needs. This applies to partners as well as
customers, and is every bit as demanding, getting the highest ranking among the challenges to
using digital in partner enablement.
Creating good, supportive content is just the beginning. Econsultancy’s research into this area
suggests that most content is significantly underutilized because so much emphasis is placed on
publication at the expense of support and integration.
While it’s challenging to provide resources for different skill levels, it’s a vast improvement
over the slow moving river of paper that is still the primary way many organizations communicate
with partners/advisors. Remarkably, as we saw in Figure 26, only 49% are using online portals
where information can be more easily customized and personalized for advisors/brokers with
different product responsibilities, digital skills or other unique characteristics.
27%
37%
41%
45%
50%
54%
0% 10% 20% 30% 40% 50% 60%
Supporting a variety of mobile devices
Low usage rates by brokers, agents oradvisors
Capabilities to personalize at scale
Managing resources for different levels ofdigital skills
Creating / managing all the content,educational and support materials
Keeping digital processes updated andcurrent

Digital Trends in Financial Services In association with Adobe Page 32
All rights reserved. No part of this publication may be reproduced or transmitted in any form or by any means, electronic or mechanical, including photocopy, recording or any information storage
and retrieval system, without prior permission in writing from the publisher. Copyright © Econsultancy.com Ltd 2016
9. Appendix: Respondent Profiles Type of Company
Figure 28: What type of financial services or insurance company do you work for?
Respondents: 332
Job role
Figure 29: What best describes your position at your company?
Respondents: 291
31%
26% 25%
19%
0%
5%
10%
15%
20%
25%
30%
35%
Other financialservices
Investment firm(Wealth
management, AssetManagement,
Brokerage, AdvisoryServices, etc.)
Insurance company Retail bank
8%
16%13%
15%
35%
2%5% 7%
0%
10%
20%
30%
40%

Digital Trends in Financial Services In association with Adobe Page 33
All rights reserved. No part of this publication may be reproduced or transmitted in any form or by any means, electronic or mechanical, including photocopy, recording or any information storage
and retrieval system, without prior permission in writing from the publisher. Copyright © Econsultancy.com Ltd 2016
Role in Technology Purchase
Figure 30: What is your role in digital marketing technology investment?
Respondents: 291
Geography
Figure 31: In which country or region are you based?
Respondents: 291
40%
38%
22%
I make investment decisions about digital marketing technology investment
I influence investment decisions
I advise and provide research on investment decisions
55%
30%
6%4% 3% 2%
0%
10%
20%
30%
40%
50%
60%
North America UK Asia Australia Other Europe (non-UK)

Digital Trends in Financial Services In association with Adobe Page 34
All rights reserved. No part of this publication may be reproduced or transmitted in any form or by any means, electronic or mechanical, including photocopy, recording or any information storage
and retrieval system, without prior permission in writing from the publisher. Copyright © Econsultancy.com Ltd 2016
Revenue
Respondents based in North America
Figure 32: What is your annual company revenue?
Respondents: 107
Respondents based in EMEA Figure 33: What is your annual company revenue?
Respondents: 65
29%
21%
17%
5%3%
26%
0%
5%
10%
15%
20%
25%
30%
35%
<$1 million $1– $10 million
$11 - $100million
$101-$150billion
$151 - $1billion
More than $1billion
9%
20%
12%11%
17%
31%
0%
5%
10%
15%
20%
25%
30%
35%
<£1 million £1 – £10 million
£10 – £50 million
£50 – £150 million
£150 million –£1 billion
More than £1billion