Embed Size (px)
Citation preview
January | 2019
Digital Twinning of Supply Chains:
An Orchestration Platform for Supply
Chain (Re) Design
THINK Executive White Paper Series
A Collaboration Between

Disclaimer, Limitation of Liability and Terms of Use
NUS and contributors own the information contained in this report, we are licensed by the contributors to reproduce the information
or we are authorised to reproduce it.
Please note that you are not authorised to distribute, copy, reproduce or display this report, any other pages within this report or
any section thereof, in any form or manner, for commercial gain or otherwise, and you may only use the information for your own
internal purposes. You are forbidden from collecting information from this report and incorporating it into your own database,
products or documents. If you undertake any of these prohibited activities we put you on notice that you are breaching our and our
licensors' intellectual property rights in the report and we reserve the right to take action against you to uphold our rights, which may
involve pursuing injunctive proceedings.
The information contained in this report has been compiled from sources believed to be reliable but no warranty, expressed or
implied, is given that the information is complete or accurate nor that it is fit for a particular purpose. All such warranties are expressly
disclaimed and excluded.
To the full extent permissible by law, NUS shall have no liability for any damage or loss (including, without limitation, financial loss,
loss of profits, loss of business or any indirect or consequential loss), however it arises, resulting from the use of or inability to use
this report or any material appearing on it or from any action or decision taken or not taken as a result of using the report or any
such material.
Presented at:
THINK EXECUTIVE SUMMIT:
JOURNEY TO DIGITALIZATION
DIGITAL TWINNING AND OPTIMIZING OF SUPPLY CHAINS
16 January 2019
Singapore


Digital Twinning of Supply Chains: An Orchestration Platform for Supply Chain (Re) Design
1
EXECUTIVE SUMMARY
This whitepaper marks the inauguration of the Advanced Executive Program in Supply Chain Innovation that
focuses on transformative ideation of supply chains and thence its operationalization of a selected
design. Digitalization, ecommerce and industry 4.0 have disrupted current practices calling for a revision of
managed events, processes, policies and outcomes that may have once served the business well but are now
being challenged at the fundamentals.
The complexity inherent in any supply chain makes it difficult to experiment with probable changes
piecemeal in a reductionist mode or even for that matter holistically ignoring the finer details – a balance is
required in orchestrating transformation. A granular approach, appropriate to the challenges posed in
migrating from an as-is to to-be model is proposed where the coarseness of data utilized or gathered is
commensurate with the problem statement under study.
This orchestration from an as-is to a to-be faces immense data challenges as one moves through several
transition phases, each perhaps requiring different modelling methods and progressively finer data tuning.
The physical supply chain is not easily tweaked. Authors have variously coined the term digital twinning
where the essential characteristics of the supply chain are captured in a digital model. However, such a digital
twin varies with modelling method, albeit visualization, to analytical to optimization or simulation. The twin
itself may vary in complexity and data requirements. It is our belief that we orchestrate to and fro with tools
best suited to the task but have a progressively finer matched data set that can be utilized across modelling
methods. This paper discusses this in some detail supported by examples from the many cases that the
Institute has undertaken.
Creating out-of-the-box ideas requires a sandbox for safe experimentation within the digital twins of
transformative ideas. The initial tools in the sandbox have been carefully picked and open to enhancements
as better castles need to be built with bridges across moats. The tools are organized to deliver interim
milestone results and data collection itself is progressive and matched to granularity required in the
respective digital twin.
We hope that you enjoy reading this whitepaper and that it provides some mapping in your digital journey
and that you will contribute to the ensuing discussion at the THINK Executive events.

Digital Twinning of Supply Chains: An Orchestration Platform for Supply Chain (Re) Design
2

Digital Twinning of Supply Chains: An Orchestration Platform for Supply Chain (Re) Design
3
TABLE OF CONTENTS
CHAPTER 1.
CHALLENGES IN THE DIGITAL SUPPLY CHAIN 4
CHAPTER 2.
LEVERAGING DATA TO DRIVE SUPPLY CHAIN INNOVATION FOR SUPPLY CHAIN (RE) DESIGN 9
CHAPTER 3.
SUPPLY CHAIN ORCHESTRATION PLATFORM – CONCEPTUAL DESIGN
12
CHAPTER 4.
SUPPLY CHAIN ORCHESTRATION PLATFORM STEP-BY-STEP 18
CHAPTER 5.
KEY TAKEAWAYS AND FUTURE WORK 25

Digital Twinning of Supply Chains: An Orchestration Platform for Supply Chain (Re) Design
4
Chapter 1.
CHALLENGES IN THE DIGITAL SUPPLY CHAIN
In this technology dependent world, digitalization is disrupting the way businesses perform across all
industries. The mass adoption of digital technologies influences the operations of companies’ logistics and
supply chain management. Smart and interconnected technologies, such as the Global Positioning System
(GPS), Radio Frequency Identification (RFID), cloud computing, and sensor devices have changed how
businesses interact with their consumers. Customer-centric strategies, innovativeness, flexibility and
responsiveness with higher emphasis on fulfilling consumer expectations are the key drivers in this digital
era. On a personal note, consumers are moving from traditional catalogue sales, brick-and-mortar retailers
to online e-commerce, using their smartphones devices and cloud operation platforms at one’s convenience.
With that, more consumers are
embracing and accepting the digital
economy. Technological trends,
internet penetration (as illustrated in
Figure 1.1) and online channel
purchasing (as illustrated in Figure 1.2)
demands businesses to alter their
approach to consumer demands. On-
time, reliability, cost-effective
deliveries, speed and convenience are
now key factors that draw consumers
in perceiving equal importance to its
price and quality of the purchased
product. The role of logistics has to
match the growing volume of demand
for pick and pack services.
Traditional supply chains with linear and long chains (as illustrated in Figure 1.3) may not be sufficient in this
digital era. Businesses need to be proactive in recognizing the ever-changing trends of consumer demands
and likewise shift to a more connected supply network (as illustrated in Figure 1.4), via digitally
interconnected devices and complex webs to keep pace with digital transformations. Today’s digital supply
chain needs to have the capabilities for extensive information availability, superior collaboration and
communication across chains. A lack of visibility, sub-optimal performance, unresponsiveness to uncertainty
and poor flexibility are growth-impeding constraints.
KEY FACTORS FOR SUPPLY CHAIN AND LOGISTICS
EXCELLENCE IN DIGITAL SUPPLY CHAIN:
On-Time, Reliability, Cost-Effective deliveries, Faster and
Convenience Delivery Services for different level of customer’s
expectations.

Digital Twinning of Supply Chains: An Orchestration Platform for Supply Chain (Re) Design
5
Note: Size of bubble denotes 3Y-CAGR e-commerce growth1
while yellow circles denote market leaders and growth
markets.
Figure 1.1. Plot of number of non-internet users against internet penetration across country markets2
Figure 1.2. Online channel purchasing across global markets3
1 Euromonitor International. (2017). Retailing. Retrieved from http://www.euromonitor.com 2 The World Bank. (2017). Individuals using the Internet (% of population). Retrieved from https://data.worldbank.org/indicator/IT.NET.USER.ZS 3 Raw data is taken from Euromonitor (www.euromonitor.com). The data includes sales through websites from both pure players and store-based retailers, excludes C2C sales; sales of motor vehicles and parts; ticketing, travel and holiday packages; online gambling; click-and-collect where payment is made in store; quick delivery services of food, magazines, households goods.

Digital Twinning of Supply Chains: An Orchestration Platform for Supply Chain (Re) Design
6
Figure 1.3. Traditional supply chain
Figure 1.4. Digital supply chain
Figure 1.5 outlines the elements and expectations placed on its respective determinants involved in the
digital supply chain. These, coupled with the business problems of today's supply chain, gathered from
several industry players (as illustrated in Figure 1.6), if not handled properly will cause problems and issues
in the supply chains, ultimately leading to high operational costs, poor company margins, unacceptable
service levels, and low productivity.

Digital Twinning of Supply Chains: An Orchestration Platform for Supply Chain (Re) Design
7
Figure 1.5. Digital Disruption Forming the Digital Supply Chain
Figure 1.6. Pain points of Industry Players
To transfer their traditional supply chain to digital supply chain, businesses conforming to such practices need
to address questions as follows:
“How to (re)design the supply chain network to be more robust and reliable for handling high
delivery demand?”
“What tool should be used to (re)design the supply chain network for digital transformation?”
“What needs to be revamped to mitigate supply chain network risks and losses in the face of
stochasticity?”
“Can high level responsiveness be maintained with minimum investment and resources deployed in
the supply chain?”
“Can a more adaptive tool be developed to minimize the gap of actual demand and planned
supply?”
Customer Centric
•Shorter delivery lead-time
•Narrower and more specific delivery time-windows
•On-demand logistics (a variety of small quantities)
•Highly fragmented dynamic demand
•Real-time tracking
•Delivery customization
Connected-Network and Visibility
•Information sharing
•Visibility to important information for all stakeholders
•The unified views of important information
•Stakeholder collaboration
Responsiveness
•Fast response to changing demand
•Flexibility to change supply and demand across the supply chain
•Dynamic planning, routing, scheduling and pricing
Automation
•Auto-capturing data
•Real-time information update
•Autonomous decision making
Predictive Deliveries
•Adjusting shipment to avoid delivery delay
•Predicting service disruption across the supply chain
•Detecting what customers want most

Digital Twinning of Supply Chains: An Orchestration Platform for Supply Chain (Re) Design
8
Although research has mentioned that digital supply chain transformation is very important for businesses4,
many companies still struggle to make progress with a view to digital supply chain transformation. One of
the main reasons for this is that the current available supply chain and logistics tools/platforms are not able
to efficiently address and handle digital supply chain complexities. Therefore, creating a more adaptive and
orchestrated platform for assets, business processes, and complex operations has become the imperative.
The following chapters discuss the orchestration platform and how Big Data and Machine Learning
technologies are used to develop simulation models as “digital” twins of the physical (real) supply chain
networks. These simulation models can be used to (re) design the ideal supply chain network through
identifying and evaluating transformative strategies to the supply chain networks.
4 For example: GT Nexus. 2016. The Current and Future State of Digital Supply Chain Transformation. http://mktforms.gtnexus.com/rs/979-MCL-531/images/GTNexus-Digital-Transformation-Report-US-FINAL.pdf, accessed 24.08.2018

Digital Twinning of Supply Chains: An Orchestration Platform for Supply Chain (Re) Design
9
Chapter 2.
LEVERAGING DATA TO DRIVE SUPPLY CHAIN INNOVATION
FOR SUPPLY CHAIN (RE) DESIGN
IOT and Big Data are at the heart of digital transformation. It produces enormous data and information that
can be in form of structured data such as delivery transactions and warehouse operational data, or
unstructured data from external resources and social media such as delivery feedbacks. If handled and
managed properly, this data can help generate smarter supply chain and logistics solutions and improve
decision making processes. Hence, many companies are rapidly evolving and investing large amounts of
funding and resources in trying to collect and transform data into competitive advantage. However, only
collecting (raw data) would not turn the data into business insights. Data processing and analytics, with
Artificial Intelligence (AI) and Data Mining (DM) technologies, are crucial.
As described in the previous chapter, one of the main problem faced by businesses today is “how to
(re)design the supply chain network to be more robust and reliable for handling high delivery demand”. Data
analytics and mining can be used to tackle this problem to generate transformative strategies to (re) design
the supply chain network. The (raw) data needs to be processed into the following steps as illustrated in
Figure 2.1.
Figure 2.1. Data Processes

Digital Twinning of Supply Chains: An Orchestration Platform for Supply Chain (Re) Design
10
Supply Chain Understanding and Requirement
This step involves understanding what supply chain aspects are to be improved or identification of the supply
chain problems to be addressed before re-designing the supply chain network. Bottlenecks and important
problems need to be clearly identified. To do that, relevant data such as the current supply chain network,
supply and demand flow, measurement and performance indicators, are needed. Benchmarking from other
supply chain networks in the same or different industries may also be beneficial to identify improvement
aspects. At this stage, identifying and defining the problems, relevant data associated with that problems as
well as exploring the data relationships to discover main insights are the main contributors.
Data Collection and Acquisition
After the problems in the supply chain and required data are identified, the next step is to gather these data.
This step focuses on data availability, accessibility and sufficiency. Relevant data is collected from different
sources, such as Enterprise Resource Planning (ERP) system, sensors, machine generated, social media and
external web services. It can be structured or non-structured data, in the format of text, picture, audio or
video.
Data Processing
The collected data may be incomplete, duplicate or contain errors. For example, the same demand data may
be inserted multiple time or timestamp of the demand does not match with the demand fulfilment. It need
to be cleaned before subsequent analyses. This process would include matching record, identifying potential
data inaccuracies, making computations for missing data, removing outliers, removing duplications, and
formatting the data. Simple data analytics techniques can be applied in this step.
Data Modelling and Algorithm Designing
In this step, mathematical formulas, mathematical/optimisation/simulation models and/or algorithms may
be applied to the data to model the supply chain network. It generates insights by identifying relationships
among variables, finding patterns from the data, predicting what is likely to happen and optimising solutions
by using what-if scenarios to evaluate transformative strategies for (re) designing the supply chain network.
Examples of the methods that can be used in this step are illustrated in Figure 2.2.
Figure 2.2. Examples of method for data modelling and algorithm design

Digital Twinning of Supply Chains: An Orchestration Platform for Supply Chain (Re) Design
11
Data Communication, Visualisation and Reports
Once the data is modelled and analysed using one or more modelling methods and algorithm designs, the
information, along with insights and results from the model, can be reported in many formats for
communication with the relevant decision makers. The supply chain network and its improvement strategies
can be visualised as a GIS map (as in Figure 2.3.), graphs (as in Figure 2.4.), tables or any other report formats.
Supply Chain Innovation
Based on the insights and results from visualization of one’s supply chain and its potential improvement
strategies, the decision makers would be able to take action to transform their network design. It may result
in new incremental or radical innovations in the supply chain network. This innovation would be derived from
the data and the model used. It would be recorded and updated into the system as new knowledge and
insights and can be used for further analysis to derive future innovation.
Figure 2.3. GIS Visualisation of the Green Field Analysis Result
Figure 2.4. Graph Reporting for Model Performance Comparison
Digital Twinning of Supply Chains: An Orchestration Platform for Supply Chain (Re) Design
12
Chapter 3.
SUPPLY CHAIN ORCHESTRATION PLATFORM –
A CONCEPTUAL DESIGN
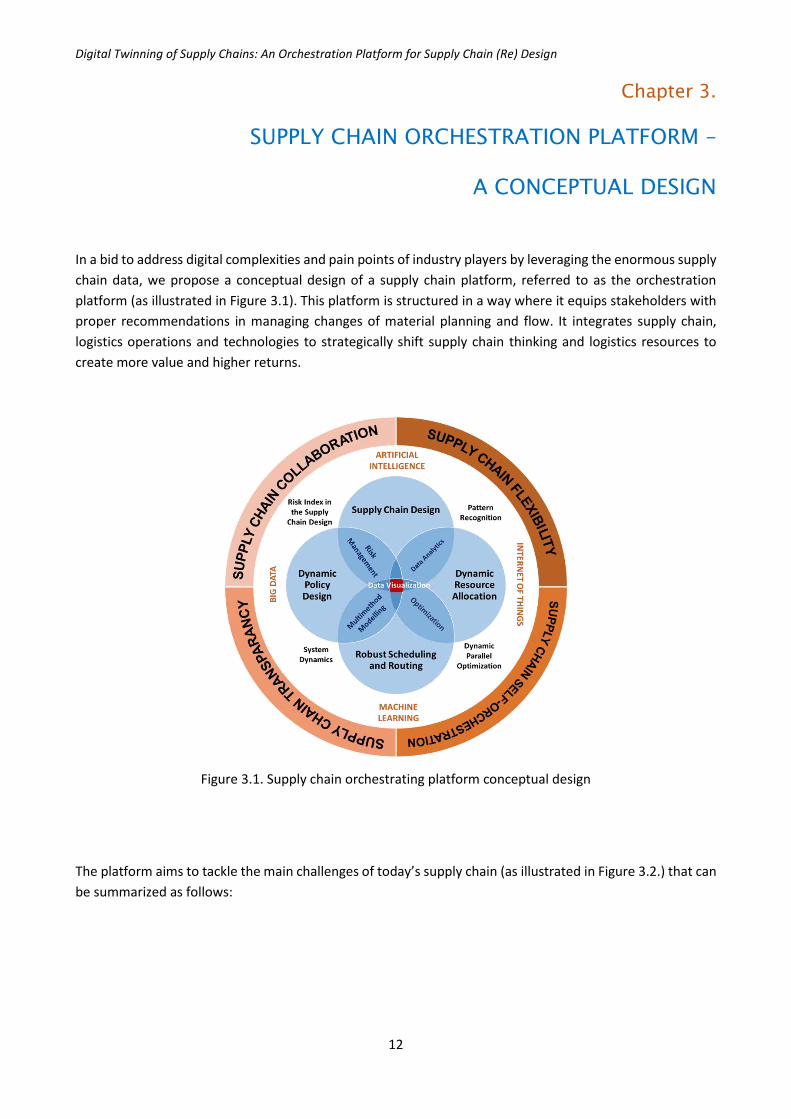
In a bid to address digital complexities and pain points of industry players by leveraging the enormous supply
chain data, we propose a conceptual design of a supply chain platform, referred to as the orchestration
platform (as illustrated in Figure 3.1). This platform is structured in a way where it equips stakeholders with
proper recommendations in managing changes of material planning and flow. It integrates supply chain,
logistics operations and technologies to strategically shift supply chain thinking and logistics resources to
create more value and higher returns.
Figure 3.1. Supply chain orchestrating platform conceptual design
The platform aims to tackle the main challenges of today’s supply chain (as illustrated in Figure 3.2.) that can
be summarized as follows:

Digital Twinning of Supply Chains: An Orchestration Platform for Supply Chain (Re) Design
13
Figure 3.2. Main Challenges addressed through the orchestration platform
Supply Chain Transparency
Coordinated information sharing through the entire chain is still not a common practice, hence making
information available and visible across the supply chain remains as the main challenge. Functional and
geographic silos that do not share information openly often characterise traditional supply chain. Generally,
huge data amounts generated by digital technologies are stored in a complex and non-structural form that
are not machine-readable. This leads to sub-optimal performance of the supply chain which are influenced
by poor demand planning and management, high operating cost due to excessive inventory, high product
return rates (and claims), and poor service levels due to stock-out.
The orchestration platform intends to leverage various cutting-edge technologies (e.g. Big Data Analytics and
Learning algorithms) to provide seamless integration for all processes and activities in the supply chain with
secure information sharing. It would ensure that all parties have the same unified view of the database to
process real-time information automatically. It will permit a supply chain to respond effectively to increased
supply and demand, modal choices and demand volatility. Leveraging on the novel data analytics
technologies and research, the platform would be able to handle big data processing offering a secure
platform for digital supply chain transactions. It would also enable innovative and collaborative business
models.
Supply Chain Collaboration
Uncoordinated execution by supply chain partners, particularly in the last-mile stage, could result in high
costs, low productivity, and resource wastage. With limited resources, supply chain and logistics activities
have to be managed in innovative ways to ensure timely order fulfilment. Collaboration is a strategic term
for integrating different technologies, processes, resources, and networks to achieve the optimal operations
with an efficient use of resources. One common approach of supply chain collaboration is delivery
consolidation, where data exchange, demand clustering, and resource management of more than one
stakeholder are synchronous.
The orchestration platform would enable information sharing across the supply chain to encourage both
vertical and horizontal collaboration between the stakeholders. Horizontal collaboration for stakeholders
having similar logistics requirements can take advantage of potential distribution synergies, such as

Digital Twinning of Supply Chains: An Orchestration Platform for Supply Chain (Re) Design
14
distribution consolidation and transportation sharing. For example, using Artificial Intelligence (AI) and
machine learning algorithms, the platform would be able to predict the demand fluctuation and fulfilment
patterns. These patterns can be matched with patterns from other stakeholders for joint
deliveries/fulfilment. It would reduce supply chain and logistics inefficiency by increasing the fill rate of
logistics assets and increase the overall utilisation of the logistics assets.
Supply Chain Flexibility
Fragmentation and a stochastic supply chain network hinders the process and operations flexibility. This
nature of supply chains may require significant time and effort to make simple changes. The orchestration
platform would enable real-time planning of inventory and delivery milk runs to dynamically optimise and
configure the supply chain to accommodate changing parametric values such as change or substitution of
vendor, order quantity, safety stock and lead time. Dynamic optimisation and multi-scenario simulation are
the main tools to help networks self-reconfigure to achieve the flexibility. The platform would enable
flexibility in determining the distribution network and configuration. With the exploration of multiple
scenarios, it would be able to provide more robust solutions that can be evaluated under different kind of
criteria.
Supply Chain Self-Orchestration
With the continuing digital transformation and the ever-changing consumer landscape, long chains,
functional and geographic silos, majority of the current supply chains face difficulties to adapt and respond.
A discrepancy between production quantity, customer sales forecast, and the actual sales may result in lower
sales, while incurring higher out of stock rate and inventory disposal expenses.
The orchestration platform consisting of intelligent engines will seek to understand the customers’ demands
and reduce the discrepancy between production quantity, customer’s forecast, and the actual sales. Using a
novel machine-learning algorithm, it would reveal demand insights and provide suitable forecasting
mechanisms in order to maximise revenues, reduce costs/losses/risks within the chain, increase
responsiveness with minimum investment and manpower usage, and minimise the gap of demand and
planned supply mismatch. Ultimately, it would recommend the “optimum” supply chain network by auto-
configuring the networks and parameters to fulfil the demands. This conceptual design of the orchestration
platform can be applied by adopting both the supply chain modules with the current technologies to seed
new growth niches, boost its capabilities and translate to a stack of modules as illustrated in Figure 3.3. The
conceptual platform has an integrated AI powered engine core with multimethod modelling and optimisation
that provides possibilities for different scenario experimentation, visualisation and decision dashboards to
give rise to a unique control tower.
The features in the orchestration platform are divided into three main features, namely: control tower
interface, intelligent engine and data configuration and controller.
Control Tower Interface
The control tower interface is used to interact with the user and visualize the information and results to the
users. The functionalities in this feature can be divided into four groups, namely:

Digital Twinning of Supply Chains: An Orchestration Platform for Supply Chain (Re) Design
15
AS-IS Visualization and Modelling Interface
GIS visualization for supply, demand and existing supply chain are the core for this AS-IS interface. It
graphically shows the existing supply chain to identify bottleneck, risks and insights for improving the
supply chain.
Figure 3.3. Orchestration Platform Modules
To-Be (Ideal) Modelling Interface
To-Be (Ideal) interface would be used to produce ideal (optimal) scenarios for a particular supply
chain, without considering constraints from the industries or companies. For example, this interface
will be used to conduct Green Field Analysis (GFA) to identify potential locations for additional
warehouses in a particular area or identify risk analysis for a specific supply chain design. It would be
integrated with intelligent engine feature to develop models using various techniques such as
simulation, optimization and machine learning.
To-Be (Real) Modelling Interface
To-Be (Real) interface would be used to improve the To-Be (Ideal) scenarios for implementation
purposes. The scenarios would be generated by considering real constraints from the industries and
companies, such as limited funding for constructing a new warehouse or land-use regulation for a
particular location.

Digital Twinning of Supply Chains: An Orchestration Platform for Supply Chain (Re) Design
16
Dynamic Planning and Monitoring Interface.
This interface can be used for transportation digitalization by providing a dynamic planning and
monitoring of the operation supply chain and logistics activities based on the To-Be (Real) supply
chain design.
Intelligent Engines
The orchestration platform would be equipped with intelligent engines to generate scenarios and solutions
that will be presented by the control tower interface. Specific engines for supply chain as well as core
intelligent engines are integrated in this platform. Different engines (or different combination of engines)
would be selected to solve a specific supply chain problem. For example, supply chain network design tool
would be selected to determine alternative location for new warehouse, while optimization algorithm in
scheduling and routing tool would be selected to produce cost-effective delivery routes.
The integrated engines would create digital twinning of the “physical” supply chain network for evaluating
possible improvement scenarios and solutions. The results from these intelligent engines would be sent to
and presented in the control tower interface.
Data Configurator and Controller
This feature would capture the data and information from different data source (such as transaction
database, social media or sensor data) and store it in the one integrated database. Due to the variability of
the data, some data may need to be cleaned before it is used by the intelligent engines.
Interplay of Modules in Supply Chain Self-Orchestration
To tackle certain business challenges, different modules in the self-orchestration platform can be used.
Examples of solution methods for re-designing the supply chain network are illustrated in Figure 3.4. Several
control tower interface features combined with different intelligent engines such as data visualization, data
analytics, simulation, optimization and supply chain network design tool are applied to produce the “optimal”
supply chain network.

Digital Twinning of Supply Chains: An Orchestration Platform for Supply Chain (Re) Design
17
Figure 3.4. Modules for (Re) Designing Supply Chain Network
Value-Added GIS Visualization: A GIS visualization module is used to visualize key information (such as
demand) to provide preliminary insights.
Supply/Demand Clustering: Using the visualization and data analytics engine, demand can be clustered
to identify demand delivery patterns.
Green Field Analysis: Next step, Green Field Analysis (GFA) is use to identify the number of suitable
locations for supply chain nodes based on its relevant cost structure.
Supply Chain Network Design: Network Optimization and simulation are then used to find the best
configuration of a supply chain network structure as well as the flows based upon an objective function,
which typically maximizes profits.
It is important to stress that having a continuous set of data available and accessible by the intelligent engines
is necessary before we can use the orchestration platform. We can start by using a minimum set of data to
solve a particular problem in the supply chain network. The data template would be provided in the
orchestration platform. This data can be progressively and continuously populated for solving a more
complex problem. The data can be used not only to model the supply chain network but also to conduct
experiments to identify and evaluate the transformative strategies. The quality of data would determine the
quality of the models and results that the orchestration platform generated.
For the sake of completeness of the end-to-end supply chain, the platform will also allow downstream add-
on modules and new research concepts integrated within an industry robust data architecture.

Digital Twinning of Supply Chains: An Orchestration Platform for Supply Chain (Re) Design
18
Chapter 4.
SUPPLY CHAIN ORCHESTRATION PLATFORM
STEP-BY-STEP
An example on how the proposed supply chain orchestration platform is used to tackle a supply chain
network problem is described in this chapter.
Required Data
Minimum set of data required for this orchestration platform are as follows:
1. Network Distribution Data
Relevant data on the existing network and distribution (consist of locations of facilities, costs, capacities,
available resources), facility costs, transportation assets, transportation costs and existing routes need to
be collected.
2. Transaction Data
Daily transaction data for supplies, demands and delivery schedules are needed. It can be extracted from
the Enterprise Resource Planning (ERP) system and stored in a particular Database Management System
(DBMS) such as MySQL or MS SQL Server. Sensor and telematics data from the vehicles or other logistics
assets can also be included to present the actual movement of the goods, vehicles and logistics assets.
3. Other data
Company policies and considerations are needed to determine the implementable solutions.
Due to incomplete data, several assumptions may need to be used. For example, the demand data may only
include the weight of the delivery demand. The dimension of the delivery demand is not available. We use a
certain formula to convert the weight into the dimension.
Modelling Steps
The supply chain modelling in this orchestration platform would include the three necessary development
steps, namely: 1) “AS-IS”, 2) “TO-BE” (Ideal) and 3) “TO-BE” (Real) model development as illustrated in Figure
4.1.

Digital Twinning of Supply Chains: An Orchestration Platform for Supply Chain (Re) Design
19
Figure 4.1. Modelling Steps
“AS-IS” Model
The “AS-IS” model is developed to understand the existing supply chain network conditions, including the
configuration, operational requirements and bottlenecks. This “AS-IS” model is used as the benchmark for
any proposed adjustments. Thus, this model is also called the “Base” model.
Using the available data, the current supply chain network can be visualised and modelled. This visualisation
and modelling will be used to understand the existing situation and identify potential aspects that can be
improved in “TO-BE (Ideal)” and “TO-BE (Real)” model. Examples of this visualisation are presented in Figures
4.2. – 4.4.
Figure 4.2. visualizes the demands (in blue dots) and demand patterns. The demand can be grouped into
several clusters with different central of gravity (in yellow dots). The dot size represents the number of
demand. The bigger size of the dot, the higher the demand.
Figure 4.2. Demand Central of Gravity
Figure 4.3. visualizes the current distribution model (i.e. good flows) from the warehouse (yellow dots) to the
customers (blue dots).

Digital Twinning of Supply Chains: An Orchestration Platform for Supply Chain (Re) Design
20
Figure 4.3. AS-IS Distribution Network
Figure 4.4. visualizes one example of the exiting delivery route to deliver the demands. It applies the milk-
run distribution for several customers.
Figure 4.4. Existing Delivery Route
“TO-BE (Ideal)” Model
The “TO-BE” (Ideal) model serves as an intermediate model derived from “unconstrained” supply chain
network situations. This step would produce an optimised solution based on the model.
To develop the “TO-BE (Ideal)” model, we use the Green Field Analysis (GFA). GFA is a Geographic Information
System (GIS)/centre of gravity-based approach, which seeks to find the optimum number of storage/freight
facilities as well as to define the approximate locations for these facilities. Computations are typically based
on minimum transportation costs (calculated as “Distance” * “Product Amount”) in consideration of
aggregated demand for each customer and product, customer locations (direct distance between customers
and DCs/Warehouses), and service distance (or number of facilities to locate).
In order to build a GFA model for a particular supply chain network, several inputs are required. These inputs
include a list of products, customer locations, and the aggregated demand for each customer and product.
Typically, the user is further required to preselect a maximum service distance between to-be facilities and

Digital Twinning of Supply Chains: An Orchestration Platform for Supply Chain (Re) Design
21
customers or a fixed number of to-be facilities (without service distance constraints). For simplification, GFA
would only consider straight routes between the customers and facilities or the facilities to another facility.
Figure 4.5. shows an exemplary GFA result. It shows three proposed locations for logistics facilities (in green
dot) to serve the demands (blue dots) in Surabaya. The GFA model is built using a simulation software based
on two years of operations information on historical demand (by location, amount and time distribution),
product flows and costs. The number of facilities can easily be adjusted to analyse the impact on the overall
cost-to-serve. Transportation costs and cost reductions that correspond with the changed number of facilities
are illustrated in Figure 4.6. The figure shows that transportation cost (in blue line) can be reduced by adding
the number of facilities.
Figure 4.5. Illustration of Green Field Analysis Result
Figure 4.6. Transportation Costs and Cost Reduction Comparison

Digital Twinning of Supply Chains: An Orchestration Platform for Supply Chain (Re) Design
22
“TO-BE (Real)” Model
The “TO-BE” (Real) model is the final model that includes real-life constrains set by the industry or the
company itself. This model is an adjustment of the “TO-BE” (Ideal) model.
The GFA results may not be able to be implemented directly. It requires adjustment to align with company’s
policies and considerations. Hence, a “TO-BE (Real)” model is developed using Network Optimization (NO)
and simulation by considering the real implementation constraints such as infrastructure.
Network Optimization (NO) is used to find the best configuration of a supply chain network structure as well
as the flows based upon an objective function, which typically maximizes profits. Considerations for the NO
are:
1. Transportation cost that is driven by material flow. The larger the material flow, the higher the
transportation cost.
2. Fixed cost, the daily cost of operating the DCs. Calculating the daily operating costs per DC, the fixed
cost components that drive facility-operating costs were derived from actual cost figures.
3. Outbound Processing Cost includes salaries for delivery men.
4. Inbound Processing Cost includes salaries for warehouse operators.
In order to define the implementable network configuration, realistic industry constraints, such as the
maximum distance travelled per deliveryman (100 km) in a day and land restriction for warehouse, can be
included. These constraints are taken based on industry landscape and company’s policies. Based on these
constraints, Network Optimization (NO) will be re-developed and rerun to produce an implementable
network configuration. NO result is illustrated in Figure 4.7. This network configuration will minimize the
overall supply chain cost, with no change to the service level as compared to existing supply network
configuration.
Figure 4.7. Optimized Network Configuration

Digital Twinning of Supply Chains: An Orchestration Platform for Supply Chain (Re) Design
23
Real Time Scheduling and Monitoring
The ideal network configuration resulting from NO and simulation model would improve the efficiency of the
supply chain and delivery fulfilment. However, supply chains are highly susceptible to the disruptions which
may have different occurrence frequency and consequences. It would affect the level of service of (even the
best) supply chain network. It would increase delivery lead time and failure to securely deliver the goods.
To anticipate it, a tool named Smart Analytics Routing Application (SARA) is used to visualise, schedule and
monitor delivery schedules for not only the effectiveness, but also the robustness of the supply chain network
and logistics, fostering the creation of fast responses to disruptions.
Using the aforementioned algorithms and further analytics, SARA would compute the best routes and
schedules that may fulfil the areas of interest. These routes will be visualised on the map (as illustrated in
Figure 4.8.), together with their details, including the risk score, being shown to the users. By default, SARA
displays the best and optimised routes based on the computed score index. At a quick glance, insights on the
best alternatives can be gained to adopt for the delivery plans. When used on pre-existing areas of interest,
possible costs, time or distance savings can be identified if the suggested routes differ from the current routes
being adopted. Furthermore, the routes can be viewed based on their top priority of concern. For instance,
the top routes may be generated based purely on the risk index, should risk be the only concern. A few routes
can also be compared at the same time (as illustrated in Figure 4.9.).
Figure 4.8. Route Visualisation in SARA

Digital Twinning of Supply Chains: An Orchestration Platform for Supply Chain (Re) Design
24
Figure 4.9. Route Comparison in SARA

Digital Twinning of Supply Chains: An Orchestration Platform for Supply Chain (Re) Design
25
Chapter 5.
Key Takeaways and Future Work
In this whitepaper, we address the challenges in digital transformation for supply chain and logistics industry
through a self-orchestration platform that we have researched and would continue to explore, develop and
expand to improve efficiency and effectiveness of a portfolio of logistics assets in digital transformation era.
Consisting of various supply chain modules and techniques, this platform will foster supply chain
transparency, collaboration, flexibility and self-orchestration to efficiently and effectively cope with the
complexities in the digital supply chain. Ultimately, using this platform, the intended outcomes are to achieve
an efficient way of analysing and visualising data from various sources more time-efficiently schemes to offer
optimal prices. Supply chain planning and scheduling can be self-configured according to the updated
information. This is needed to cope with variable supply and uncertain demand to mitigate risks in the supply
chain. The practices of dynamic pricing scheme to offer the optimal price can also be achieved by the
platform. This helps to maximise company revenue. Furthermore, multiple scenarios with potential policies
and planning rules can be performed on changing parametric values through scenario planning to ensure the
best option among all possibilities will be selected.
In addition to the various supply chain modules and techniques, this self-orchestration platform will be
equipped with big data analytics and machine learning techniques utilising a safeguarding blockchain
infrastructure (as illustrated in Figure 5.1.). It would enable the companies to take the leap into digital supply
chain transformation.
Figure 5.1. Self-orchestration Platform Towards Big Data and Blockchain Infrastructure

Digital Twinning of Supply Chains: An Orchestration Platform for Supply Chain (Re) Design
26
The platform is intended to serve as a digital twining of the “physical” supply chain network that provides
virtual environment for evaluating new solutions and scenarios. It enables the user to conduct sandbox
testing by changing only a particular aspect in the supply chain by isolating and only changing this aspect to
understand its impacts to the overall supply chain as well as to conduct the overall performance test of the
supply chain by changing multiple aspects in the same time.
Several examples of the platform implementations in different supply chain problems will be presented in
“The Logistics Institute - Asia Pacific Advanced Executive Programme in Supply Chain Innovation”. It consists
of three modules, namely: Transformational Strategies for Supply Chain & Logistics Management;
Optimization, Simulation & Modelling in Supply Chain & Logistics Management; and Project-Based Module
in Supply Chain Innovation & Solutioning.
And lastly, this is an ongoing work and we hope that you, the reader, in turn will be motivated to collaborate
with us to develop the self-orchestration platform to further enhance the practice and alignment of business
asset innovation in e-commerce.

Digital Twinning of Supply Chains: An Orchestration Platform for Supply Chain (Re) Design
27
The Logistics Institute – Asia Pacific National University of Singapore 21 Heng Mui Keng Terrace, #04-01
Singapore 119613 Tel: (65) 6516 4842 Fax: (65) 6775 3391 E-mail: [email protected] Website: www.tliap.nus.edu.sg