Embed Size (px)
Citation preview

Digital Zone System - Part 1
Photography has always been a "technical" art. Since its inception photography has relied on the leading
technology of its day to capture and present images of the world around us. Much effort has been applied to
photography to enhance the precision with which we record images as a way of sharing a visual experience as
acurately as possible. Of course, artists have always extended this visual experience into the realm of the
imagination, but to this day, photography has excelled in presenting a vision of the world that resonates with truth.
As a result of these efforts, photography has become the domain of science and technology. The progression of
photography into the world of computers is a natural extension of the desire for precision and control over the
image presentation. Digital photography has evolved to give us a range of control over the captured and presented
image that far exceeds anything that Ansel Adams ever dreamed of.
However, this promise of precision and control is often hidden behind a trend in U.I. design that invites a more
casual, touchy-feely, intuitive involvement in the image making process. Everything is automated - auto-focus,
auto-exposure, auto color adjustments, one-click this and one-click that. Almost all feedback data is confined to
what the image looks like on screen and we are led to believe that "color management" will take care of
everything. The professional image maker needs something more... well... professional. It is to this end that this
first in a series of articles is devoted. We are going to dust off the traditional Ansel Adams Zone System and
re-tool it for the digital age. In the process, we will pull back the veil that obscurs the true precision afforded by
digital capture. The serious photographer should gain some new insight into the way his tools work and will be
able to reclaim a more precise control over the photo making process.
Lets start with an overview of the Zone System as it applies to digital photography. Its perhaps easiest to gain
some insight by building a "Zone Scale". Traditionally, this was done by doing a series of exposures, processing
film amd making prints and painstakingly assembling patches of varying densities into a strip, also known as a
step wedge. By using Photoshop we can reduce this process from days to minutes.
Start by making a new document in Photoshop...
Digital Zone System - Part 1 - 1 www.varis.com [email protected] 323-937-3793

Make New Document
(1.) Name – LAB_Zone_Scale (2.) Set width to 6 inches and height to 1 inch (3.) Select "Lab Color" from the
Color Mode drop down (4.) Set Background Contents to "White" by selecting from the drop down menu (5.)
Click "OK" to continue...
Digital Zone System - Part 1 - 2 www.varis.com [email protected] 323-937-3793

Create Black to White Gradient
(1.) Select the "Lightness" channel in the "Channels" panel. (2.) Select the "Gradient Tool" in the Tool panel. (3.)
Click on the Gradient picker flyaway and select the "Black, White" gradient from the thumbnails. (4.) Make sure
you uncheck "Dither" in the Tool Options bar. (5.) Finally, drag out a black to white gradient from left to right in
Digital Zone System - Part 1 - 3 www.varis.com [email protected] 323-937-3793
the document window.
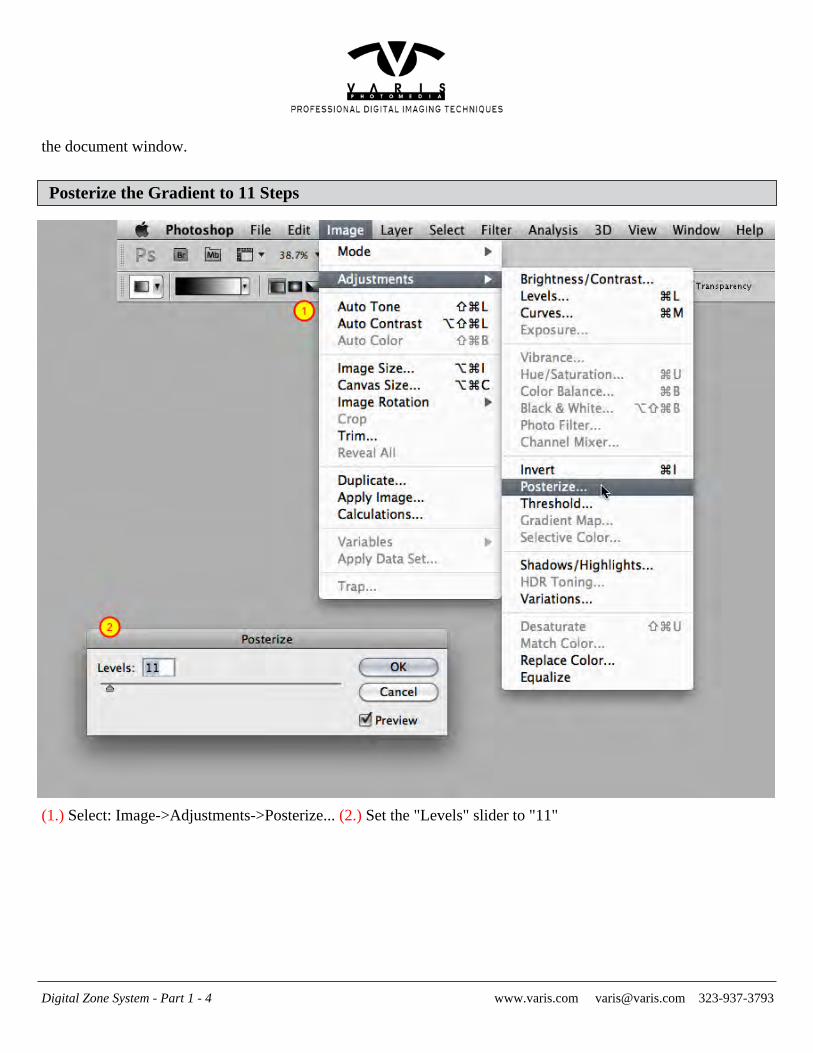
Posterize the Gradient to 11 Steps
(1.) Select: Image->Adjustments->Posterize... (2.) Set the "Levels" slider to "11"
Digital Zone System - Part 1 - 4 www.varis.com [email protected] 323-937-3793

The LAB Zone Scale
The resulting Zone Scale will have value steps that progress from zero through 100% brightness in 10%
increments. A 50% middle gray step will be placed in the middle of the scale. This corresponds to the traditional
"Zone V" in Ansel Adams Zone System and, as it turns out, this value is what all light meters are calibrated to.
You can convert this LAB document into any workspace you want to get corresponding numbers for each of the
steps. This example shows numbers along the bottom for Adobe RGB. You will notice that the 50% step does not
read 128 (the mathematical mid-point) but rather 118. This is due to the gamma encoding of the Adobe RGB
workspace. RGB workspaces distribute steps with a curve function that is similar to the power curve of a cathode
ray tube, which, in turn, mimics the human visual response. Thus gamma 2.2 workspaces, like Adobe RGB and
sRGB have middle gray at 118 and 1.8 gamma workspaces like ColorMatch RGB place middle gray at 99.
Print the Zone Scale
You can use variations on this simple “zone” scale to determine how values will print. Here I’ve built 3 step
wedges (from top to bottom)– 21 steps (5% increments), 41 steps (2.5% increments) and a 61 step wedge
(roughly 1.5% increments, though its not completely even across the scale.) The "tick marks" just under the top
Digital Zone System - Part 1 - 5 www.varis.com [email protected] 323-937-3793

"steps" show where the 11 zones would fall. The next set of "tick marks" show the divisions between the 41 steps
and finally, the "ticks" at the very bottom show the divisions between the 61 steps. Convert this to RGB and
print. Then look at the print to determine where you loose separation between values. This is especially helpful in
visualizing how shadow values get compressed in a print. You may find that you don’t get any separation of
values below a level of 15 on certain papers but others will give you separate “steps” down to a level of 5.
Use LAB Numbers to Read Zones
The whole point of the “Zone System” is to develop a way to pre-visualize how an image will print. Keep your
“printed” zone scale in hand and you can easily identify values in an image file using LAB color readouts in the
Info palette. Just set up the Second Color Readout to LAB in the Info Palette Options or use the little eyedropper
Digital Zone System - Part 1 - 6 www.varis.com [email protected] 323-937-3793

(1) drop down in the Info Palette itself and select Lab Color there (2) Now when you read a particular color value
you can check the “L” value to come up with a “zone” equivalent. Here an 87% value would be closest to 90% or
zone IX (9)
Visualize the Zones in an Image
When we are trying to pre-visualize a digital capture we want to identify how a given exposure will render as a
value in a print. By exposing a scene appropriately we can keep values within range so that we can easily
manipulate the contrast to enhance the image for a print. This image is represented here in a linear RAW state –
zero slider settings in ACR & Lightroom with a linear curve. It is as close to a 1:1 representation of what the
camera chip captured as possible. If we place a zone scale next to it, we can see what values inside the image
correspond to which zone in the scale. The dark mountains in the foreground (reading L=13) are closest to zone I
and the snow covered mountain peak (reading L=91) is closest to a zone IX. Everything in the image falls within
these extremes and that gives us plenty of room to adjust the final image in Photoshop.
Digital Zone System - Part 1 - 7 www.varis.com [email protected] 323-937-3793

Adjust Final Image in Photoshop
As long as important tones are not darker than zone I (around a level of 33 in Adboe RGB) and not lighter than
zone IX (225 in Adobe RGB) a lot can be done to enhance the contrast and rendering of detail without heroic
efforts. Old timers will notice that the recommendations of zone I and zone IX are outside the more conservative
recommendations of the traditional Zone System of zone II and Zone VIII. This is due to the nature of the linear
response to light of the CCD or CMOS chip vs the d-log-e curve response of film. This seems to imply that digital
capture is somewhat more forgiving. However, this is not the case!
What is less obvious in all this is that the actual dynamic range of the capture is not much different than what is
possible with film. Our linear zone scale does not progress in 1-stop increments so we cannot necessarily establish
a one-to-one correspondence between zone values and f-stops of exposure. The linear steps of the digital zone
scale show more separation of values near the end points so that it appears that we can resolve detail down to zone
I and up to zone IX but the digital zone I is lighter than the traditional zone I and its zone IX is darker as well. The
response curve of film has a toe and shoulder region where changes in exposure are seriously compressed so that
Digital Zone System - Part 1 - 8 www.varis.com [email protected] 323-937-3793
shadow and highlight values are very close together. The useful region is in the middle of the response curve
which progresses in a more linear fashion. Digital image sensors have a more strictly linear response such that
value changes are more equally spaced but, at the ends of the "curve" they just fall off the cliff – values will "clip"
rapidly to white or black rather than tapper off gradually. This is especially noticeable in the highlights and we are
always admonished to avoid overexposing digital captures because of this. Unfortunately, that is only half the
picture. In practice it may seem like we have more room on the shadow side of things but actually the "noise
floor' of the image sensor becomes a serious threshold beyond which no real image detail is possible - result:
digital capture is not any more forgiving that film capture - its just different in its value distribution. Because
diigitally captured values are more evenly spaced, digitally captured image files will respond better to more
agressive image adjustments but the actual dynamic range of the capture is not that different.
Film based photography is able to capture useful image information within a 6-stop range under ideal conditions
and most would argue that real "printable" information really falls within a 4-5 stop range. A lot has to do with
the printing technology utilized but, for the most part this same limitation applies to digital capture. "Wait a
minute..." I can already hear some of you mutterng "What about that 11-stop range that everyone says is possible
with digital." Well... I don't know how the engineers came up with those measurements but this seems to be more
theory than reality. My experience suggests that the best we can hope for without special techniques (highlight
recovery, HDR, etc...) is 6 stops of useable info and more conservatively only 5 stops with digital capture.
To prove this for yourself do the following test:
First shoot a series of exposures of a test target...
Digital Zone System - Part 1 - 9 www.varis.com [email protected] 323-937-3793

Shoot a test target
An ideal target will have a number of features that extend its usefulness beyond just determining an ideal
exposure index and dynamic range – the target pictured here is my personal setup and I use it for color calibration
as well. I'll cover color calibration in the next article.(1) First we have to have a standard color reference – here
I’m using a GretagMacbeth 24 patch ColorChecker (Munsel Chart). (2) Since skin tone is such a problematic
color it is almost mandatory that you have a human subject. I shoot my target with the self timer set to 10 second
delay so that I can get into the shot – I can never seem to find a willing model when I'm ready to shot a test. (3) I
like to have a light trap to use for a black reference – this can be a simple box with a smaller hole cut in the lid,
lined with black velvet. (4) Some kind of diffused white reference is also good but not essential – here I use a
piece of styrofoam lens packaging material. (5) You will need to write down the exposure or ISO reference for the
exposure for that frame. What this means is you write down what the expected ISO would be if this particular
exposure is ideal. For example, using the sunny 16 rule, outdoors in direct sunlight the ISO will be the the shutter
speed at ƒ16 – in my shot here its ISO 100= ƒ16@1/100.
Digital Zone System - Part 1 - 10 www.varis.com [email protected] 323-937-3793

The general procedure is to shoot a range of exposures of a known target value and then pick the exposure that
gives you the closest value match to the target. So, set up your test target and shoot a series of exposures
bracketing up and down from the expected ISO of your camera. Of course, you'll have to set your camera on
manual mode and change the exposure manually for each sucessive shot...
Shoot a series of exposures
Change your exposure by 1/3 stop, if you have that option with your camera – that is the way the ISO exposure
index is set up to change so each exposure would represent sucessive ISO changes.(25, 32, 40, 50, 64, 80, 100,
etc...) You can do this test shooting with Jpegs but, if you're interested in the absolute best quality captures,
shooting RAW is the way to go. Make sure you shoot a very wide bracket. Once you bring these captures into
your raw processor of choice you can begin the seach for the ideal exposure and determine the actual ISO setting
for your camera/lens/processor system. I prefer Lightroom as my RAW processing sytem and Adobe products in
general but you can do this test using any software you like. Adobe RAW processing software (Lightroom or
ACR) allows you to set up zero slider settings for a true baseline test – you have to change the default settings
which give you a +50 brightness slider setting! Going to zero sliders gives us, as close as possible, an unaltered
take on what the camera captured. Once you've brought the images in, do a white balance by clicking on the light
gray patch with the White Balance Tool (eyedropper). The image will look very flat and that may bias your
Digital Zone System - Part 1 - 11 www.varis.com [email protected] 323-937-3793

judgement of the exposure so it is best to use numerical feedback by moving the cursor into the image over the
mid-gray patch in the target (in the ColorCHecker here its the 3rd patch from the right in the gray patches at the
bottom row).
Evaluate for ideal exposure
This example shows a recent test I shot with a Canon 5D mkII as it looks in Lightroom. I started my exposure
bracket at the ISO 100 exposure based on a reading from the mid-gray patch (3rd from the right)(1) -- QUICKNOTE: GretagMacbeth rates this patch as 18% gray which gives it an L value (in LAB) of 51% - thats not quite
50% gray! Light meters are calibrated to an ANSI standard of 12.3% gray (closer to a real 50%) - the difference is
roughly 1/2 ƒstop so, ideally, you'd need to open up 1/2 stop from the meter reading taken from this patch to
arrive at the correct exposure. -- This assumes that you can use a spot meter to acurately read the small patch.
Alternately, you can use a hand held incident meter and base the exposure off the reading taken at the subject.
Don't own a hand held meter? You can use your camera meter – move in close and fill the frame with the
ColorChecker chart and base your exposure on that (not ideal but it should mimic the way you will be using your
camera on a day to day basis so it should be valid for your purposes).
In Lightroom you'll be looking for the exposure that gets you closest to a reading of 51% in the RGB readout
Digital Zone System - Part 1 - 12 www.varis.com [email protected] 323-937-3793

under the histogram display.(2) However, you have to watch out for white clipping so you also need to check the
white patch - make sure it does not read higher than 90%. Most of the time this involves some compromise - in
this example I could not use the next lighter exposure which gave me a reading of 51.5% becaue it pushed the
white patch to 97%. I settled for this exposure which gave me a reading of 48% for the gray patch and 87.5% for
the white patch.
This test shows me that, in these lighting conditions of open shade (6000-6500 kelvin color temperature) with my
meter/camera/lens and a camera setting of ISO 100, I have to open up 1/3 ƒ-stop to get the ideal exposure. If you
do a test like this for yourself you may find that you have to open up as much as 1 full ƒ-stop. The response of the
camera is likely to be different under different lighting. I often find that I have to open up much more for tungsten
light – the chip just doesn't respond as well to that color temperature.
Remember – everything is interrelated. The test is only valid for that one camera-meter-software system, The lens
is also a factor so be careful if you use lenses from different manufacturers!
Adobe Camera Raw
The procedure is similar for ACR. In this case you are looking for a reading as close as possible to 121 for the
mid gray patch (the RGB equivalent for the L=51% of 18% gray) - make sure the white patch doesn't read higher
than 245!
Digital Zone System - Part 1 - 13 www.varis.com [email protected] 323-937-3793

Once you have found the ideal exposure and thus identified your true ISO its time to discover the dynamic range
of your camera.
FInd the white point limit
Look at the lighter exposures and find the exposure that renders the mid gray patch at zone IX - in Lightroom
you'd look for a reading close to 90%. For my camera, if I open up 2 ƒ-stops from normal I get a reading of 89%.
Open up one more third and I'm pushing 99% – basically clipped!
Digital Zone System - Part 1 - 14 www.varis.com [email protected] 323-937-3793
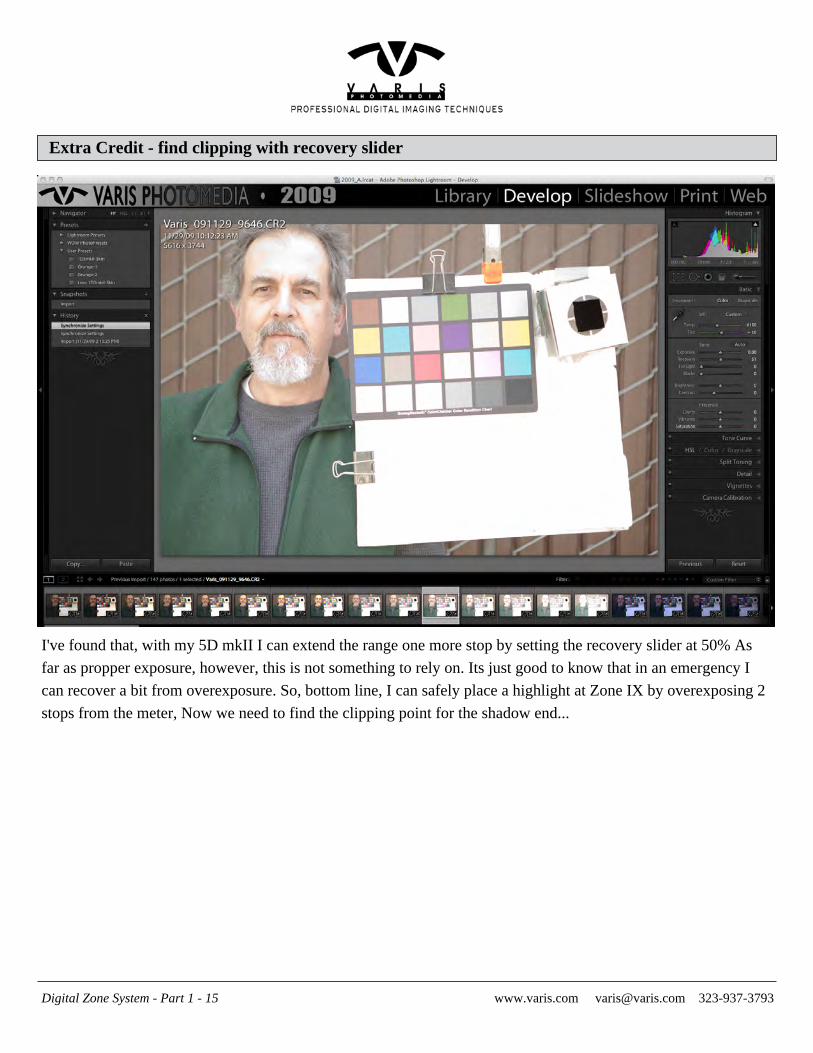
Extra Credit - find clipping with recovery slider
I've found that, with my 5D mkII I can extend the range one more stop by setting the recovery slider at 50% As
far as propper exposure, however, this is not something to rely on. Its just good to know that in an emergency I
can recover a bit from overexposure. So, bottom line, I can safely place a highlight at Zone IX by overexposing 2
stops from the meter, Now we need to find the clipping point for the shadow end...
Digital Zone System - Part 1 - 15 www.varis.com [email protected] 323-937-3793

Black clipping
This is a little trickier. Ideally you want to find the reading closest to 10% in Lightroom or 33 RGB in ACR but
the concern here is the level of noise. I always check this with no noise reduction in the processor to get a true fix
on useable detail. It may be hard to see in the screen shot here but this patch reads 13% and I have a noticeable
but realatively smooth sprinkling of noise in the gray patch with just slightly higher amount of noise in the darker
patches and surounding frame. This is MY limit - any lower and I get unuseable noise that will break up any
useful detail. This comes at 4 ƒ-stops under my base exposure for this camera! So,between highlight and shadow,
I have 6 ƒ-stops of useable dynamic range with this camera!
Its easy to see why camera manufacturers tend to rate their ISOs higher than what this test would indicate is ideal.
There is typically more headroom on the shadow side than the highlight side. Remember, however, that the best,
cleanest image data is to be had in the value range above 50%, We have a tremdous amount of control post
capture for shaping the value structure of the image and assuming we haven't clipped any important values to
white, its much easier to make the image darker. Adjusting an underexposed image lighter will run the risk of
enhancing whatever noise is already present in the low vaues.
Digital capture has its own unique set of ideosyncracies and its only by testing the limits that we can uncover
Digital Zone System - Part 1 - 16 www.varis.com [email protected] 323-937-3793

these features and hopefully take advantage of this knowledge. My next article in the series will look at how this
info can be applied in practice and develop more refined metering procedures to arrive at better digital exposures.
Digital Zone System - Part 1 - 17 www.varis.com [email protected] 323-937-3793