Embed Size (px)
Citation preview
Digitalization of Visual Management System (mieruka)
Muhammad Dzulkarnain bin Shahidan
Department of Transport and Innovation Centre
Faculty of Engineering, Computing, and Science
Swinburne University of Technology
Sarawak, Malaysia
A thesis submitted in partial fulfilment of the requirement for the degree of Master of
Engineering (Research)
October 2020
ii
Dedicated to
To The One I Love, My Family
iii
Abstract
Visualization has widely used in the manufacturing industry, which has played the most
significant role in spreading information. It allows the ease of communication towards different
environments of the organization. In the same time, the transparency of the industry has been
promoted as the main features of having good visualization. As the revolutionary of the
industry goes by, the transparency of industry has been decreased day by day. This lack has
made the researcher in evolving the visualization techniques in line with the current industrial
revolution era. Efficient visualization will prompt the employees with the following action
whenever they have seen it. In making visualization effective, the visualized visual elements
must contain beneficial information that is attractive to the employee. In adaption to the rapid
development of Industry 4.0, this research was implemented the Digital Visual Management
System (DVMS) towards Autokeen Sdn. Bhd., an automotive stamping manufacturing
industry. This implementation was to improve visual management (VM) tools in Autokeen by
using DVMS to manage and monitor their production activity visually. The proposed research
based on the studied conventional visual management system and the operators behavioural
towards it, then form an interactive visualization interface. This interface is the formation by
merging the conventional towards the smart system for the operator to get a good understanding
of the new smart system. The new visual management system, with the capability of
autonomously exchanging information, triggering actions, and self-controlled, will be formed
by the end of this research. It aims to get the highest interaction towards the employee, thus
increase the production performance.
iv
Acknowledgements
First and foremost, thanks to our Almighty GOD, Allah S.W.T, for the wisdom and blessing
he bestowed upon me throughout this journey.
Deepest gratitude and appreciation to my principal coordinating supervisor, Dr Valliapan
Raman, for his guidance, encouragement, and supports he has given me throughout this
research.
Besides that, I would like to give thanks to my associate supervisor, Dr Weidong Huang, the
board of directors of Transport Innovation Centre (TIC), Dr Suresh Palanisamy & Dr Almon
Chai for their advice and guidance throughout my study.
Deepest gratitude to my families as well, especially to my parents. Thank you for your endless
support, encouragement, and believe me that I can do my best in anything when I put my mind
and determination to it.
Big thanks to MARII, allowing me to handle this industrial based research. Giving me a great
experience going through all these challenges paths and even for the sponsorship. Instead of
that, I also would like to give thanks to Autokeen Sdn. Bhd., who gives me trustworthy to do
this research.
Other than that, I also want to thanks to all Transport Innovation Centre (TIC) members for
sharing their knowledge of different fields and advice during the sharing sessions.
The simple phrase "thank you" could not present how thankful I am to everyone. Without any
of you, this research study and dissertation would not be possible.
v
Declaration
I, Muhammad Dzulkarnain bin Shahidan hereby declare that this research study entitled
"Digital Visual Management System (mieruka)" is original and does not contain any material
which has accepted for the award of any other degree or diploma, except where due reference
has made in the text of the examinable outcome. To the best of my knowledge, this thesis does
not contain any material previously published or written by another person except where due
reference has made in the text of the examinable outcome; and where the work has based on
joint research or publications, disclosed relative contributions of the respective workers or
authors.
________________________________
(Muhammad Dzulkarnain bin Shahidan)
vi
Contents
Chapter 1 .................................................................................................................................... 1
1.1. Company background ................................................................................................. 3
1.2. Research problem ........................................................................................................ 8
1.3. Research question ........................................................................................................ 9
1.4. Research objectives ..................................................................................................... 9
1.5. Research delimitation ................................................................................................ 11
1.6. Research process ....................................................................................................... 12
1.7. Research contribution ................................................................................................ 13
1.8. Thesis structure ......................................................................................................... 13
Chapter 2 .................................................................................................................................. 14
2.1. Mieruka ..................................................................................................................... 14
2.1.1. Visualization one of Lean Production technique ............................................... 16
2.1.2. Transparency of Visualization ........................................................................... 19
2.1.3. Visual Management (VM) tools ........................................................................ 20
2.2 Significance of Visualization in Industry .................................................................. 25
2.2.1. Application of VM in current manufacturing sectors ........................................ 26
2.2.2. The uses of VM in other sectors ........................................................................ 27
2.3. The innovation of VM tools ...................................................................................... 28
2.3.1. Industry Internet of Things (IIoT) with Visualization ....................................... 30
CONTENTS
2.3.2. Internet of Things devices .................................................................................. 31
2.4. VM system evaluation tools ...................................................................................... 36
2.4.1. User-centered design (UCD) .............................................................................. 36
2.4.2. Usability evaluation ........................................................................................... 41
2.5. Discussion on Literature Review .............................................................................. 44
2.6. Summary ................................................................................................................... 45
Chapter 3 .................................................................................................................................. 46
3.1 The iterative process of DVMS development ........................................................... 46
3.2 Data collection........................................................................................................... 48
3.2.1 Observation ........................................................................................................ 48
3.2.2 Interviews ........................................................................................................... 48
3.3 Proposed DVMS architecture.................................................................................... 49
3.3.1 Initial phase ........................................................................................................ 49
3.3.2 Prototyping phase............................................................................................... 51
3.3.3 Implementation phase ........................................................................................ 52
3.4 Concept of DVMS ..................................................................................................... 54
3.5 DVMS overview ....................................................................................................... 55
3.6 DVMS requirements ................................................................................................. 56
3.7 DVMS architecture ................................................................................................... 57
3.8 Design process........................................................................................................... 60
3.9 Summary ................................................................................................................... 61
Chapter 4 .................................................................................................................................. 63
4.1 Data Collection .......................................................... Error! Bookmark not defined.
4.2 Problems in the current operation ............................. Error! Bookmark not defined.
4.3 The objective of the current solution......................... Error! Bookmark not defined.
4.4 Visualization Dashboard for proposed DVMS ......................................................... 63
CONTENTS
4.4.1 The first phase of DVMS ................................................................................... 65
4.4.2 The second phase of DVMS .............................................................................. 66
4.4.3 The third phase of DVMS .................................................................................. 69
4.5 Summary ................................................................................................................... 75
Chapter 5 .................................................................................................................................. 76
5.1 Evaluation study framework ..................................................................................... 76
5.2 Evaluation study goals .............................................................................................. 77
5.3 Methods, techniques and participants ....................................................................... 77
5.4 Environment and equipment ..................................................................................... 80
5.5 Study tasks and scenarios .......................................................................................... 82
5.6 Evaluation processes ................................................................................................. 88
5.7 Summary ................................................................................................................... 89
Chapter 6 .................................................................................................................................. 90
6.1 Visual Management (VM) practise in site ................................................................ 90
6.2 Summary of DVMS Implementation ........................................................................ 91
6.3 Heuristic evaluations ................................................................................................. 92
6.4 Results analysis ......................................................................................................... 96
6.5 Standardized questionnaire results & summary ........................................................ 99
6.6 Summary of findings ............................................................................................... 103
6.7 Summary ................................................................................................................. 105
Chapter 7 ................................................................................................................................ 107
7.1 Summary of contributions to Visual Management (VM) in Autokeen ................... 109
7.2 Future works ............................................................................................................ 110
ix
List of Figures
No.
Figure
Title
Page
1.1 Body parts that Autokeen was producing 3
1.2 Hinges that Autokeen was producing 4
1.3 Autokeen WSS Line or Line D. 5
1.4 Standard operation procedure (SOP) and machine datasheet 6
1.5 Cell status chart 6
1.6 Section-Line D safety guidelines 7
1.7 Nut or bolt feeder system controller 7
1.8 Autokeen visual control board 8
1.9 Cross-functional flowchart of research process 13
2.1 Toyota Production System (TPS) House Diagram 19
2.2 The main four characteristics of Industrial Internet of Things
(IIoT)
32
2.3 The human-centered design process, ISO-13407 39
LIST OF FIGURES
3.1 Proposed Digital Visual Management System (DVMS)
architecture
51
3.2 Camera counting system 52
3.3 Prototyping phase DVMS architecture 54
3.4 Implementation phase DVMS architecture 54
3.5 Digital Visual Management System (DVMS) overview 55
3.6 Digital Visual Management System (DVMS) architecture 58
3.7 Overview of Python application working with database 59
3.8 Counting system schematic diagram 60
4.1 The first phase dashboard of the Digital Visual Management
System (DVMS)
66
4.2 Second phase dashboard of DVMS prototype design (a), (b) 67
4.3 Third phase dashboard of the management interface of
DVMS
70
4.4 Third phase dashboard of the production interface of DVMS 73-74
4.5 The emojis for the productivity rate 76
5.1 Evaluation of a workplace environment (a), (b) 82
6.1 The post-improvement after second heuristic evaluation (a),
(b), (c), (d)
96
List of Tables
No.
Figure
Title
Page
2.1 Conventional visual management tools 23-25
2.2 Comparison of Raspberry Pi's performance with a similar
prototype platform
35
2.3 Integrated VM Tools with IoT. 36-37
2.4 UCD methods and application area 40-43
5.1 Sort of usability test method with different type of
techniques and participants.
80-81
6.1 Task completion rates of DVMS management interface
second evaluation study
98
6.2 Task completion rates of DVMS operation interface second
evaluation study
99
6.3 Results referring to SysUse metric, for items 1 – 6 on the
PSSUQ
100
6.4 Results referring to InfoQual metric, for items 7 – 12 on the
PSSUQ
101
LIST OF TABLES
6.5 Results referring to IntQual metric, for items 13 – 12 on the
PSSUQ
102
6.6 Results referring to overall user satisfaction on the PSSUQ 103
6.7 Issues of concern and recommendations for future
development of Digital Visual Management System
(DVMS) at Autokeen.
104-
105
xiii
Commonly Used Acronym
DVMS - Digital Visual Management System
VM - Visual management
TIC - Transport Innovation Center
MARII - Malaysia Automotive Robotic Internet of Things Institute
IIoT - Industry Internet of Things
UCD - User-centered design
WSS - Welding Stationary Station
TPS - Toyota Production System
ISO - International Organization for Standardization
PSSUQ - Post-Study Standardize Usability Questionnaire
SysQual - System quality
InfoQual - Information quality
IntQual - Interface quality
KVA - Kilo-volt-ampere
SOP - Standard operation procedure
COMMONLY USED ACRONYM
xiv
PPE - Personal protective equipment
UI - User interface
IoT - Internet of Things
IR - Industry revolution
LED - Light emitting diode
PDCA - Plan, Do, Check, Act
OPL - One-point lesson
KPI - Key performance indicator
ERP - Enterprise resource planning
OEE - Operational equipment effectiveness
SME - Small medium enterprise
AMM - Aircraft Maintenance Manual
UK - United Kingdom
ID - Identification
STC-
LAM
- Stellenbosch Technology Centre's Laboratory for Advanced
Manufacturing
3D - Three dimensional
ODBC - Open database connectivity
CPS - Cyber Physical System
GHz - Gigahertz
COMMONLY USED ACRONYM
xv
ARM - Advance RISC machines
CPU - Central processing unit
GUI - Graphical user interface
GPIO - General purpose input/output
RESTful - Representational state transfer technology
GSM - Global system for mobile communication
GPRS - General packet radio services
SQL - Structured query language
USB - Universal serial bus
OpenCV - Open source computer vision
MES - Manufacturing Execution System
PMS - Production Monitoring System
IBM - International Business Machines Corporation
HCI - Human-computer interaction
MySQL - relational database management system
RPi - Raspberry Pi
V - Voltage
DC - Direct current
NPN - Negative-Positive-Negative
1
CHAPTER 1
Introduction
Mieruka (visualization) has become one of the management tools for the manufacturing
industry that attempts to improve industry performance. The presence of this tool was helping
to smooth the manufacturing process, such as managing the order from customers, managing
the manufacturing resources, managing the production activity, controlling the safety around
the workplace, controlling the quality of the product, etc. However, as time goes by, the
globalization of the manufacturing industry has always evolved. This evolution needs great
technology for it to cope with the demands of the customer that still wants perfections. As the
manufacturing of the future, the customer's needs have become the foremost priority by the
manufacturers. Therefore, conventional ways of using the visualization need to be taking into
account. Otherwise, industry performance will decline.
Furthermore, mieruka also has been called Visual Management (VM), which gives the
meaning of connecting and aligning the organizational information with the process
environment and stakeholders, employing stimuli that directly address one or more human
senses. These stimuli transported the quality information to helps people understand the
organizational context at a glance by merely looking around (Tezel, Koskela and
Tzortzopoulos, 2009). VM also can be defined as a communication device used in the work
environment that tells the target worker at a glance how is work has done and whether it is
deviating from the standard (Liker, 2007).
The analogy of the traffic light in the middle of the junction quickly describes the
concept of VM, thus make vital people understand the idea easily. Traffic light used three
different colors to tells the people who were using the road, either red to stop, green to go, or
CHAPTER 1: INTRODUCTION
2
yellow to beware. When the traffic lights turning red to green, the driver immediately starts to
move their car to pass through the junction or any stop line, and when the traffic light starts
turning green to yellow and then to red, people start slowing their car and stand still when
traffic light has completely turned red. These rules have been known by vital people when they
see it. The implementation of this traffic light system was to manage the traffic on the road,
prevent the accident, etc. This concept was explicitly describing what VM functioning in the
road management system.
In the VM, transparency has become the main factor for the organization to have a
successful interaction. With the highest transparency in the manufacturing industry, it will
increase the ease of communication between different levels of manufacturing. The
information disseminated in a glance creates a smaller gap across the industry organizations.
Meanwhile, industry globalization has introduced the fourth industrial revolution (IR 4.0)
where smart linkage of machines, products, and workers were actively engaging with
information computers technologies (ICT) (Mrugalska and Wyrwicka, 2017). This factor has
allowed most of the manufacturing industries take this as an excellent opportunity for VM to
grow. This step has approached because the IR 4.0 offers some new technologies that will help
them take over the globalization and growth of global competition between industries that have
racing to fulfill the customer needs that wanting something with quality with lower investment
(Bauer, Ganschar and Gerlach, 2014). The technologies that have highlighted in the IR 4.0 was
as the Internet of Things (IoT), big data analytics, cloud computing and cybersecurity that
brings a bunch of innovative ways to enhance the visibility and insight of the global markets
(Alasdair Gilchrist, 2016).
This thesis discovers the suitable VM tools for the testing industry, Autokeen Sdn. Bhd.
and implemented an interactive Digital Visual Management System (DVMS) with the
adaptation of the IR 4.0 technologies. The system will contain two different interfaces that are
working as the VM tools that will help Autokeen manage, communicate, control, monitor, and
record the production activity. This innovation helps vital people that separated from a concrete
wall in Autokeen communicating to perform better work or make a decision with more robust
criteria (Segura et al., 2018). Some practical visual aspects were tested in Autokeen to make
sure the theory of visualization has worked well. The implementation used was to make the
operator in the production floor is interconnecting with the management floor through a digital
interactive screen.
CHAPTER 1: INTRODUCTION
3
The prototype of Digital Visual Management System (DVMS) has equipped with a
practical visual aspect that has constructed in the form of a Python application that has been
developed with user-centered design (UCD) method approach to avoid the waste visual design.
The prototype has two different interfaces for different levels which connected over the SQL
database. This database role is to store as much data gain from both interfaces and visualized
back towards both interfaces. It resulting both levels received the correct information and avoid
miscommunication. Lastly, the usability of the DVMS prototype needs to examine to reach up
the highest level of usability and user satisfaction.
1.1. Company background
Autokeen Sdn. Bhd. had established in March 1988. The main activities in Autokeen were
stamping and sub-assembly of metal components, mainly for the automotive industry.
Autokeen is also working for the Malaysian gigantic automotive industry, which is Perodua,
Proton, and Honda for the development of the new car. This partnership is in recognition of
Autokeen's quality and capabilities as one of Malaysia's leading manufacturer of automotive
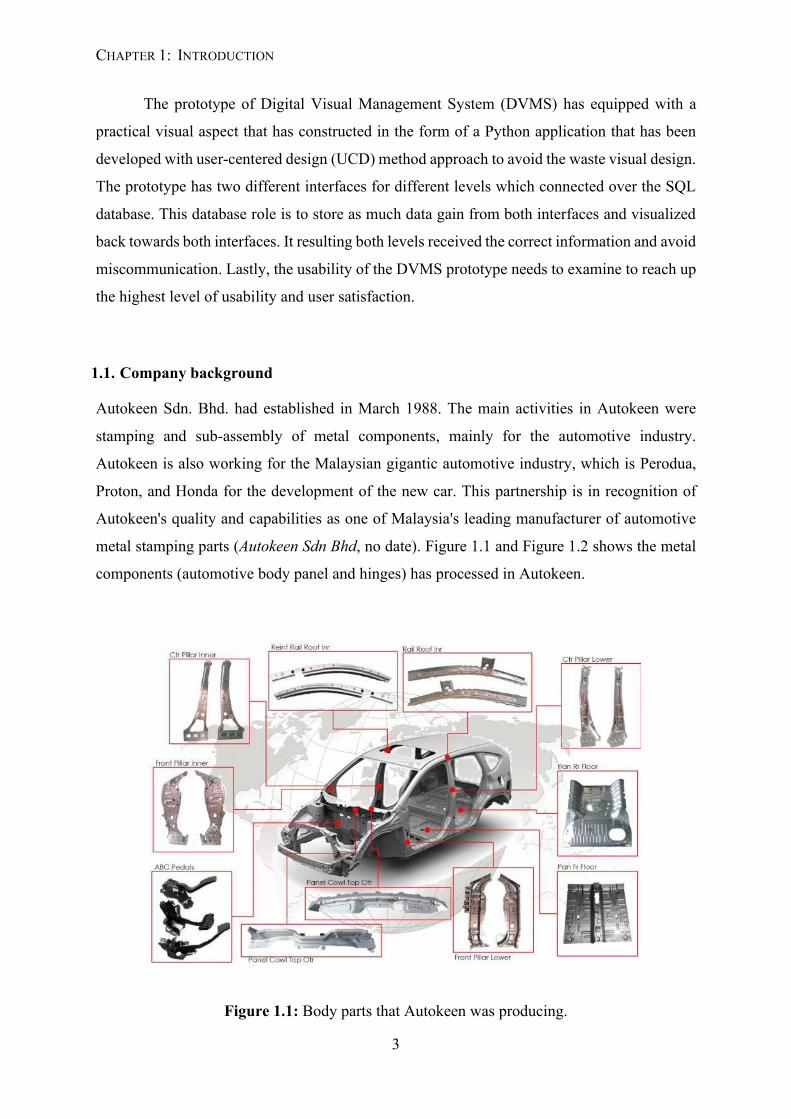
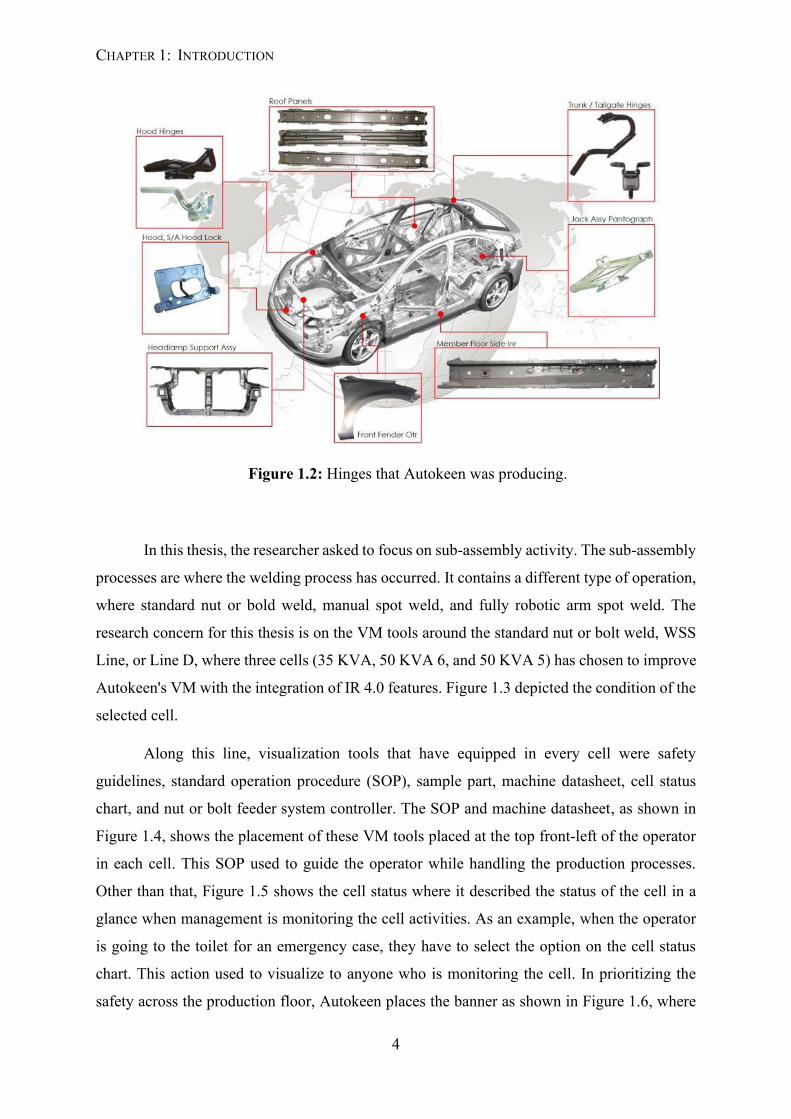
metal stamping parts (Autokeen Sdn Bhd, no date). Figure 1.1 and Figure 1.2 shows the metal
components (automotive body panel and hinges) has processed in Autokeen.
Figure 1.1: Body parts that Autokeen was producing.
CHAPTER 1: INTRODUCTION
4
Figure 1.2: Hinges that Autokeen was producing.
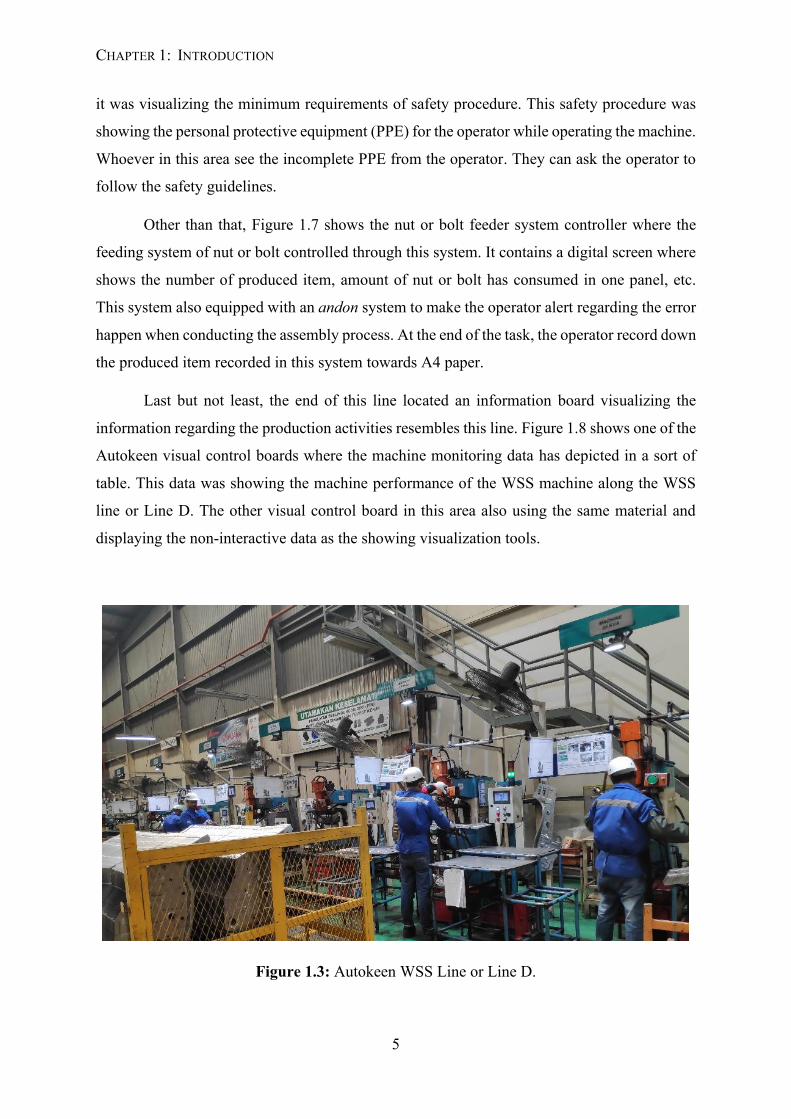
In this thesis, the researcher asked to focus on sub-assembly activity. The sub-assembly
processes are where the welding process has occurred. It contains a different type of operation,
where standard nut or bold weld, manual spot weld, and fully robotic arm spot weld. The
research concern for this thesis is on the VM tools around the standard nut or bolt weld, WSS
Line, or Line D, where three cells (35 KVA, 50 KVA 6, and 50 KVA 5) has chosen to improve
Autokeen's VM with the integration of IR 4.0 features. Figure 1.3 depicted the condition of the
selected cell.
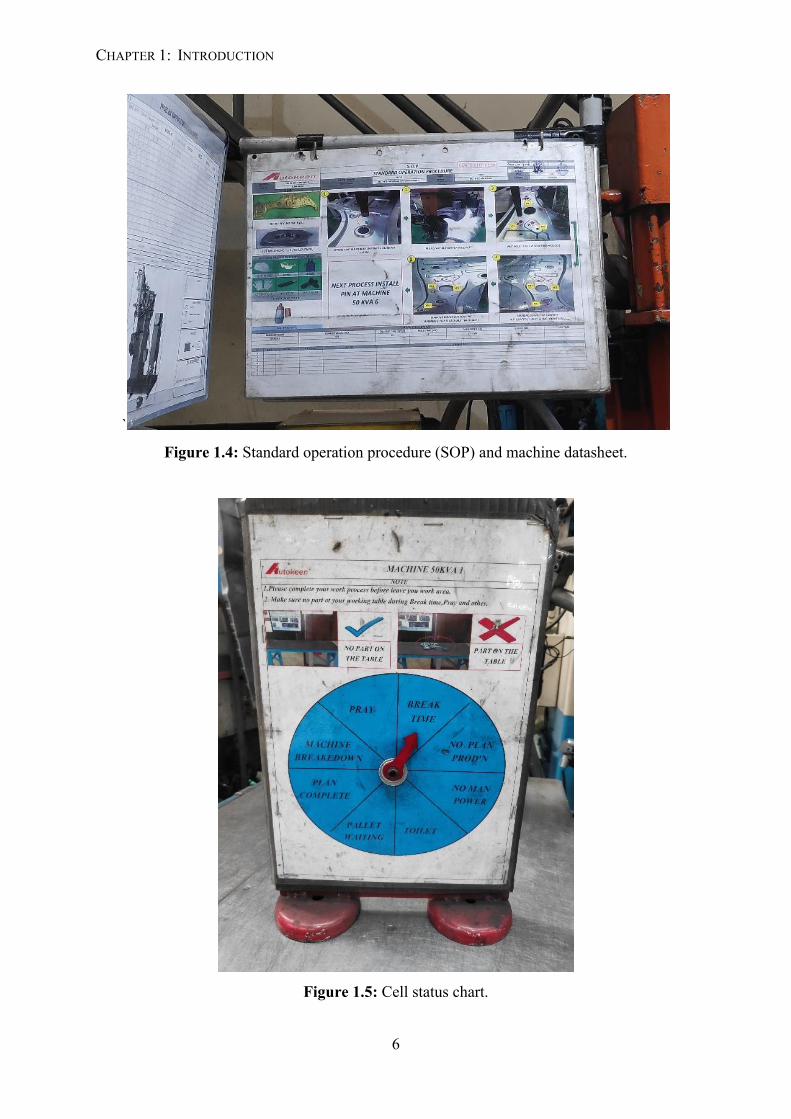
Along this line, visualization tools that have equipped in every cell were safety
guidelines, standard operation procedure (SOP), sample part, machine datasheet, cell status
chart, and nut or bolt feeder system controller. The SOP and machine datasheet, as shown in
Figure 1.4, shows the placement of these VM tools placed at the top front-left of the operator
in each cell. This SOP used to guide the operator while handling the production processes.
Other than that, Figure 1.5 shows the cell status where it described the status of the cell in a
glance when management is monitoring the cell activities. As an example, when the operator
is going to the toilet for an emergency case, they have to select the option on the cell status
chart. This action used to visualize to anyone who is monitoring the cell. In prioritizing the
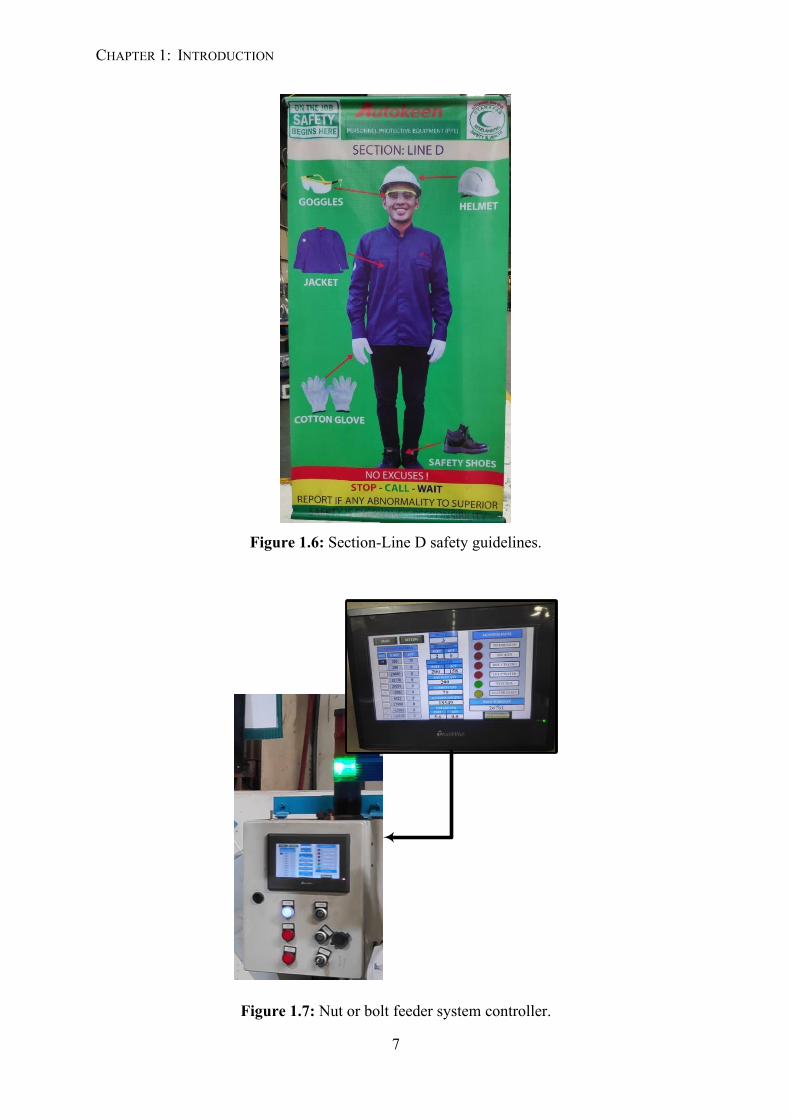
safety across the production floor, Autokeen places the banner as shown in Figure 1.6, where
CHAPTER 1: INTRODUCTION
5
it was visualizing the minimum requirements of safety procedure. This safety procedure was
showing the personal protective equipment (PPE) for the operator while operating the machine.
Whoever in this area see the incomplete PPE from the operator. They can ask the operator to
follow the safety guidelines.
Other than that, Figure 1.7 shows the nut or bolt feeder system controller where the
feeding system of nut or bolt controlled through this system. It contains a digital screen where
shows the number of produced item, amount of nut or bolt has consumed in one panel, etc.
This system also equipped with an andon system to make the operator alert regarding the error
happen when conducting the assembly process. At the end of the task, the operator record down
the produced item recorded in this system towards A4 paper.
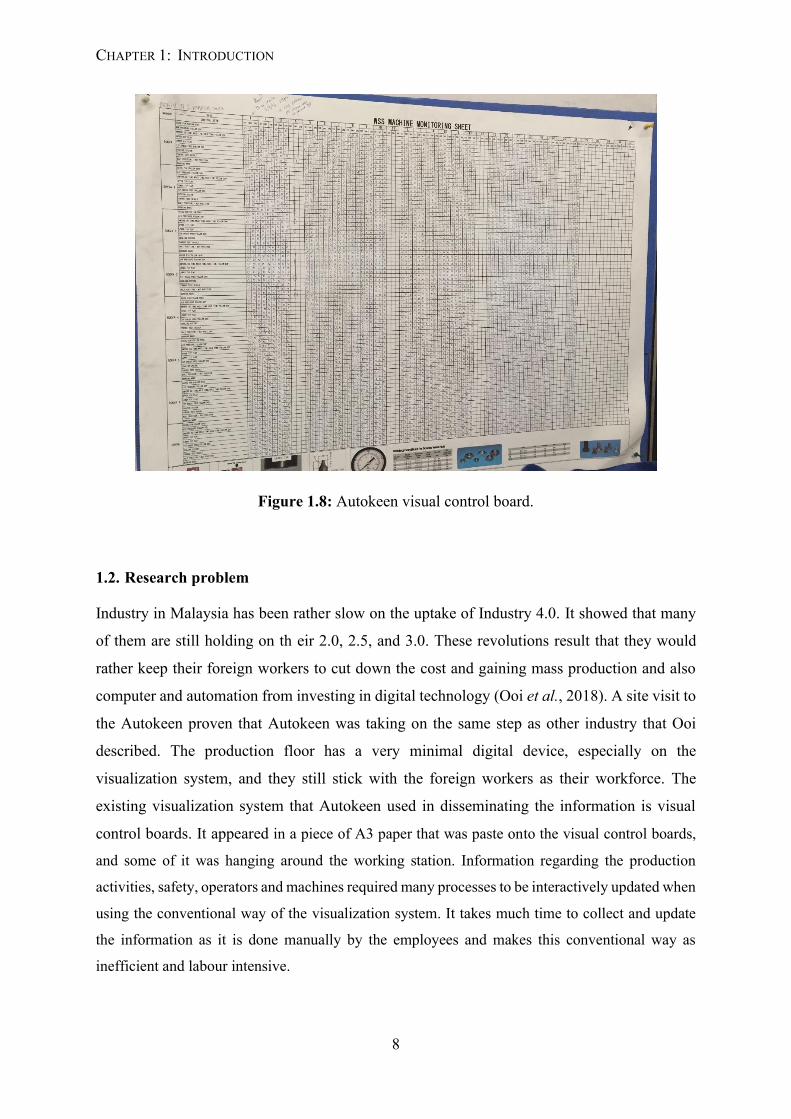
Last but not least, the end of this line located an information board visualizing the
information regarding the production activities resembles this line. Figure 1.8 shows one of the
Autokeen visual control boards where the machine monitoring data has depicted in a sort of
table. This data was showing the machine performance of the WSS machine along the WSS
line or Line D. The other visual control board in this area also using the same material and
displaying the non-interactive data as the showing visualization tools.
Figure 1.3: Autokeen WSS Line or Line D.
CHAPTER 1: INTRODUCTION
6
`
Figure 1.4: Standard operation procedure (SOP) and machine datasheet.
Figure 1.5: Cell status chart.
CHAPTER 1: INTRODUCTION
7
Figure 1.6: Section-Line D safety guidelines.
Figure 1.7: Nut or bolt feeder system controller.
CHAPTER 1: INTRODUCTION
8
Figure 1.8: Autokeen visual control board.
1.2. Research problem
Industry in Malaysia has been rather slow on the uptake of Industry 4.0. It showed that many
of them are still holding on th eir 2.0, 2.5, and 3.0. These revolutions result that they would
rather keep their foreign workers to cut down the cost and gaining mass production and also
computer and automation from investing in digital technology (Ooi et al., 2018). A site visit to
the Autokeen proven that Autokeen was taking on the same step as other industry that Ooi
described. The production floor has a very minimal digital device, especially on the
visualization system, and they still stick with the foreign workers as their workforce. The
existing visualization system that Autokeen used in disseminating the information is visual
control boards. It appeared in a piece of A3 paper that was paste onto the visual control boards,
and some of it was hanging around the working station. Information regarding the production
activities, safety, operators and machines required many processes to be interactively updated when
using the conventional way of the visualization system. It takes much time to collect and update
the information as it is done manually by the employees and makes this conventional way as
inefficient and labour intensive.
CHAPTER 1: INTRODUCTION
9
With the improvised internet and computers technology (ICT) in Industry 4.0, it shows
Autokeen has been far behind in making full use of visualization tools. Industry 4.0 promoted
an easier method to help the dissemination process of information by using smart technologies
such as smart sensors, smart computers, and smart networks. This feature has allowed the
process of formation of an efficient visualization system that can digitally gather production
information and displayed in a real-time production situation. The efficient visualization
system is very much needed to alert the employees and managers in Autokeen. A cheaper
customized system has developed specifically for use in a production environment of an
Autokeen and other automotive industry.
1.3. Research question
In this section, three research questions have defined to fulfill the research objectives. This first
research question provides the foundation for the other issue.
I. In the development of the lean production system, visualization has been striving
by making the production more efficient. With the existence of the visualization
system in Autokeen, did the conventional visualization functionality has been fully
addressed by the employees? If not, what kind of improvement can be made
through the system?
II. What are the best visualization aspects that will give the highest interaction
between employees and managers towards the digitalized visualization system?
III. How can the conventional visualization system transform into the innovated
visualization system that aligns with Industry 4.0 elements?
IV. How does the digitalized visualization system affect the employees and managers
in Autokeen who are never taking visualization as a necessity in daily production
activities?
1.4. Research objectives
The main objective of this research was to implement an innovative visual management system
that allows the highest interaction between the floor in Autokeen industry. The first objective
that needs to achieve in this research is the concept of the visualization itself, how the
CHAPTER 1: INTRODUCTION
10
visualization helps the industry in managing the production activity in a real-time situation. A
preliminary study of mieruka or visualization is the essential step in this research before taking
into account on innovating it. Otherwise, the current development of the visualization system
in Autokeen also was identified to make sure that Autokeen employees realize the visualization
existence.
From the preliminary study, it results in some requirements that are going to be taken,
including in the implementation of the visual management system by making it beneficial
towards Autokeen. The requirements were to helps the employee in the higher floor review,
manage, and monitor the production activity of the production operator. Meanwhile, the
operator is to understand the task given and making sure the production activities are following
the rules and methods that prompt by the system. These activities will be controlled by two
different interfaces that were going to develop and called as Digital Visual Management
System (DVMS). This implemented device will allow the communication visually on a
different floor, thus increasing the transparency of the organization. In doing so, the perfect
tools for running the system also need to figure out. Industry 4.0 has promoted various of tools
for processing the system. A literature study on the Internet of Things features will discuss
more on the method have taken in developing the DVMS with the interactive elements.
Then, the evaluation process of DVMS will be doing by having a usability test to see
how effective the system was. Furthermore, the usability test also will result in how Autokeen
members are satisfied with the implementation of DVMS, which can lead this towards
increasing their productivity.
Otherwise, this project is not only focusing on the Autokeen production floor only. This
customized system is expecting to develop in a cheaper way that is explicitly used widely in
the production environment of the automotive industry.
The objectives are as follows:
I. To investigate the visualization applications in Autokeen.
II. To identify the most suitable visual elements for Autokeen and apply it towards
Autokeen visual management (VM) system.
III. To develop an interactive user interface (UI) for the improvement in the Autokeen
visualization system.
IV. To test the effectiveness of the DVMS in Autokeen.
CHAPTER 1: INTRODUCTION
11
1.5. Research delimitation
This section will explain some of the researcher's limitations while developing the Digital
Visual Management System (DVMS) towards Autokeen Sdn. Bhd. For the development of this
research, Autokeen has assigned only the first three cells of the WSS machine or Line D for
the implementation process of DVMS. The data exploration of this cell was allowed by
Autokeen to be collected by the researcher for research purposes.
The first delimitation made for this research is data limitations. As mentioned earlier,
the process of assembling the nut or bolt to the panel has controlled by the nut or bolt feeder
system. This system manages the production activity by limiting the feeding number of nut or
bolt into a specific panel. A precise number of nut or bolt was feed into the particular panel.
No extra or short number of nut or bolt is being used; otherwise, this system will also count the
number of panels that have finished assembled. However, the researcher does not have
permission to get information from the current system. A new counting method needs to
construct as the counting is the primary input for the developed system. This research will also
not examine how the counting process by the sensor or how to access other potential data from
sensors. It will also limit the scope of using the data collected and stored in the SQL database
of DVMS. The data will due to secrecy in Autokeen data come from free open data sources.
The data gained from the sensors will represent the production data of particular processes and
products in the DVMS.
In this research's evaluation process, another delimitation made for this study is the
number of participants and the information on the real-time production plan. As this research
has been conducted remotely from the Autokeen, some of the data could not be precise.
However, these were not obstacles for this research process to be successful. The gathered
information from the evaluation study will describe how satisfied they are with the system.
CHAPTER 1: INTRODUCTION
12
1.6. Research process
Cross-Functional Flowchart
Prot
otyp
ing
Initi
alIm
plem
entat
ion
Start
UCD
User Requirements
2nd phase of DVMS UI
Interactive DVMS UI
Yes
End
No
1st phase of DVMS UI
Literature Study
1st Evaluation
study
3rd phase of DVMS UI
No
Yes
2nd Evaluation
studyYes
No
Figure 1.9: Cross-functional flowchart of the research process.
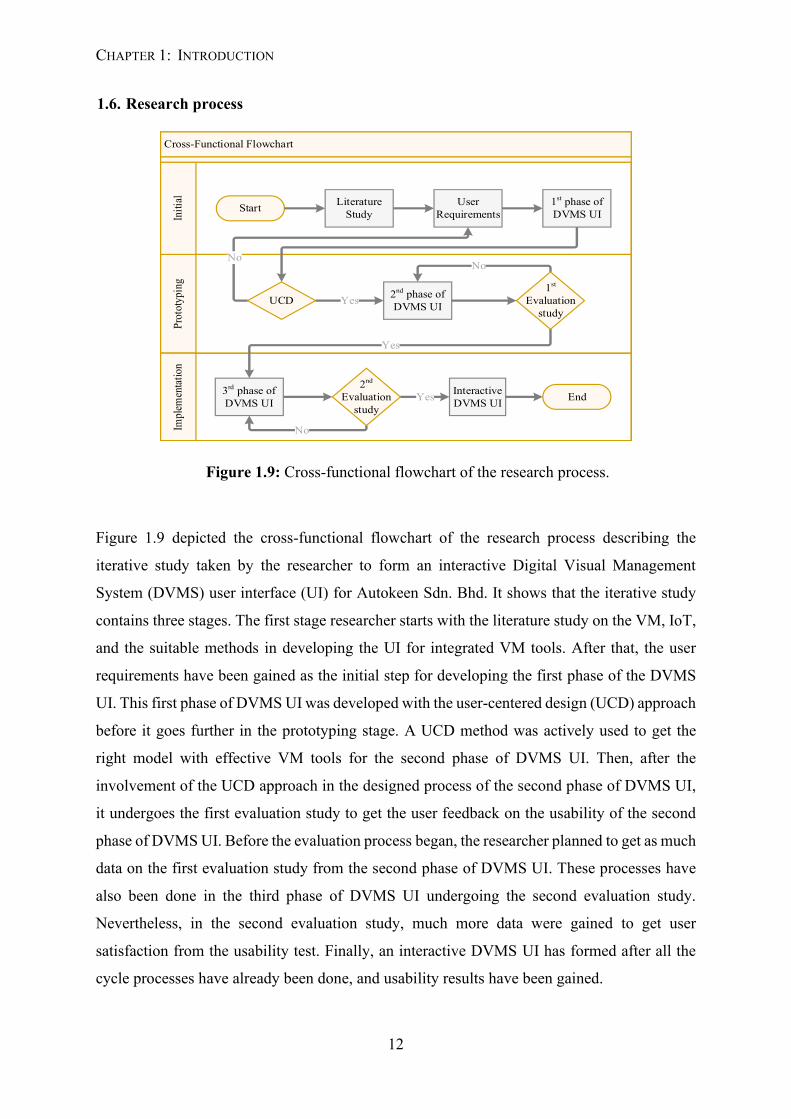
Figure 1.9 depicted the cross-functional flowchart of the research process describing the
iterative study taken by the researcher to form an interactive Digital Visual Management
System (DVMS) user interface (UI) for Autokeen Sdn. Bhd. It shows that the iterative study
contains three stages. The first stage researcher starts with the literature study on the VM, IoT,
and the suitable methods in developing the UI for integrated VM tools. After that, the user
requirements have been gained as the initial step for developing the first phase of the DVMS
UI. This first phase of DVMS UI was developed with the user-centered design (UCD) approach
before it goes further in the prototyping stage. A UCD method was actively used to get the
right model with effective VM tools for the second phase of DVMS UI. Then, after the
involvement of the UCD approach in the designed process of the second phase of DVMS UI,
it undergoes the first evaluation study to get the user feedback on the usability of the second
phase of DVMS UI. Before the evaluation process began, the researcher planned to get as much
data on the first evaluation study from the second phase of DVMS UI. These processes have
also been done in the third phase of DVMS UI undergoing the second evaluation study.
Nevertheless, in the second evaluation study, much more data were gained to get user
satisfaction from the usability test. Finally, an interactive DVMS UI has formed after all the
cycle processes have already been done, and usability results have been gained.
CHAPTER 1: INTRODUCTION
13
1.7. Research contribution
Previous research has developed a smart visual management system for a resource management
system for the Stellenbosch Technology Centre's Laboratory for Advanced Manufacturing
(STC-LAM) (Steenkamp, Hagedorn-Hansen and Oosthuizen, 2017). The STC-LAM is an
institution that provides excellent quality products in small quantities with high precision
machinery. The present research is developing the smart visualization system for managing the
operator's production performance towards a conventional manufacturing processes company:
where the development of a smart visual management system was developed as an introduction
towards the conventional manufacturing industry that has a minimal number of the digital
approach, unclear plan of the daily task in the production system and lack of communication
skill among operator. This development was done by comparing multiple user interfaces (UI)
to control the operator's production activities in the smart visualization system. This UI was
controlled the operator, where the operator has to interact with any of the visual images that
appear on the screen. The operator's interaction towards the manufacturing activities with the
new smart visual management system was recorded and analyzed to differentiate from the
conventional manufacturing production system. The UI has followed the mieruka concept to
gets the interaction from the operator. Therefore, the present research is intended to contribute
to manufacturing activities, improve operator skill, and develop a cheaper smart visualization
system for use in a production environment of the conventional manufacturing process of other
automotive industries.
1.8. Thesis structure
This section gives a brief overview of the chapter organization in this thesis. Chapter 2 will
investigate the related literature and studies relevant to the development of the Digital Visual
Management System (DVMS). In Chapter 3, overviews of methods that have been constructed
and explained for the research processes. After that, the development processes of DVMS have
presented in Chapter 4. Chapter 5 presents the evaluation processes and results obtained for
related studies and the DVMS. Finally, Chapter 6 summarizes the proposed methods and results
obtained in previous chapters, along with some limitations, putting forward some possible
directions for future research.
14
CHAPTER 2
Literature Review
This chapter will briefly describe and define the visualization, history of visualization, where
it came from, how it functions, when it started to develop, etc. A literature study of visualization
in lean manufacturing also will be described. The entire section of this chapter will let the
readers know about the visualization in the manufacturing industry. Other than that, some
section in this chapter also explaining the visualization application construction industry and
medical sector. Besides, this chapter also introduces the development of visualization with
Industry 4.0. The in-depth studies of the new era's visualization development will give the path
towards developing this research. This chapter is also explaining the innovative tools that have
implemented for IR 4.0 development era. Besides the visualization's advancement, the story
behind successful visualization will also thoroughly explain the right tools and methods for
implementing successful VM tools. The last part of this chapter will elaborate on the literature
of chosen tools and evaluation tools to assess the effectiveness of the visualization's innovation
2.1. Mieruka
Nowadays, Japanese terms have been widely used in this world. Japan has become an example
of most countries in this world (Hamilton and Sanders, 1983). Not only terms but their culture
at any angle has also been spread all around the world. Most of the famous terms used in the
manufacturing side are Kaizen, Kanban, Jidoka, and even the 5S meaning itself has translated
into an English term. Mieruka (見える化) is one Japanese term that has the meaning of
visualization or in-depth visual control. It came from the word mieru (見える) will give the
mean of being able to see and ka (化) for the action of making something (Syed, 2014).
CHAPTER 2: LITERATURE REVIEW
15
Therefore, mieruka gives the meaning of a visual device's capability that can interpret our
actions in any situation. It will evaluate it as fast as possible, whether in standard or deviated
from a visual state. Then, it will prompt any action if it deviates from the standard. Besides,
the word of visual control itself came from the meaning that it can control how it is want to be
through visual.
In the past few decades, mieruka or visualization has been introduced in the Japanese
automotive manufacturing industry by Toyota since they invented the Toyota Production
System (TPS), creating a lean production industry. Lean concept by Taiichi Ohno is to reduce
muda or waste which the things that customer does not pay for it. Thus, Taiichi Ohno creates
a 14 Principles embodied in Part 2 of the book "The Toyota Way" by Jeffrey Liker to explain
how Toyota runs their business. The mieruka concept has been mentioned in the 7th Principe
of the book, "Use Visual Control So No Problem Hidden" (Liker, 2007). Further explanation
of mieruka for lean production has been included in the next sub-section. This section only
paraphrased about the definition of mieruka, where it comes from, when it can use, who the
one in-charge, why mieruka has not spread widely, and how it can innovate.
In this industrial business modernization era, productivity and competitiveness among
industries will increase day by day. At the same time, the reduction of the waste still ongoing
to make it zero. This globalization has highlighted the formation of waste that has never settled.
So, if the waste has not been reduced or removed from the process, the industry's income could
not increase. From that, it results in a static development where the improvement cannot take
place. Story of Hori and the team from the System Development Industry of Hitachi, Ltd,
Kanagawa, Japan, they have used the mieruka to overcome industrial growth. The concept of
mieruka has been used in their plant-floor system that visualizes the total cost ownership
reduction includes the development, maintenance, and management of Hitachi Industrial
Equipment System Co., Ltd., Chiba, Japan. They used mieruka to share and utilize information
by making it visible and understandable to the employee in their industry. They also used the
concept of mieruka by building an architecture system that allows the communication in
between computers and machines in plant-floor systems for the system to run (Hori et al.,
2009). From that, they applied the mieruka concept widely in their industry. Mieruka not only
can be used towards humans but also machines and computers. Machine and computers can
also become the visual device of mieruka that will visualize the information to a human, thus
doing what the visual device information delivers.
CHAPTER 2: LITERATURE REVIEW
16
Mieruka concept has proliferated in most manufacturing industries aligned with Kaizen or
Continuous Improvement to follow and practice the lean concept. Research from Systems
Development Laboratory, Hitachi, Ltd., Japan also by Katsumi Kawano and the team has also
used the mieruka concept to recursively the manufacturing information to make visible at the
factory, thus results in a rapid decision making among stakeholders in the business process
(Kawano, Sameshima and Kato, 2010).
2.1.1. Visualization one of Lean Production technique
Lean production was risen by the young Japanese engineer when Eiji Toyota went on
a three-month pilgrimage to Ford's Rouge plant in Detroit in 1950. Before that, his uncle
Kiichiro had a first visit to Ford in 1929, but many worst things had happened to the Toyoda
family and Toyota Motor Company since they were founded in 1937 until Kiichiro resigned
from the company to accept the responsibility for management failures. From that, Eiji Toyoda
carefully studied Rouge by merely copying and improving it to Toyota Motor Company. Eiji
Toyoda and Taiichi Ohno, the production genius, concludes that the mass production that used
by Rouge could never work in Japan. They were about to implement the Toyota Production
System (TPS), called "lean production". Toyota's first successful example is the textile
machinery business by developing superior technical features on its looms. After that, Toyota's
chief production engineer Taiichi Ohno investigating Detroit's method to be applied towards
Toyota Motor Company, thus improving the TPS (James P. Womack, Daniel Roos, 1990).
The TPS is used interchangeably with lean production because both of them have the
same definition, which is a comprehensive set of techniques that, when combined and matured,
will allow researchers to reduce and then eliminate the wastes (muda). TPS was also the best-
documented lean management system documented by many lean researchers proven itself over
a very long time. This system will make the company leaner and help it become more flexible
and more responsive by reducing waste (Wilson, 2009). Taiichi Ohno, the founder of TPS, said
it even more succinctly:
"All we are doing is looking at the timeline from the moment the customer gives us an order to
the point when we collect the cash. And we are reducing that time line by removing the non-
value-added wastes." (Ohno, 1988)
CHAPTER 2: LITERATURE REVIEW
17
Toyota Takaoka is one of the first lean plants that shows all the visual information such
as daily production targets, numbers of cars produced, equipment breakdown, personnel
shortages, overtime arose, and others (James P. Womack, Daniel Roos, 1990). These were the
example of mieruka tools that shows the production activity in standard or deviated. TPS was
documented and applied it towards their plant, thus shows that the visualization technique
includes in the TPS. One of the visualization techniques used in the Takaoka plant is the andon
boards. These visualization tools are lighted in red, yellow, and green that indicates the machine
or line status. Otherwise, some andon was showing the interactive LED panel that was showing
vital information about the production. This technique will prompt immediate information
about the status of the machine or line of the production. Anyone who visible to the andon
lights will immediately know the machine's current status; it is either in progress, danger, or
trouble. Thus follows with any action required that related to the light shows.
After that, James P. Womack comes with another book named Lean Thinking that tells
what Toyota and other car manufacturing companies do with their factory that makes them
more significant than Europe (James P. Womack, 1996). This book tells about the expansion
of lean production to lean enterprise that allows managers to use lean techniques and maintain
a steady course. Five lean principles allow the manager to do that which is the precisely
specified value by specific product, identify value stream for each product, make value flow
without interruptions, let the customer pull value from the producer, and pursue perfection have
highlighted. These five principles help the company get a zero-waste, which was the goal for
the TPS. In implementing the visualization towards the manufacturing system, all these five
principles have to follow to ensure that the system focuses on reaching zero waste, thus making
the company leaner.
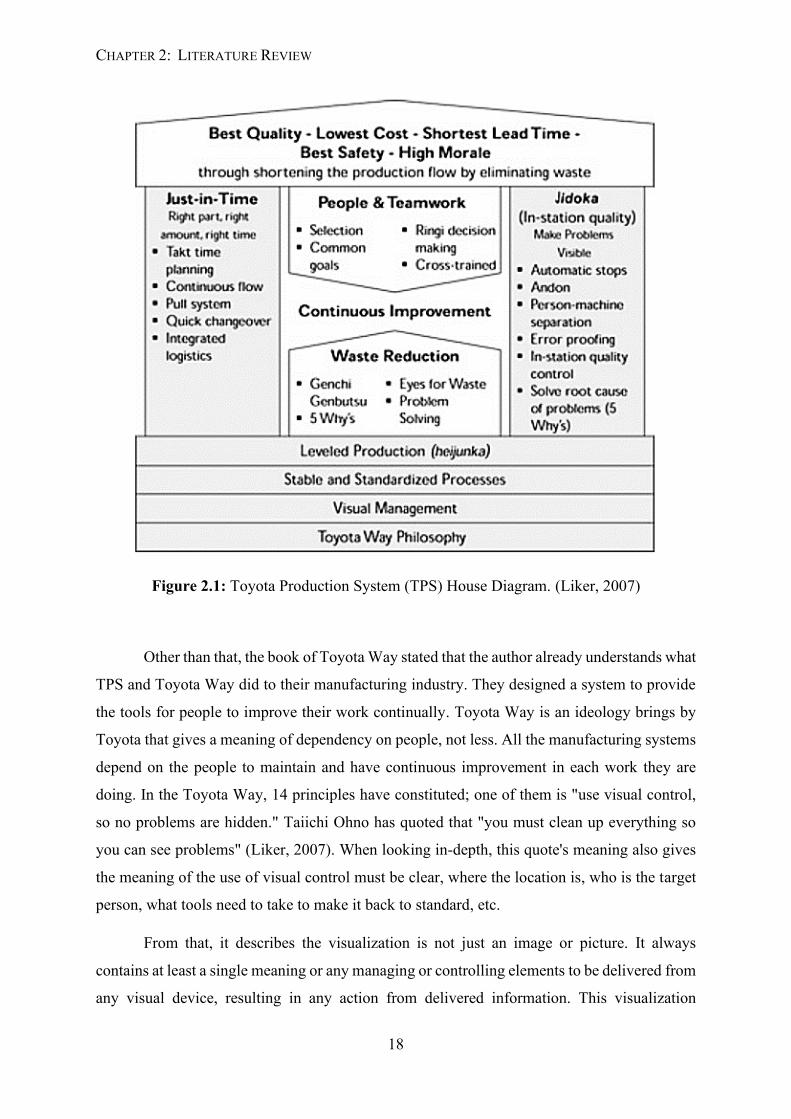
Moreover, the TPS house diagram has become one of the most recognizable symbols
in modern manufacturing (Liker, 2007). It can be seen down below in Figure 2.1. A visual
management system, which is one of the visualization techniques, has become the house's
foundation to support the two pillars, which is just-in-time and jidoka. It gives visualization
meaning of support system for all the listed system above the foundation level. It can visualize
anything related to the production as fast as possible, whether in standard or deviated, thus
prompting any action that will maintain or revert to standard form. Through a visual, a whole
system in manufacturing can manage to reduce waste to zero.
CHAPTER 2: LITERATURE REVIEW
18
Figure 2.1: Toyota Production System (TPS) House Diagram. (Liker, 2007)
Other than that, the book of Toyota Way stated that the author already understands what
TPS and Toyota Way did to their manufacturing industry. They designed a system to provide
the tools for people to improve their work continually. Toyota Way is an ideology brings by
Toyota that gives a meaning of dependency on people, not less. All the manufacturing systems
depend on the people to maintain and have continuous improvement in each work they are
doing. In the Toyota Way, 14 principles have constituted; one of them is "use visual control,
so no problems are hidden." Taiichi Ohno has quoted that "you must clean up everything so
you can see problems" (Liker, 2007). When looking in-depth, this quote's meaning also gives
the meaning of the use of visual control must be clear, where the location is, who is the target
person, what tools need to take to make it back to standard, etc.
From that, it describes the visualization is not just an image or picture. It always
contains at least a single meaning or any managing or controlling elements to be delivered from
any visual device, resulting in any action from delivered information. This visualization
CHAPTER 2: LITERATURE REVIEW
19
technique has much application in manufacturing organizations to make the company lean. It
also can become one of the continuous improvement techniques because it can be innovating
by following the industry trends. Visualization application in Toyota has been discussed and
results in a significant impact on lean. In the sub-section 2.1.3, the most significant
visualization tools that have improved the lean production of manufacturing were highlighted.
All the visualization tools that have success in the lean production were sorted out, and each
tool's brief details were explained. Then the following section will elaborate more of the
application of the significant visualization tools of the manufacturing industry and other
sectors.
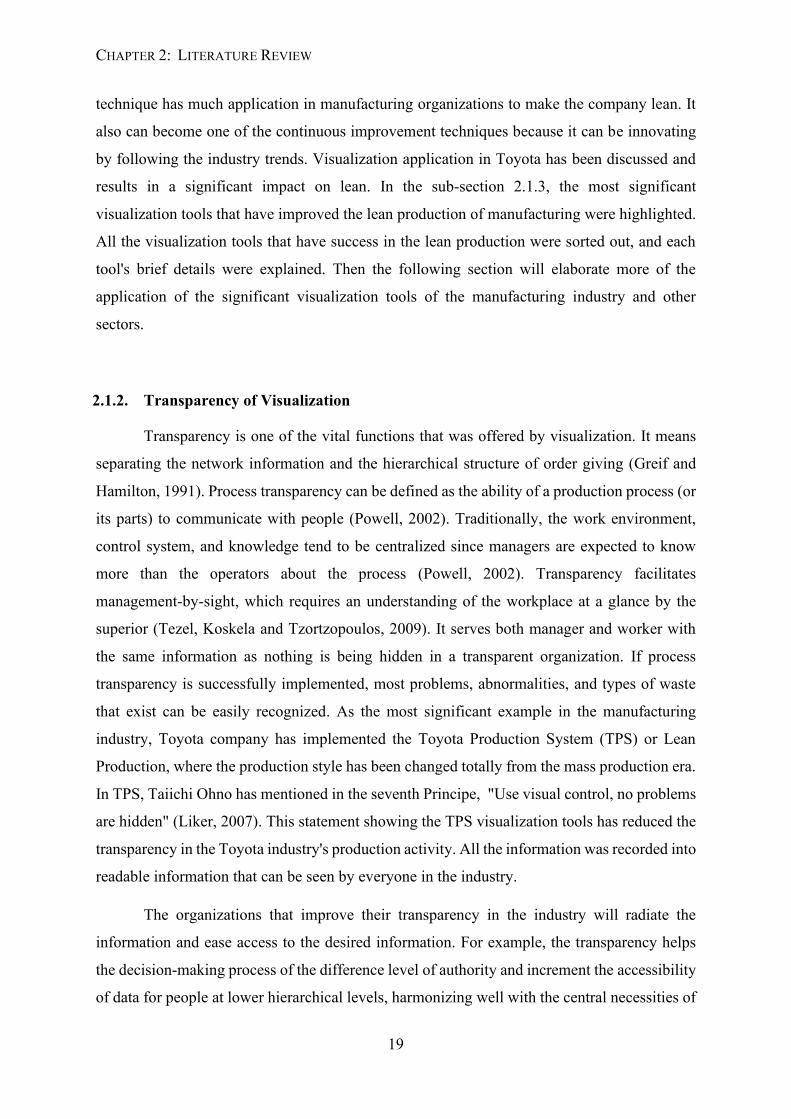
2.1.2. Transparency of Visualization
Transparency is one of the vital functions that was offered by visualization. It means
separating the network information and the hierarchical structure of order giving (Greif and
Hamilton, 1991). Process transparency can be defined as the ability of a production process (or
its parts) to communicate with people (Powell, 2002). Traditionally, the work environment,
control system, and knowledge tend to be centralized since managers are expected to know
more than the operators about the process (Powell, 2002). Transparency facilitates
management-by-sight, which requires an understanding of the workplace at a glance by the
superior (Tezel, Koskela and Tzortzopoulos, 2009). It serves both manager and worker with
the same information as nothing is being hidden in a transparent organization. If process
transparency is successfully implemented, most problems, abnormalities, and types of waste
that exist can be easily recognized. As the most significant example in the manufacturing
industry, Toyota company has implemented the Toyota Production System (TPS) or Lean
Production, where the production style has been changed totally from the mass production era.
In TPS, Taiichi Ohno has mentioned in the seventh Principe, "Use visual control, no problems
are hidden" (Liker, 2007). This statement showing the TPS visualization tools has reduced the
transparency in the Toyota industry's production activity. All the information was recorded into
readable information that can be seen by everyone in the industry.
The organizations that improve their transparency in the industry will radiate the
information and ease access to the desired information. For example, the transparency helps
the decision-making process of the difference level of authority and increment the accessibility
of data for people at lower hierarchical levels, harmonizing well with the central necessities of
CHAPTER 2: LITERATURE REVIEW
20
the hierarchical strengthening practice. Otherwise, the transparency characteristic equipped
with the information-orientated tool, the adaptability, and lean characters helps the modern
organization that has separated with thick walls to communicate.
Transparency has created perfections towards the working environment of the
organization. It simplified the decision-making process for the employees as the information is
ready to access at the fingertip. Transparency has helped the workplace in the improvement
and more prominent decision-making process, the incitement of casual contacts all through
various progressive levels, the commitment towards the presentation of decentralization
arrangements, the help to expand representatives cooperation and the independence in the
executives, progressively successful (covering) circulation of obligations, an expansion in
worker resolve, more adequacy of creation planning, the disentanglement of creation control
frameworks, quick appreciation (by making issues obvious) and reaction to issues (a controlled
speed in dynamic and responsiveness), increment in the inspiration of laborers for development
and permeability of mistakes (Moser and Santos, 2003). In accordance with Grief and
Hamilton, flexibility, versatility, and mobility were also included in work teams when
transparency was into the visualization (Greif and Hamilton, 1991). Precise information will
increase the visibility that assists individuals with building mental models and criticizes their
activities are the fundamentals of UCD (Norman, 1998).
In the book of (Koskela, 2000) summarizes the methods for improving the transparency
in organizations: setting up essential housekeeping to make the working area visible (the
strategy for 5S); making the procedure legitimately noticeable through proper design and
signage; making everything into their standard; rendering imperceptible characteristics of the
procedure obvious through estimation; epitomizing process data in work zones, apparatuses,
holders, materials and data frameworks; using visual controls to empower any individual to
perceive measures and deviations from them quickly; lessening the reliance of creation units.
2.1.3. Visual Management (VM) tools
In the manufacturing industry, there are many types of visualization tools that have
been used. The previous sub-section already mentioned the Toyota Takaoka in Japan that has
been the first company that applied andon boards. Andon boards is an electronic board that
visualizes any data related to the production status. In Toyota Takaoka, andon board was used
to display the target for daily production, the number of cars has been produced for the day,
CHAPTER 2: LITERATURE REVIEW
21
equipment breakdowns, etc. It mentioned that this andon board was visible from every work
station in the plant (James P. Womack, Daniel Roos, 1990). That is the one example of
visualization tools that are used to disseminate information along the visible area.
The visualization tools' main goals were allowing communication, improving safety,
becoming a security device, recognizing law enforcement, human interface, and advertising
(Ortiz and Park, 2011). All these goals have different functionality, but it has the same target:
wanting feedback from a person who interacts with it. Many organizations have indirectly used
the function of visualization to deliver information. All they wanted from a visual device is to
disseminate the information to all of the employees. This sub-section is about to explain in-
depth tools of visualization in the manufacturing industry. It is slightly different from other
organizations because, in the manufacturing industry, visualization tools used to start from the
raw material until the finished products delivered to the customer can cover up the
manufacturing industry's supply chain.
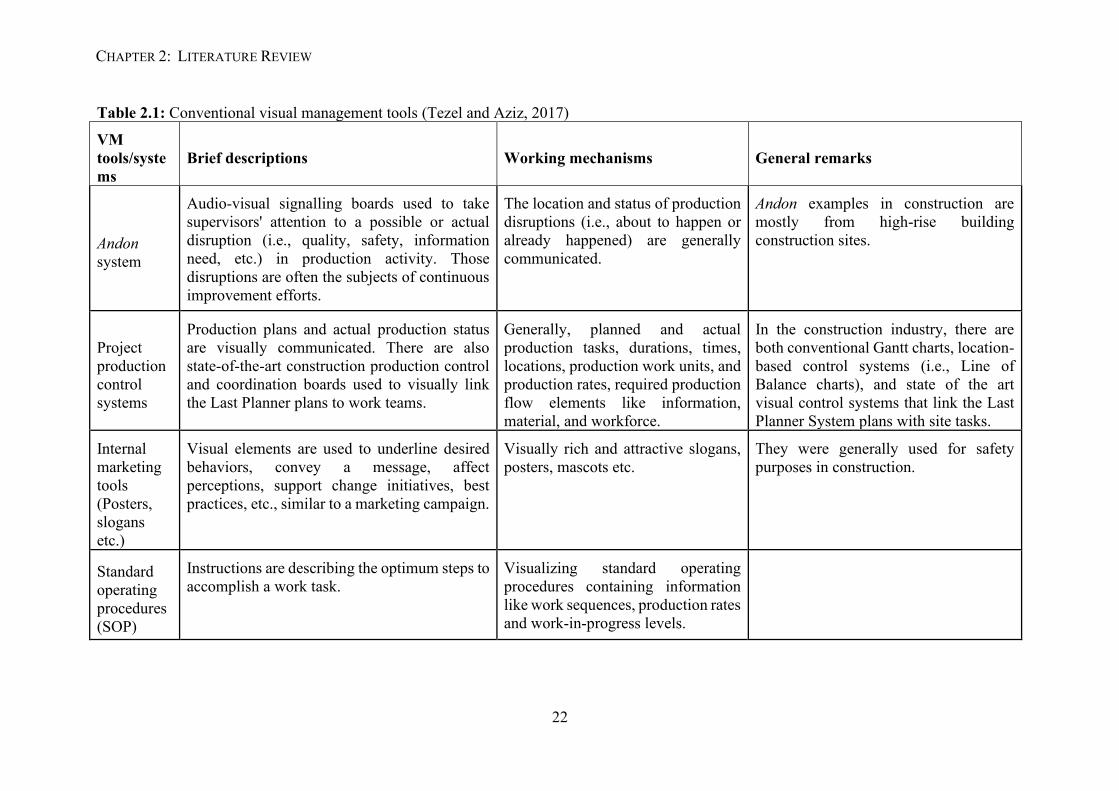
Tezel, Koskela, and Tzortzopoulos already figured out the most functioning visual
management tools from the late 1940s until 2015 and summarized the strategy to implement
the VM tools industry. Table 2.1 listed the conventional VM tools that were reliable to work
with IR 4.0. It also describes the functions with it all characteristic: process transparency,
discipline, continuous improvement, on-the-job training, creating shared ownership, and the
desired image management-by-facts, simplifications, and unification and creating a
boundaryless organization. These conventional VM tools can be an excellent guideline to
innovate new VM tools integrated with current industry technology. It will bring high impacts
to the industry when approaching significant visual tools. It can be saying that most
visualization tools can relate all of the lean production implementations. The innovations can
be easily applied towards developed visual tools. Otherwise, the listed VM tools in the Table
2.1, the emergence of Industry 4.0 technologies has done towards the tools (Tezel and Aziz,
2017). The conclusion can be made towards the visualization where the tools can easily adapt
to the current technology as it promotes continuous improvements.
CHAPTER 2: LITERATURE REVIEW
22
Table 2.1: Conventional visual management tools (Tezel and Aziz, 2017)
VM tools/systems
Brief descriptions Working mechanisms General remarks
Andon system
Audio-visual signalling boards used to take supervisors' attention to a possible or actual disruption (i.e., quality, safety, information need, etc.) in production activity. Those disruptions are often the subjects of continuous improvement efforts.
The location and status of production disruptions (i.e., about to happen or already happened) are generally communicated.
Andon examples in construction are mostly from high-rise building construction sites.
Project production control systems
Production plans and actual production status are visually communicated. There are also state-of-the-art construction production control and coordination boards used to visually link the Last Planner plans to work teams.
Generally, planned and actual production tasks, durations, times, locations, production work units, and production rates, required production flow elements like information, material, and workforce.
In the construction industry, there are both conventional Gantt charts, location-based control systems (i.e., Line of Balance charts), and state of the art visual control systems that link the Last Planner System plans with site tasks.
Internal marketing tools (Posters, slogans etc.)
Visual elements are used to underline desired behaviors, convey a message, affect perceptions, support change initiatives, best practices, etc., similar to a marketing campaign.
Visually rich and attractive slogans, posters, mascots etc.
They were generally used for safety purposes in construction.
Standard operating procedures (SOP)
Instructions are describing the optimum steps to accomplish a work task.
Visualizing standard operating procedures containing information like work sequences, production rates and work-in-progress levels.
CHAPTER 2: LITERATURE REVIEW
23
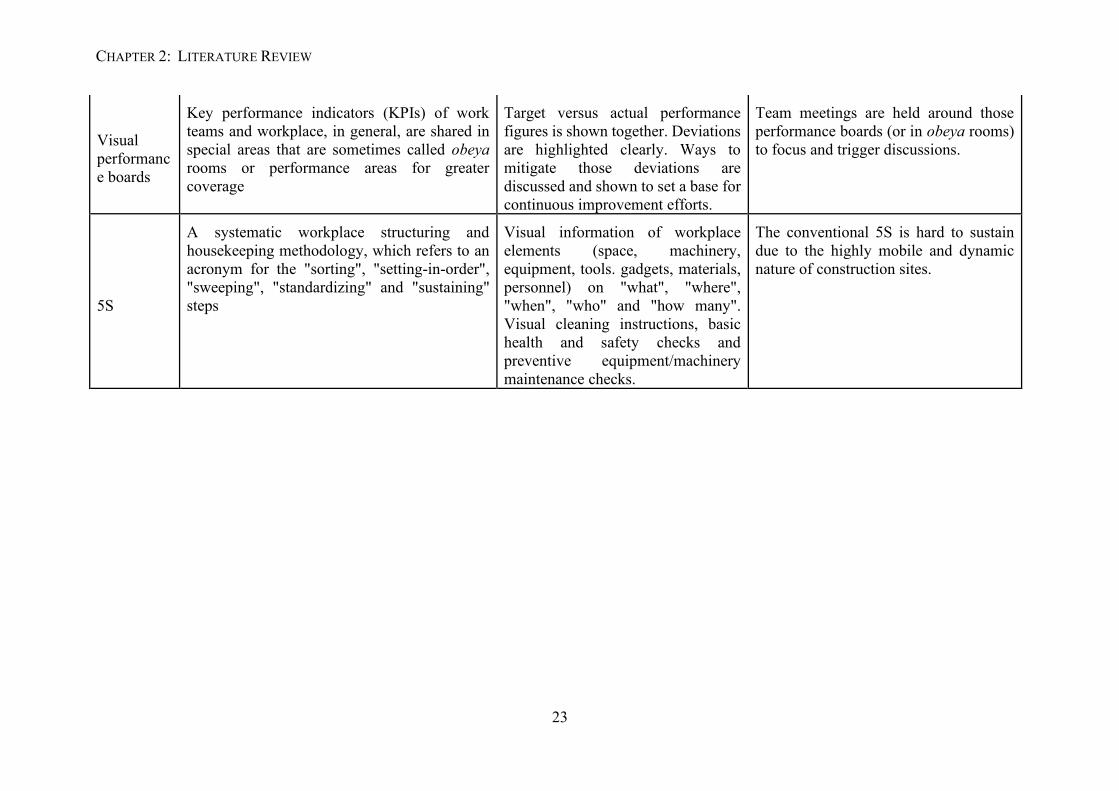
Visual performance boards
Key performance indicators (KPIs) of work teams and workplace, in general, are shared in special areas that are sometimes called obeya rooms or performance areas for greater coverage
Target versus actual performance figures is shown together. Deviations are highlighted clearly. Ways to mitigate those deviations are discussed and shown to set a base for continuous improvement efforts.
Team meetings are held around those performance boards (or in obeya rooms) to focus and trigger discussions.
5S
A systematic workplace structuring and housekeeping methodology, which refers to an acronym for the "sorting", "setting-in-order", "sweeping", "standardizing" and "sustaining" steps
Visual information of workplace elements (space, machinery, equipment, tools. gadgets, materials, personnel) on "what", "where", "when", "who" and "how many". Visual cleaning instructions, basic health and safety checks and preventive equipment/machinery maintenance checks.
The conventional 5S is hard to sustain due to the highly mobile and dynamic nature of construction sites.
CHAPTER 2: LITERATURE REVIEW
24
Furthermore, Bateman, Phlip, and Warrender have conducted a study about the
development, implementation, and use of visual management tools to improve communication.
The study has proved that using the visual management tools called communication boards has
enabled the engagement between the teams and first-line managers in an attractive way to
discuss and solve a problem (Bateman, Philp and Warrender, 2016). To create an attractive
way of constructing communication boards, they have summarized how to approach visual
management tools, which are a must because it is the characteristics of the visual tools itself
that any visualization system or device must-have. First is from (Greif and Hamilton, 1991),
which has said that when using visual tools provides a shared concept of where the factory is
now, it should be, thus leading to team-based participatory problem-solving and
implementation achieve goals. Otherwise, Grief also reminds of implementing visual tools that
are not overloading, bold and colourful, and use standardized approaches across a site but not
be uniform, thus reflecting differences between areas.
Furthermore, (Jaca et al., 2014) has become one of the famous technical paper for
visualization. This paper provides researchers with 20 visual management elements from 52
companies. Most of the companies have only focused on the "marking on the floor" which is
signage, photos, etc. that was 80% on most companies. The advanced visualization tools such
as "maintenance schedule" or "statistical process control" on average have collected less than
50% of the most company. From this, it can be concluded that visualization application has not
been majoring in most companies. Many innovations can make towards the most of visual
tools. Otherwise, most of the visual tools themselves are adaptable to any changes that we can
see early. It can fit kanban, poka-yoke, andon, etc.
From the in-depth study of VM tools of the previous research, some of the tools have
been found out to solve the visualization problems. The listed tools in Table 2.1 were showing
the significant VM tools from the conventional study, where it got the element that can help
the problem-solving process in this research. There were two tools that most likely to be applied
in the digital user interface, the production control system and visual performance board. These
two were chosen due to its characteristics that visualized the essential data of the production. This
production control system will visualize the informative production data, such as tasks in the
production. Then the visual performance board will give the KPIs of the production activity.
So these two were essential VM tools that need to be in the production cell. It will help the
worker keep track of their works and also their performance. An advanced VM can be formed
towards the management level.
CHAPTER 2: LITERATURE REVIEW
25
2.2 Significance of Visualization in Industry
Visualization tools have brought much easiness towards various types of industries.
The visual devices can indicate something that will make people or anything response towards
the visual device by taking any action from the information disseminated through the visual
device. The visualization technique has been used to reduce muda (waste) in lean production.
In the meantime, the implementation of visualization also an impact on increasing
performance. This improvement led to the high-performance industry because when waste was
eliminated or reduced, proportionally will increase the organization's performance. This section
will show and discuss successful visualization implementation, which will significantly impact
that will lead to the lean industry.
The industry's visual approach has not only focused on performance measurement,
KPIs indicator, production monitoring, etc. Otherwise, it can be more than that. Three case
studies for several aerospace companies have been conducted. These studies were to test and
evaluate the application visual management system that can simplify performance management
and allow communication from a different level (Parry and Turner, 2006). The first case study
was at Rolls Royce. The study wants to improve Enterprise Resource Planning (ERP) by using
visualization techniques. The visualization technique was used to communicate the required
output from the ERP system to the shop floor. This development was given benefits in cost
reduction and increased production rate, thus eliminating waste in shipment to the customer.
After that, the second case study was to manage the complex knowledge-based in the Aircraft
Maintenance Manual (AMM) in Airbus UK. AMM is the system that allowing connection
supply chain, people, and also knowledge-based. In this case study, the visual control boards
have been used to increase the transparency in AMM. Visual control boards enable interaction
for the AMM system and make it more interactive due to the operator's feelings. From that,
they get used to it and interact with the system. The last one is in Weston Aerospace, using the
visualization tools to run the report on work packages, resources, and processes for their
organization. From the successful visualization study, Parry and Turner have been admitted
that the visualization system was a robust system that can become tools in controlling
manufacturing.
The powerful visualization has brought interest in most industry organizations in this
world to compete in the global market. With that, it results in the uncontrolled development of
visual management cases. Performance evaluation of visual management then has been created,
CHAPTER 2: LITERATURE REVIEW
26
which also brought an idea of initiating the strategic development of visual management in
case transfer (Murata and Katayama, 2016). Visual development should be focused on
providing valuable benefits to users. Otherwise, it will be categorized under uncontrolled
development, thus creating more waste in the manufacturing industry.
2.2.1. Application of VM in current manufacturing sectors
In previous sections, the VM application that has been explained was mostly used by
the manufacturing industry to manage and control their daily activities. The functionality for
each application also has been briefly explained throughout the sections. In this sub-section,
the application of VM tools in the current manufacturing sector will be briefly explained. The
steps that have been taken to make it efficient also will be explained in detail.
The first case study that this sub-section up to is the communications boards in a British
lock manufacturing company. The graphic design and cognitive psychology elements have
been explored to bring the design principles into the company's previous informal processes.
Thus with the available design principles, an improved VM tool was developed, enabling team
leaders to better engage in problem-solving and continuous improvement (Bateman, Philp and
Warrender, 2016). With this development, improved and precision communication can be
made in a manufacturing company, thus remove the waste produces when the undelivered
information occurred.
Other than that, the current application of visualization has also been further using the
Internet of Things (IoT) features to improve the visual control system's implementation
process. The visual innovation towards IoT features will be discussed more in the following
section. The IoT is the main element that needs to focus on in this study. As an introduction to
IoT, a case study made at Stellenbosch Technology Centre's Laboratory for Advanced
Manufacturing (STC-LAM) in developing the visual management system for resource
management will briefly be explained. This IoT-based visualization system was used to gather
shop floor data and display it in a dashboard for decision-making processes based on the
information stored in the VM tools. Thus comparison can be made towards the historical trend
(Steenkamp, Hagedorn-Hansen and Oosthuizen, 2017). This approach of visual improvement
towards the manufacturing industry has improved the transparency of the industry. Every
information has easy access from the managers. Continuous improvement can be made towards
CHAPTER 2: LITERATURE REVIEW
27
the industry, thus helping the manufacturing sector industry increase their production
efficiency.
Nevertheless, a three-dimensional (3D) monitoring system has formed with the
advancement of visualization technology. This approach has given production management a
piece of creative information on their production line as the 3D data provides effective data
support. The combination of OpenGL modelling and open database connectivity (ODBC) has
been created in the Microsoft Visual C++ V6.0 platform to create the 3D production monitoring
system. The developed system has improved the production system. This development creates
a client-server model where allows the user to read the processed information of machining
processes for each workpiece in 3D. This 3D monitoring system also provides the simulation
on production capacity to maximize the production activity, thus automatically helping the
industry optimize their production activity (Hu and Li, 2018). A better visual of manufacturing
activities can be achieved. All problems or any opportunities in the production activities are
visualized. Thus, trust can build between the manufacturing and the client, helping the
manufacturing industry's business activities.
2.2.2. The uses of VM in other sectors
This section aims to prove that the VM tools' application was just not focused only on
the manufacturing industry sector. These VM tools were also applied in other organizations as
the definition of the VM itself, showing the managing features that include in the VM tools
itself. In the historical background of VM and correspondingly. VM was written in the
encyclopedia of the history of technology by A.K. Corry around 2500 BC. Corry. It describes
the VM was used in construction projects and other related areas by Egyptian Royal Cubit as
the visual measuring standard. Other than, history of evolution management that written by
Daniel A. Wren in his book "The Evolution of Management Thought" around 600 BC also
mentioning the Chinese General Sun Tzu used gongs, flags, and signal fires for communication
and management of his army (Tezel, Koskela and Tzortzopoulos, 2009).
In the modernization era, VM tools in other sectors have already improved with the
uses of information and communication technologies (ICT) in the management system. The
construction site has used the VM tool to manage the activities in about 62 blocks of apartments
spread over 55 hectares by developing a computerized heijunka system. Forklift work has been
distributed and levelled through tablets to inform operators about supply and clean-up activities
CHAPTER 2: LITERATURE REVIEW
28
that need to be performed at the job site. Implementing the advanced VM tools in the
construction industry results in a reduction of idle machines and work stoppage due to the lack
of material and distance travelled. This computerized system has also improved construction
sites' organization and workers' productivity (Barbosa et al., 2013).
Moreover, the VM tools in the construction sector enable the employees in construction
design to comprehend the design efficiently and commit to both their hierarchical qualities and
client needs. Otherwise, the construction sector designers have also used visual scheduling to
meet the projects and deliverables' schedule. The designers quickly make the decision-making
process with visual scheduling to visualize everything (Tjell and Bosch-sijtsema, 2015).
Last but not least, the VM tools have also been gone further in the healthcare sector.
The VM was used to visualize the health and wellness data holistically. This approach helped
the individual enhance all the client's wellness zone by using the visual interface to record and
communicate on the client's wellness. Beyond that, the relationship between coach and client
is closer with the visual interface uses as it maximizes the communication between them. Along
with that, ease of communication of this visual interface helps the full engagement of the coach
towards the client, as the client wellness data will actively provide to the coach. The
implemented VM system helped the coaches to screen the wellness status of the client and to
distinguish issues that need special consideration and further inspiration to improve client
health. The client also was able to monitor their wellness status through the system (Al-
Musawi, 2015).
2.3. The innovation of VM tools
The visual management system is one of the lean techniques that are easy to evolve as
the trend changes. Bunch of innovation has been made towards the visualization system to
eliminate waste and increase the productivity of workers or systems. Innovation in
manufacturing is the one of strategy for growth in a supply chain by producing a good service
or (Innovation Strategy | Product Innovation Strategy | Strategyn, 1999). To create an effective
visual innovation, the needs of the users must be the main reason for the innovation. Users
always want something that, according to the globalization era because they wanted something
that new and trending.
CHAPTER 2: LITERATURE REVIEW
29
Nevertheless, in most companies, managers usually disagree with what the users need
towards the visualization system (Tezel & Aziz 2017). The manager was usually not able to
see what the users were facing on the shop floor. The manager should give the user's voice out
to know what kind of innovation can be implemented to reduce the gap between user and
manager. The limitation of innovation will stop the continuous improvement of the
visualization system. The use of visualization will be limited due to inefficient productivity
techniques.
Visual management system in lean management initially started by the implementation
of andon lights at Toyota Takaoka, Japan, which using of lights with a different colour to
indicates the processing activity (James P. Womack, Daniel Roos 1990). After that, the
development of visualization has been increasing, and the implementation has been broad.
(Tezel & Aziz 2017) has emerging technology such Internet of Things, Augmented Reality,
context-aware and mobile computing, drones and quadcopters, auto-identification (AutoID)
and laser scanning towards conventional visual management that is for the production and
construction such poka-yokes, kanban, heijunka, andon, etc. (Tezel & Aziz 2017). It has
brought much innovation that is connecting visual management with a digital device. In the era
of industry 4.0 that will be discussed in the next sub-section, visual management already
achieved half of the industrial trend. The communication through visual management becomes
easier, even though it was complex due to emerging many techniques.
Nowadays, people always use their smartphones to view email, read the current issue,
save important things, create an event, etc. All the works mostly rely on the phone. Besides,
people nowadays also love their smartphone because it was powerful enough to do works and
also mobile. Some of the company already start emerging the visual management system to
manage or monitor their production into user's smartphones (Kiritsis, 2016). This kind of
innovation increases the awareness of users because people nowadays use smartphones in
negative ways. For example, users tend to play a game while doing work or something that will
reduce the visual attraction. Through this innovation, it creates more awareness of the
production activity or helps users out of works. Other than that, innovation in the visual
management system looks like no end. It always emerges with many technologies in every
industrial revolution.
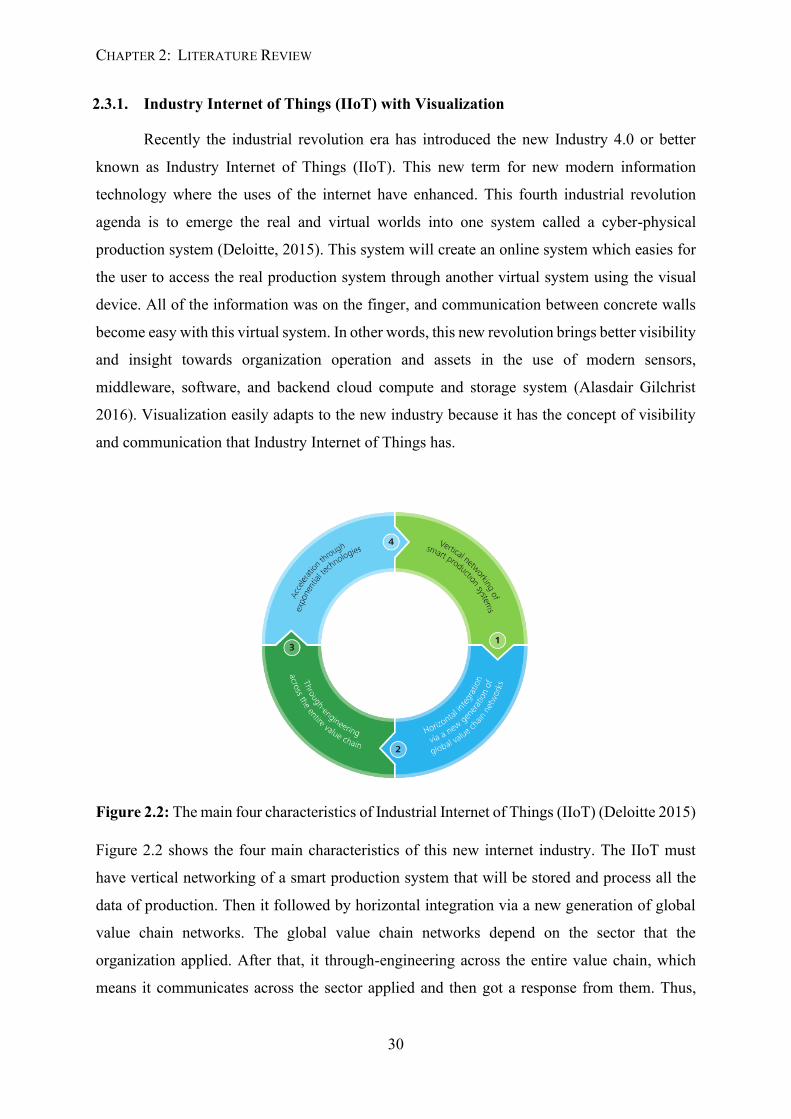
CHAPTER 2: LITERATURE REVIEW
30
2.3.1. Industry Internet of Things (IIoT) with Visualization
Recently the industrial revolution era has introduced the new Industry 4.0 or better
known as Industry Internet of Things (IIoT). This new term for new modern information
technology where the uses of the internet have enhanced. This fourth industrial revolution
agenda is to emerge the real and virtual worlds into one system called a cyber-physical
production system (Deloitte, 2015). This system will create an online system which easies for
the user to access the real production system through another virtual system using the visual
device. All of the information was on the finger, and communication between concrete walls
become easy with this virtual system. In other words, this new revolution brings better visibility
and insight towards organization operation and assets in the use of modern sensors,
middleware, software, and backend cloud compute and storage system (Alasdair Gilchrist
2016). Visualization easily adapts to the new industry because it has the concept of visibility
and communication that Industry Internet of Things has.
Figure 2.2: The main four characteristics of Industrial Internet of Things (IIoT) (Deloitte 2015)
Figure 2.2 shows the four main characteristics of this new internet industry. The IIoT must
have vertical networking of a smart production system that will be stored and process all the
data of production. Then it followed by horizontal integration via a new generation of global
value chain networks. The global value chain networks depend on the sector that the
organization applied. After that, it through-engineering across the entire value chain, which
means it communicates across the sector applied and then got a response from them. Thus,
CHAPTER 2: LITERATURE REVIEW
31
interaction happened among them and created an exponential technology. This characteristic
then circulates to make the IIoT alive.
The development of Industry Internet of Things to the current manufacturing industry
must be linked to lean production implementation to make the lean more advanced and
implemented system efficient. Mrugalska & Wyrwicka conducted case studies on linking lean
production with IIoT. The case studies were to develop a smart product, smart machine, and
augmented operator. In the case studies, most of the lean techniques that have linked to IIoT
were a visualization technique. It can be said that the visualization system was very adaptive
and match well with the IIoT.
2.3.2. Internet of Things devices
Industry Internet of Things (IIoT) has brought a new system called Cyber-Physical System
(CPS) due to rapid advancement in digital computers and boundless communication among
organizations (Alasdair Gilchrist, 2016). After that, it has made expertise to produce a small
and compact device embedded with a powerful microprocessor to run a system such as a
smartphone, Raspberry Pi, ZigBee, etc. These devices only a single processor and have been
called a single-board processor that can run faster than an old big computer.
A comparison among IoT devices have made towards Raspberry Pi, Arduino,
BeagleBone Black, Phidgets and Udoo in terms of size and cost, power and memory,
flexibility, communication and operating system and programming languages (Maksimović et
al., 2014). This comparison has listed in Table 2.2 below. Otherwise, Raspberry Pi has
admitted for a better prototyping project (Maksimovic and Vujovic, 2015). This suggestion
was allowed researchers to develop IoT system using it. From that, it will make the process of
development easier and more convenient for new researchers.
Smart technologies were many developed in the era of IoT. IIoT allows developers to
create anything in the use of the internet, making an environmentally smart by using the IoT
devices for the prototyping, thus lead towards more significant development. Table 2.3 shows
the research that has used the Raspberry Pi to make a smart production system. It has proven
that Raspberry Pi has a significant function. Most of the implemented system that is focusing
on IoT platform has been a success and only has a little limitation on it. It is not just to work
only with the manufacturing sector, but with other sectors also. In developing the prototyping
CHAPTER 2: LITERATURE REVIEW
32
or implementing the smart system with integration of IoT, Raspberry Pi can be used for
controlling, processing, collecting information, data storage, etc. This innovation helps IoT
practitioners to implement a better smart manufacturing system.
Many researchers also using the Raspberry Pi to adapt the IIoT. In visualizing the
beneficial data towards end-user by creating multiple digital visualization GUI with a different
characteristic for a different level (Snatkin et al., 2015). This implementation helped the
dissemination of information towards the correct employer. In this case, if the data for ERP or
OEE towards the production operator that has low knowledge in production, this will create
waste. For Malaysia, most of the production operator still operated by a foreign worker that
has a limited understanding of certain language. This language barrier creates a waste where
vital people cannot use the system. Other than that, to improve the developed GUI has
evaluated the GUI to find out how to improve the GUI (Ragnarsson et al., 2017). The end-user
has tested the GUI the, giving on response about it. From that, a friendly GUI that is informative
and beneficial will be formed to support the visualization in IoT.
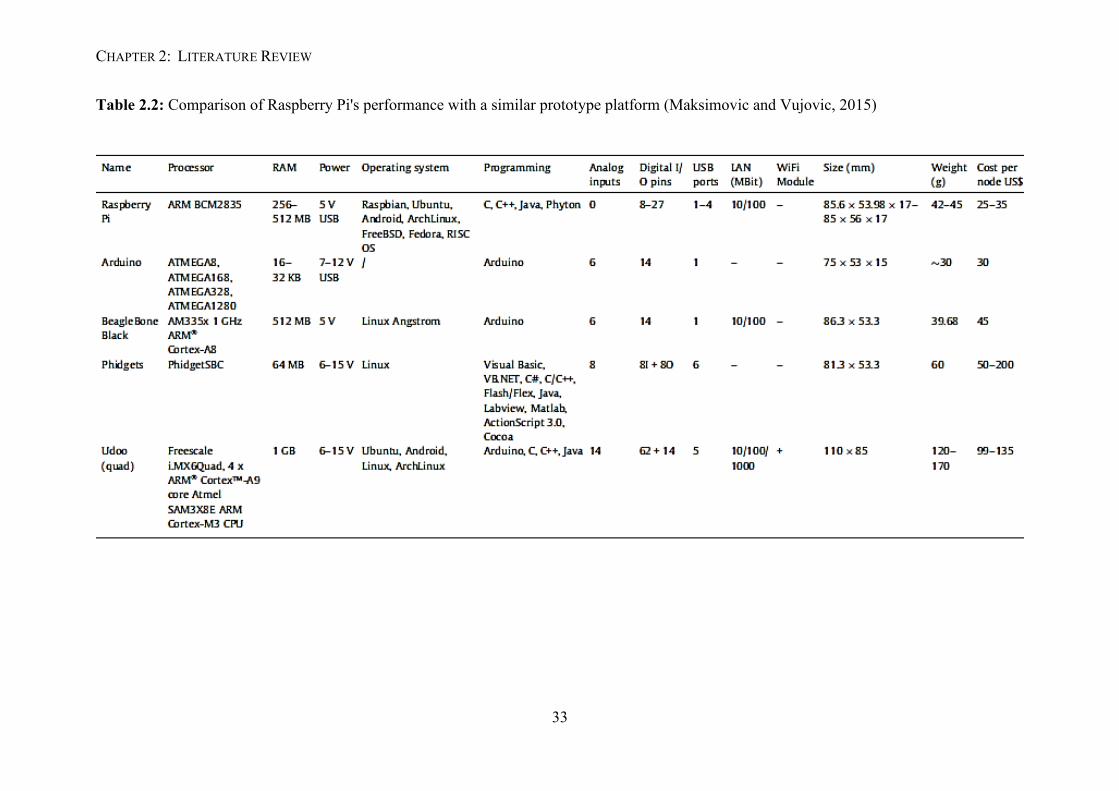
CHAPTER 2: LITERATURE REVIEW
33
Table 2.2: Comparison of Raspberry Pi's performance with a similar prototype platform (Maksimovic and Vujovic, 2015)
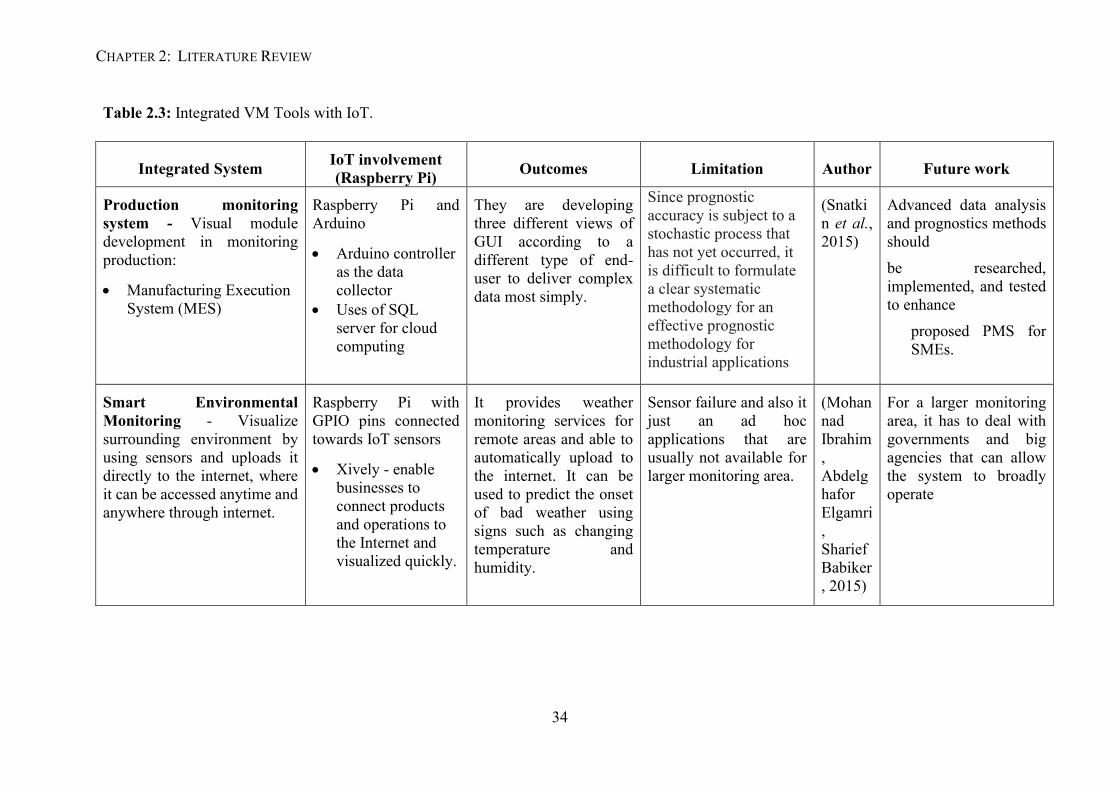
CHAPTER 2: LITERATURE REVIEW
34
Table 2.3: Integrated VM Tools with IoT.
Integrated System IoT involvement (Raspberry Pi) Outcomes Limitation Author Future work
Production monitoring system - Visual module development in monitoring production:
• Manufacturing Execution System (MES)
Raspberry Pi and Arduino
• Arduino controller as the data collector
• Uses of SQL server for cloud computing
They are developing three different views of GUI according to a different type of end-user to deliver complex data most simply.
Since prognostic accuracy is subject to a stochastic process that has not yet occurred, it is difficult to formulate a clear systematic methodology for an effective prognostic methodology for industrial applications
(Snatkin et al., 2015)
Advanced data analysis and prognostics methods should be researched, implemented, and tested to enhance
proposed PMS for SMEs.
Smart Environmental Monitoring - Visualize surrounding environment by using sensors and uploads it directly to the internet, where it can be accessed anytime and anywhere through internet.
Raspberry Pi with GPIO pins connected towards IoT sensors
• Xively - enable businesses to connect products and operations to the Internet and visualized quickly.
It provides weather monitoring services for remote areas and able to automatically upload to the internet. It can be used to predict the onset of bad weather using signs such as changing temperature and humidity.
Sensor failure and also it just an ad hoc applications that are usually not available for larger monitoring area.
(Mohannad Ibrahim, Abdelghafor Elgamri, Sharief Babiker, 2015)
For a larger monitoring area, it has to deal with governments and big agencies that can allow the system to broadly operate
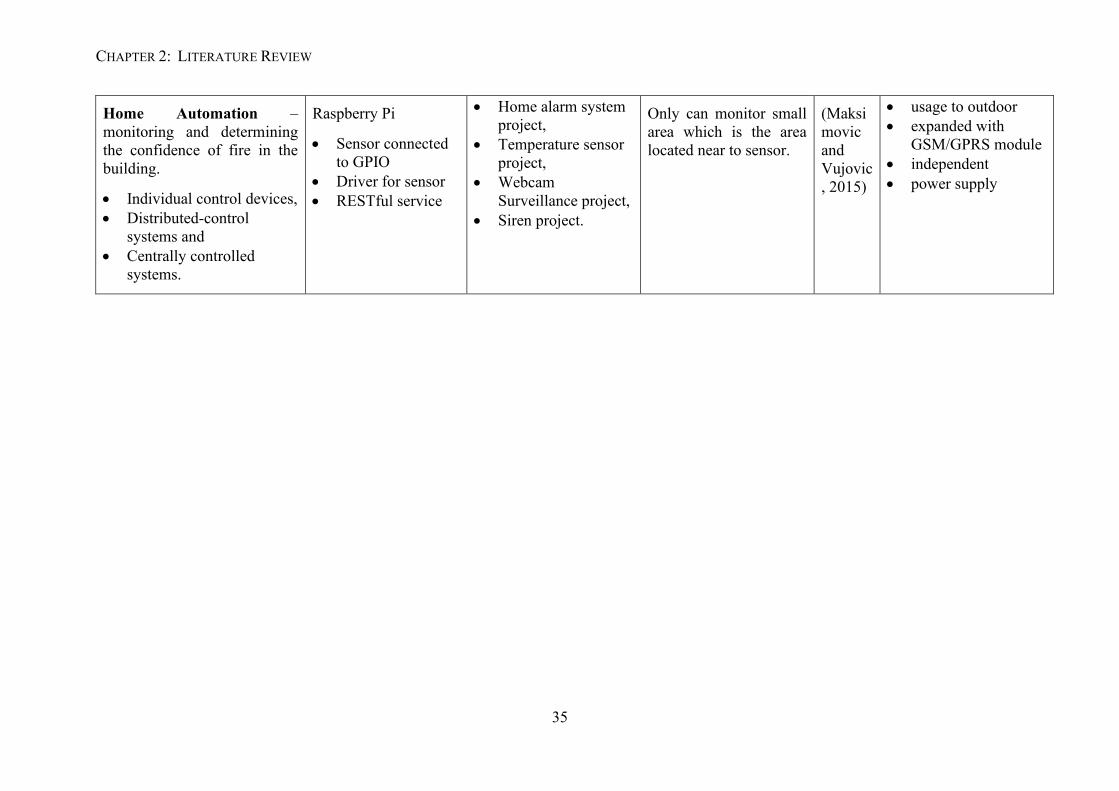
CHAPTER 2: LITERATURE REVIEW
35
Home Automation – monitoring and determining the confidence of fire in the building.
• Individual control devices, • Distributed-control
systems and • Centrally controlled
systems.
Raspberry Pi
• Sensor connected to GPIO
• Driver for sensor • RESTful service
• Home alarm system project,
• Temperature sensor project,
• Webcam Surveillance project,
• Siren project.
Only can monitor small area which is the area located near to sensor.
(Maksimovic and Vujovic, 2015)
• usage to outdoor • expanded with
GSM/GPRS module • independent • power supply
CHAPTER 2: LITERATURE REVIEW
36
2.4. VM system evaluation tools
In order to allow ease of use of visualization tools, the user-centered design (UCD) method has
been introduced. The UCD credibility was studied in this section for innovating this research
new visualization system and followed by usability evaluation to see how satisfied users with
the developed system. The following sub-sections will be explained in detail on the literature
study of UCD method and the usability test that has done by other researchers.
2.4.1. User-centered design (UCD)
User-centered design (UCD) is a process of designing with the end-user. There is no such way
to specifically defined UCD because numerous points of view can characterize it. However, all
the definitions are characterized by focusing on the user’s perspective in developing something
(Devi, Sen and Hemachandran, 2012). Based on Donald Norman, it describes UCD as “a
philosophy based on the user's needs and interests, with an emphasis on making products usable
and understandable” (Norman, 2013). However, users' involvement in the User-Centered
Design process is a common way of ensuring that their needs and interests are being met (Devi,
Sen and Hemachandran, 2012).
Somehow, even though there are many UCD definitions, a specific guideline needs to
be focused on applying the UCD methods towards their study. ISO 13407 standard has outlined
four critical human-centered design activities: requirements gathering, requirements
specification, design, and evaluation. The UCD process has also been formalized in ISO-
standard 13407 Human-centered design processes for an interactive system (ISO
13407:1999(en), Human-centred design processes for interactive systems, 1999). Figure 3.1
visualizes the iterative process of UCD. In applying the standard, some fundamental principles
need to follow:
1. The active involvement of users and a clear understanding of user and task
requirements
2. An appropriate allocation of function between user and system,
3. Iteration of design solutions, and
4. Multi-disciplinary design teams.
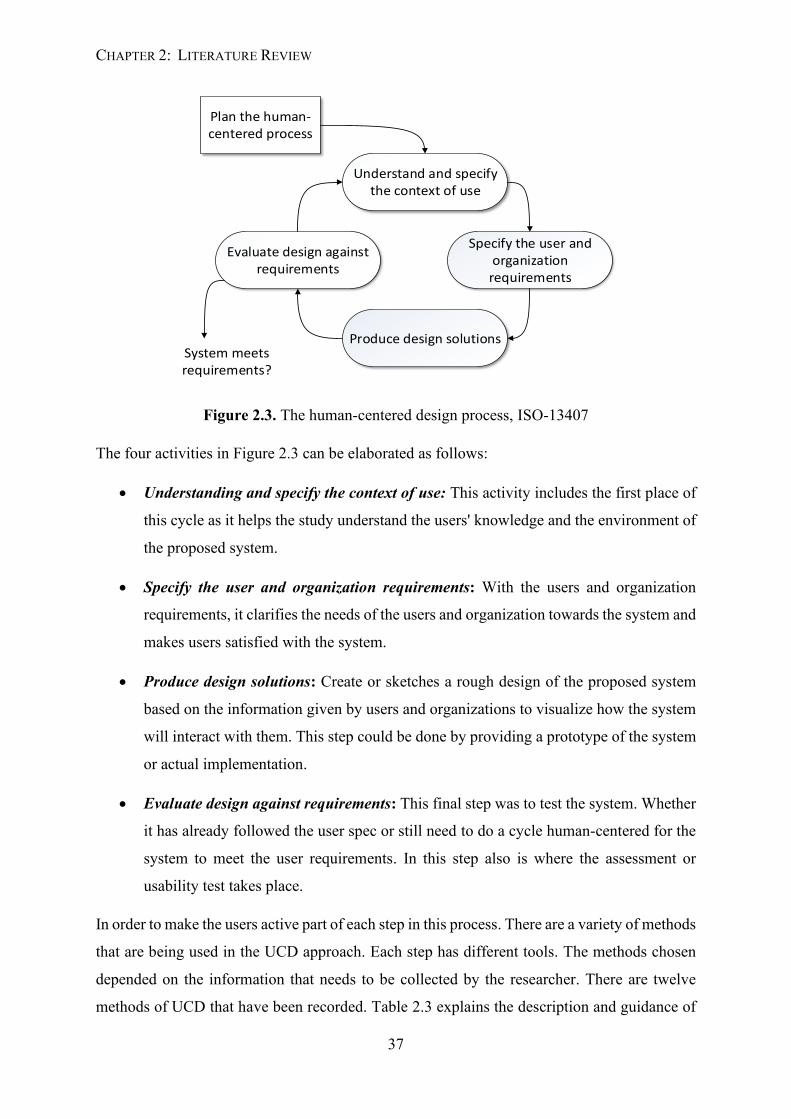
CHAPTER 2: LITERATURE REVIEW
37
Understand and specify the context of use
Plan the human-centered process
Produce design solutions
Evaluate design against requirements
Specify the user and organization requirements
System meets requirements?
Figure 2.3. The human-centered design process, ISO-13407
The four activities in Figure 2.3 can be elaborated as follows:
• Understanding and specify the context of use: This activity includes the first place of
this cycle as it helps the study understand the users' knowledge and the environment of
the proposed system.
• Specify the user and organization requirements: With the users and organization
requirements, it clarifies the needs of the users and organization towards the system and
makes users satisfied with the system.
• Produce design solutions: Create or sketches a rough design of the proposed system
based on the information given by users and organizations to visualize how the system
will interact with them. This step could be done by providing a prototype of the system
or actual implementation.
• Evaluate design against requirements: This final step was to test the system. Whether
it has already followed the user spec or still need to do a cycle human-centered for the
system to meet the user requirements. In this step also is where the assessment or
usability test takes place.
In order to make the users active part of each step in this process. There are a variety of methods
that are being used in the UCD approach. Each step has different tools. The methods chosen
depended on the information that needs to be collected by the researcher. There are twelve
methods of UCD that have been recorded. Table 2.3 explains the description and guidance of
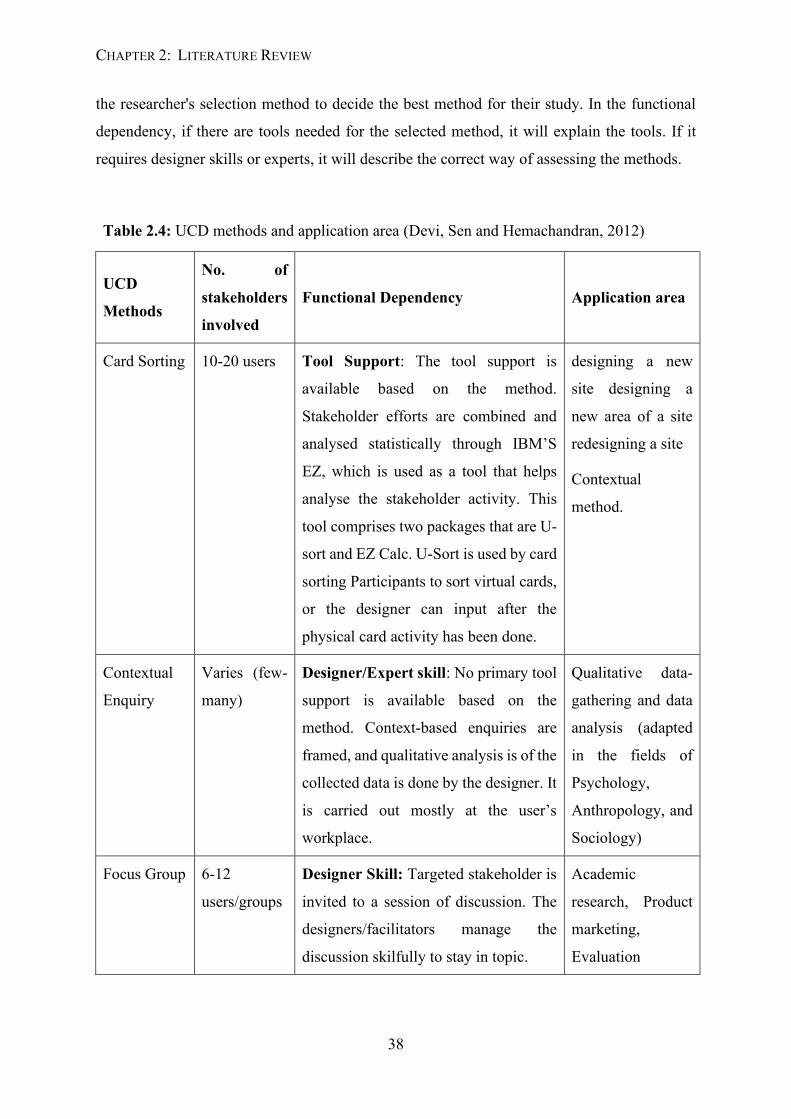
CHAPTER 2: LITERATURE REVIEW
38
the researcher's selection method to decide the best method for their study. In the functional
dependency, if there are tools needed for the selected method, it will explain the tools. If it
requires designer skills or experts, it will describe the correct way of assessing the methods.
Table 2.4: UCD methods and application area (Devi, Sen and Hemachandran, 2012)
UCD
Methods
No. of
stakeholders
involved
Functional Dependency Application area
Card Sorting 10-20 users
Tool Support: The tool support is
available based on the method.
Stakeholder efforts are combined and
analysed statistically through IBM’S
EZ, which is used as a tool that helps
analyse the stakeholder activity. This
tool comprises two packages that are U-
sort and EZ Calc. U-Sort is used by card
sorting Participants to sort virtual cards,
or the designer can input after the
physical card activity has been done.
designing a new
site designing a
new area of a site
redesigning a site
Contextual
method.
Contextual
Enquiry
Varies (few-
many)
Designer/Expert skill: No primary tool
support is available based on the
method. Context-based enquiries are
framed, and qualitative analysis is of the
collected data is done by the designer. It
is carried out mostly at the user’s
workplace.
Qualitative data-
gathering and data
analysis (adapted
in the fields of
Psychology,
Anthropology, and
Sociology)
Focus Group
6-12
users/groups
Designer Skill: Targeted stakeholder is
invited to a session of discussion. The
designers/facilitators manage the
discussion skilfully to stay in topic.
Academic
research, Product
marketing,
Evaluation
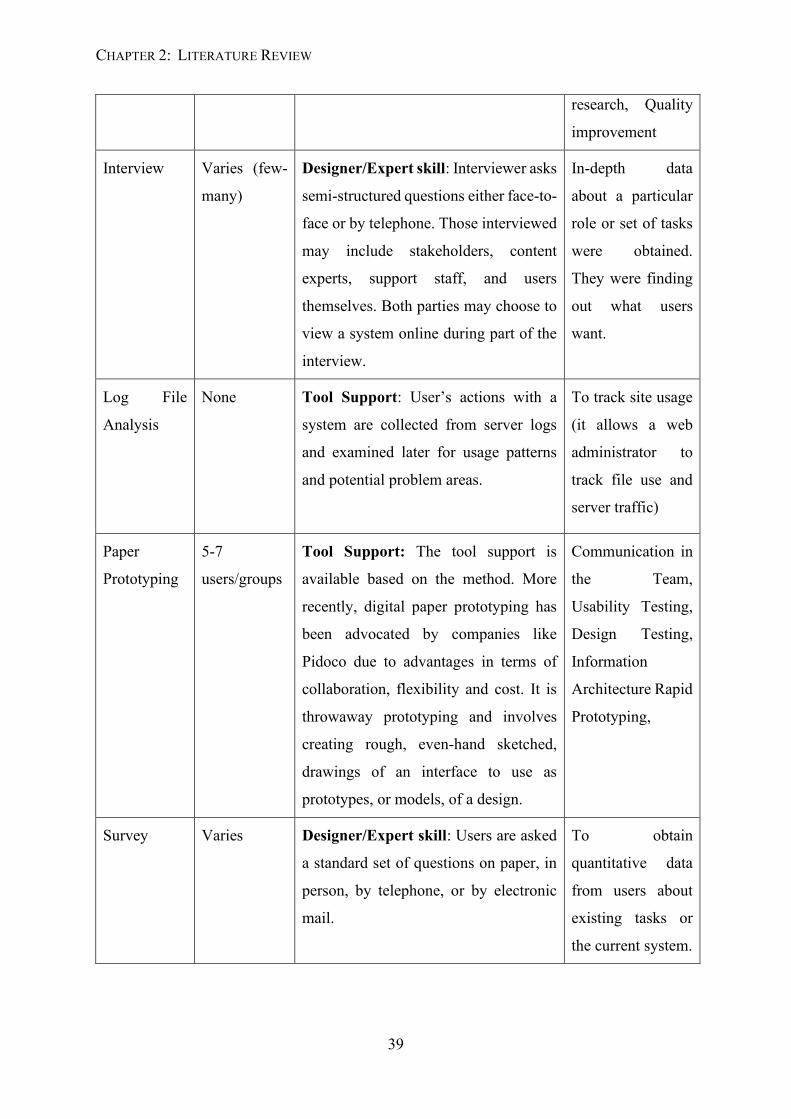
CHAPTER 2: LITERATURE REVIEW
39
research, Quality
improvement
Interview Varies (few-
many)
Designer/Expert skill: Interviewer asks
semi-structured questions either face-to-
face or by telephone. Those interviewed
may include stakeholders, content
experts, support staff, and users
themselves. Both parties may choose to
view a system online during part of the
interview.
In-depth data
about a particular
role or set of tasks
were obtained.
They were finding
out what users
want.
Log File
Analysis
None
Tool Support: User’s actions with a
system are collected from server logs
and examined later for usage patterns
and potential problem areas.
To track site usage
(it allows a web
administrator to
track file use and
server traffic)
Paper
Prototyping
5-7
users/groups
Tool Support: The tool support is
available based on the method. More
recently, digital paper prototyping has
been advocated by companies like
Pidoco due to advantages in terms of
collaboration, flexibility and cost. It is
throwaway prototyping and involves
creating rough, even-hand sketched,
drawings of an interface to use as
prototypes, or models, of a design.
Communication in
the Team,
Usability Testing,
Design Testing,
Information
Architecture Rapid
Prototyping,
Survey
Varies Designer/Expert skill: Users are asked
a standard set of questions on paper, in
person, by telephone, or by electronic
mail.
To obtain
quantitative data
from users about
existing tasks or
the current system.
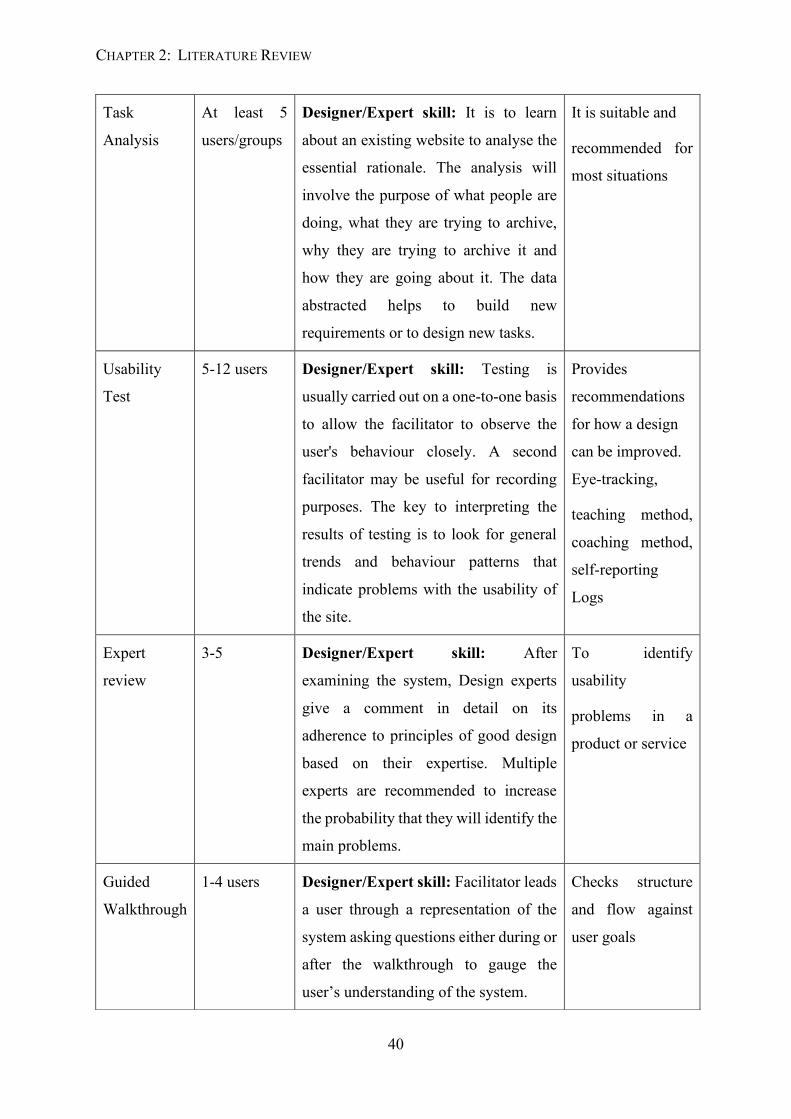
CHAPTER 2: LITERATURE REVIEW
40
Task
Analysis
At least 5
users/groups
Designer/Expert skill: It is to learn
about an existing website to analyse the
essential rationale. The analysis will
involve the purpose of what people are
doing, what they are trying to archive,
why they are trying to archive it and
how they are going about it. The data
abstracted helps to build new
requirements or to design new tasks.
It is suitable and
recommended for
most situations
Usability
Test
5-12 users Designer/Expert skill: Testing is
usually carried out on a one-to-one basis
to allow the facilitator to observe the
user's behaviour closely. A second
facilitator may be useful for recording
purposes. The key to interpreting the
results of testing is to look for general
trends and behaviour patterns that
indicate problems with the usability of
the site.
Provides
recommendations
for how a design
can be improved.
Eye-tracking,
teaching method,
coaching method,
self-reporting
Logs
Expert
review
3-5 Designer/Expert skill: After
examining the system, Design experts
give a comment in detail on its
adherence to principles of good design
based on their expertise. Multiple
experts are recommended to increase
the probability that they will identify the
main problems.
To identify
usability
problems in a
product or service
Guided
Walkthrough
1-4 users Designer/Expert skill: Facilitator leads
a user through a representation of the
system asking questions either during or
after the walkthrough to gauge the
user’s understanding of the system.
Checks structure
and flow against
user goals
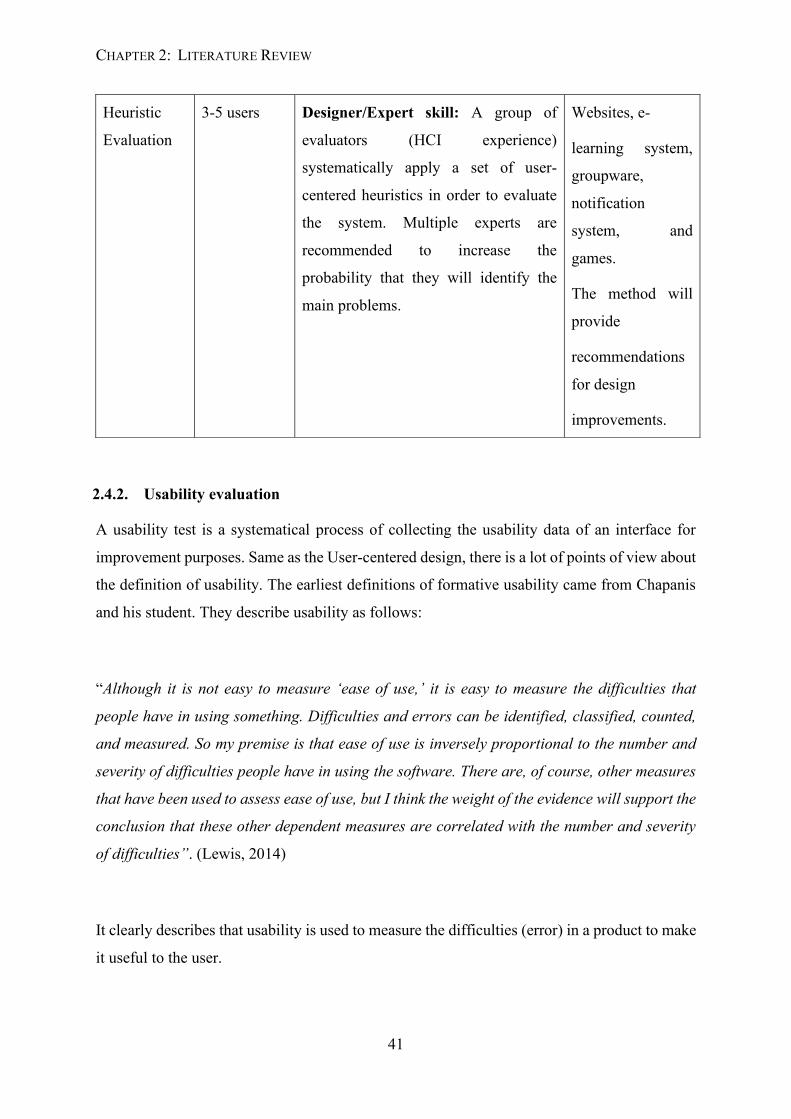
CHAPTER 2: LITERATURE REVIEW
41
2.4.2. Usability evaluation
A usability test is a systematical process of collecting the usability data of an interface for
improvement purposes. Same as the User-centered design, there is a lot of points of view about
the definition of usability. The earliest definitions of formative usability came from Chapanis
and his student. They describe usability as follows:
“Although it is not easy to measure ‘ease of use,’ it is easy to measure the difficulties that
people have in using something. Difficulties and errors can be identified, classified, counted,
and measured. So my premise is that ease of use is inversely proportional to the number and
severity of difficulties people have in using the software. There are, of course, other measures
that have been used to assess ease of use, but I think the weight of the evidence will support the
conclusion that these other dependent measures are correlated with the number and severity
of difficulties”. (Lewis, 2014)
It clearly describes that usability is used to measure the difficulties (error) in a product to make
it useful to the user.
Heuristic
Evaluation
3-5 users
Designer/Expert skill: A group of
evaluators (HCI experience)
systematically apply a set of user-
centered heuristics in order to evaluate
the system. Multiple experts are
recommended to increase the
probability that they will identify the
main problems.
Websites, e-
learning system,
groupware,
notification
system, and
games.
The method will
provide
recommendations
for design
improvements.
CHAPTER 2: LITERATURE REVIEW
42
Usability has an international standard definition in ISO 9241 part 11. It defines
usability as the extent to which specified users can use a product. It used to achieve specified
goals with effectiveness, efficiency, and satisfaction in a specified context of use (ISO 9241-
11:2018(en), Ergonomics of human-system interaction — Part 11: Usability: Definitions and
concepts, 2018). Definitions provided can be derived from the usability concept. It used to
understanding and measuring the product's boundaries against a lot of predefined objectives
based on the user perspective, the context of use and purposes. From that, the researcher can
minimize the gap between the parameters and apply ease of use towards the products.
In measuring the parameters to close the gap, there is some specific method of usability
testing that has been specializing for a different type of approach. This section has selected
several usability testing methods suited to the delimitation of this research. The usability
method that was going to be explored are as follow:
• Heuristic evaluation: An inspection will be done towards the user interface (UI) to
identify the usability problems in a glance, which are not necessarily found in user
testing. Experts and non-experts can do this. The more experts take place, and more
problems can be found. Normally, around 3 to 5 of usability experts are required to
undergo this method on their knowledge of human cognition and interface design rules
of thumb or heuristics (Ghasemifard et al., 2015).
• User-based testing method: this method allows the user to explore and use the system
with several tasks. While exploring and operating the system, the user will be observed
by the investigator to record any issues arising from the test. Beyond that, the required
time on task completion or task completion rates or some errors will be recorded by the
investigator for data analysis. When system imperfections have been recognized,
suggestions on improvement are proposed to make the ergonomic nature of the item
become better. In operating the user-based testing method, there is a suggested step in-
order to conduct the test (Bastien, 2008):
• The meaning of the test objectives,
• The capability and enlistment of tests members,
• The determination of undertakings members should figure it out,
• The creation and depiction of the undertaking situations,
• The decision of the measures that will be made just as how the information will
be recorded,
CHAPTER 2: LITERATURE REVIEW
43
• The planning of the test materials and the test condition (the convenience
research facility),
• The decision of the analyser, and the structure of the test convention essentially
(directions, plan convention, and so on.),
• The structure or potentially the determination of fulfilment surveys, the
information examinations strategies,
• The introduction and correspondence of the test outcomes.
The researcher must fulfil the steps listed above to do this method. If the
requirement does not acquire by the researcher, it will not help the advancement process
of the system could not be achieved. The subjects that will be tended to were the number
of members one needs to select for: leading a client test, the test technique, directing
client test remotely, the devices accessible and expected to lead ease of use tests, and
the assessment of versatile applications.
• Standardized usability questionnaire: A questionnaire is a form designed to obtain
information from respondents. The items in a questionnaire can be open-ended
questions but are more typically multiple-choice, with respondents selecting from a set
of alternatives. A self-reported data will be gathers on identified tasks for this method.
The questionnaires measure the user experience and help identify the usability problems
on the created system which need to be improved. These standardize questionnaires
normally measure parameters such as user satisfaction, effectiveness, usefulness, ease
of use, and interface quality. For this research, the chosen standardize questionnaire is
Post-Study System Usability Questionnaire (PSSUQ). This questionnaire designed
to assess the user’s satisfaction with the computer system. The origin of PSSUQ was
an internal IBM project called System Usability MetricS (SUMS). As for now, PSSUQ
has three versions of the standardized questionnaire. This research was using the latest
version of PSSUQ, which PSSUQ Version 3 that has a total of 16 questions. PSSUQ
items produce four scores – one overall, and three subscales (Sauro and Lewis, 2012).
o Overall: Average the response for items 1 through 16 (all the items)
o System Quality (SysQual): Average items 1 through 6
o Information Quality (InfoQual): Average items 7 through 12
o Interface Quality (IntQual): Average items 13 through 15
CHAPTER 2: LITERATURE REVIEW
44
The overall PSSUQ coefficient alpha is reflecting the reliability of the system was 0.94.
Furthermore, for the SysQual, InfoQual, and IntQual is 0.9, 0.91, and 0.83, respectively.
2.5. Discussion on Literature Review
Visual Management (VM) system have been advancing in past decades. Different approaches
are made not only to improve the transparency of the system itself but also to improve the
production performance as the demands in the global customers were indefinitely increased. In
this section, the challenges of implementing the perfect visualization tools with the emergence
of IR 4.0 technologies into Autokeen production activities will be discussed.
Initially, the literature study has been done towards the mieruka (visualization) as it one
of the technique in Lean Production system that promoting transparency into an organization.
Then, it followed with the Visual Management (VM) tools that have been shortlisted as the
most significant visualization in this era. From that, the picture of improving the visualization
tools in Autokeen to promote transparency has been depicted. The VM tools in the literature
study have been promoting much transparency to make the organization managed well. The
literature study of visualization has been compared with the conventional visualization tools in
Autokeen to generate something that was going to useful for the Autokeen production activity.
After that, a literature study went through the significance of VM in the current
manufacturing industry and other sectors. This focus was conduct to understand how the
application of VM can help the organization figuring the problem that they are facing before
the implementation of VM. With the brief explanation of other sectors that uses VM, this
literature study provides a clear purpose for the implementation of the new VM tools in
Autokeen. The new implemented VM system need to plan their production activity with the
VM system visually, where the main focus was to works as the production control system for
Autokeen. In this situation, the VM implementation also needed to follow the new trend of IR
4.0, where distinction process of system implementation needs to be carried out by the
researcher. With that, it results in the researcher was chosen the devices generated in the IoT
era with the concept of IR 4.0, where sensors were used to collect data. The user interface (UI)
will represent the collected data as it processed the visual image of the VM system.
In completing the implementation process, the literature study of the system evaluation
processes has done to figure out the best way of system development. The suggested evaluation
CHAPTER 2: LITERATURE REVIEW
45
process of previous research has compared to distinguish what is the most suitable evaluation
process for the developed VM tools. Thus, a reliable evaluation process can be conducted to
get the feedbacks user from Autokeen to fulfil the criteria of this research.
2.6. Summary
In this chapter, the researcher has done the literature study on the mieruka or visualization,
where it briefly explained the definition of mieruka. This word comes from a Japanese word
that gives the meaning of visualization or in-depth visual control that can see. The other
definition of the visualization also was explained. Where it shows the visualization promoting
the capability of the visual device to interpret any action with robust circumstances, this action
then followed with the evaluation processes of the deviated state. Then, further actions will
appear to correct the mistakes in the process until they perfect.
Furthermore, the historical study of visualization has conducted towards the lean
production system. This study shows where the uses of visualization start to developed in the
Japan manufacturing industry. Then the study followed to elaborate more on the transparency
of visualization. The transparency has helped much organization by promoting the ease of
communication. After that, a literature study towards the various significance of visualization
in a different type of industry. The application of current visualization system in manufacturing
and other sectors such as healthcare and construction in managing and controlling the
businesses. In the meantime, the researcher also figures out the reliable visual management
(VM) tools after the modernization era to distinguish the non-functional VM tools from the
study. Besides, the literature study has gone through towards the innovated VM tools, where it
shows the engagement of VM with IR 4.0 as this study was focusing on the IR 4.0 approach.
Later by this chapter, the literature study was conducted in how accessing the evaluation study
towards developed visualization tools that consist of Internet of Things (IoT) features. A UCD
method was introduced towards this study by explaining the steps have done by the researcher
to get a UCD approach done. Last but not least, the usability test has also described the methods
on how to access the user satisfaction and system usefulness when implementing the
visualization system.
46
CHAPTER 3
Research Method
This chapter will briefly explain the development process of the Digital Visual Management
System (DVMS). In chapter 1, the researcher has mentioned the DVMS as the smart
visualization system that is going to manage and control the production processes. In the
creation of the DVMS, few processes need to be taken iteratively on designing and
implementing the system. The iterative process of the development will be explained stage-by-
stage. The details of the methods taken for each process were going to describe in this chapter.
Otherwise, the DVMS architecture described in details, from scratch into the final product,
including all stages. Every stage of constructions the DVMS was followed by an evaluation
study. The evaluation processes were going to specify in this chapter, where the data collection
processes were introduced into stages.
3.1 The iterative process of DVMS development
The main study objective is to implement an interactive VM system with the emergence of IoT
features called DVMS. In the development process of DVMS, multiple processes need to be
taken, which lead to different objectives. With that, a bunch of different steps has taken to
achieve those objectives. In order to do so, the researcher has decided to divide the process into
several phases. All the processes have classified with the different objectives that need to be
achieved in a different phase. In chapter 1, the cross-functional flowchart has depicted the
phases that his study had as the following: an initial phase, prototyping phase and an
implementation phase that every phase. Each phase has explained the tests taken to make sure
it is suited to the study.
CHAPTER 3: RESEARCH METHOD
47
The initial phase was to get to know the concept of mieruka or VM as a part of the lean
production system. With the first approach, it strengthened the knowledge of mieruka towards
the researcher, thus allowing the researcher to distinguish the useful VM tools for the Autokeen
industry. The investigation process was to figure out the digitization of VM on the proposed of
DVMS. The proposed DVMS was used to deliver a bunch of information interactively, which
aimed to reduce the transparency of the Autokeen organization. The theories of the
visualization also have been highlighted throughout the initial phase. As this research also is
an industrial-based problem research, the initial phase contained interviews with the industry
partner. This visit was to collect user requirements from the industry and proceed with the user-
centered design (UCD) approach for designing the DVMS. From that, the initial draft of DVMS
has formed. The draft then used to develop the mockup user interface (UI) from the scratch and
counting device that are going to based on the Raspberry Pi. After the development process has
completed, it has shown towards the stakeholders to judge the rough idea of the researcher
before going to prototype the UI. With that, it results in the changes the ideas of the UI and
counting device. These changes have brought the DVMS into the next UCD cycle that will be
in the second phase of this research study.
In the prototyping phase, the development of DVMS has continued with the second
UCD cycle attempt. The judgment of stakeholders has become the requirements in the UCD
process. The researcher has enhanced the counting process and the UI of the DVMS. The
DVMS was running over the Raspberry Pi 3 (RPi-3) and tested in the lab before it the
evaluation process takes place. After several testing has done towards the second phase of
DVMS development, it has brought over the Autokeen. At this moment, the DVMS is ready to
be evaluated by the users in Autokeen. The reliability of the RPi-3 was tested and feedbacks
from the users have gained. From the evaluation processes, the DVMS UI found out was still
lack of information. It has not met up some requirements from Autokeen. Third UCD cycle
needs to done to satisfy Autokeen.
Finally, the implemented evaluation study has resulted in this implementation phase.
The unsolved requirements have led to the third UCD cycle, where the DVMS need two
different UI for managing and controlling the production activity. The functional features in
the previous DVMS UI need to be separated. All the other features were polished before it
being prepared for the next evaluation processes. The RPi-3 was replaced with RPi-4 for more
performance. All the apparatus of the DVMS was prepared and run multiple times to make it
ready for the second evaluation study. After all, the prototype phase appeared to match up all
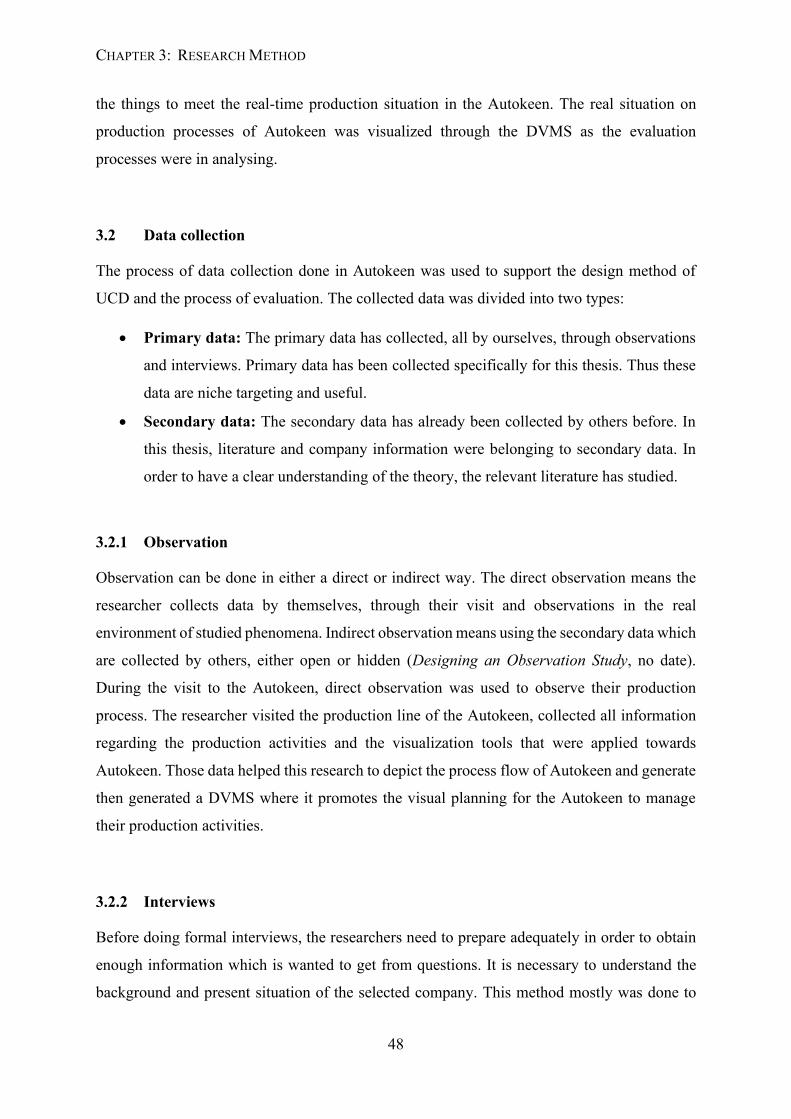
CHAPTER 3: RESEARCH METHOD
48
the things to meet the real-time production situation in the Autokeen. The real situation on
production processes of Autokeen was visualized through the DVMS as the evaluation
processes were in analysing.
3.2 Data collection
The process of data collection done in Autokeen was used to support the design method of
UCD and the process of evaluation. The collected data was divided into two types:
• Primary data: The primary data has collected, all by ourselves, through observations
and interviews. Primary data has been collected specifically for this thesis. Thus these
data are niche targeting and useful.
• Secondary data: The secondary data has already been collected by others before. In
this thesis, literature and company information were belonging to secondary data. In
order to have a clear understanding of the theory, the relevant literature has studied.
3.2.1 Observation
Observation can be done in either a direct or indirect way. The direct observation means the
researcher collects data by themselves, through their visit and observations in the real
environment of studied phenomena. Indirect observation means using the secondary data which
are collected by others, either open or hidden (Designing an Observation Study, no date).
During the visit to the Autokeen, direct observation was used to observe their production
process. The researcher visited the production line of the Autokeen, collected all information
regarding the production activities and the visualization tools that were applied towards
Autokeen. Those data helped this research to depict the process flow of Autokeen and generate
then generated a DVMS where it promotes the visual planning for the Autokeen to manage
their production activities.
3.2.2 Interviews
Before doing formal interviews, the researchers need to prepare adequately in order to obtain
enough information which is wanted to get from questions. It is necessary to understand the
background and present situation of the selected company. This method mostly was done to
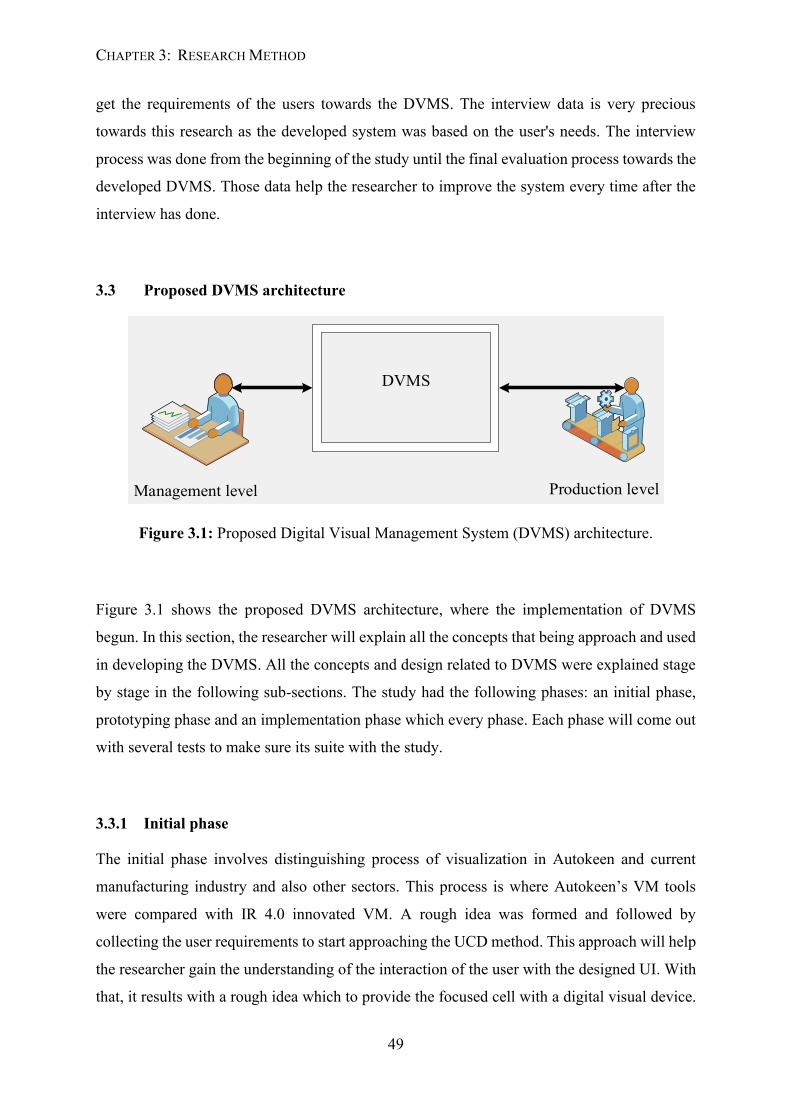
CHAPTER 3: RESEARCH METHOD
49
get the requirements of the users towards the DVMS. The interview data is very precious
towards this research as the developed system was based on the user's needs. The interview
process was done from the beginning of the study until the final evaluation process towards the
developed DVMS. Those data help the researcher to improve the system every time after the
interview has done.
3.3 Proposed DVMS architecture
Production levelManagement level
DVMS
Figure 3.1: Proposed Digital Visual Management System (DVMS) architecture.
Figure 3.1 shows the proposed DVMS architecture, where the implementation of DVMS
begun. In this section, the researcher will explain all the concepts that being approach and used
in developing the DVMS. All the concepts and design related to DVMS were explained stage
by stage in the following sub-sections. The study had the following phases: an initial phase,
prototyping phase and an implementation phase which every phase. Each phase will come out
with several tests to make sure its suite with the study.
3.3.1 Initial phase
The initial phase involves distinguishing process of visualization in Autokeen and current
manufacturing industry and also other sectors. This process is where Autokeen’s VM tools
were compared with IR 4.0 innovated VM. A rough idea was formed and followed by
collecting the user requirements to start approaching the UCD method. This approach will help
the researcher gain the understanding of the interaction of the user with the designed UI. With
that, it results with a rough idea which to provide the focused cell with a digital visual device.
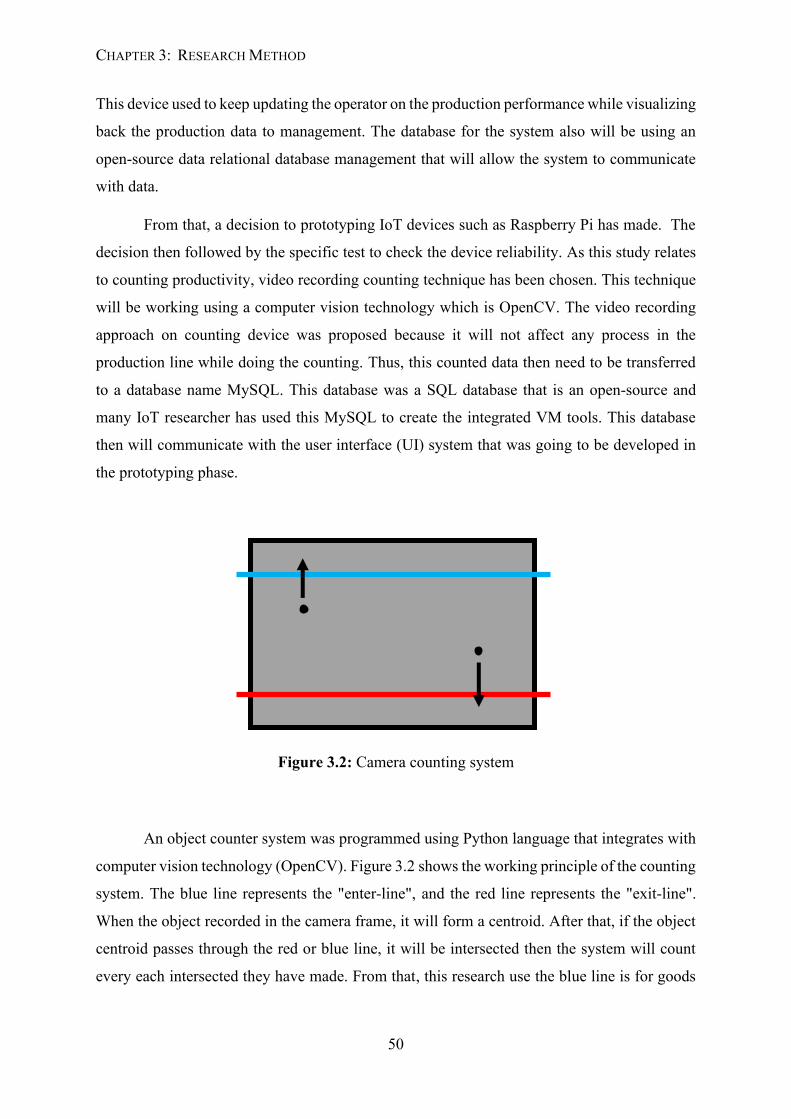
CHAPTER 3: RESEARCH METHOD
50
This device used to keep updating the operator on the production performance while visualizing
back the production data to management. The database for the system also will be using an
open-source data relational database management that will allow the system to communicate
with data.
From that, a decision to prototyping IoT devices such as Raspberry Pi has made. The
decision then followed by the specific test to check the device reliability. As this study relates
to counting productivity, video recording counting technique has been chosen. This technique
will be working using a computer vision technology which is OpenCV. The video recording
approach on counting device was proposed because it will not affect any process in the
production line while doing the counting. Thus, this counted data then need to be transferred
to a database name MySQL. This database was a SQL database that is an open-source and
many IoT researcher has used this MySQL to create the integrated VM tools. This database
then will communicate with the user interface (UI) system that was going to be developed in
the prototyping phase.
Figure 3.2: Camera counting system
An object counter system was programmed using Python language that integrates with
computer vision technology (OpenCV). Figure 3.2 shows the working principle of the counting
system. The blue line represents the "enter-line", and the red line represents the "exit-line".
When the object recorded in the camera frame, it will form a centroid. After that, if the object
centroid passes through the red or blue line, it will be intersected then the system will count
every each intersected they have made. From that, this research use the blue line is for goods
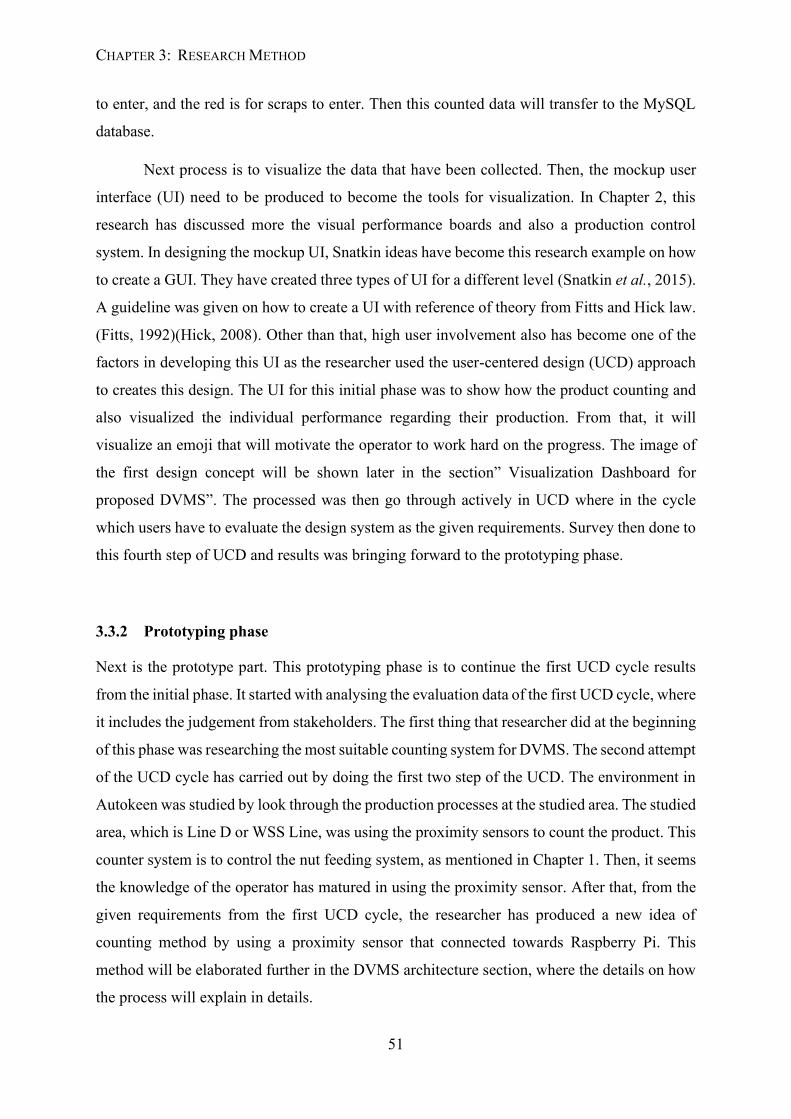
CHAPTER 3: RESEARCH METHOD
51
to enter, and the red is for scraps to enter. Then this counted data will transfer to the MySQL
database.
Next process is to visualize the data that have been collected. Then, the mockup user
interface (UI) need to be produced to become the tools for visualization. In Chapter 2, this
research has discussed more the visual performance boards and also a production control
system. In designing the mockup UI, Snatkin ideas have become this research example on how
to create a GUI. They have created three types of UI for a different level (Snatkin et al., 2015).
A guideline was given on how to create a UI with reference of theory from Fitts and Hick law.
(Fitts, 1992)(Hick, 2008). Other than that, high user involvement also has become one of the
factors in developing this UI as the researcher used the user-centered design (UCD) approach
to creates this design. The UI for this initial phase was to show how the product counting and
also visualized the individual performance regarding their production. From that, it will
visualize an emoji that will motivate the operator to work hard on the progress. The image of
the first design concept will be shown later in the section” Visualization Dashboard for
proposed DVMS”. The processed was then go through actively in UCD where in the cycle
which users have to evaluate the design system as the given requirements. Survey then done to
this fourth step of UCD and results was bringing forward to the prototyping phase.
3.3.2 Prototyping phase
Next is the prototype part. This prototyping phase is to continue the first UCD cycle results
from the initial phase. It started with analysing the evaluation data of the first UCD cycle, where
it includes the judgement from stakeholders. The first thing that researcher did at the beginning
of this phase was researching the most suitable counting system for DVMS. The second attempt
of the UCD cycle has carried out by doing the first two step of the UCD. The environment in
Autokeen was studied by look through the production processes at the studied area. The studied
area, which is Line D or WSS Line, was using the proximity sensors to count the product. This
counter system is to control the nut feeding system, as mentioned in Chapter 1. Then, it seems
the knowledge of the operator has matured in using the proximity sensor. After that, from the
given requirements from the first UCD cycle, the researcher has produced a new idea of
counting method by using a proximity sensor that connected towards Raspberry Pi. This
method will be elaborated further in the DVMS architecture section, where the details on how
the process will explain in details.
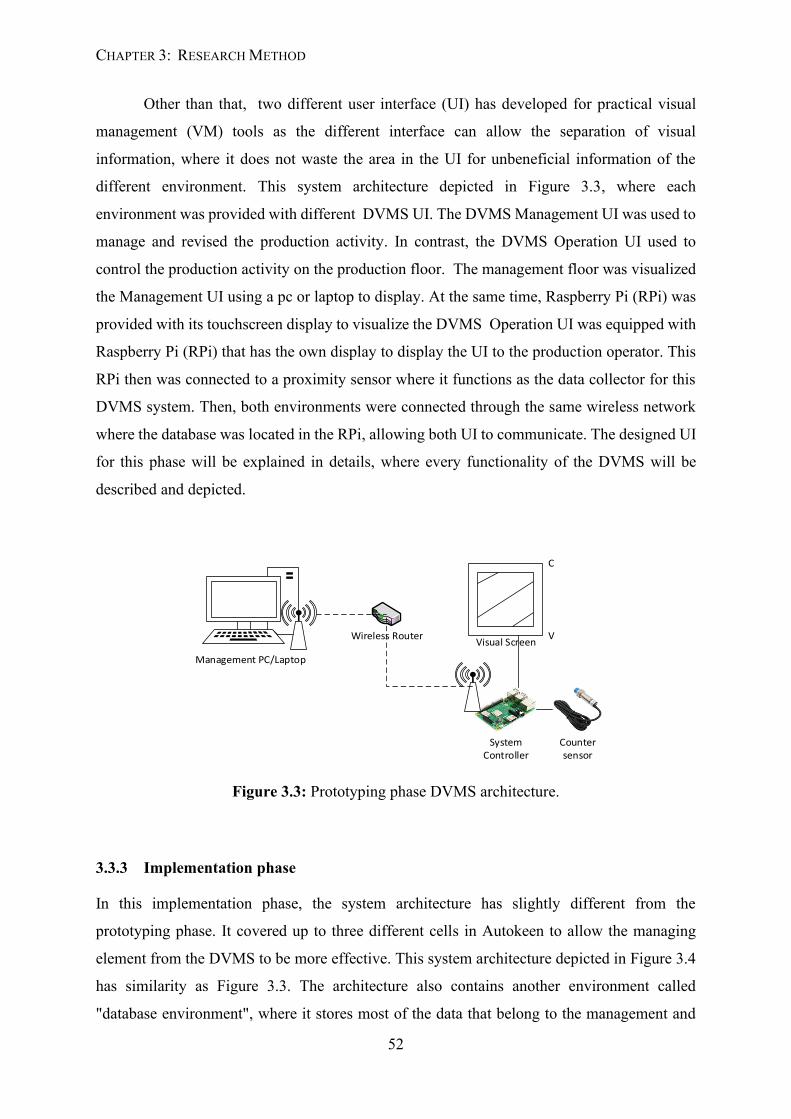
CHAPTER 3: RESEARCH METHOD
52
Other than that, two different user interface (UI) has developed for practical visual
management (VM) tools as the different interface can allow the separation of visual
information, where it does not waste the area in the UI for unbeneficial information of the
different environment. This system architecture depicted in Figure 3.3, where each
environment was provided with different DVMS UI. The DVMS Management UI was used to
manage and revised the production activity. In contrast, the DVMS Operation UI used to
control the production activity on the production floor. The management floor was visualized
the Management UI using a pc or laptop to display. At the same time, Raspberry Pi (RPi) was
provided with its touchscreen display to visualize the DVMS Operation UI was equipped with
Raspberry Pi (RPi) that has the own display to display the UI to the production operator. This
RPi then was connected to a proximity sensor where it functions as the data collector for this
DVMS system. Then, both environments were connected through the same wireless network
where the database was located in the RPi, allowing both UI to communicate. The designed UI
for this phase will be explained in details, where every functionality of the DVMS will be
described and depicted.
C
VVisual Screen
Counter sensor
System Controller
Management PC/Laptop
Wireless Router
Figure 3.3: Prototyping phase DVMS architecture.
3.3.3 Implementation phase
In this implementation phase, the system architecture has slightly different from the
prototyping phase. It covered up to three different cells in Autokeen to allow the managing
element from the DVMS to be more effective. This system architecture depicted in Figure 3.4
has similarity as Figure 3.3. The architecture also contains another environment called
"database environment", where it stores most of the data that belong to the management and
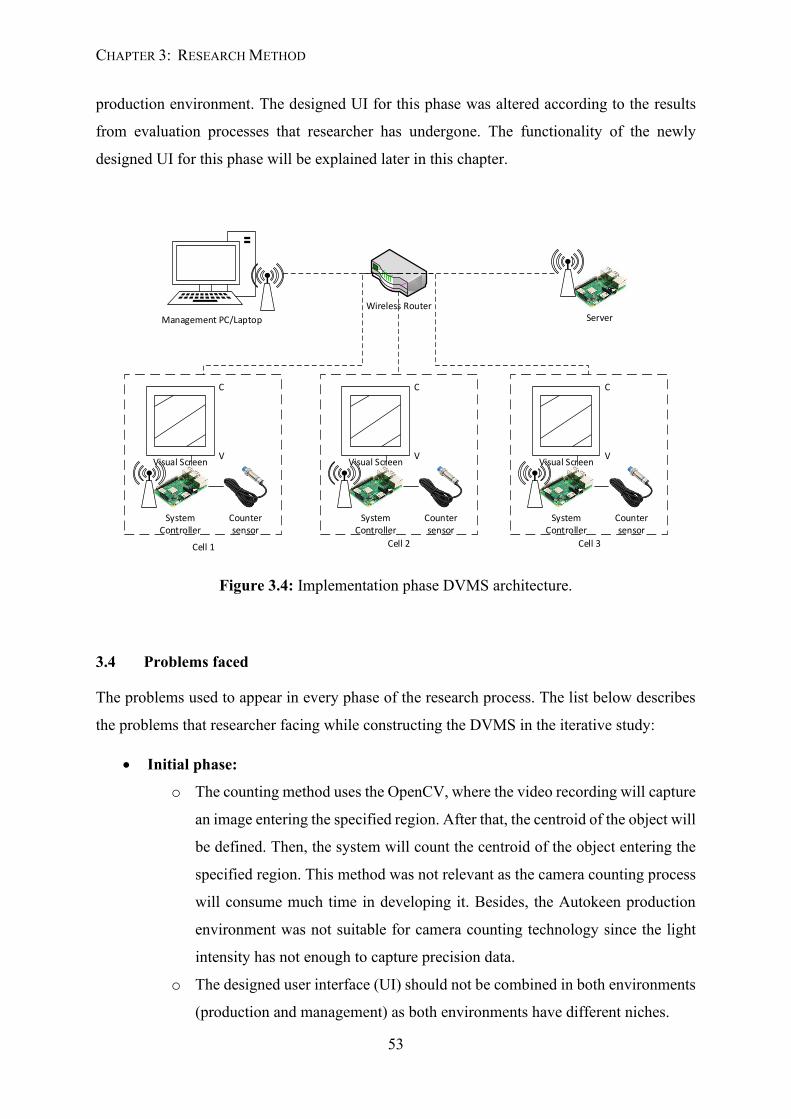
CHAPTER 3: RESEARCH METHOD
53
production environment. The designed UI for this phase was altered according to the results
from evaluation processes that researcher has undergone. The functionality of the newly
designed UI for this phase will be explained later in this chapter.
Management PC/Laptop
Wireless RouterServer
Counter sensor
System Controller
C
VVisual Screen
Counter sensor
System Controller
C
VVisual Screen
Counter sensor
System Controller
C
VVisual Screen
Cell 2 Cell 3Cell 1
Figure 3.4: Implementation phase DVMS architecture.
3.4 Problems faced
The problems used to appear in every phase of the research process. The list below describes
the problems that researcher facing while constructing the DVMS in the iterative study:
• Initial phase:
o The counting method uses the OpenCV, where the video recording will capture
an image entering the specified region. After that, the centroid of the object will
be defined. Then, the system will count the centroid of the object entering the
specified region. This method was not relevant as the camera counting process
will consume much time in developing it. Besides, the Autokeen production
environment was not suitable for camera counting technology since the light
intensity has not enough to capture precision data.
o The designed user interface (UI) should not be combined in both environments
(production and management) as both environments have different niches.
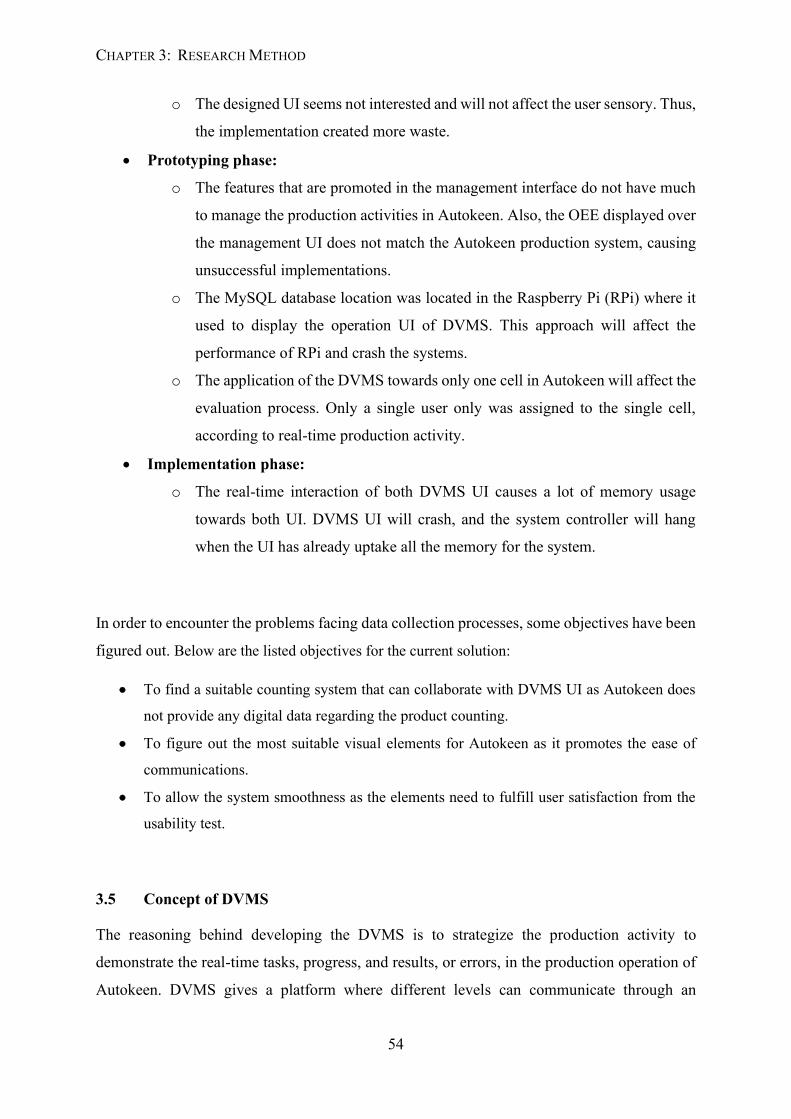
CHAPTER 3: RESEARCH METHOD
54
o The designed UI seems not interested and will not affect the user sensory. Thus,
the implementation created more waste.
• Prototyping phase:
o The features that are promoted in the management interface do not have much
to manage the production activities in Autokeen. Also, the OEE displayed over
the management UI does not match the Autokeen production system, causing
unsuccessful implementations.
o The MySQL database location was located in the Raspberry Pi (RPi) where it
used to display the operation UI of DVMS. This approach will affect the
performance of RPi and crash the systems.
o The application of the DVMS towards only one cell in Autokeen will affect the
evaluation process. Only a single user only was assigned to the single cell,
according to real-time production activity.
• Implementation phase:
o The real-time interaction of both DVMS UI causes a lot of memory usage
towards both UI. DVMS UI will crash, and the system controller will hang
when the UI has already uptake all the memory for the system.
In order to encounter the problems facing data collection processes, some objectives have been
figured out. Below are the listed objectives for the current solution:
• To find a suitable counting system that can collaborate with DVMS UI as Autokeen does
not provide any digital data regarding the product counting.
• To figure out the most suitable visual elements for Autokeen as it promotes the ease of
communications.
• To allow the system smoothness as the elements need to fulfill user satisfaction from the
usability test.
3.5 Concept of DVMS
The reasoning behind developing the DVMS is to strategize the production activity to
demonstrate the real-time tasks, progress, and results, or errors, in the production operation of
Autokeen. DVMS gives a platform where different levels can communicate through an
CHAPTER 3: RESEARCH METHOD
55
interface about the production activities. This feature is meant to help the management team
structure the daily production plan, monitor the production activity, manage operation progress,
reduce cycle time for production, and communicate with the production floor. Simultaneously,
it also helps the operators understand the tasks and monitor their performance to improve or
maintain production performance. DVMS contains two different interfaces. These interfaces
contain different visual images containing information to be delivered to a different level.
3.6 DVMS overview
Production level
Databases
Management level
Operation interface of DVMS
Management interface of DVMS
Figure 3.5: Digital Visual Management System (DVMS) overview.
Figure 3.5 shows the Digital Visual Management System (DVMS) overview that
connects the management level with production level through a different interface where the
data is transmitted through a SQL database. It also illustrated that the user in the management
level has access towards the management interface of DVMS and also direct access towards
SQL database. Meanwhile, the user in the production level is allowed to access the operation
interface of DVMS. The interface for each level has its own functionality based on their
workload. These interfaces were interconnecting through a SQL database to transmit data from
each level. Later the data will be accessible by the user in each level that has been simplified
based on the user needs. As for the management level, the interface will allow the user to
manage the production activity in the area where the DVMS covered. Meanwhile, the DVMS
interface for operation team controlled the user in the production level to maintain the good
production performance in the production floor. This approach helps the information to travel
along the concrete wall, thus allowing the ease of communication in the organization.
CHAPTER 3: RESEARCH METHOD
56
3.7 DVMS requirements
The requirements for the DVMS are the configuration that must have by DVMS before it being
tested. The requirements have been divided into functional and non-functional requirements.
The functional requirements are functions that DVMS will send directly respond to the user.
In contrast, the non-functional requirements are the performance characteristic that has in the
DVMS which the user does not interact with directly, such as usability, efficiency, reliability,
etc.
The functional requirements of DVMS will divide into two, operation interface and
management interface. For the management interface, the functional requirements are:
• DVMS shall store the operator’s identification and parts identifications.
• DVMS shall store the production history and machine monitoring data from the
previous production.
• DVMS shall visualize the real-time production activity data on the assigned production
line. Include the status of the cell, productivity, number of defects, and remaining time
on specific production tasks.
• DVMS shall calculate and visualize the overall efficiency and number of defects item
in the real-time production situation.
• DVMS shall the show the reports coming from operation interface is there is breakdown
happen in any cell.
• DVMS shall automatically transfer all the desire action into the database; thus, the
information delivers to another interface for operation.
Meanwhile, the functional requirements for the operator interface are:
• DVMS shall show the name of the user that has assigned to the specific cell.
• DVMS shall show the list of tasks that need to completed by the user.
• DVMS shall interactively update the task completion rates according to the number of
finished tasks.
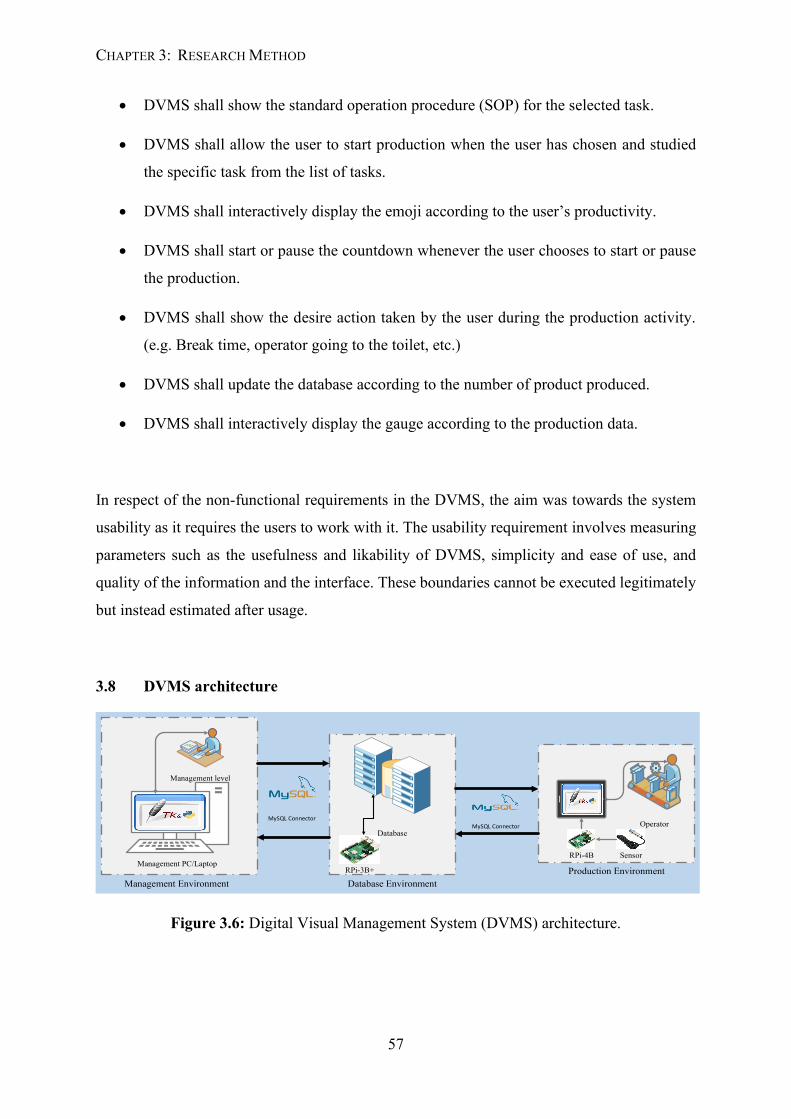
CHAPTER 3: RESEARCH METHOD
57
• DVMS shall show the standard operation procedure (SOP) for the selected task.
• DVMS shall allow the user to start production when the user has chosen and studied
the specific task from the list of tasks.
• DVMS shall interactively display the emoji according to the user’s productivity.
• DVMS shall start or pause the countdown whenever the user chooses to start or pause
the production.
• DVMS shall show the desire action taken by the user during the production activity.
(e.g. Break time, operator going to the toilet, etc.)
• DVMS shall update the database according to the number of product produced.
• DVMS shall interactively display the gauge according to the production data.
In respect of the non-functional requirements in the DVMS, the aim was towards the system
usability as it requires the users to work with it. The usability requirement involves measuring
parameters such as the usefulness and likability of DVMS, simplicity and ease of use, and
quality of the information and the interface. These boundaries cannot be executed legitimately
but instead estimated after usage.
3.8 DVMS architecture
MySQL Connector
Management level
Management PC/LaptopSensorRPi-4B
Operator
RPi-3B+
DatabaseMySQL Connector
Management Environment Database EnvironmentProduction Environment
Figure 3.6: Digital Visual Management System (DVMS) architecture.
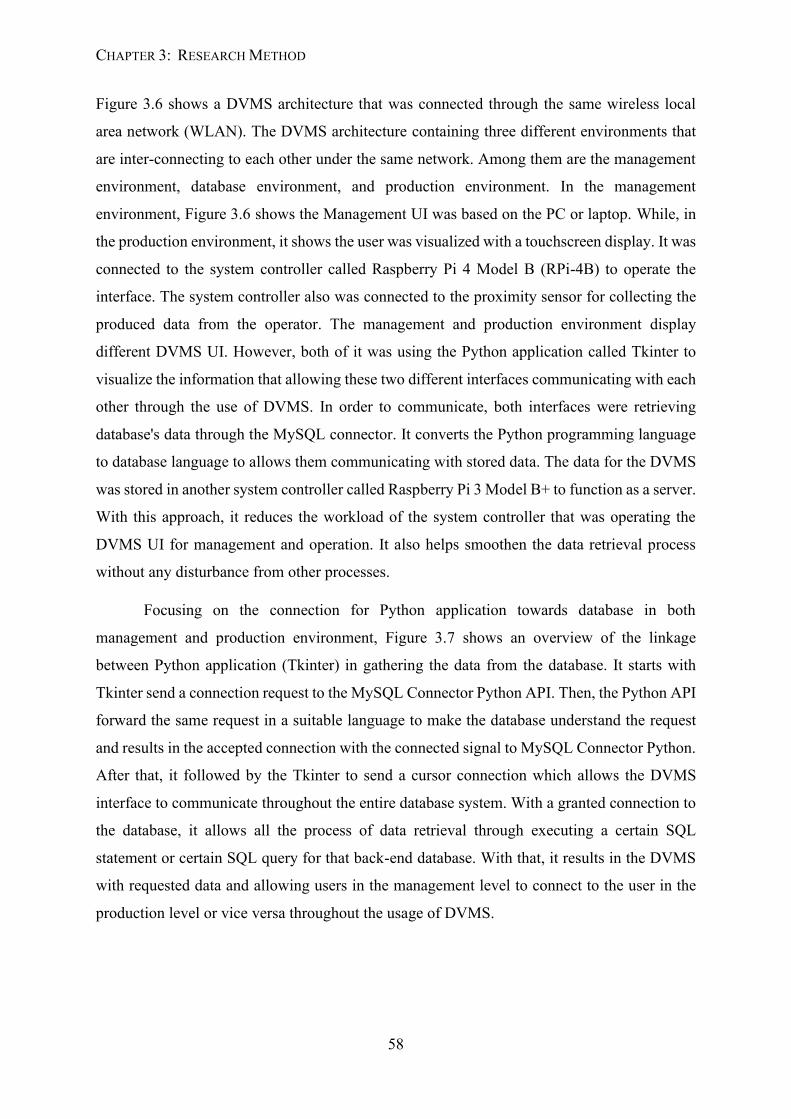
CHAPTER 3: RESEARCH METHOD
58
Figure 3.6 shows a DVMS architecture that was connected through the same wireless local
area network (WLAN). The DVMS architecture containing three different environments that
are inter-connecting to each other under the same network. Among them are the management
environment, database environment, and production environment. In the management
environment, Figure 3.6 shows the Management UI was based on the PC or laptop. While, in
the production environment, it shows the user was visualized with a touchscreen display. It was
connected to the system controller called Raspberry Pi 4 Model B (RPi-4B) to operate the
interface. The system controller also was connected to the proximity sensor for collecting the
produced data from the operator. The management and production environment display
different DVMS UI. However, both of it was using the Python application called Tkinter to
visualize the information that allowing these two different interfaces communicating with each
other through the use of DVMS. In order to communicate, both interfaces were retrieving
database's data through the MySQL connector. It converts the Python programming language
to database language to allows them communicating with stored data. The data for the DVMS
was stored in another system controller called Raspberry Pi 3 Model B+ to function as a server.
With this approach, it reduces the workload of the system controller that was operating the
DVMS UI for management and operation. It also helps smoothen the data retrieval process
without any disturbance from other processes.
Focusing on the connection for Python application towards database in both
management and production environment, Figure 3.7 shows an overview of the linkage
between Python application (Tkinter) in gathering the data from the database. It starts with
Tkinter send a connection request to the MySQL Connector Python API. Then, the Python API
forward the same request in a suitable language to make the database understand the request
and results in the accepted connection with the connected signal to MySQL Connector Python.
After that, it followed by the Tkinter to send a cursor connection which allows the DVMS
interface to communicate throughout the entire database system. With a granted connection to
the database, it allows all the process of data retrieval through executing a certain SQL
statement or certain SQL query for that back-end database. With that, it results in the DVMS
with requested data and allowing users in the management level to connect to the user in the
production level or vice versa throughout the usage of DVMS.
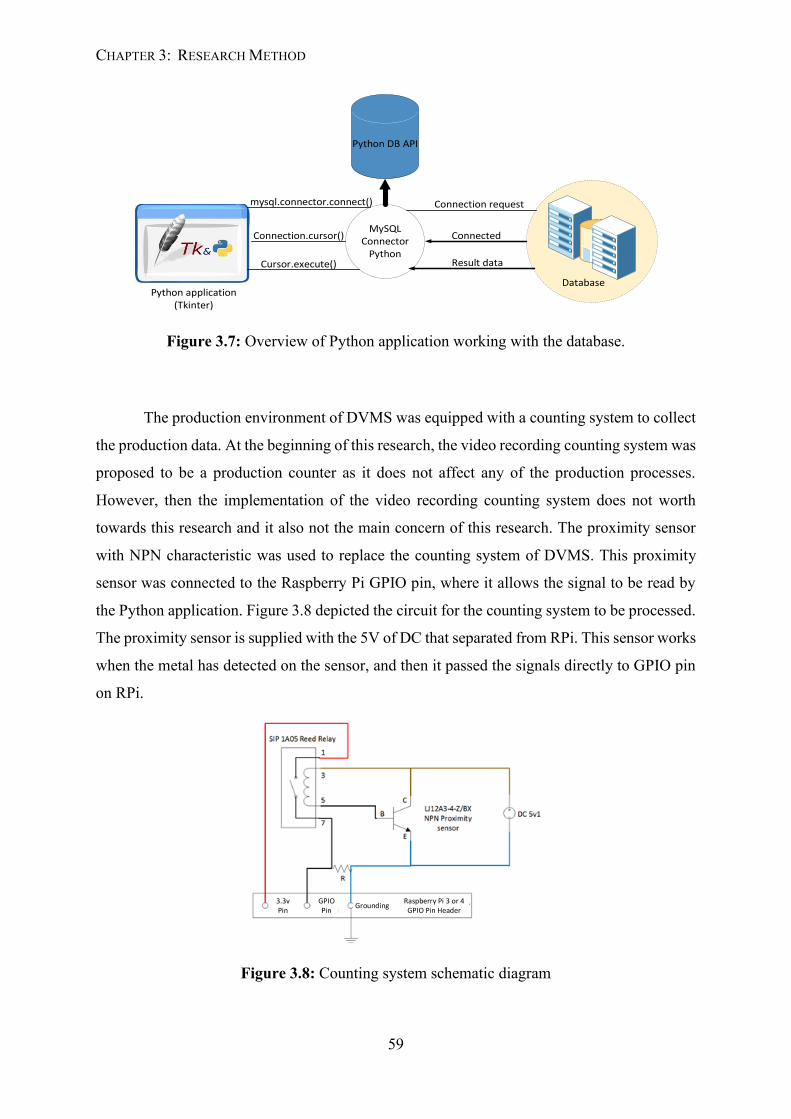
CHAPTER 3: RESEARCH METHOD
59
Python application (Tkinter)
MySQL Connector
Python
Python DB API
Database
mysql.connector.connect()
Connection.cursor()
Cursor.execute()
Connection request
Connected
Result data
Figure 3.7: Overview of Python application working with the database.
The production environment of DVMS was equipped with a counting system to collect
the production data. At the beginning of this research, the video recording counting system was
proposed to be a production counter as it does not affect any of the production processes.
However, then the implementation of the video recording counting system does not worth
towards this research and it also not the main concern of this research. The proximity sensor
with NPN characteristic was used to replace the counting system of DVMS. This proximity
sensor was connected to the Raspberry Pi GPIO pin, where it allows the signal to be read by
the Python application. Figure 3.8 depicted the circuit for the counting system to be processed.
The proximity sensor is supplied with the 5V of DC that separated from RPi. This sensor works
when the metal has detected on the sensor, and then it passed the signals directly to GPIO pin
on RPi.
Figure 3.8: Counting system schematic diagram
Raspberry Pi 3 or 4 GPIO Pin Header
Grounding3.3v Pin
GPIO Pin
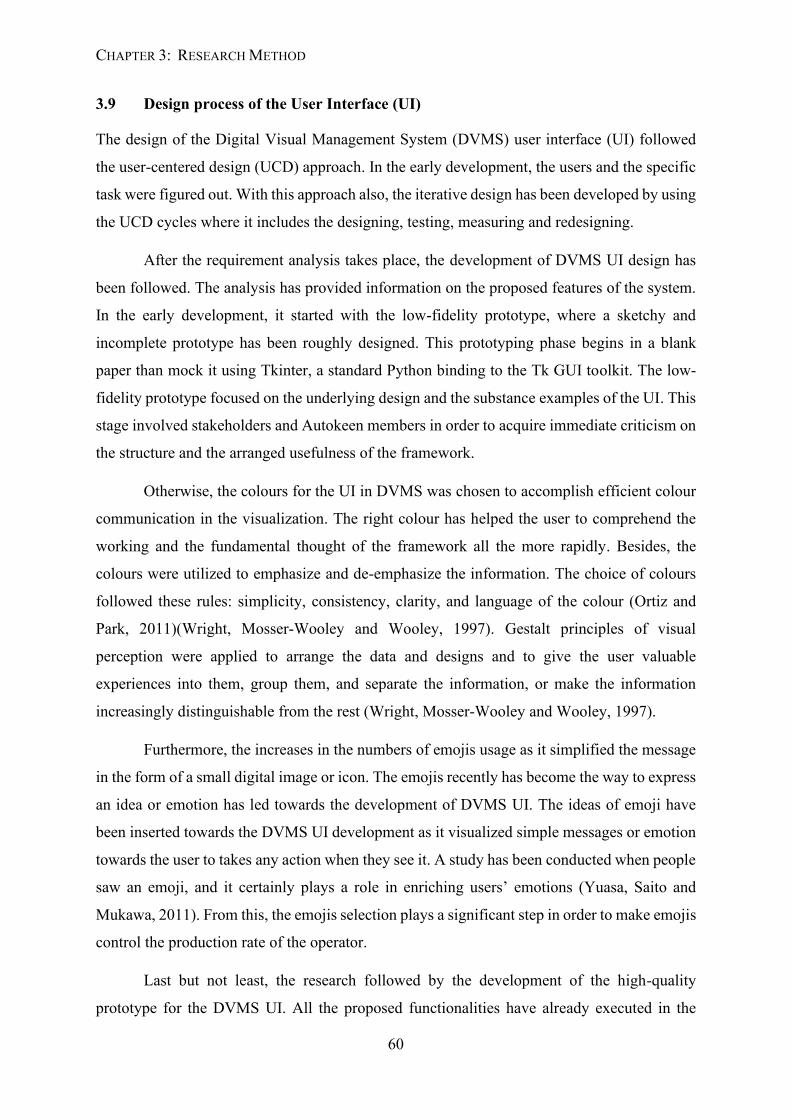
CHAPTER 3: RESEARCH METHOD
60
3.9 Design process of the User Interface (UI)
The design of the Digital Visual Management System (DVMS) user interface (UI) followed
the user-centered design (UCD) approach. In the early development, the users and the specific
task were figured out. With this approach also, the iterative design has been developed by using
the UCD cycles where it includes the designing, testing, measuring and redesigning.
After the requirement analysis takes place, the development of DVMS UI design has
been followed. The analysis has provided information on the proposed features of the system.
In the early development, it started with the low-fidelity prototype, where a sketchy and
incomplete prototype has been roughly designed. This prototyping phase begins in a blank
paper than mock it using Tkinter, a standard Python binding to the Tk GUI toolkit. The low-
fidelity prototype focused on the underlying design and the substance examples of the UI. This
stage involved stakeholders and Autokeen members in order to acquire immediate criticism on
the structure and the arranged usefulness of the framework.
Otherwise, the colours for the UI in DVMS was chosen to accomplish efficient colour
communication in the visualization. The right colour has helped the user to comprehend the
working and the fundamental thought of the framework all the more rapidly. Besides, the
colours were utilized to emphasize and de-emphasize the information. The choice of colours
followed these rules: simplicity, consistency, clarity, and language of the colour (Ortiz and
Park, 2011)(Wright, Mosser-Wooley and Wooley, 1997). Gestalt principles of visual
perception were applied to arrange the data and designs and to give the user valuable
experiences into them, group them, and separate the information, or make the information
increasingly distinguishable from the rest (Wright, Mosser-Wooley and Wooley, 1997).
Furthermore, the increases in the numbers of emojis usage as it simplified the message
in the form of a small digital image or icon. The emojis recently has become the way to express
an idea or emotion has led towards the development of DVMS UI. The ideas of emoji have
been inserted towards the DVMS UI development as it visualized simple messages or emotion
towards the user to takes any action when they see it. A study has been conducted when people
saw an emoji, and it certainly plays a role in enriching users’ emotions (Yuasa, Saito and
Mukawa, 2011). From this, the emojis selection plays a significant step in order to make emojis
control the production rate of the operator.
Last but not least, the research followed by the development of the high-quality
prototype for the DVMS UI. All the proposed functionalities have already executed in the
CHAPTER 3: RESEARCH METHOD
61
DVMS UI to works interactively. Stakeholders were asked to analyse the prototype if there
was a room for modifications to take place. After the modifications have done towards the
identified area in initial testing, the high-quality prototype was formed. Then the DVMS
prototype tested with the real-time production situation to observe awareness of users towards
DVMS and their production performance. The users then observed, and the reaction towards
the UI was recorded and evaluated. These steps were done to improve all the area in DVMS to
make sure the visual elements have satisfied by user. Otherwise, the usability test also was
done towards the users to improve the UI continuously. The testing brought about the
distinguishing proof of new prerequisites that required the upgrade of parts of the framework
and the consideration of extra functionalities.
3.10 Summary
In this chapter, the researcher described the methods that have taken, which observations and
interviews for this research study to overcome the problem facing Autokeen visual
management (VM) system. The process of the development of the new VM system was done
iteratively, where it contains three different stages, namely; initial, prototyping, and
implementing. In the initial phase, the first UCD cycle has been taken place along with the
initial draft of the DVMS UI, where it contains only one UI. Then it further with the prototyping
phase, the counting method has been decided for the DVMS and the DVMS containing two
different UI separating the niche in a different environment. This phase was closed by the first
evaluation study, where the first usability data has recorded. The final iteration process is
implementation. The UCD process still occurs, and this phase also ends with the usability test's
evaluation process. Besides, the problem faced when constructing the study was figured out.
The objective of solving the problem also was described in this chapter. All the system
architecture has been explained in each phase. It also shows the improvement has taken place
in the development process of DVMS.
All the used methods in conducting this iterative study processes have clarified early in
this chapter. It then proceeds by explaining the concept of the DVMS, which questions why
this system needs to be developed. Furthermore, it stated the DVMS containing two different
interfaces that interconnecting to allow the communication processes in the Autokeen. All the
purposes of DVMS also have been briefly explained in the concept of the DVMS section. This
CHAPTER 3: RESEARCH METHOD
62
chapter then continues by showing the reader on the DVMS overview. It shows how the DVMS
working principle that will undergo to achieve its concept.
Moreover, the researcher has included each interface's functional requirements, namely
the operation interface and management interface. This requirement has become the benchmark
of the DVMS development processes. The architecture of DVMS also described over this
chapter that was elaborating more on the visual processing information over the DVMS UI.
This section mentioned visual DVMS UI for running over the Raspberry Pi 4 and connected to
the proximity sensor for counting purposes. The management DVMS UI was running over the
pc or laptop. This two different interface has described connecting over the WLAN towards
the same database. Raspberry Pi 3 has been used to control the database system and works as
a server for this system. Finally, this chapter ends with the design process of both DVMS UI.
The methodology of developing the DVMS was briefly explained in this chapter.
63
CHAPTER 4
Development of DVMS
During the development of the Digital Visual Management System (DVMS) in optimizing the
production activity with the integration visualization tools with the Internet of Things (IoT)
features, a user-centered design (UCD) process was used in creating the design concept of the
DVMS. In order to do so, the necessary process must be included. Therefore, this chapter will
explain the details of collecting data, problems encountered, and ways to solve the problems.
Meanwhile, sort of DVMS dashboards was formed and the development processes were
explained.
4.1 Data collection
The development of DVMS was started with the process of data collection where researcher
attends a site visit towards Autokeen Sdn. Bhd. to construct the study plan for the visualization
study. The site visit was done towards Autokeen to collect as much data regarding the
production activities in Autokeen by process of interview and observation. The interview
process was done towards Autokeen managers and employers. From those processes, the
researcher has known the Autokeen production system on the studied line (Line D or WSS
Line). The production system that Autokeen using namely one-piece flow. The production
areas affected in conducting this research are in the second stage of the production process.
The stage was doing assembly processes of specific nut or bolt towards the different stamped
panel. These processes were done manually by the operator with the help of a nut or bolt control
feeder, as explained in chapter 1. All the related information, such as implemented VM tools
and product information, was collected from Autokeen. The implemented VM tools in
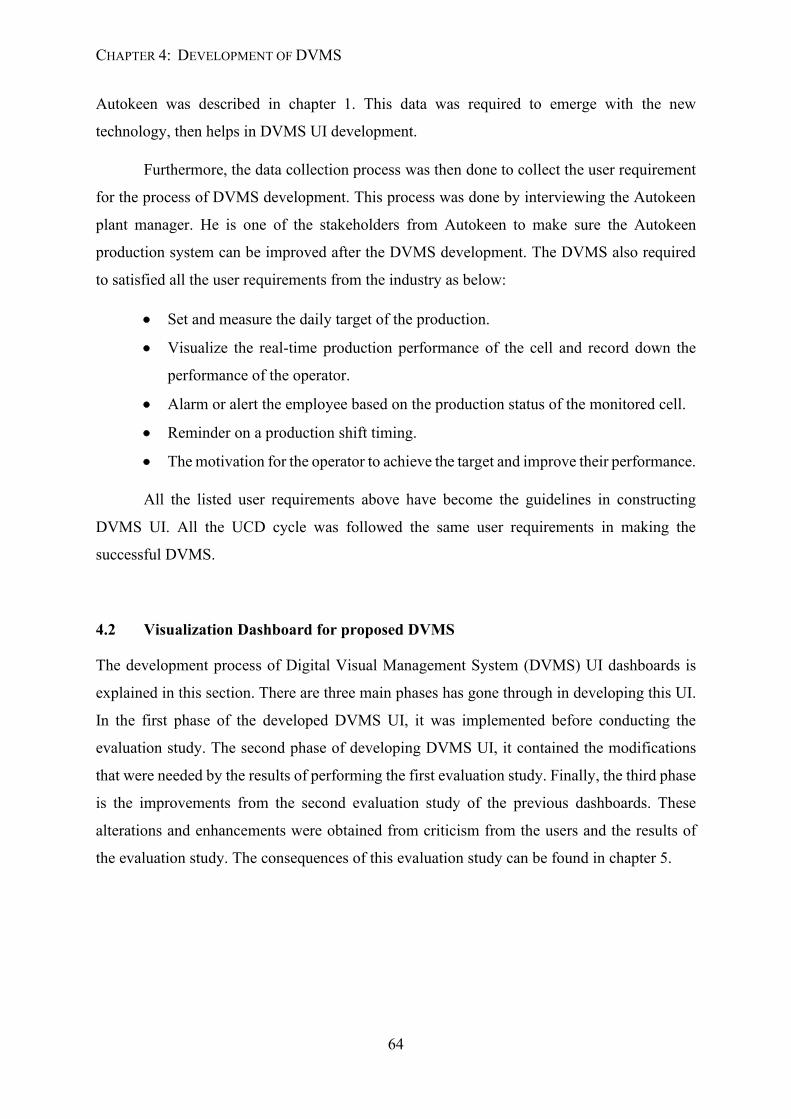
CHAPTER 4: DEVELOPMENT OF DVMS
64
Autokeen was described in chapter 1. This data was required to emerge with the new
technology, then helps in DVMS UI development.
Furthermore, the data collection process was then done to collect the user requirement
for the process of DVMS development. This process was done by interviewing the Autokeen
plant manager. He is one of the stakeholders from Autokeen to make sure the Autokeen
production system can be improved after the DVMS development. The DVMS also required
to satisfied all the user requirements from the industry as below:
• Set and measure the daily target of the production.
• Visualize the real-time production performance of the cell and record down the
performance of the operator.
• Alarm or alert the employee based on the production status of the monitored cell.
• Reminder on a production shift timing.
• The motivation for the operator to achieve the target and improve their performance.
All the listed user requirements above have become the guidelines in constructing
DVMS UI. All the UCD cycle was followed the same user requirements in making the
successful DVMS.
4.2 Visualization Dashboard for proposed DVMS
The development process of Digital Visual Management System (DVMS) UI dashboards is
explained in this section. There are three main phases has gone through in developing this UI.
In the first phase of the developed DVMS UI, it was implemented before conducting the
evaluation study. The second phase of developing DVMS UI, it contained the modifications
that were needed by the results of performing the first evaluation study. Finally, the third phase
is the improvements from the second evaluation study of the previous dashboards. These
alterations and enhancements were obtained from criticism from the users and the results of
the evaluation study. The consequences of this evaluation study can be found in chapter 5.
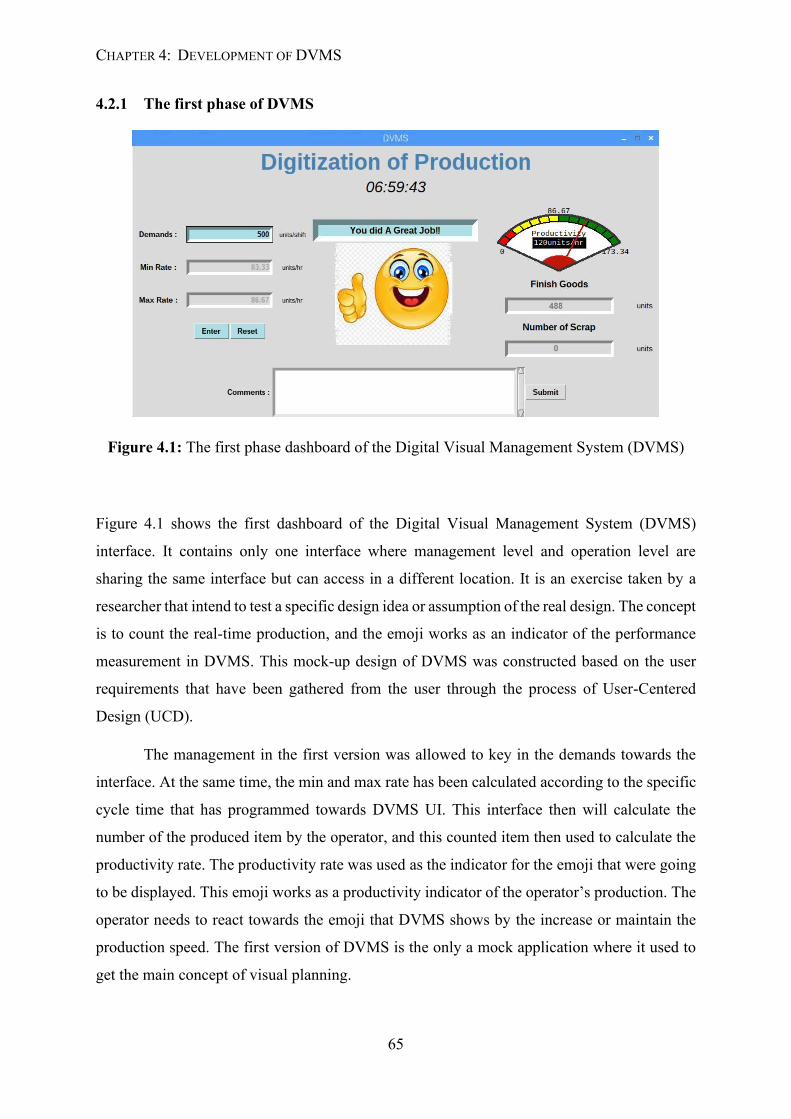
CHAPTER 4: DEVELOPMENT OF DVMS
65
4.2.1 The first phase of DVMS
Figure 4.1: The first phase dashboard of the Digital Visual Management System (DVMS)
Figure 4.1 shows the first dashboard of the Digital Visual Management System (DVMS)
interface. It contains only one interface where management level and operation level are
sharing the same interface but can access in a different location. It is an exercise taken by a
researcher that intend to test a specific design idea or assumption of the real design. The concept
is to count the real-time production, and the emoji works as an indicator of the performance
measurement in DVMS. This mock-up design of DVMS was constructed based on the user
requirements that have been gathered from the user through the process of User-Centered
Design (UCD).
The management in the first version was allowed to key in the demands towards the
interface. At the same time, the min and max rate has been calculated according to the specific
cycle time that has programmed towards DVMS UI. This interface then will calculate the
number of the produced item by the operator, and this counted item then used to calculate the
productivity rate. The productivity rate was used as the indicator for the emoji that were going
to be displayed. This emoji works as a productivity indicator of the operator’s production. The
operator needs to react towards the emoji that DVMS shows by the increase or maintain the
production speed. The first version of DVMS is the only a mock application where it used to
get the main concept of visual planning.
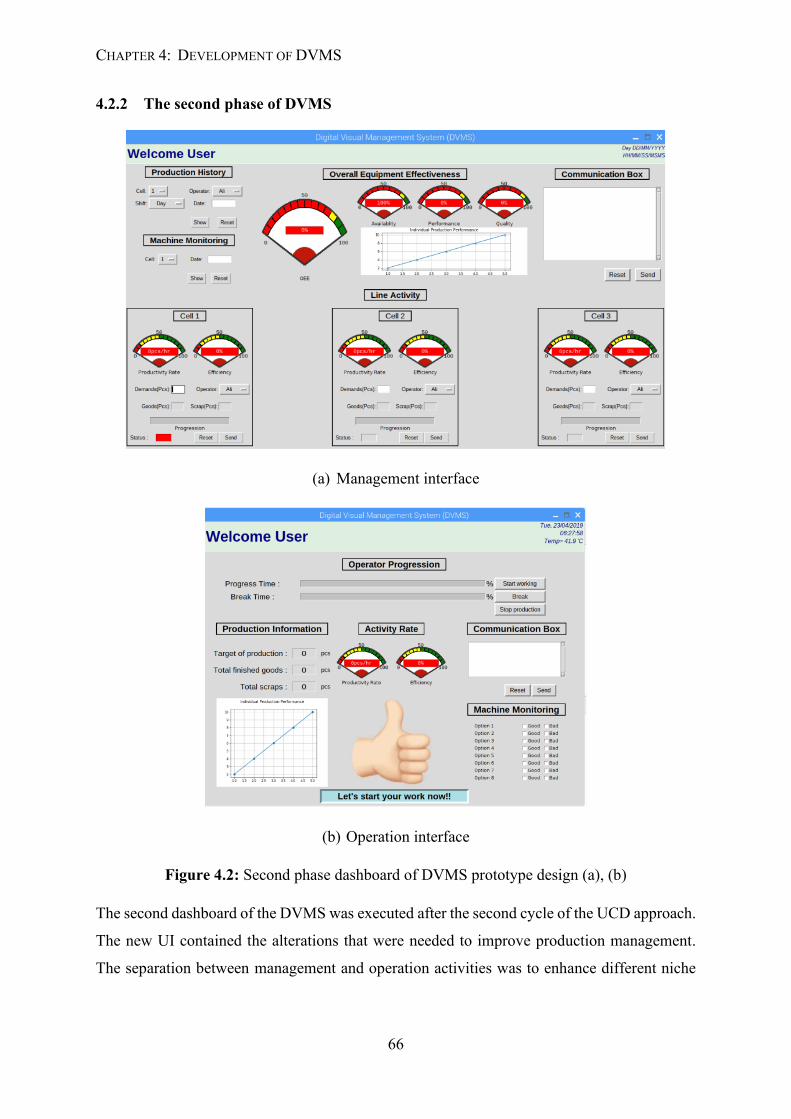
CHAPTER 4: DEVELOPMENT OF DVMS
66
4.2.2 The second phase of DVMS
(a) Management interface
(b) Operation interface
Figure 4.2: Second phase dashboard of DVMS prototype design (a), (b)
The second dashboard of the DVMS was executed after the second cycle of the UCD approach.
The new UI contained the alterations that were needed to improve production management.
The separation between management and operation activities was to enhance different niche
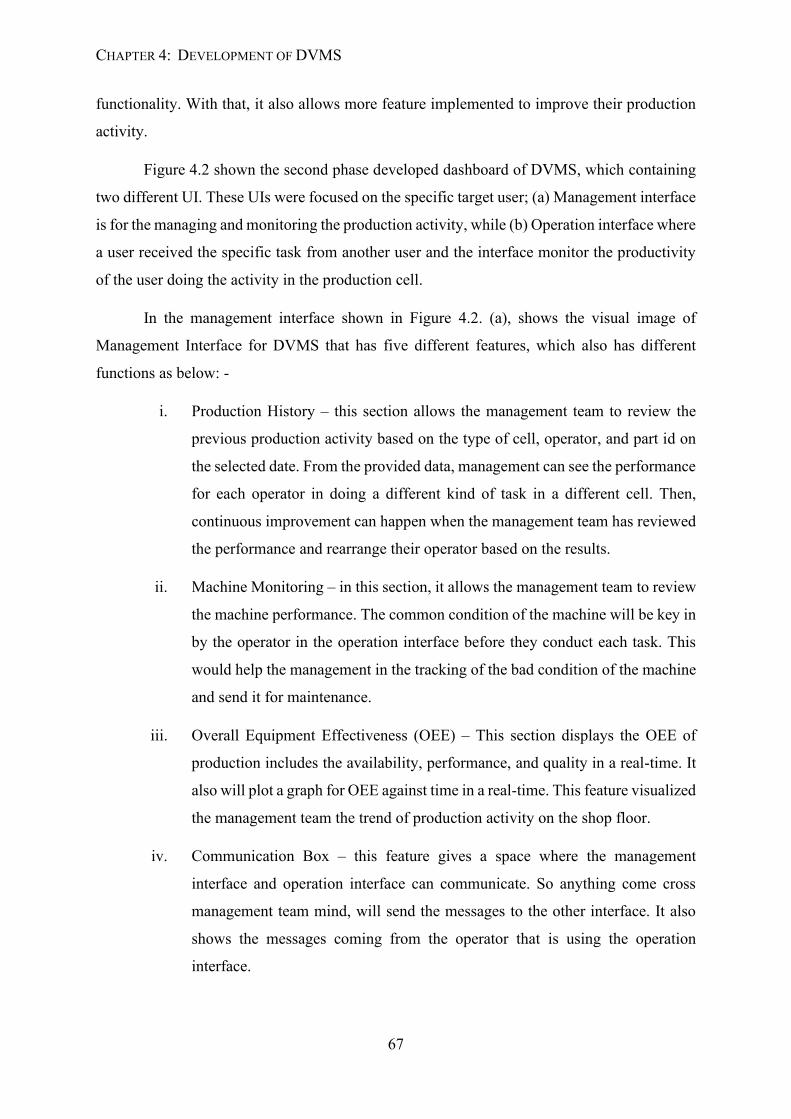
CHAPTER 4: DEVELOPMENT OF DVMS
67
functionality. With that, it also allows more feature implemented to improve their production
activity.
Figure 4.2 shown the second phase developed dashboard of DVMS, which containing
two different UI. These UIs were focused on the specific target user; (a) Management interface
is for the managing and monitoring the production activity, while (b) Operation interface where
a user received the specific task from another user and the interface monitor the productivity
of the user doing the activity in the production cell.
In the management interface shown in Figure 4.2. (a), shows the visual image of
Management Interface for DVMS that has five different features, which also has different
functions as below: -
i. Production History – this section allows the management team to review the
previous production activity based on the type of cell, operator, and part id on
the selected date. From the provided data, management can see the performance
for each operator in doing a different kind of task in a different cell. Then,
continuous improvement can happen when the management team has reviewed
the performance and rearrange their operator based on the results.
ii. Machine Monitoring – in this section, it allows the management team to review
the machine performance. The common condition of the machine will be key in
by the operator in the operation interface before they conduct each task. This
would help the management in the tracking of the bad condition of the machine
and send it for maintenance.
iii. Overall Equipment Effectiveness (OEE) – This section displays the OEE of
production includes the availability, performance, and quality in a real-time. It
also will plot a graph for OEE against time in a real-time. This feature visualized
the management team the trend of production activity on the shop floor.
iv. Communication Box – this feature gives a space where the management
interface and operation interface can communicate. So anything come cross
management team mind, will send the messages to the other interface. It also
shows the messages coming from the operator that is using the operation
interface.
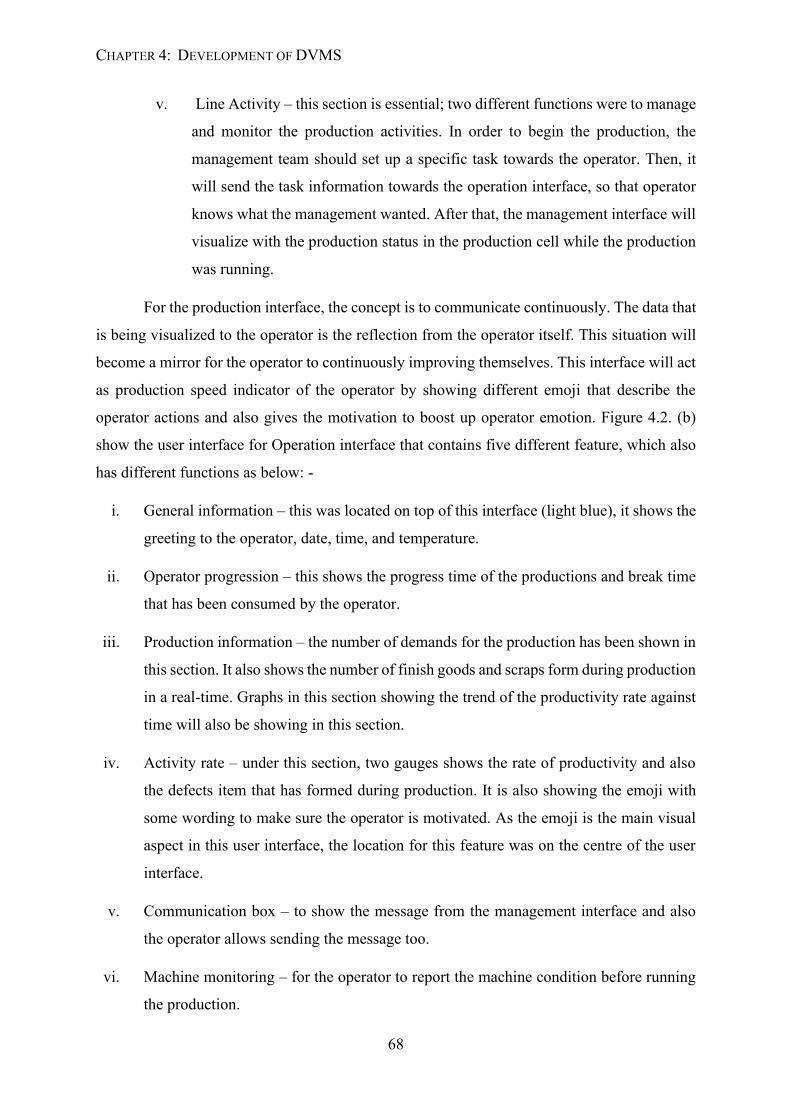
CHAPTER 4: DEVELOPMENT OF DVMS
68
v. Line Activity – this section is essential; two different functions were to manage
and monitor the production activities. In order to begin the production, the
management team should set up a specific task towards the operator. Then, it
will send the task information towards the operation interface, so that operator
knows what the management wanted. After that, the management interface will
visualize with the production status in the production cell while the production
was running.
For the production interface, the concept is to communicate continuously. The data that
is being visualized to the operator is the reflection from the operator itself. This situation will
become a mirror for the operator to continuously improving themselves. This interface will act
as production speed indicator of the operator by showing different emoji that describe the
operator actions and also gives the motivation to boost up operator emotion. Figure 4.2. (b)
show the user interface for Operation interface that contains five different feature, which also
has different functions as below: -
i. General information – this was located on top of this interface (light blue), it shows the
greeting to the operator, date, time, and temperature.
ii. Operator progression – this shows the progress time of the productions and break time
that has been consumed by the operator.
iii. Production information – the number of demands for the production has been shown in
this section. It also shows the number of finish goods and scraps form during production
in a real-time. Graphs in this section showing the trend of the productivity rate against
time will also be showing in this section.
iv. Activity rate – under this section, two gauges shows the rate of productivity and also
the defects item that has formed during production. It is also showing the emoji with
some wording to make sure the operator is motivated. As the emoji is the main visual
aspect in this user interface, the location for this feature was on the centre of the user
interface.
v. Communication box – to show the message from the management interface and also
the operator allows sending the message too.
vi. Machine monitoring – for the operator to report the machine condition before running
the production.
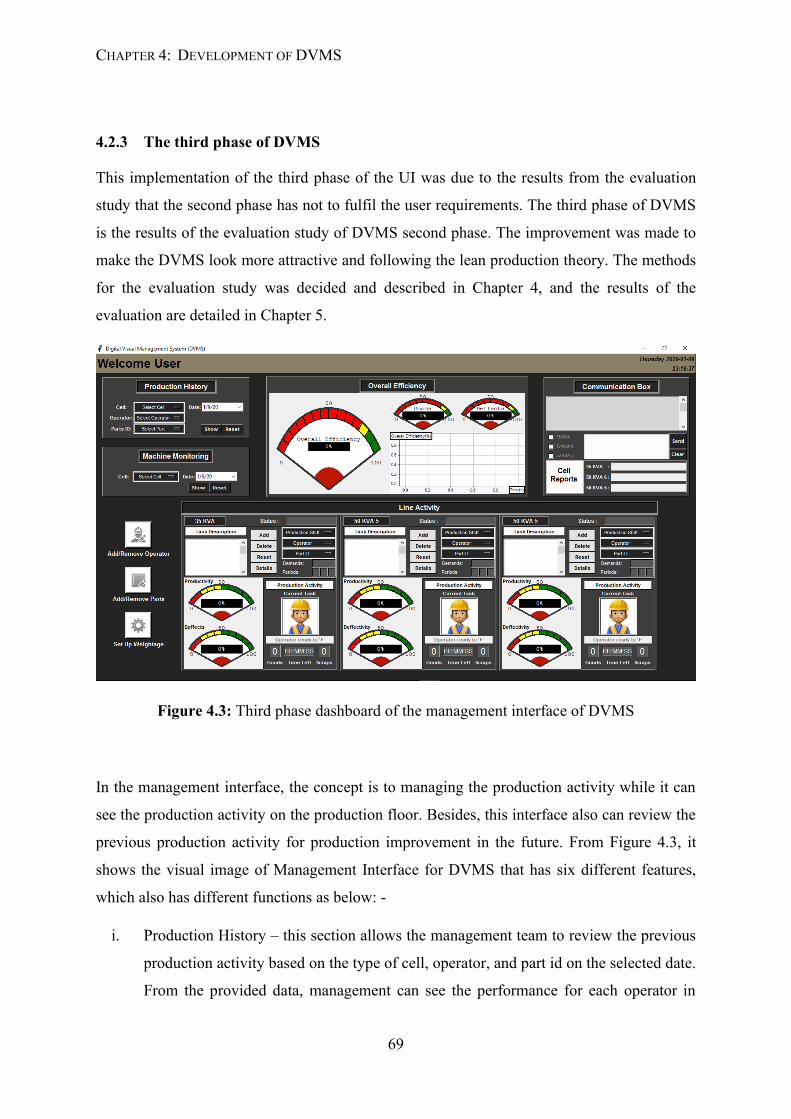
CHAPTER 4: DEVELOPMENT OF DVMS
69
4.2.3 The third phase of DVMS
This implementation of the third phase of the UI was due to the results from the evaluation
study that the second phase has not to fulfil the user requirements. The third phase of DVMS
is the results of the evaluation study of DVMS second phase. The improvement was made to
make the DVMS look more attractive and following the lean production theory. The methods
for the evaluation study was decided and described in Chapter 4, and the results of the
evaluation are detailed in Chapter 5.
Figure 4.3: Third phase dashboard of the management interface of DVMS
In the management interface, the concept is to managing the production activity while it can
see the production activity on the production floor. Besides, this interface also can review the
previous production activity for production improvement in the future. From Figure 4.3, it
shows the visual image of Management Interface for DVMS that has six different features,
which also has different functions as below: -
i. Production History – this section allows the management team to review the previous
production activity based on the type of cell, operator, and part id on the selected date.
From the provided data, management can see the performance for each operator in
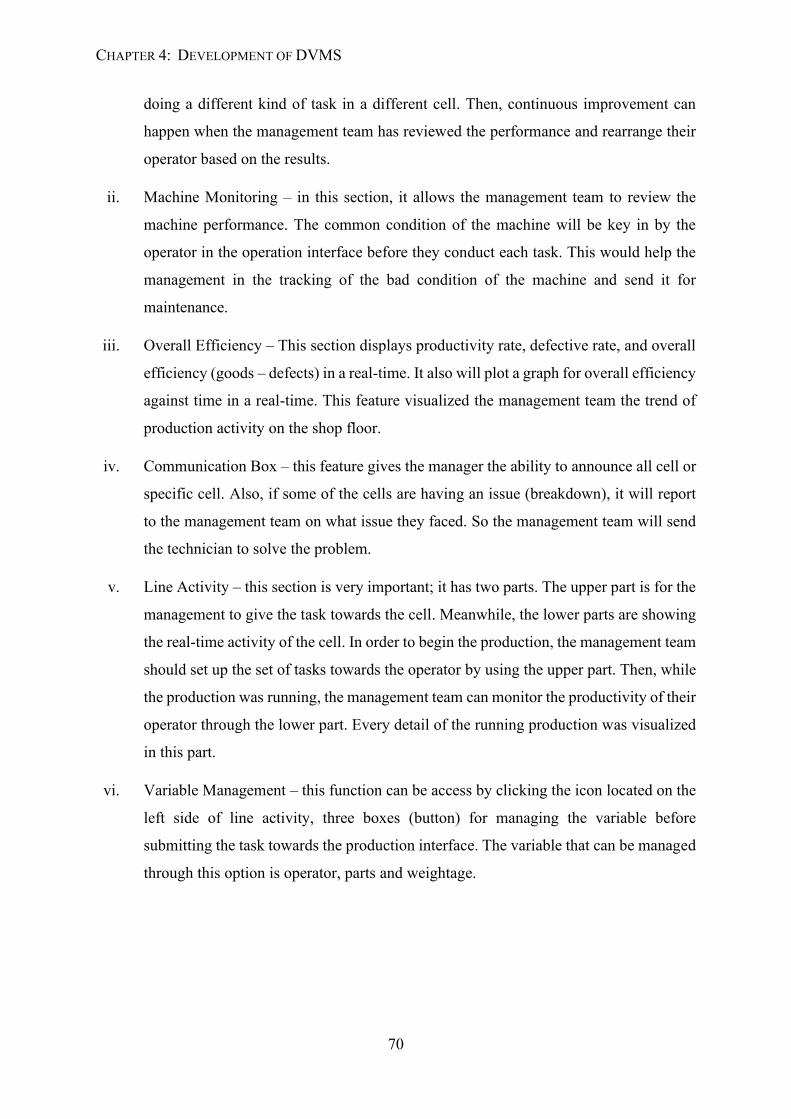
CHAPTER 4: DEVELOPMENT OF DVMS
70
doing a different kind of task in a different cell. Then, continuous improvement can
happen when the management team has reviewed the performance and rearrange their
operator based on the results.
ii. Machine Monitoring – in this section, it allows the management team to review the
machine performance. The common condition of the machine will be key in by the
operator in the operation interface before they conduct each task. This would help the
management in the tracking of the bad condition of the machine and send it for
maintenance.
iii. Overall Efficiency – This section displays productivity rate, defective rate, and overall
efficiency (goods – defects) in a real-time. It also will plot a graph for overall efficiency
against time in a real-time. This feature visualized the management team the trend of
production activity on the shop floor.
iv. Communication Box – this feature gives the manager the ability to announce all cell or
specific cell. Also, if some of the cells are having an issue (breakdown), it will report
to the management team on what issue they faced. So the management team will send
the technician to solve the problem.
v. Line Activity – this section is very important; it has two parts. The upper part is for the
management to give the task towards the cell. Meanwhile, the lower parts are showing
the real-time activity of the cell. In order to begin the production, the management team
should set up the set of tasks towards the operator by using the upper part. Then, while
the production was running, the management team can monitor the productivity of their
operator through the lower part. Every detail of the running production was visualized
in this part.
vi. Variable Management – this function can be access by clicking the icon located on the
left side of line activity, three boxes (button) for managing the variable before
submitting the task towards the production interface. The variable that can be managed
through this option is operator, parts and weightage.
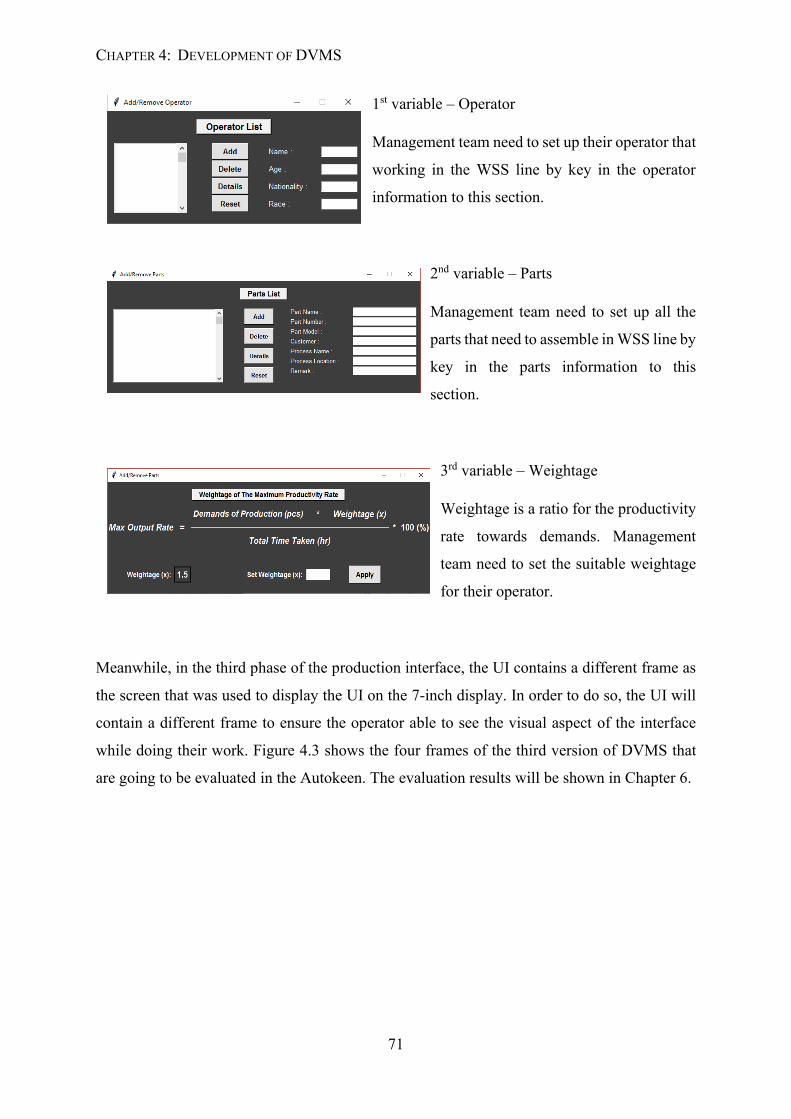
CHAPTER 4: DEVELOPMENT OF DVMS
71
1st variable – Operator
Management team need to set up their operator that
working in the WSS line by key in the operator
information to this section.
2nd variable – Parts
Management team need to set up all the
parts that need to assemble in WSS line by
key in the parts information to this
section.
3rd variable – Weightage
Weightage is a ratio for the productivity
rate towards demands. Management
team need to set the suitable weightage
for their operator.
Meanwhile, in the third phase of the production interface, the UI contains a different frame as
the screen that was used to display the UI on the 7-inch display. In order to do so, the UI will
contain a different frame to ensure the operator able to see the visual aspect of the interface
while doing their work. Figure 4.3 shows the four frames of the third version of DVMS that
are going to be evaluated in the Autokeen. The evaluation results will be shown in Chapter 6.
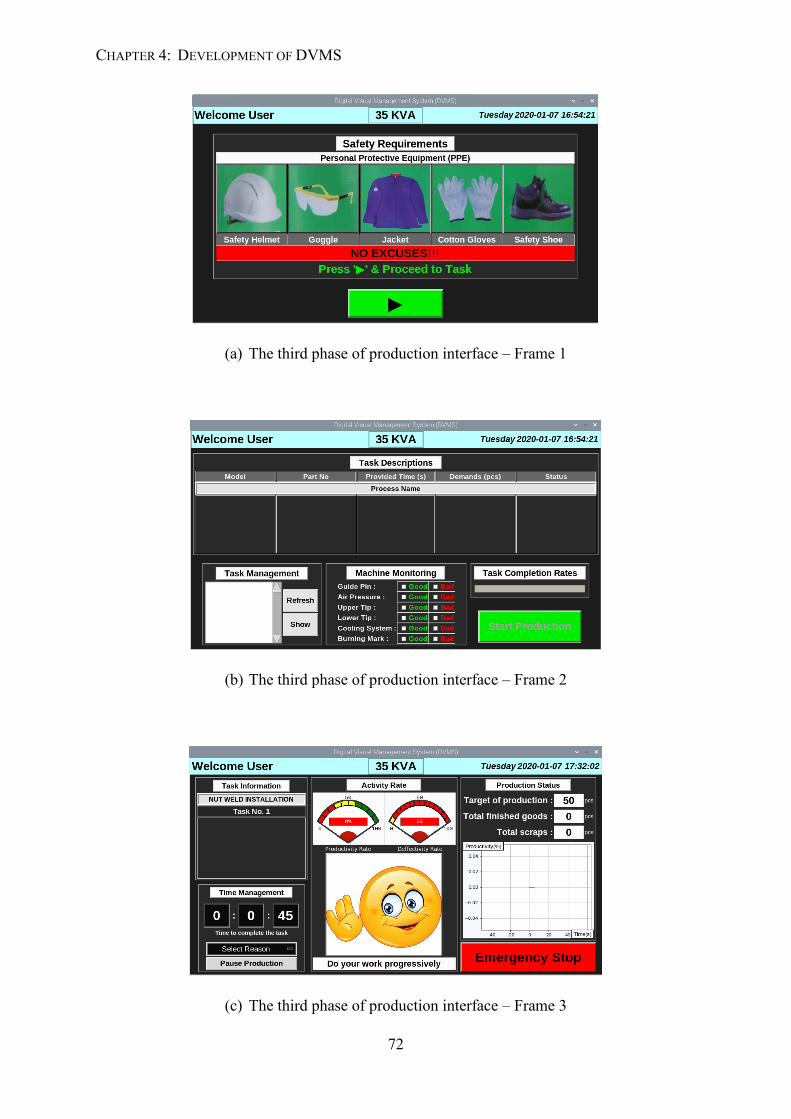
CHAPTER 4: DEVELOPMENT OF DVMS
72
(a) The third phase of production interface – Frame 1
(b) The third phase of production interface – Frame 2
(c) The third phase of production interface – Frame 3
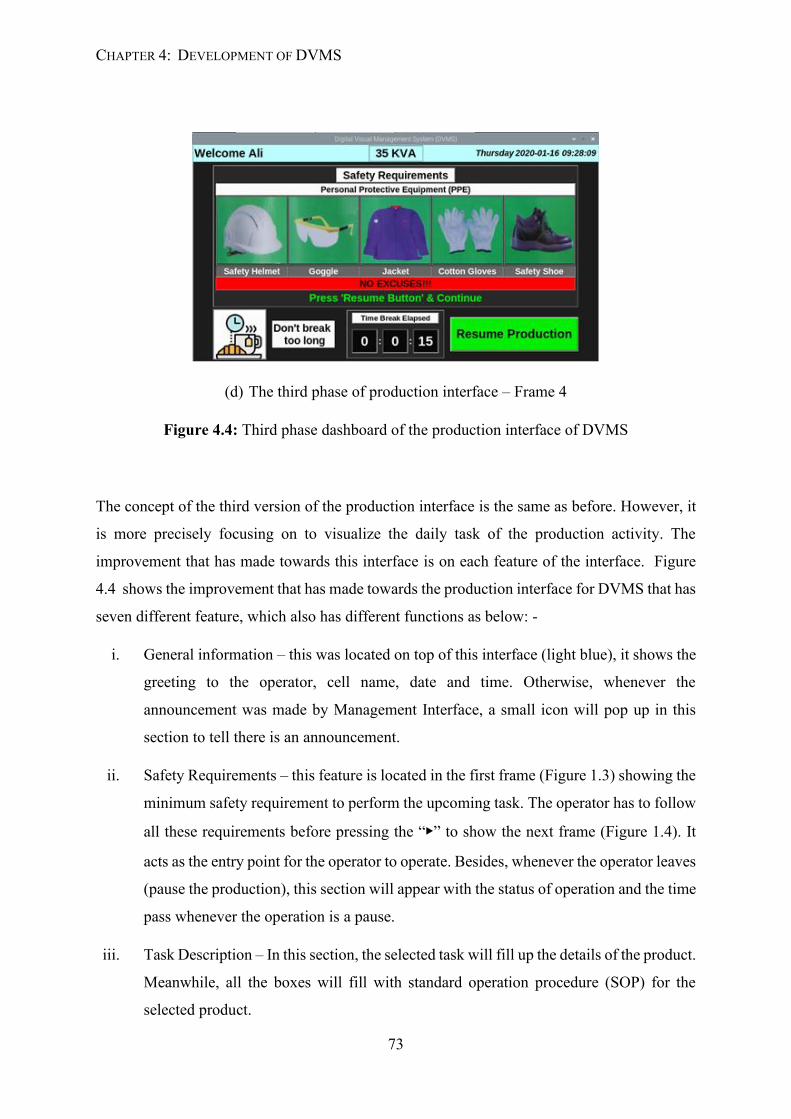
CHAPTER 4: DEVELOPMENT OF DVMS
73
(d) The third phase of production interface – Frame 4
Figure 4.4: Third phase dashboard of the production interface of DVMS
The concept of the third version of the production interface is the same as before. However, it
is more precisely focusing on to visualize the daily task of the production activity. The
improvement that has made towards this interface is on each feature of the interface. Figure
4.4 shows the improvement that has made towards the production interface for DVMS that has
seven different feature, which also has different functions as below: -
i. General information – this was located on top of this interface (light blue), it shows the
greeting to the operator, cell name, date and time. Otherwise, whenever the
announcement was made by Management Interface, a small icon will pop up in this
section to tell there is an announcement.
ii. Safety Requirements – this feature is located in the first frame (Figure 1.3) showing the
minimum safety requirement to perform the upcoming task. The operator has to follow
all these requirements before pressing the “▶” to show the next frame (Figure 1.4). It
acts as the entry point for the operator to operate. Besides, whenever the operator leaves
(pause the production), this section will appear with the status of operation and the time
pass whenever the operation is a pause.
iii. Task Description – In this section, the selected task will fill up the details of the product.
Meanwhile, all the boxes will fill with standard operation procedure (SOP) for the
selected product.
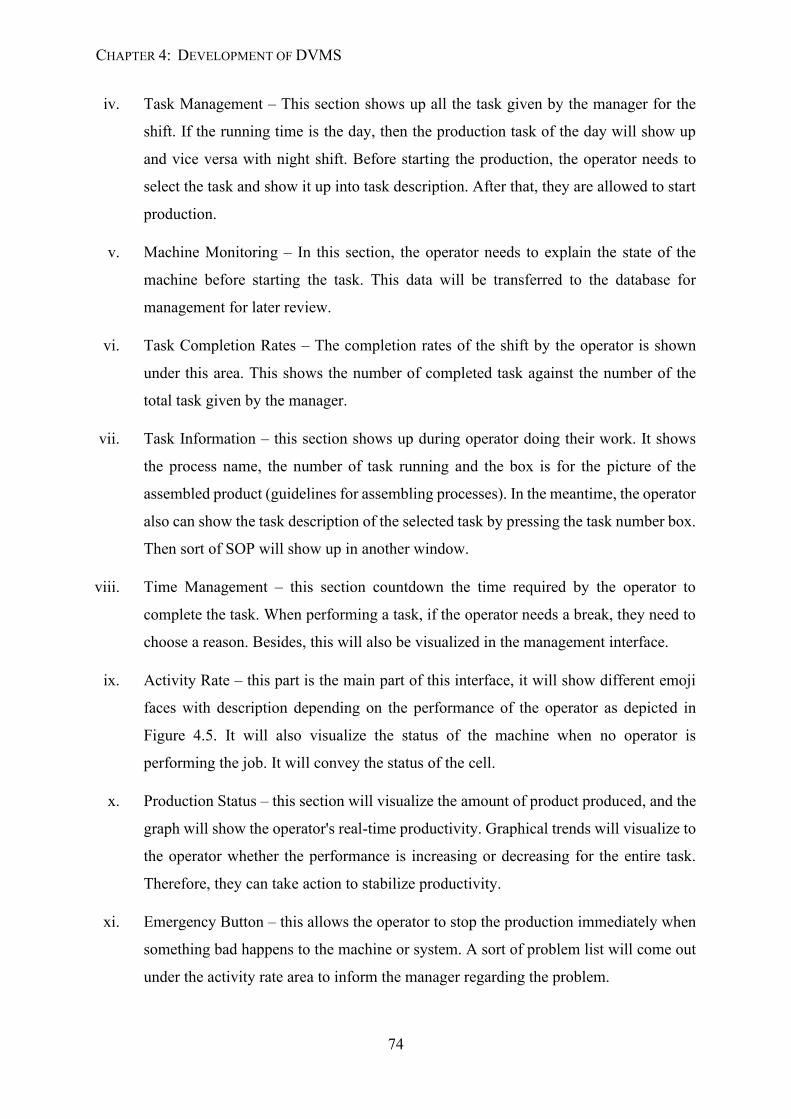
CHAPTER 4: DEVELOPMENT OF DVMS
74
iv. Task Management – This section shows up all the task given by the manager for the
shift. If the running time is the day, then the production task of the day will show up
and vice versa with night shift. Before starting the production, the operator needs to
select the task and show it up into task description. After that, they are allowed to start
production.
v. Machine Monitoring – In this section, the operator needs to explain the state of the
machine before starting the task. This data will be transferred to the database for
management for later review.
vi. Task Completion Rates – The completion rates of the shift by the operator is shown
under this area. This shows the number of completed task against the number of the
total task given by the manager.
vii. Task Information – this section shows up during operator doing their work. It shows
the process name, the number of task running and the box is for the picture of the
assembled product (guidelines for assembling processes). In the meantime, the operator
also can show the task description of the selected task by pressing the task number box.
Then sort of SOP will show up in another window.
viii. Time Management – this section countdown the time required by the operator to
complete the task. When performing a task, if the operator needs a break, they need to
choose a reason. Besides, this will also be visualized in the management interface.
ix. Activity Rate – this part is the main part of this interface, it will show different emoji
faces with description depending on the performance of the operator as depicted in
Figure 4.5. It will also visualize the status of the machine when no operator is
performing the job. It will convey the status of the cell.
x. Production Status – this section will visualize the amount of product produced, and the
graph will show the operator's real-time productivity. Graphical trends will visualize to
the operator whether the performance is increasing or decreasing for the entire task.
Therefore, they can take action to stabilize productivity.
xi. Emergency Button – this allows the operator to stop the production immediately when
something bad happens to the machine or system. A sort of problem list will come out
under the activity rate area to inform the manager regarding the problem.
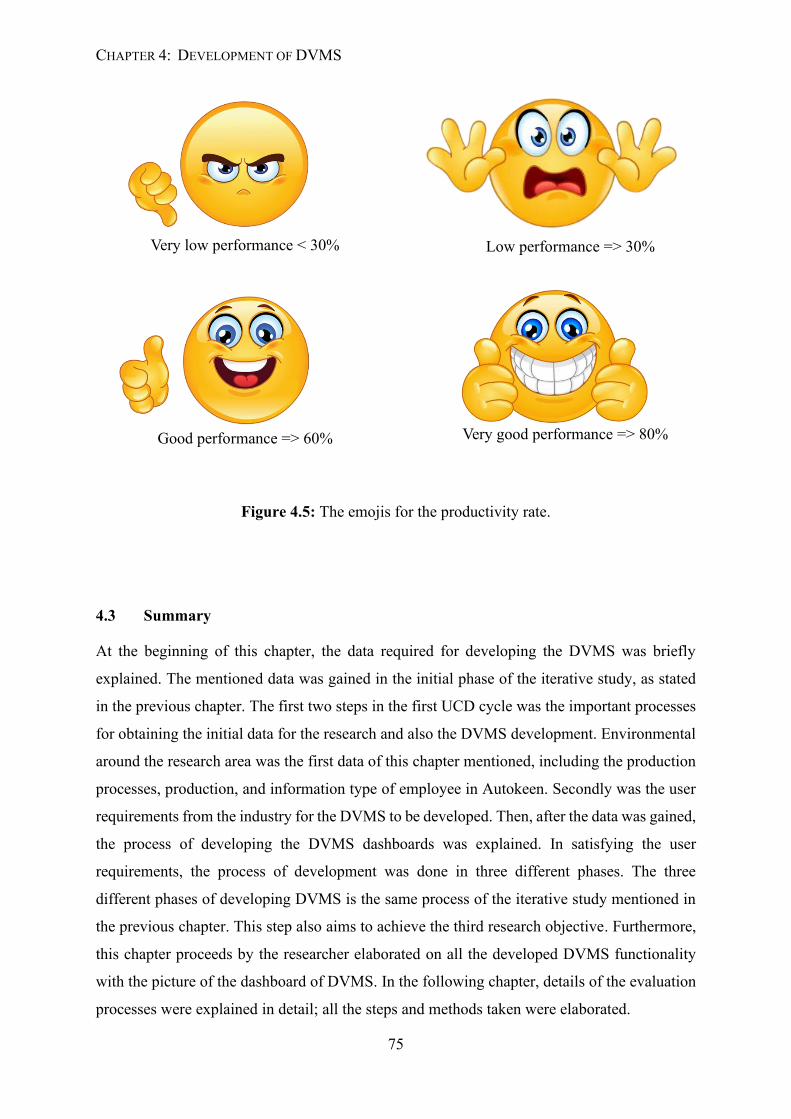
CHAPTER 4: DEVELOPMENT OF DVMS
75
Figure 4.5: The emojis for the productivity rate.
4.3 Summary
At the beginning of this chapter, the data required for developing the DVMS was briefly
explained. The mentioned data was gained in the initial phase of the iterative study, as stated
in the previous chapter. The first two steps in the first UCD cycle was the important processes
for obtaining the initial data for the research and also the DVMS development. Environmental
around the research area was the first data of this chapter mentioned, including the production
processes, production, and information type of employee in Autokeen. Secondly was the user
requirements from the industry for the DVMS to be developed. Then, after the data was gained,
the process of developing the DVMS dashboards was explained. In satisfying the user
requirements, the process of development was done in three different phases. The three
different phases of developing DVMS is the same process of the iterative study mentioned in
the previous chapter. This step also aims to achieve the third research objective. Furthermore,
this chapter proceeds by the researcher elaborated on all the developed DVMS functionality
with the picture of the dashboard of DVMS. In the following chapter, details of the evaluation
processes were explained in detail; all the steps and methods taken were elaborated.
Very good performance => 80% Good performance => 60%
Low performance => 30% Very low performance < 30%
76
CHAPTER 5
Evaluation Study of DVMS
This chapter explains the structured evaluation study that has constructed for the Digital Visual
Management System (DVMS) to achieve the usability results. This usability test was to
evaluate the interaction of users towards DVMS. This evaluation study was introduced in
chapter 1 and explained in chapter 3, where it only tested towards the second and third
visualization dashboard where the VM tools have been revised. In the following sections, this
chapter was starting by stating the framework of having this evaluation study towards DVMS.
Structure of this chapter followed by the explanation on the goals of evaluating the DVMS.
Besides, the method, techniques and scenarios of the evaluation processes were narrated after.
The environment and equipment setup of the evaluation study were depicted and explained in
details for each evaluation event. Also, the evaluation event tasks and scenarios were then
structured and describe to make the data collecting processes smooth. With all the tools before
handling the evaluation process explained, the step of handling the process then explain in the
final section of chapter.
5.1 Evaluation study framework
The evaluation procedure initiates by determining clear goals, appropriate questions and real-
time tasks to meet the research objectives. For that purpose, following steps resembles the main
activities of this method, in order to perform user testing and to obtain a reliable outcome for
the evaluation study:
i. Decide and structure the clear evaluation goals which are connected to the research
objectives;
CHAPTER 5: EVALUATION STUDY OF DVMS
77
ii. Choosing the right evaluation methods and techniques;
iii. Standby for the practical issues;
iv. Plan the evaluation processes;
v. Evaluate, analyse, and present the data.
5.2 Evaluation study goals
The goals of the evaluation study are shaped to accomplish the research objectives. In this section,
the main goals of performing the evaluation study will be highlighted. After developing and
implementing the DVMS for managing the Autokeen production activity, the user evaluation was
carried out to evaluate the DVMS so as to accomplish the main goals as follows:
i. Obtain proposals or choices to refine the UI plan of this part;
ii. Identify any usability issues so they can be tended to as a piece of the iterative structure
process, in particular: System Usefulness, Information Quality, Interface Quality, and
User Satisfaction
iii. Check the user's performance and recognize the errands and capacities which present
difficulties to the user;
iv. Examine diverse option coordinated UI plans to locate the most reasonable UI for
managing Autokeen production activity before beginning of the DVMS integration;
v. Compare the general user fulfilment towards the framework by utilizing self-upheld
measurements strategies, and survey the exhibition of the techniques.
5.3 Methods, techniques and participants
In the user evaluation study, the different usability methods and techniques has been chosen to
obtain the necessary data and to accomplish the evaluation goals. Likewise, various sorts of
participants were included, specifically broad user and expert. Coming up next are the
descriptions of the testing methods and techniques of how they were utilized, with data on the
reasonable kind of participants for every one of them.
i. Heuristic evaluation testing method – this method was applied towards the
individuals that experienced towards the lean management and experts towards
Autokeen production floor. The point was to recognize ease of use issues in the DVMS
UI and to acquire suggestions for remedial activity. The Walk-through procedure and
CHAPTER 5: EVALUATION STUDY OF DVMS
78
review were utilized as strategies for this technique. In this strategy, the expert 'test-
drove' the DVMS, and through remarks and open-ended information was never really
address any usability issues which probably won't be obvious to an ordinary user later
in Autokeen creation floor. This technique was applied towards the two assessments
with an alternate number of experts.
ii. User-based testing method – this method was applied in evaluating the uses on DVMS
user interface to test the interaction of Autokeen employees (management level &
production level) towards the DVMS user interface. The aim was to measure the
effectiveness of information flow from the management interface to the operation
interface. Before doing the test, the qualification and recruitment of participants need
to be done—first, an interview towards employee to know their knowledge on lean
visualization tools and computer system. Most of the Autokeen production operator
mostly are foreigners. They might not know the English language that was implemented
for the system. An interview needs to be done towards them will be taken. The English
words that have been implemented with the bits of help of some pictures and colours.
iii. Survey method – survey method was utilized with general users. It was utilized to
acquire the users' point of views towards the DVMS UI and to get their criticism on
that. Two techniques were utilized for this method, specifically the interview and
questionnaire. In the first evaluation study, the questionnaire was not distributed
towards users, however the interview was handled. In the second evaluation study, both
the interview and questionnaire method were applied to it. The standardized
questionnaire was distributed after survey has done in the second evaluation study to
gather the information and to quantify the usability factors:
▪ The Post-Study System Usability Questionnaire (PSSUQ) version 3 has been
used in this study to acquire the system quality, information quality, and
interface quality of the DVMS UI. With the acquired data, the user satisfaction
towards the system will achieved also.
Besides that, some additional question also will ask towards the participants to
investigate the participants background for further exploration study.
iv. Observation method – a direct-observation and video recording will be done towards
the experts and general users to see how the interaction of all type of users towards the
system. A note will be taken on direct-observation and the video is for reviews. This
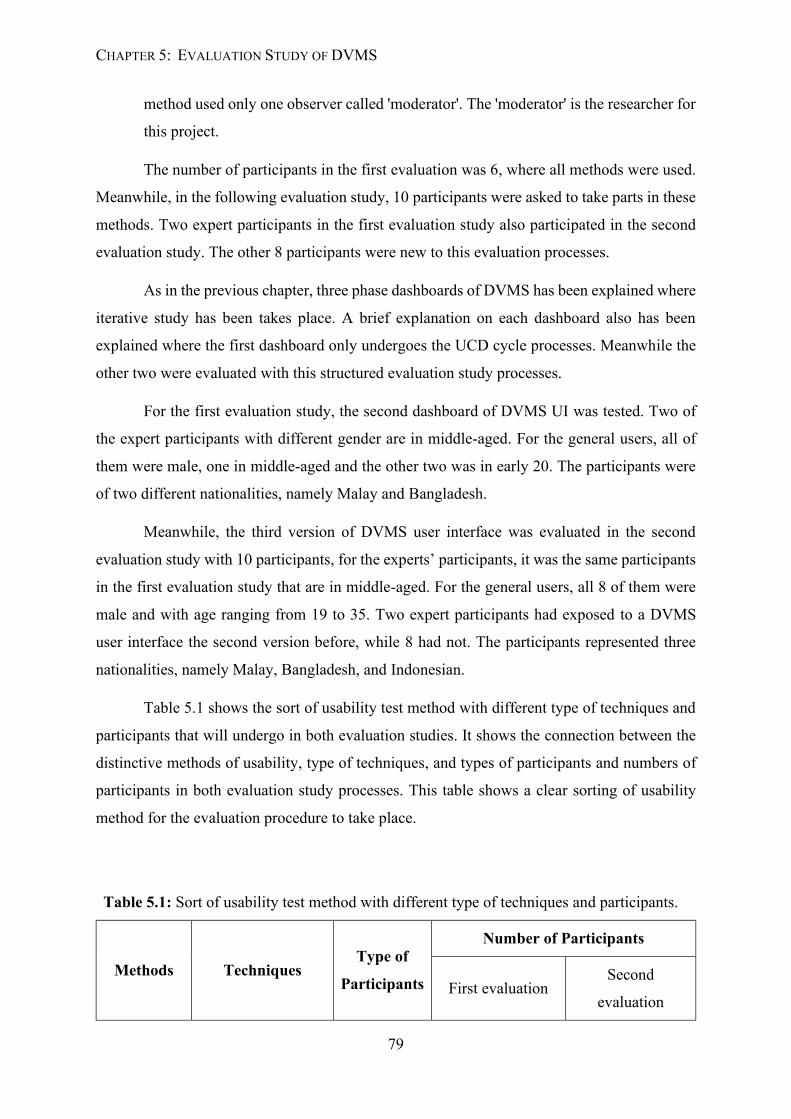
CHAPTER 5: EVALUATION STUDY OF DVMS
79
method used only one observer called 'moderator'. The 'moderator' is the researcher for
this project.
The number of participants in the first evaluation was 6, where all methods were used.
Meanwhile, in the following evaluation study, 10 participants were asked to take parts in these
methods. Two expert participants in the first evaluation study also participated in the second
evaluation study. The other 8 participants were new to this evaluation processes.
As in the previous chapter, three phase dashboards of DVMS has been explained where
iterative study has been takes place. A brief explanation on each dashboard also has been
explained where the first dashboard only undergoes the UCD cycle processes. Meanwhile the
other two were evaluated with this structured evaluation study processes.
For the first evaluation study, the second dashboard of DVMS UI was tested. Two of
the expert participants with different gender are in middle-aged. For the general users, all of
them were male, one in middle-aged and the other two was in early 20. The participants were
of two different nationalities, namely Malay and Bangladesh.
Meanwhile, the third version of DVMS user interface was evaluated in the second
evaluation study with 10 participants, for the experts’ participants, it was the same participants
in the first evaluation study that are in middle-aged. For the general users, all 8 of them were
male and with age ranging from 19 to 35. Two expert participants had exposed to a DVMS
user interface the second version before, while 8 had not. The participants represented three
nationalities, namely Malay, Bangladesh, and Indonesian.
Table 5.1 shows the sort of usability test method with different type of techniques and
participants that will undergo in both evaluation studies. It shows the connection between the
distinctive methods of usability, type of techniques, and types of participants and numbers of
participants in both evaluation study processes. This table shows a clear sorting of usability
method for the evaluation procedure to take place.
Table 5.1: Sort of usability test method with different type of techniques and participants.
Methods Techniques Type of
Participants
Number of Participants
First evaluation Second
evaluation
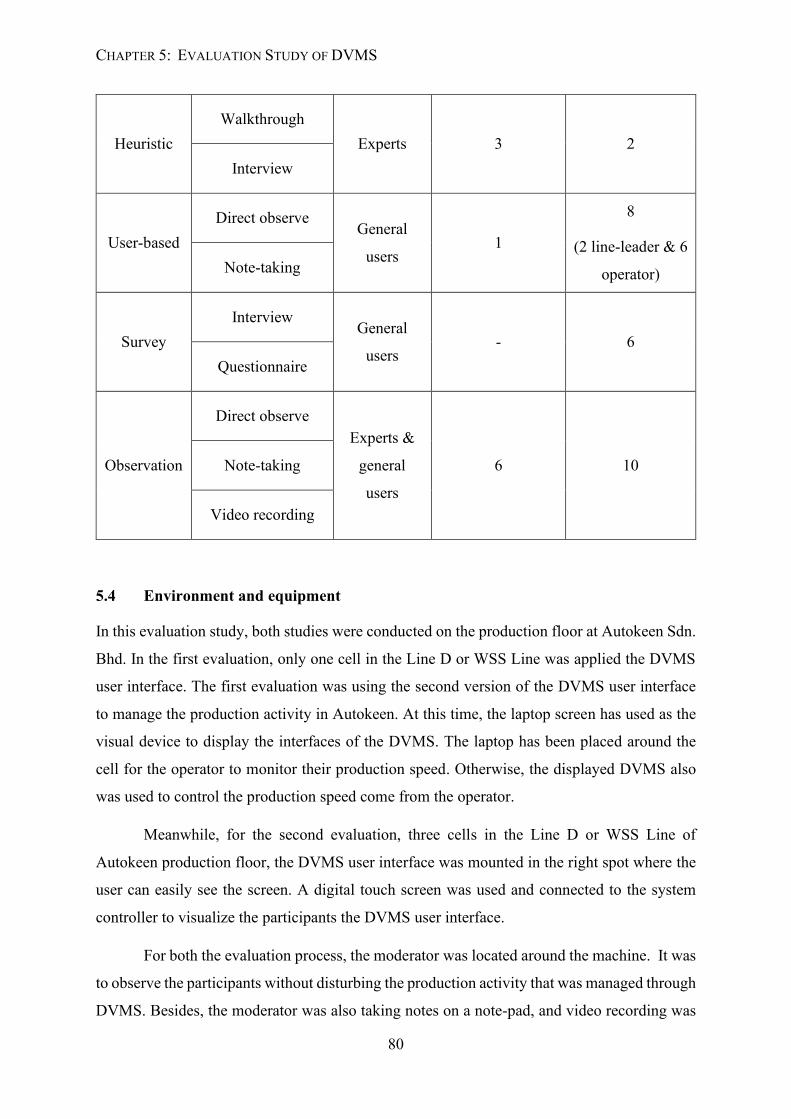
CHAPTER 5: EVALUATION STUDY OF DVMS
80
Heuristic Walkthrough
Experts 3 2 Interview
User-based Direct observe
General
users 1
8
(2 line-leader & 6
operator) Note-taking
Survey Interview
General
users - 6
Questionnaire
Observation
Direct observe Experts &
general
users
6 10 Note-taking
Video recording
5.4 Environment and equipment
In this evaluation study, both studies were conducted on the production floor at Autokeen Sdn.
Bhd. In the first evaluation, only one cell in the Line D or WSS Line was applied the DVMS
user interface. The first evaluation was using the second version of the DVMS user interface
to manage the production activity in Autokeen. At this time, the laptop screen has used as the
visual device to display the interfaces of the DVMS. The laptop has been placed around the
cell for the operator to monitor their production speed. Otherwise, the displayed DVMS also
was used to control the production speed come from the operator.
Meanwhile, for the second evaluation, three cells in the Line D or WSS Line of
Autokeen production floor, the DVMS user interface was mounted in the right spot where the
user can easily see the screen. A digital touch screen was used and connected to the system
controller to visualize the participants the DVMS user interface.
For both the evaluation process, the moderator was located around the machine. It was
to observe the participants without disturbing the production activity that was managed through
DVMS. Besides, the moderator was also taking notes on a note-pad, and video recording was
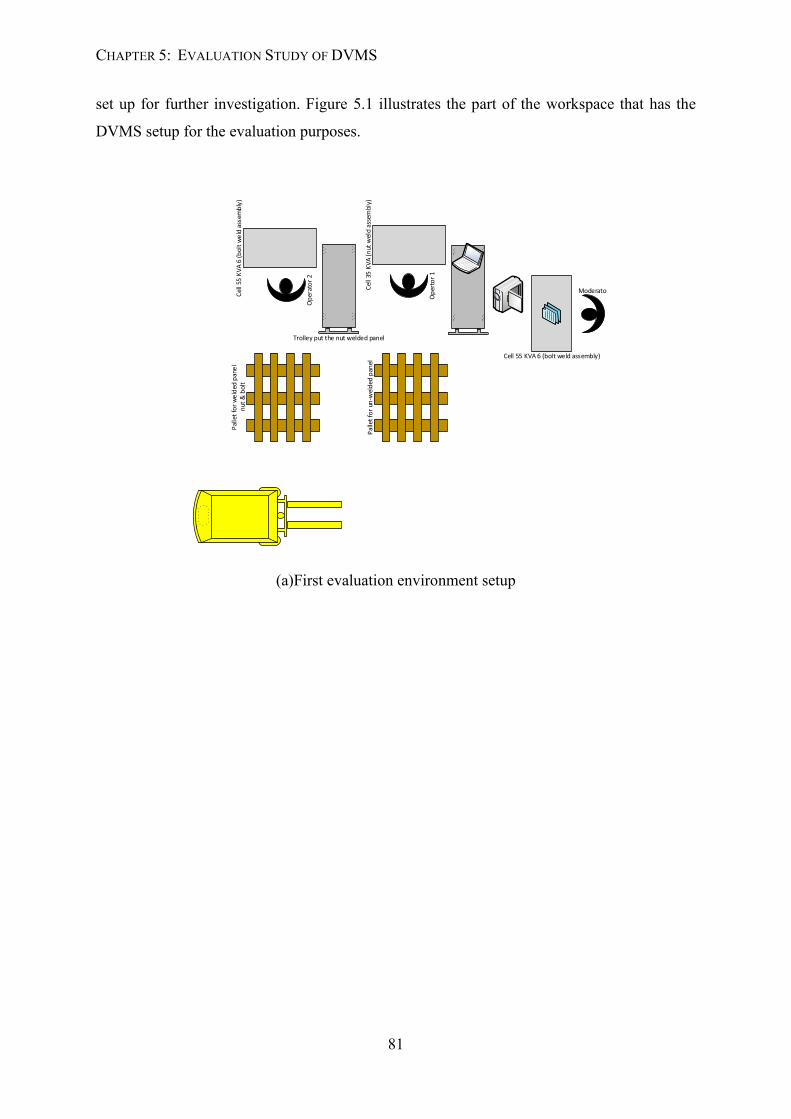
CHAPTER 5: EVALUATION STUDY OF DVMS
81
set up for further investigation. Figure 5.1 illustrates the part of the workspace that has the
DVMS setup for the evaluation purposes.
Cell 55 KVA 6 (bolt weld assembly)
Moderator
Op
erto
r 1
Trolley put the nut welded panel
Cel
l 35
KV
A (n
ut w
eld
asse
mbl
y)
Cel
l 55
KV
A 6
(b
olt
we
ld a
ssem
bly
)
Op
erat
or
2
Pal
let
for
un-w
eld
ed p
anel
Pal
let
for
we
lded
pan
el
nut
& b
olt
(a)First evaluation environment setup
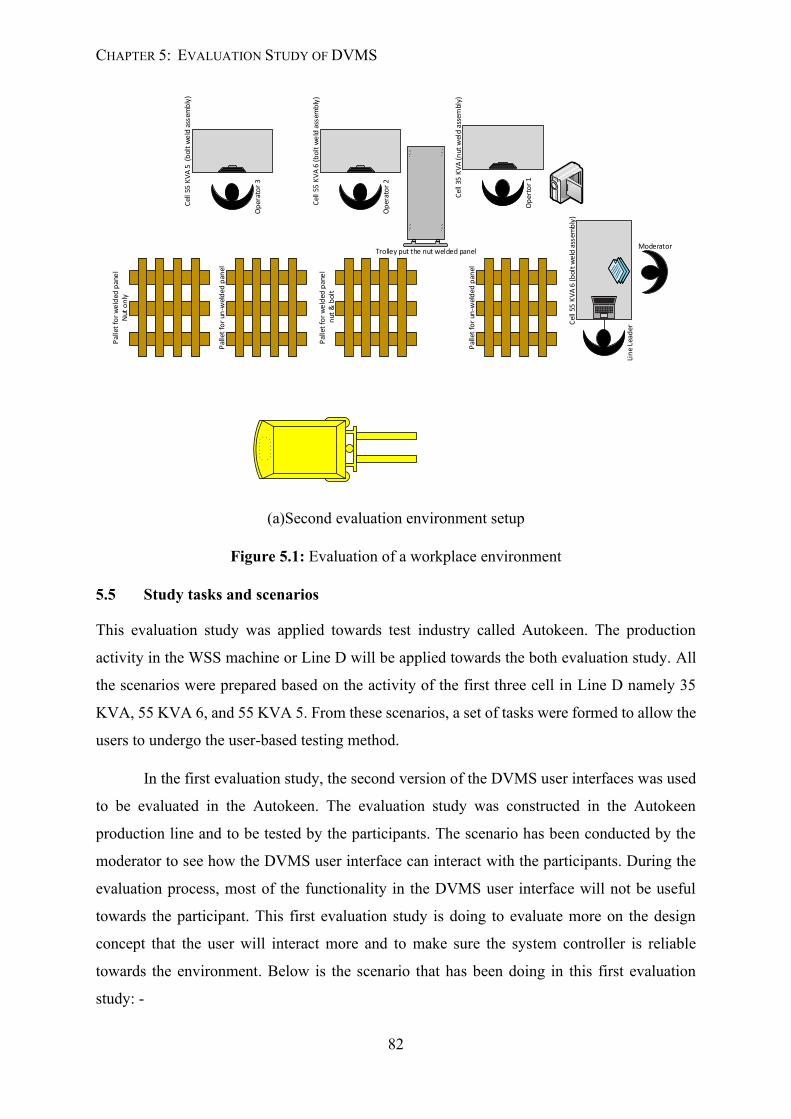
CHAPTER 5: EVALUATION STUDY OF DVMS
82
Op
erto
r 1
Pal
let
for
un-w
eld
ed p
anel
Trolley put the nut welded panel
Cel
l 35
KV
A (
nut
wel
d as
sem
bly)
Op
erat
or
2
Cel
l 55
KV
A 6
(b
olt
we
ld a
ssem
bly
)
Op
erat
or
3
Cel
l 55
KV
A 5
(b
olt
we
ld a
ssem
bly
)
Pal
let
for
we
lded
pan
el
nut
& b
olt
Pal
let
for
we
lded
pan
el
Nut
on
ly
Pal
let
for
un-w
eld
ed p
anel
Cel
l 55
KV
A 6
(b
olt
we
ld a
ssem
bly
)
Moderator
Lin
e Le
ader
(a)Second evaluation environment setup
Figure 5.1: Evaluation of a workplace environment
5.5 Study tasks and scenarios
This evaluation study was applied towards test industry called Autokeen. The production
activity in the WSS machine or Line D will be applied towards the both evaluation study. All
the scenarios were prepared based on the activity of the first three cell in Line D namely 35
KVA, 55 KVA 6, and 55 KVA 5. From these scenarios, a set of tasks were formed to allow the
users to undergo the user-based testing method.
In the first evaluation study, the second version of the DVMS user interfaces was used
to be evaluated in the Autokeen. The evaluation study was constructed in the Autokeen
production line and to be tested by the participants. The scenario has been conducted by the
moderator to see how the DVMS user interface can interact with the participants. During the
evaluation process, most of the functionality in the DVMS user interface will not be useful
towards the participant. This first evaluation study is doing to evaluate more on the design
concept that the user will interact more and to make sure the system controller is reliable
towards the environment. Below is the scenario that has been doing in this first evaluation
study: -
CHAPTER 5: EVALUATION STUDY OF DVMS
83
Scenario:
“Line leader check the amount of product that needs to be done by the operator in cell 35
KVA. Then the line leader asks the operator to do the task by providing the stamped panel on
the un-welded pallet and inform the operator is doing the production operation.”
Below are the set of tasks for this scenario:
i. Identify the demands of the productions.
ii. Key in the number of demands and send the data to the database.
iii. Operator view the number of demands
iv. The operator starts doing the production activity until they meet the demand
For the second evaluation study, the third version of the DVMS user interface was first
undergoing the heuristic evaluation, and some changes have done to it before the user-based
testing method in the real-time production situation. Chapter 5 will show the improved
interface that is going to test towards participants. The improved interface also contains two
different interfaces that were also focused on a different group. The scenarios have been made
toward every group, and each scenario contains different task that going to be perform by a
different group. The first third scenarios were made to the management group, where they will
be using the management interface. Meanwhile, the rest are for the operators where the
production is performed. Below are the scenarios for the second evaluation test: -
First scenario:
“In the management environment, they need to plan for the production activity that will be happening on the production floor. But before that, they need to see which operator that suitable for that particular production activity as they need to have a smooth production process. After that, the planned production has been passed to the line leader and the line leader check the availability of product that and then send it towards the production cell 35 KVA, 50 KVA 6, and 50 KVA 5. Then the line leader asks the operator to do the task by providing the stamped panel on the un-welded pallet and inform the operator is doing the production operation.”
Below are the set of tasks for this scenario where the DVMS management interface was being
used in performing the first scenario:
i. Review the production history and machine condition to plan for the production
CHAPTER 5: EVALUATION STUDY OF DVMS
84
ii. Insert the variable needed by the DVMS management interface
iii. Set the planned task towards the DVMS management interface
iv. Review all the planned task before asking the operator to start working.
Second scenario:
“In the production floor, the management team need to go down from the office and went to
the shop floor to see the status of the production floor. Otherwise, when the management needs
to make an announcement or to ask the operator to be more productive, they also need to
approach the operator, went down to the shop floor.”
Below are the set of tasks for this scenario where the DVMS management interface was being
used in performing the second scenario:
i. Monitor real-time production data (Productivity & Efficiency).
ii. Monitor the cell under the line activity
iii. Make an announcement to a specific cell or all cell.
Third scenario:
“When the operator in the production floor has finished their tasks that already plan, if the
manager needs to set another task toward the operator, they need to go down and ask the
operator to do the next task.”
Below are the set of tasks for this scenario where the DVMS management interface was being
used in performing the third scenario:
i. Monitor the status of the cell under the line activity.
ii. Instantly review all the task under the task description by re-select the shift dropdown
menu for each cell to check the cell availability.
iii. Add the specific task towards the specific cell that is available.
Fourth scenario:
“Before starting the production activity, the line supervisor will be giving a short talk
regarding the previous production activity such as safety equipment, machine condition, etc.
CHAPTER 5: EVALUATION STUDY OF DVMS
85
In the meantime, all the operators need to make sure the PPE that they are wearing followed
the safety guidelines. After that, the operator then started to assign into a specific line by line
leader and then start doing their work according to the task given and changing the A3 paper
that displaying the SOP into the assigned task. Line supervisor also has taken note of each
machine condition before the machine has passed toward the operators.”
Below are the set of tasks for this scenario where the DVMS production interface was being
used in performing the fourth scenario:
i. Check all the safety guidelines shows by the interface before proceed to the next frame
where the task is showing.
ii. The interface will greet the operator by welcoming the operator towards the cell. If the
interface showing the wrong name, means the operator need to re-check with the line
leader.
iii. Under task management, the task for the entire shift will be showed up towards the
operator, and the operator needs to select the most top task first before running the
process. The interface will show the SOP for the task towards the operator.
iv. Under the same frame, on the centre bottom of the frame contain the machine
monitoring. An operator needs to tick all the stated machine condition before starting
the production.
v. Operator press the start production and start doing the process.
Fifth scenario:
“While doing the production, operators are about to use the toilet, to have break time or
anything. The operator will put the arrow chart displaying the cell status on the trolley to
display the status of the cell to inform anyone who passed by the cell. Moreover, after finishing
the break time or going to the toilet or anything, the operators remove the arrow chart and
start doing the work again.”
Below is the set of task for this scenario where the DVMS operation interface was being used
in performing the fifth scenario:
CHAPTER 5: EVALUATION STUDY OF DVMS
86
i. Under the third frame of the DVMS operation interface, there is time management, and
the operator needs to select the reason for pausing the production. Then the operator
needs to press pause.
ii. When the operator pressed the pause production, it moves the frame into another frame
displaying the SOP of the production, the status of the cell in term of the picture and
the time elapsed on the paused operations. The operator needs to make sure the time
elapsed time has followed the allocation time of paused production. Then the operator
needs to resume the production to resume on the specific task.
Sixth scenario:
“While operating the job, the operator was making a mistake on the specific part and cause
the part defect. The operator should revise the SOP to make sure the processes are right. The
operator needs to look at back the SOP and make sure everything is right.”
Below are the set of tasks for this scenario where the DVMS operation interface was being
used in performing the sixth scenario:
i. Under the “Task Information”, it displayed the completed product with the chosen
nut/bolt for the specific part. The operator needs to press the “Task No. #” to review
back the SOP.
ii. After that, the new frame will come out containing SOP and Time Management, where
the operator needs to revise the SOP and then continue the production without wasting
time.
Seventh scenario:
“While operating the job, the machine was run into a problem. The operator called the line
leader to reports the problem towards maintenance.”
Below are the set of tasks for this scenario where the DVMS operation interface was being
used in performing the seventh scenario:
i. The operator needs to press the emergency stop button to stop the production first,
where this message also has visualized in the management interface.
CHAPTER 5: EVALUATION STUDY OF DVMS
87
ii. The operator selects the problem under the dropdown menu on the centre of the frame
and sends the reports to the management interface that will be visualized in reports area.
Eighth scenario:
“When the operator has finished the operation, the operator needs to put the arrow chart on
the trolley to display the cell status. This will make the line leader approach the cell to check
with the operator, and if there is a new task, the line leader will assign to the operator.”
Below are the set of tasks for this scenario where the DVMS operation interface was being
used in performing the eighth scenario:
i. The DVMS operation interface will display the second frame where displaying tasks,
SOP, and task completion rates. If the operator has finished the task, the task
management box will be empty, and the task completion rates will show 100%
completed tasks, if not they will be a remaining task on the box and with a specific
amount of completed tasks. If the box is empty, the operator needs to press a refresh
button to see a new task coming by line leader, and if there is no incoming task, the
start production will turn into exit production. The operator needs to press exit
production.
Ninth scenario:
“The general announcement was made through the loudspeaker, and sometimes the worker
does not hear the details of the announcement. They will ask the other operator who heard the
announcement.”
Below are the set of tasks for this scenario where the DVMS operation interface was being
used in performing the ninth scenario:
i. The operator will notify the announcement icon on the top bar of their interface and
click it to view the announcement.
CHAPTER 5: EVALUATION STUDY OF DVMS
88
5.6 Evaluation processes
In order to conduct evaluation study, the processes were partitioned into three different phases:
preparation, evaluation session, and analysis and result. The process was start with the
preparation where this phase included setting up the participants for the test and planning a test
meeting for every one of them. Additionally, all the important components have been structured
and prepared before undergoing the process. Also, the evaluation study arrangement and
condition had designed in this stage
During each evaluation session, the following steps were implemented, in the following order:
i. The moderator asked both experts to walk-through the DVMS UI and giving their
opinion on the DVMS user interface before it goes to the general users.
ii. The moderator introduces the DVMS UI towards the general user. The working
principle and the application towards the real-time production activity in Autokeen has
been explain and moderator open for a question and answer session before they using
the system;
iii. The moderator asked the participant to investigate the framework and verbally process
during this time.
iv. The test begins with the constructed scenarios which based on real-time production
processes in Autokeen. Involved participants were asked to performed the production
in the user of DVMS UI. The processed was observed and recorded into sort of videos
and notes;
v. Participant answered the ‘Post-Study System Questionnaire’ after all the task has done;
While operating the DVMS UI, the involves participants were freely to ask the moderator about
the system functionality, processes, and etc.
Following phase where all the tasks has been completed by all participants and the PSSUQ has
been answered. All the recorded data were used to analyse in this phase. This was done so as
to locate the necessary outcome, as characterized in the objectives of the assessment study. In
this final phase, the examination occurred after the information were gathered and joined. The
results of both of the assessment examines are introduced in the Chapter 6.
CHAPTER 5: EVALUATION STUDY OF DVMS
89
5.7 Summary
The entire chapter described the processes of handling the evaluation study, where the usability
test took place to evaluate Autokeen users' interaction with the developed DVMS. Two
different usability evaluation was constructed, as this study was conducted iteratively. The first
usability evaluation was done in the second stage of the iterative study, prototyping. Then, the
second usability evaluation study was followed in the implementation phase. In order to create
these evaluation studies, the evaluation framework has been the first thing created and
describes in the first section of this chapter. This first section has guided this research by
planning sequential steps for conducting the evaluation study. From the given framework, the
structural evaluation study plan was then structured for this entire chapter. The first structure
of this evaluation study framework was the evaluation study goals. These goals have become
the parameter for this research study that needs to be controlled by the researcher. The first
essential goals that the researcher stated in evaluating the study was to refine the DVMS UI.
The gradual refinement process of DVMS UI will show the different results of user engagement
towards the UI. This user interaction is the main focus of developing this system. Otherwise,
the objective could not be achieved by the researcher. Then, the researcher describes the other
goals in identifying usability issues. This approach helps the researcher figure out the
deficiency in the UI. Thus improvement can be made towards the lack. After the goals, this
chapter has described the way in choosing suitable methods and techniques with a certain
number of participants. Table 5.1 has shown a sort of usability test method with different
techniques and participants in both evaluation studies. This chapter also depicts the situation
when the evaluation study takes place in the section of this evaluation study's environment and
equipment. Before that, to conduct the test, the initial study phase has conducted in the
Autokeen production environment, as mentioned in early chapter 4. The environment was
studied, and the real-time scenarios of the production activities were recorded and applied to
the evaluation study. The improvement can be made towards real-time scenarios, such as
improvements in the processing time and production steps needed to observe and analyze. This
improvement will then describe in the next chapter. Finally, the processes that need to be taken
for each evaluation study has clarified. This section presents the procedure of conducting the
evaluation study that has arranged to measure the improvements made by each phase. The
results of the evaluation processes will be described in the next chapter.
90
CHAPTER 6
Results
This chapter explains the results for this entire research, including the development and
implementation processes and both evaluation studies for the DVMS. The first section of this
chapter will explain how the DVMS implemented. Then this chapter followed by illustrating
the results which linkage to research question and objectives. With this approach, it gives
clarifications about the regions of positive criticism, and those requiring further consideration,
in view of the input from the participants in the questionnaire.
6.1 Visual Management (VM) practise in site
In Chapter 1, the researcher has described the current visual management (VM) tools that were
implemented in the Autokeen production system. Most of the implemented tools seem not to
affect much in the production performance as the appearance of it does not intend to improve
the employee visually. The distinct VM tools that seemed a bit interacted with the operator was
the bolt or nut feeder management system. It works as controlling the feeding amount of bolt
or nut towards the specified panel. It warns the operator when the operator deviates from the
standard. Otherwise, the visualized information seems does not interact with the operator when
the operator is doing the production operation. Furthermore, the visual control board that was
placed far away from the line seems does not become important towards the operator. The
operator only interacts directly with the other operator and the management team when they
ask for something. Even though Autokeen has implemented VM tools quite a lot, the uses of it
seem to worsen as the attractions towards the operators has faded away by the era globalization.
CHAPTER 6: RESULTS
91
6.2 Summary of DVMS Implementation
The implementation of DVMS begun with getting the user requirements from the stakeholders,
including Autokeen members, MARII representative, and also TIC directors. It then followed
with the selection of suitable development processes, where UCD has been chosen as it requires
the involvement of stakeholders in developing the DVMS. This implementation then started
with the sketching and designing process where the most effective VM was chosen to be in the
DVMS. This process has gone through the UCD cycle where it was going to several stages that
reviewing processes by stakeholders to confirm the suitable VM and delivery method of
DVMS. Also, the designing process of DVMS was not just based on UCD. It has also followed
by the literature study of the VM tools where to get the successful VM. The first phase of
developing the DVMS has decided the DVMS to based on the Python GUI application
(Tkinter) where it based on the Python programming language that can be easily used in a
different type of operating system. Then, the counting system was based on the video recording
counting system. When this first version of DVMS being drafting, each step of the UCD cycle
has been gone through until the final step where stakeholders have gone through and giving
feedback on the DVMS concept. Other than that, this version of DVMS has also been reviewed
and commented during the researcher’s confirmation candidature. This review is where the
turning point of the counting system of DVMS. The video recording counting system was
resulted not relevant for this study. Then it was replaced with the used of proximity sensors.
After that, the implementation process of DVMS continued with separation of DVMS
UI, where it specifies the area of work in the production process. The management and
operation processes of DVMS has been separated as the DVMS visual elements are going to
be precise. From that, the implementation of DVMS is spiked, where the design of DVMS UI
has changed. This change was made to follow what has been required by users. A UCD cycle
is still ongoing where every change on design has involving users. When this second phase of
DVMS UI has been partially prototyped, the first usability evaluation has been conducted to
test the UI and the system controller (Raspberry Pi) in the real situation of production. With
the usability evaluation study, various feedbacks from the users has been collected, and
improvements of the DVMS were required. These improvements were created a third
development process of DVMS, where it was the final stage of DVMS.
In the final stage of DVMS development, a high-fidelity prototype of DVMS where all
the functionalities are confirmed and tested. The DVMS then was gone through the second
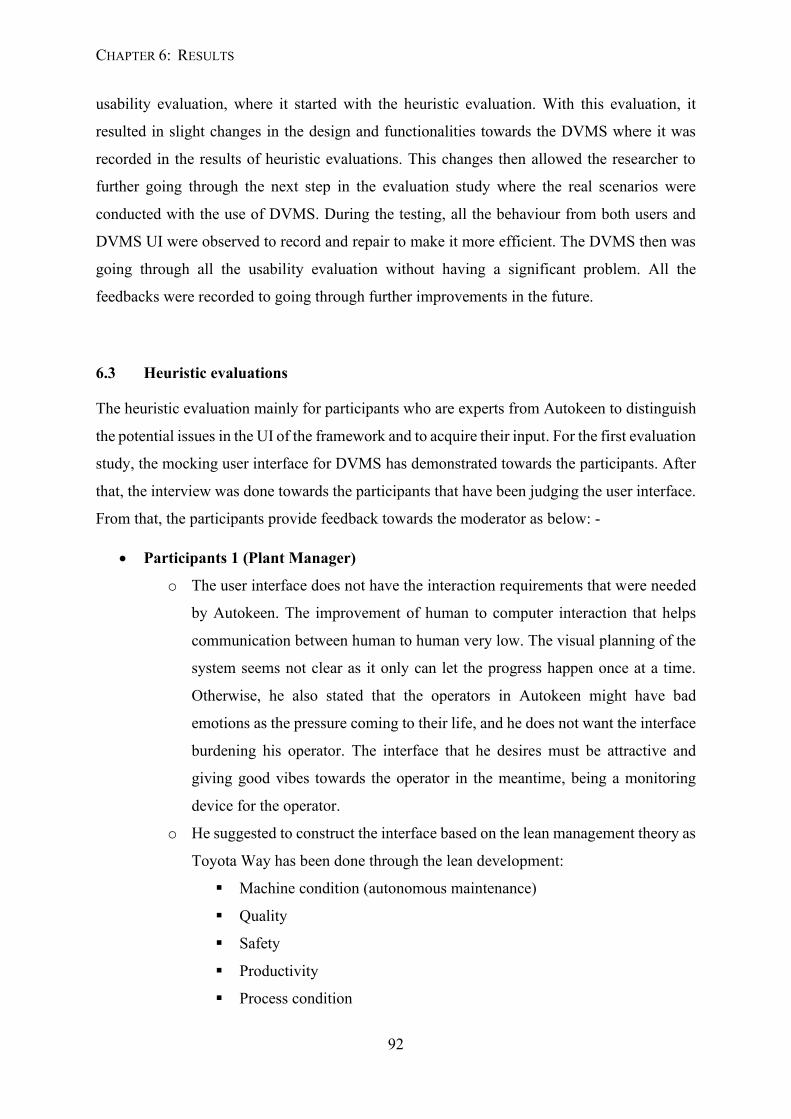
CHAPTER 6: RESULTS
92
usability evaluation, where it started with the heuristic evaluation. With this evaluation, it
resulted in slight changes in the design and functionalities towards the DVMS where it was
recorded in the results of heuristic evaluations. This changes then allowed the researcher to
further going through the next step in the evaluation study where the real scenarios were
conducted with the use of DVMS. During the testing, all the behaviour from both users and
DVMS UI were observed to record and repair to make it more efficient. The DVMS then was
going through all the usability evaluation without having a significant problem. All the
feedbacks were recorded to going through further improvements in the future.
6.3 Heuristic evaluations
The heuristic evaluation mainly for participants who are experts from Autokeen to distinguish
the potential issues in the UI of the framework and to acquire their input. For the first evaluation
study, the mocking user interface for DVMS has demonstrated towards the participants. After
that, the interview was done towards the participants that have been judging the user interface.
From that, the participants provide feedback towards the moderator as below: -
• Participants 1 (Plant Manager)
o The user interface does not have the interaction requirements that were needed
by Autokeen. The improvement of human to computer interaction that helps
communication between human to human very low. The visual planning of the
system seems not clear as it only can let the progress happen once at a time.
Otherwise, he also stated that the operators in Autokeen might have bad
emotions as the pressure coming to their life, and he does not want the interface
burdening his operator. The interface that he desires must be attractive and
giving good vibes towards the operator in the meantime, being a monitoring
device for the operator.
o He suggested to construct the interface based on the lean management theory as
Toyota Way has been done through the lean development:
▪ Machine condition (autonomous maintenance)
▪ Quality
▪ Safety
▪ Productivity
▪ Process condition
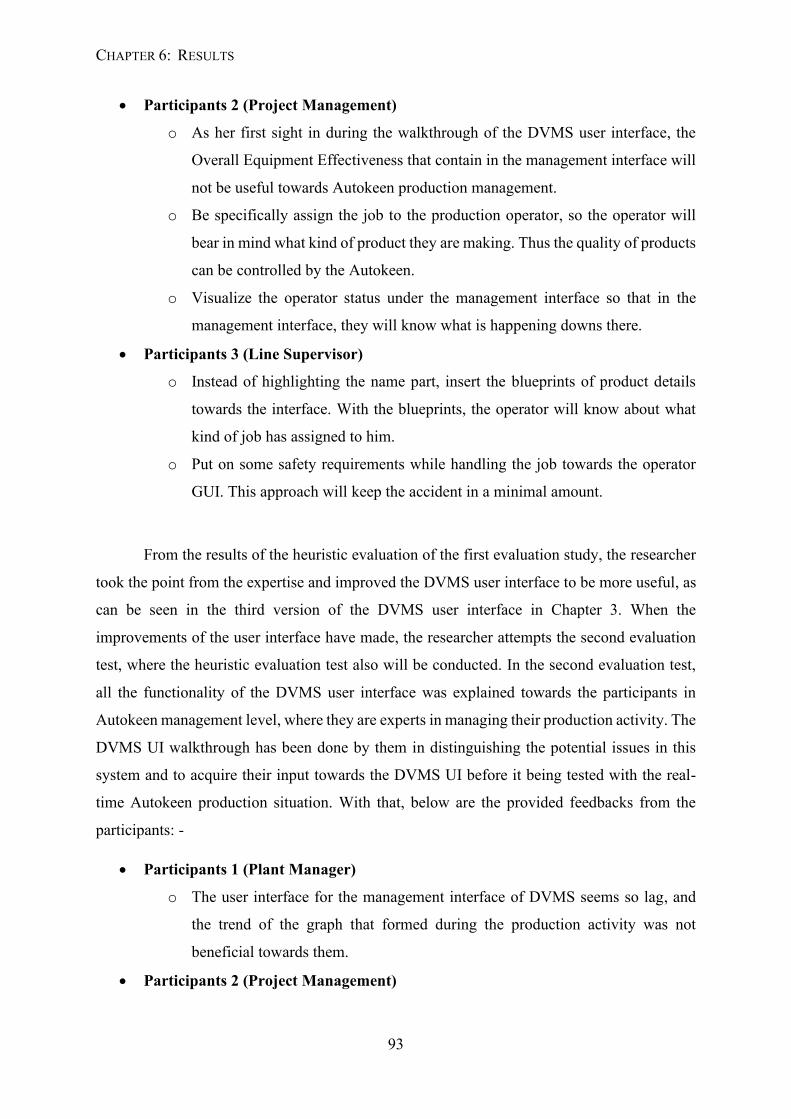
CHAPTER 6: RESULTS
93
• Participants 2 (Project Management)
o As her first sight in during the walkthrough of the DVMS user interface, the
Overall Equipment Effectiveness that contain in the management interface will
not be useful towards Autokeen production management.
o Be specifically assign the job to the production operator, so the operator will
bear in mind what kind of product they are making. Thus the quality of products
can be controlled by the Autokeen.
o Visualize the operator status under the management interface so that in the
management interface, they will know what is happening downs there.
• Participants 3 (Line Supervisor)
o Instead of highlighting the name part, insert the blueprints of product details
towards the interface. With the blueprints, the operator will know about what
kind of job has assigned to him.
o Put on some safety requirements while handling the job towards the operator
GUI. This approach will keep the accident in a minimal amount.
From the results of the heuristic evaluation of the first evaluation study, the researcher
took the point from the expertise and improved the DVMS user interface to be more useful, as
can be seen in the third version of the DVMS user interface in Chapter 3. When the
improvements of the user interface have made, the researcher attempts the second evaluation
test, where the heuristic evaluation test also will be conducted. In the second evaluation test,
all the functionality of the DVMS user interface was explained towards the participants in
Autokeen management level, where they are experts in managing their production activity. The
DVMS UI walkthrough has been done by them in distinguishing the potential issues in this
system and to acquire their input towards the DVMS UI before it being tested with the real-
time Autokeen production situation. With that, below are the provided feedbacks from the
participants: -
• Participants 1 (Plant Manager)
o The user interface for the management interface of DVMS seems so lag, and
the trend of the graph that formed during the production activity was not
beneficial towards them.
• Participants 2 (Project Management)
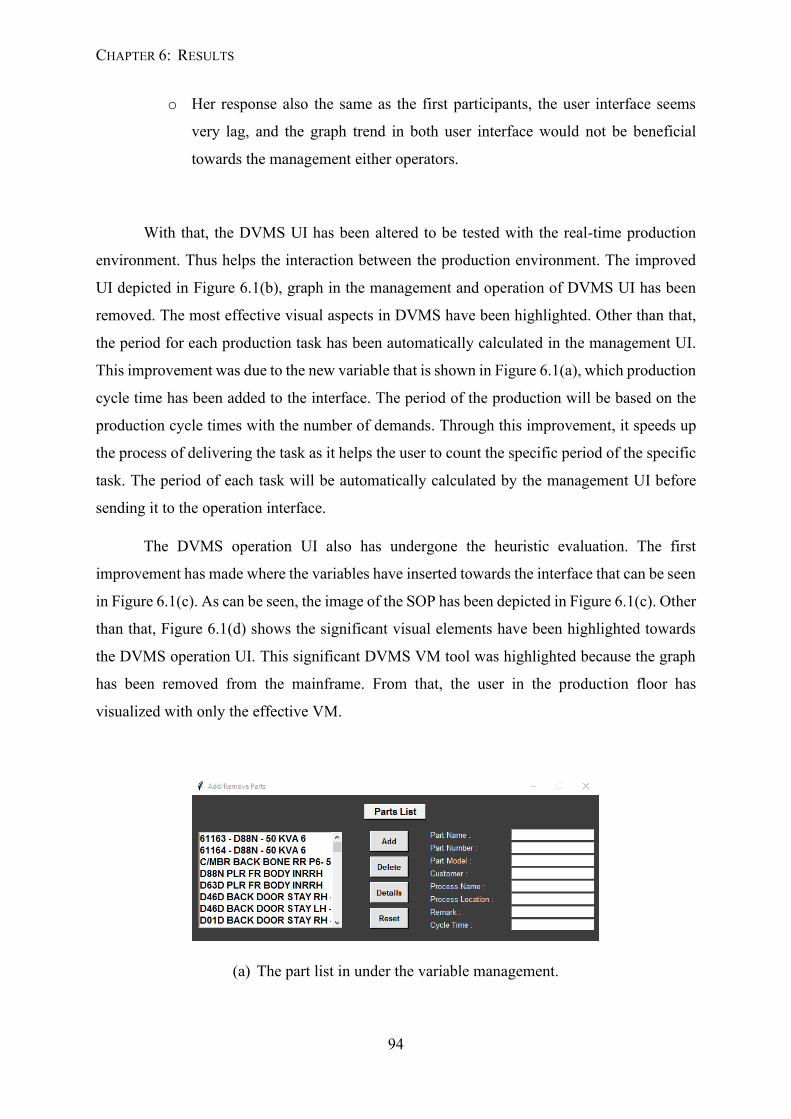
CHAPTER 6: RESULTS
94
o Her response also the same as the first participants, the user interface seems
very lag, and the graph trend in both user interface would not be beneficial
towards the management either operators.
With that, the DVMS UI has been altered to be tested with the real-time production
environment. Thus helps the interaction between the production environment. The improved
UI depicted in Figure 6.1(b), graph in the management and operation of DVMS UI has been
removed. The most effective visual aspects in DVMS have been highlighted. Other than that,
the period for each production task has been automatically calculated in the management UI.
This improvement was due to the new variable that is shown in Figure 6.1(a), which production
cycle time has been added to the interface. The period of the production will be based on the
production cycle times with the number of demands. Through this improvement, it speeds up
the process of delivering the task as it helps the user to count the specific period of the specific
task. The period of each task will be automatically calculated by the management UI before
sending it to the operation interface.
The DVMS operation UI also has undergone the heuristic evaluation. The first
improvement has made where the variables have inserted towards the interface that can be seen
in Figure 6.1(c). As can be seen, the image of the SOP has been depicted in Figure 6.1(c). Other
than that, Figure 6.1(d) shows the significant visual elements have been highlighted towards
the DVMS operation UI. This significant DVMS VM tool was highlighted because the graph
has been removed from the mainframe. From that, the user in the production floor has
visualized with only the effective VM.
(a) The part list in under the variable management.
CHAPTER 6: RESULTS
95
(b) The improved management UI after the heuristic usability evaluation of the second evaluation process.
(c) The second frame of the DVMS operation interface
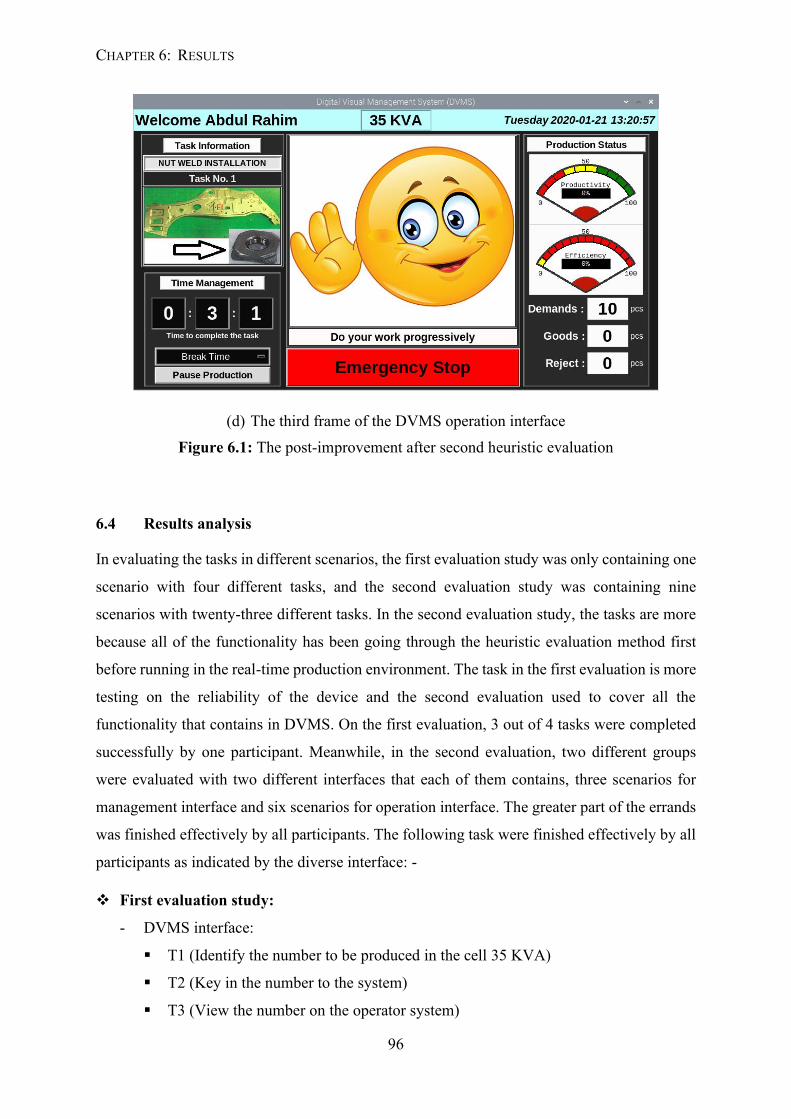
CHAPTER 6: RESULTS
96
(d) The third frame of the DVMS operation interface Figure 6.1: The post-improvement after second heuristic evaluation
6.4 Results analysis
In evaluating the tasks in different scenarios, the first evaluation study was only containing one
scenario with four different tasks, and the second evaluation study was containing nine
scenarios with twenty-three different tasks. In the second evaluation study, the tasks are more
because all of the functionality has been going through the heuristic evaluation method first
before running in the real-time production environment. The task in the first evaluation is more
testing on the reliability of the device and the second evaluation used to cover all the
functionality that contains in DVMS. On the first evaluation, 3 out of 4 tasks were completed
successfully by one participant. Meanwhile, in the second evaluation, two different groups
were evaluated with two different interfaces that each of them contains, three scenarios for
management interface and six scenarios for operation interface. The greater part of the errands
was finished effectively by all participants. The following task were finished effectively by all
participants as indicated by the diverse interface: -
❖ First evaluation study:
- DVMS interface:
▪ T1 (Identify the number to be produced in the cell 35 KVA)
▪ T2 (Key in the number to the system)
▪ T3 (View the number on the operator system)
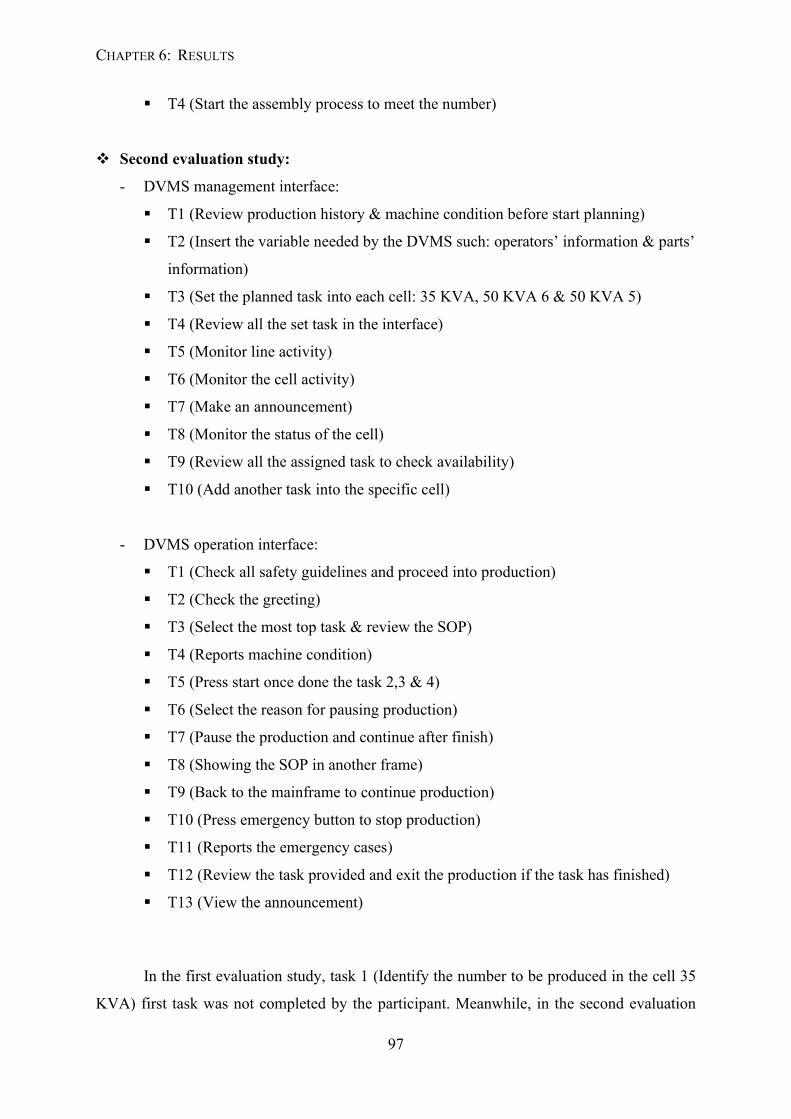
CHAPTER 6: RESULTS
97
▪ T4 (Start the assembly process to meet the number)
❖ Second evaluation study:
- DVMS management interface:
▪ T1 (Review production history & machine condition before start planning)
▪ T2 (Insert the variable needed by the DVMS such: operators’ information & parts’
information)
▪ T3 (Set the planned task into each cell: 35 KVA, 50 KVA 6 & 50 KVA 5)
▪ T4 (Review all the set task in the interface)
▪ T5 (Monitor line activity)
▪ T6 (Monitor the cell activity)
▪ T7 (Make an announcement)
▪ T8 (Monitor the status of the cell)
▪ T9 (Review all the assigned task to check availability)
▪ T10 (Add another task into the specific cell)
- DVMS operation interface:
▪ T1 (Check all safety guidelines and proceed into production)
▪ T2 (Check the greeting)
▪ T3 (Select the most top task & review the SOP)
▪ T4 (Reports machine condition)
▪ T5 (Press start once done the task 2,3 & 4)
▪ T6 (Select the reason for pausing production)
▪ T7 (Pause the production and continue after finish)
▪ T8 (Showing the SOP in another frame)
▪ T9 (Back to the mainframe to continue production)
▪ T10 (Press emergency button to stop production)
▪ T11 (Reports the emergency cases)
▪ T12 (Review the task provided and exit the production if the task has finished)
▪ T13 (View the announcement)
In the first evaluation study, task 1 (Identify the number to be produced in the cell 35
KVA) first task was not completed by the participant. Meanwhile, in the second evaluation
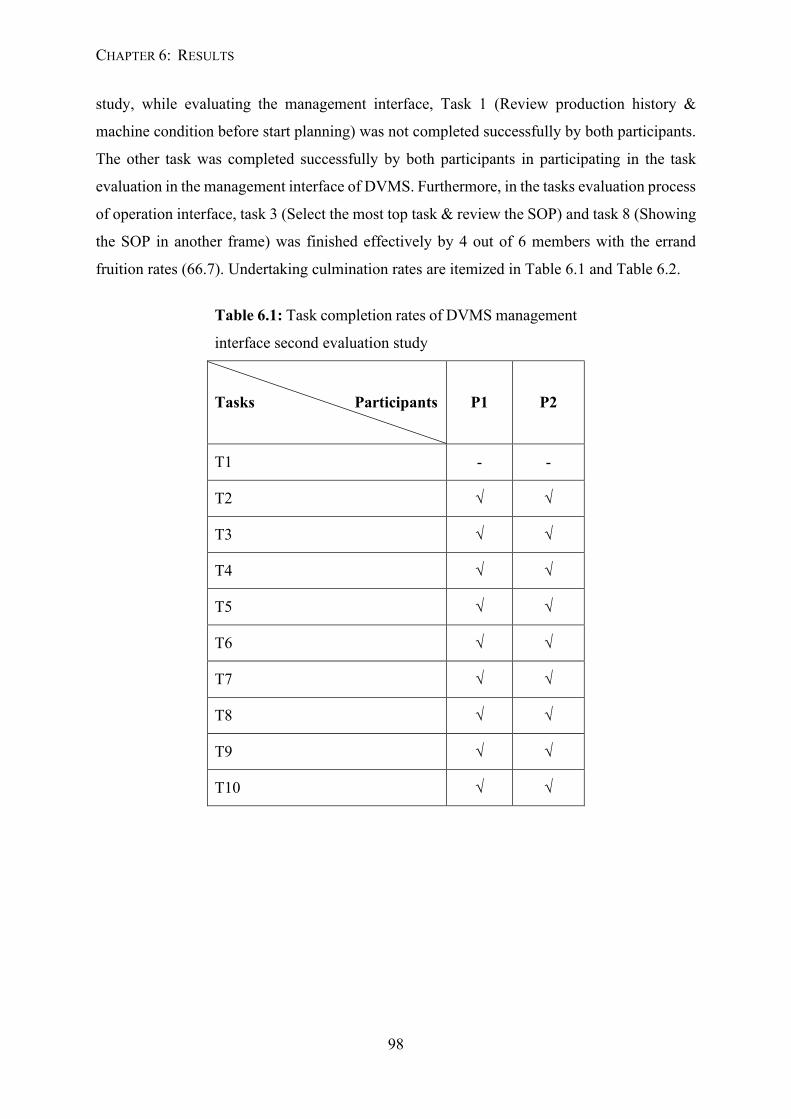
CHAPTER 6: RESULTS
98
study, while evaluating the management interface, Task 1 (Review production history &
machine condition before start planning) was not completed successfully by both participants.
The other task was completed successfully by both participants in participating in the task
evaluation in the management interface of DVMS. Furthermore, in the tasks evaluation process
of operation interface, task 3 (Select the most top task & review the SOP) and task 8 (Showing
the SOP in another frame) was finished effectively by 4 out of 6 members with the errand
fruition rates (66.7). Undertaking culmination rates are itemized in Table 6.1 and Table 6.2.
Table 6.1: Task completion rates of DVMS management
interface second evaluation study
Tasks Participants P1 P2
T1 - -
T2 √ √
T3 √ √
T4 √ √
T5 √ √
T6 √ √
T7 √ √
T8 √ √
T9 √ √
T10 √ √
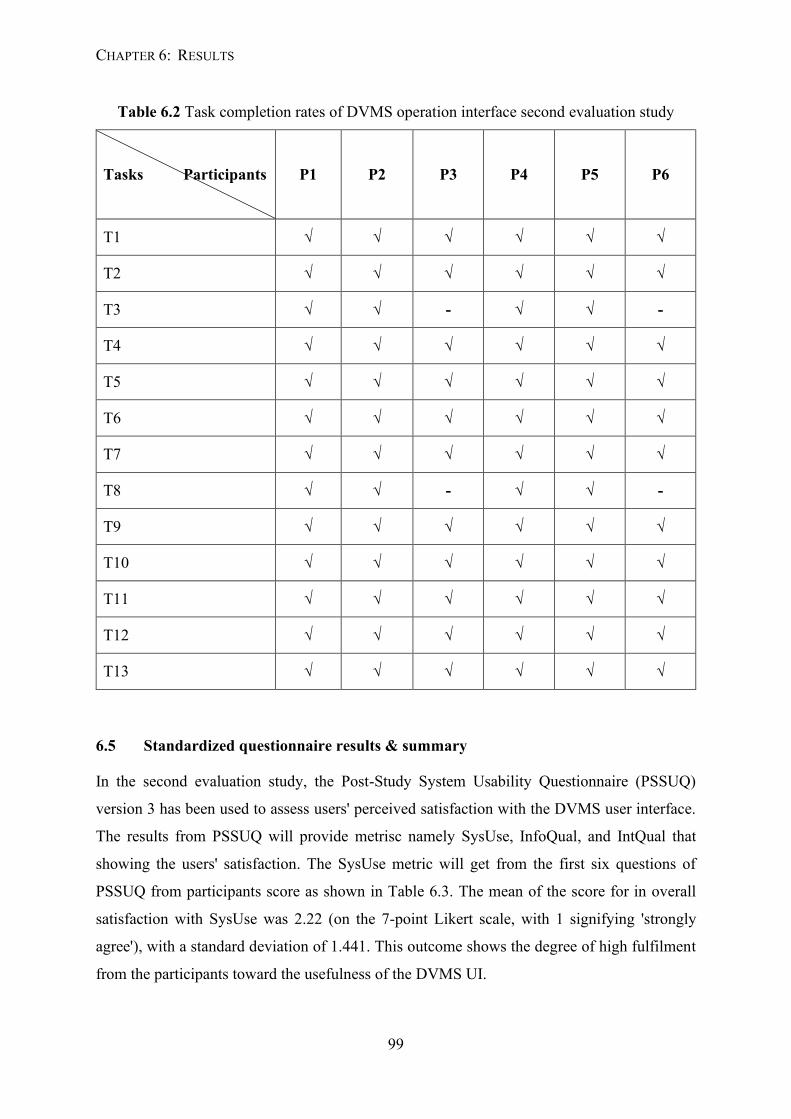
CHAPTER 6: RESULTS
99
Table 6.2 Task completion rates of DVMS operation interface second evaluation study
Tasks Participants P1 P2 P3 P4 P5 P6
T1 √ √ √ √ √ √
T2 √ √ √ √ √ √
T3 √ √ - √ √ -
T4 √ √ √ √ √ √
T5 √ √ √ √ √ √
T6 √ √ √ √ √ √
T7 √ √ √ √ √ √
T8 √ √ - √ √ -
T9 √ √ √ √ √ √
T10 √ √ √ √ √ √
T11 √ √ √ √ √ √
T12 √ √ √ √ √ √
T13 √ √ √ √ √ √
6.5 Standardized questionnaire results & summary
In the second evaluation study, the Post-Study System Usability Questionnaire (PSSUQ)
version 3 has been used to assess users' perceived satisfaction with the DVMS user interface.
The results from PSSUQ will provide metrisc namely SysUse, InfoQual, and IntQual that
showing the users' satisfaction. The SysUse metric will get from the first six questions of
PSSUQ from participants score as shown in Table 6.3. The mean of the score for in overall
satisfaction with SysUse was 2.22 (on the 7-point Likert scale, with 1 signifying 'strongly
agree'), with a standard deviation of 1.441. This outcome shows the degree of high fulfilment
from the participants toward the usefulness of the DVMS UI.
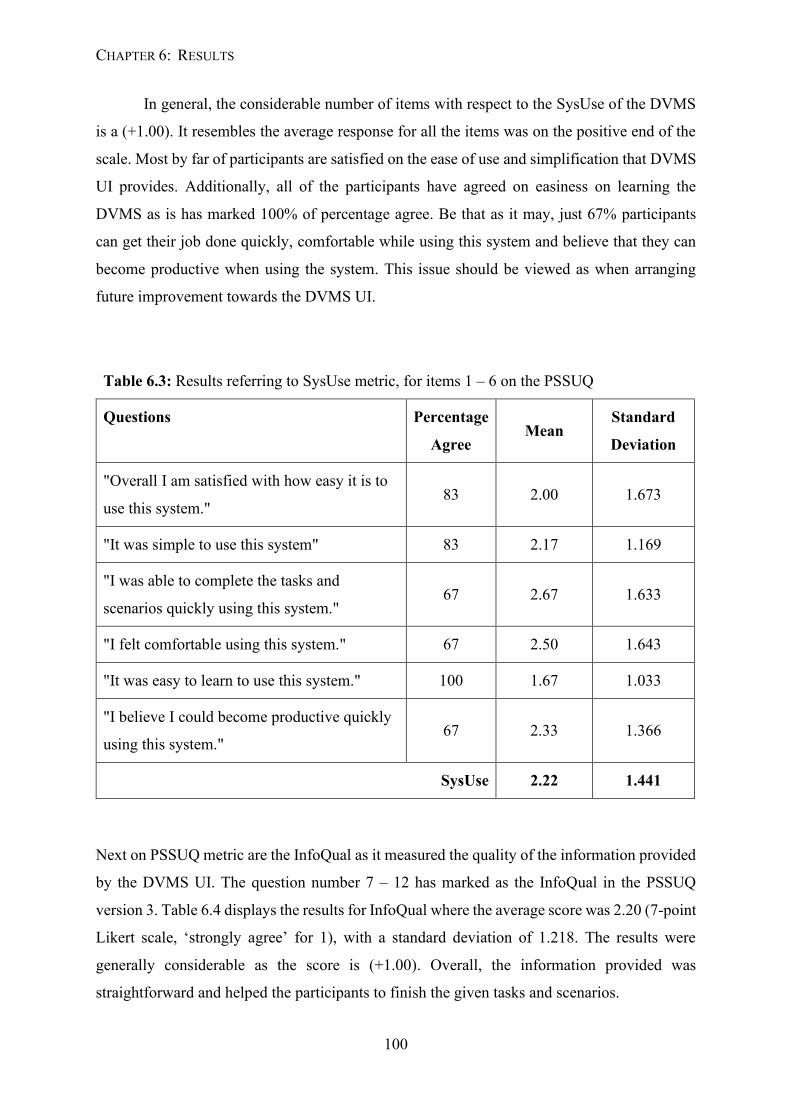
CHAPTER 6: RESULTS
100
In general, the considerable number of items with respect to the SysUse of the DVMS
is a (+1.00). It resembles the average response for all the items was on the positive end of the
scale. Most by far of participants are satisfied on the ease of use and simplification that DVMS
UI provides. Additionally, all of the participants have agreed on easiness on learning the
DVMS as is has marked 100% of percentage agree. Be that as it may, just 67% participants
can get their job done quickly, comfortable while using this system and believe that they can
become productive when using the system. This issue should be viewed as when arranging
future improvement towards the DVMS UI.
Table 6.3: Results referring to SysUse metric, for items 1 – 6 on the PSSUQ
Questions Percentage
Agree Mean
Standard
Deviation
"Overall I am satisfied with how easy it is to
use this system." 83 2.00 1.673
"It was simple to use this system" 83 2.17 1.169
"I was able to complete the tasks and
scenarios quickly using this system." 67 2.67 1.633
"I felt comfortable using this system." 67 2.50 1.643
"It was easy to learn to use this system." 100 1.67 1.033
"I believe I could become productive quickly
using this system." 67 2.33 1.366
SysUse 2.22 1.441
Next on PSSUQ metric are the InfoQual as it measured the quality of the information provided
by the DVMS UI. The question number 7 – 12 has marked as the InfoQual in the PSSUQ
version 3. Table 6.4 displays the results for InfoQual where the average score was 2.20 (7-point
Likert scale, ‘strongly agree’ for 1), with a standard deviation of 1.218. The results were
generally considerable as the score is (+1.00). Overall, the information provided was
straightforward and helped the participants to finish the given tasks and scenarios.
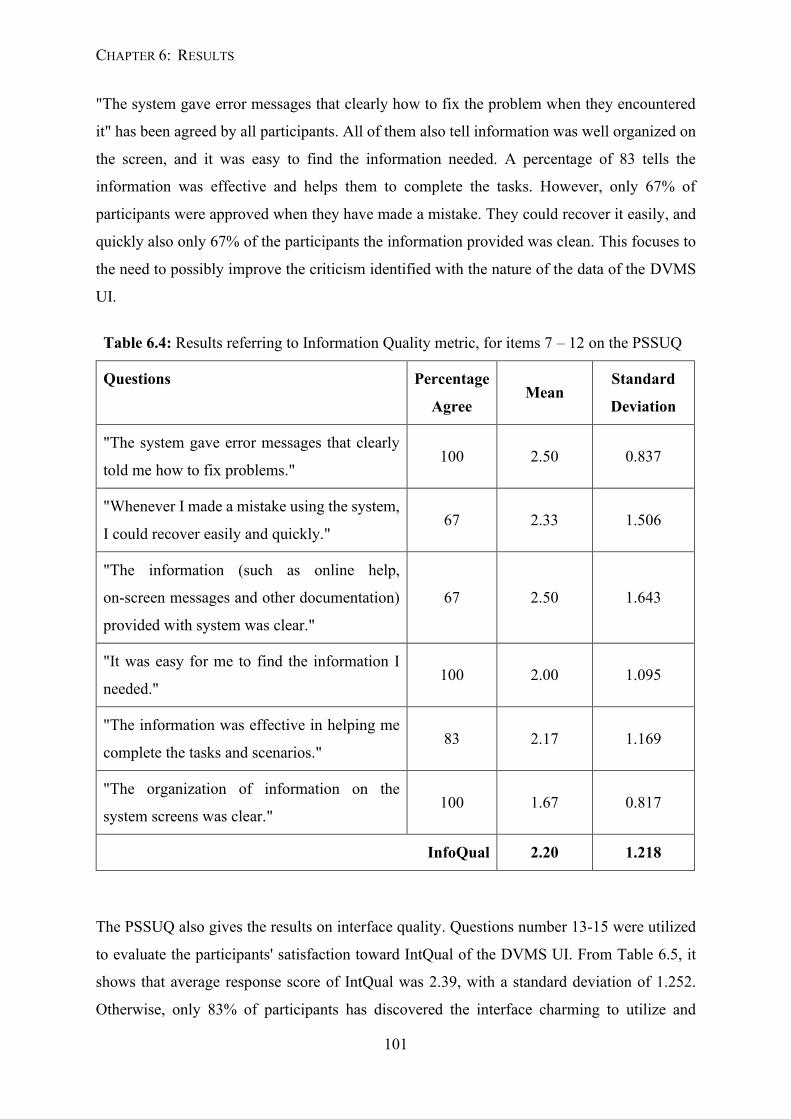
CHAPTER 6: RESULTS
101
"The system gave error messages that clearly how to fix the problem when they encountered
it" has been agreed by all participants. All of them also tell information was well organized on
the screen, and it was easy to find the information needed. A percentage of 83 tells the
information was effective and helps them to complete the tasks. However, only 67% of
participants were approved when they have made a mistake. They could recover it easily, and
quickly also only 67% of the participants the information provided was clean. This focuses to
the need to possibly improve the criticism identified with the nature of the data of the DVMS
UI.
Table 6.4: Results referring to Information Quality metric, for items 7 – 12 on the PSSUQ
Questions Percentage
Agree Mean
Standard
Deviation
"The system gave error messages that clearly
told me how to fix problems." 100 2.50 0.837
"Whenever I made a mistake using the system,
I could recover easily and quickly." 67 2.33 1.506
"The information (such as online help,
on-screen messages and other documentation)
provided with system was clear."
67 2.50 1.643
"It was easy for me to find the information I
needed." 100 2.00 1.095
"The information was effective in helping me
complete the tasks and scenarios." 83 2.17 1.169
"The organization of information on the
system screens was clear." 100 1.67 0.817
InfoQual 2.20 1.218
The PSSUQ also gives the results on interface quality. Questions number 13-15 were utilized
to evaluate the participants' satisfaction toward IntQual of the DVMS UI. From Table 6.5, it
shows that average response score of IntQual was 2.39, with a standard deviation of 1.252.
Otherwise, only 83% of participants has discovered the interface charming to utilize and
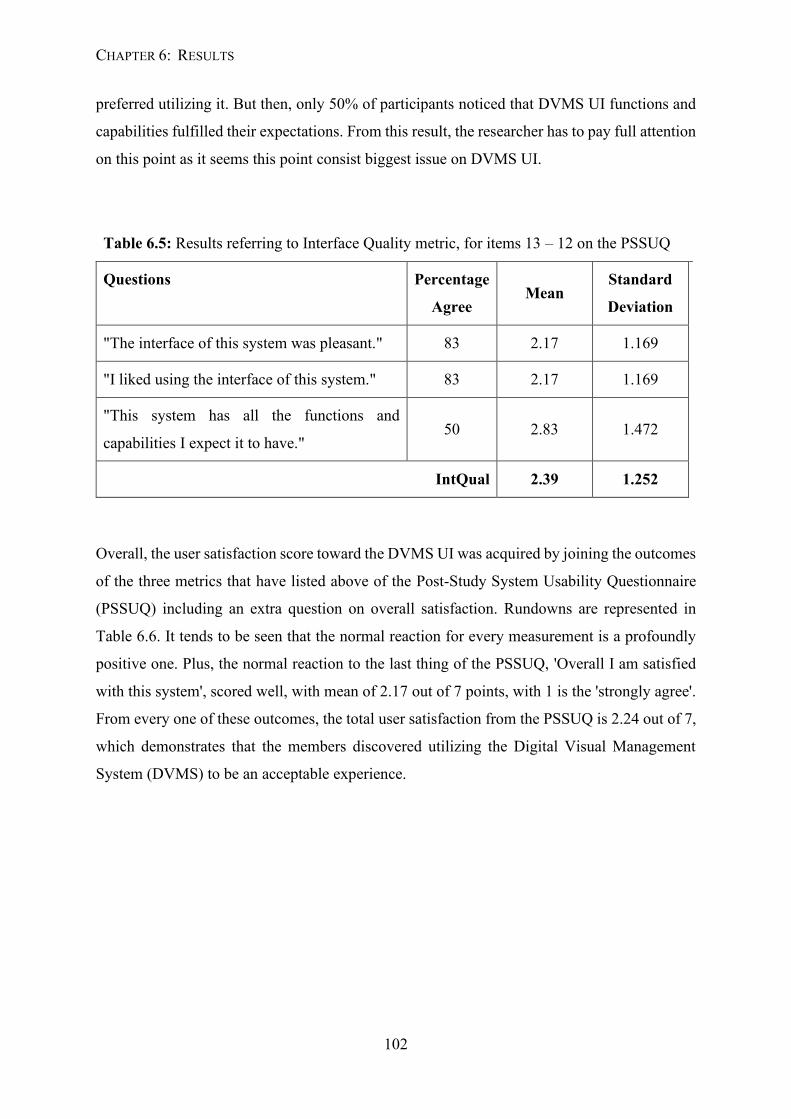
CHAPTER 6: RESULTS
102
preferred utilizing it. But then, only 50% of participants noticed that DVMS UI functions and
capabilities fulfilled their expectations. From this result, the researcher has to pay full attention
on this point as it seems this point consist biggest issue on DVMS UI.
Table 6.5: Results referring to Interface Quality metric, for items 13 – 12 on the PSSUQ
Questions Percentage
Agree Mean
Standard
Deviation
"The interface of this system was pleasant." 83 2.17 1.169
"I liked using the interface of this system." 83 2.17 1.169
"This system has all the functions and
capabilities I expect it to have." 50 2.83 1.472
IntQual 2.39 1.252
Overall, the user satisfaction score toward the DVMS UI was acquired by joining the outcomes
of the three metrics that have listed above of the Post-Study System Usability Questionnaire
(PSSUQ) including an extra question on overall satisfaction. Rundowns are represented in
Table 6.6. It tends to be seen that the normal reaction for every measurement is a profoundly
positive one. Plus, the normal reaction to the last thing of the PSSUQ, 'Overall I am satisfied
with this system', scored well, with mean of 2.17 out of 7 points, with 1 is the 'strongly agree'.
From every one of these outcomes, the total user satisfaction from the PSSUQ is 2.24 out of 7,
which demonstrates that the members discovered utilizing the Digital Visual Management
System (DVMS) to be an acceptable experience.
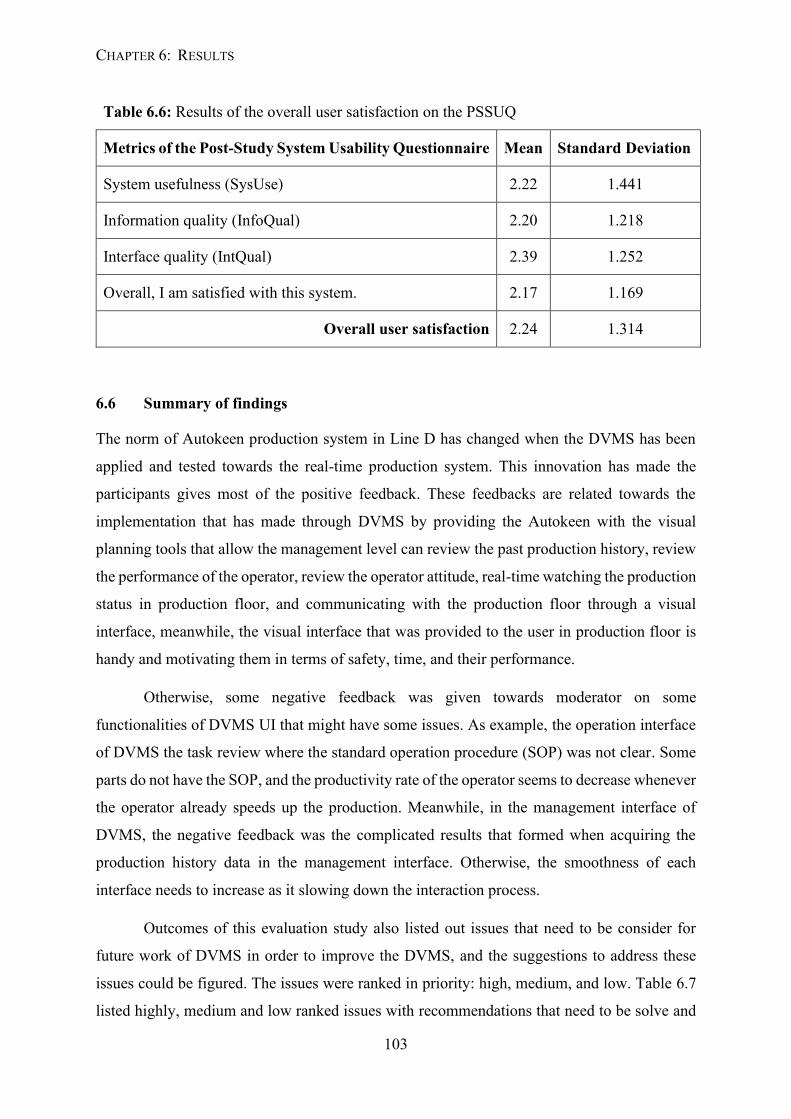
CHAPTER 6: RESULTS
103
Table 6.6: Results of the overall user satisfaction on the PSSUQ
Metrics of the Post-Study System Usability Questionnaire Mean Standard Deviation
System usefulness (SysUse) 2.22 1.441
Information quality (InfoQual) 2.20 1.218
Interface quality (IntQual) 2.39 1.252
Overall, I am satisfied with this system. 2.17 1.169
Overall user satisfaction 2.24 1.314
6.6 Summary of findings
The norm of Autokeen production system in Line D has changed when the DVMS has been
applied and tested towards the real-time production system. This innovation has made the
participants gives most of the positive feedback. These feedbacks are related towards the
implementation that has made through DVMS by providing the Autokeen with the visual
planning tools that allow the management level can review the past production history, review
the performance of the operator, review the operator attitude, real-time watching the production
status in production floor, and communicating with the production floor through a visual
interface, meanwhile, the visual interface that was provided to the user in production floor is
handy and motivating them in terms of safety, time, and their performance.
Otherwise, some negative feedback was given towards moderator on some
functionalities of DVMS UI that might have some issues. As example, the operation interface
of DVMS the task review where the standard operation procedure (SOP) was not clear. Some
parts do not have the SOP, and the productivity rate of the operator seems to decrease whenever
the operator already speeds up the production. Meanwhile, in the management interface of
DVMS, the negative feedback was the complicated results that formed when acquiring the
production history data in the management interface. Otherwise, the smoothness of each
interface needs to increase as it slowing down the interaction process.
Outcomes of this evaluation study also listed out issues that need to be consider for
future work of DVMS in order to improve the DVMS, and the suggestions to address these
issues could be figured. The issues were ranked in priority: high, medium, and low. Table 6.7
listed highly, medium and low ranked issues with recommendations that need to be solve and
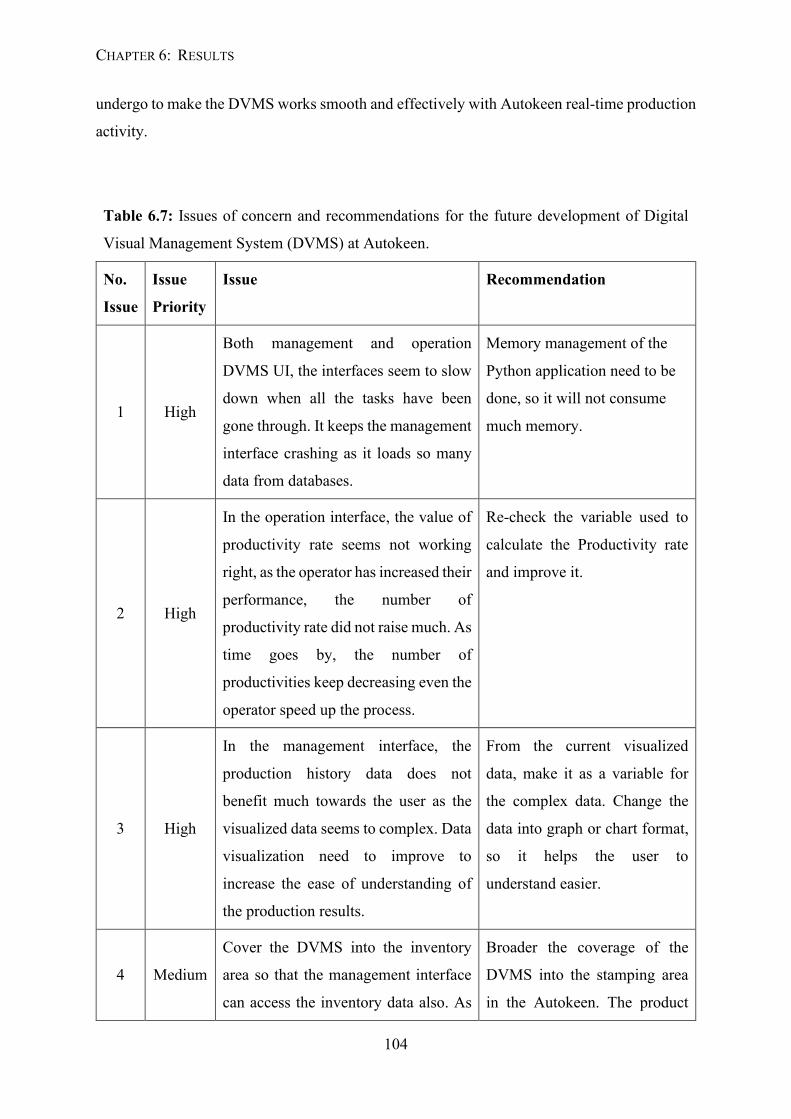
CHAPTER 6: RESULTS
104
undergo to make the DVMS works smooth and effectively with Autokeen real-time production
activity.
Table 6.7: Issues of concern and recommendations for the future development of Digital
Visual Management System (DVMS) at Autokeen.
No.
Issue
Issue
Priority
Issue Recommendation
1 High
Both management and operation
DVMS UI, the interfaces seem to slow
down when all the tasks have been
gone through. It keeps the management
interface crashing as it loads so many
data from databases.
Memory management of the
Python application need to be
done, so it will not consume
much memory.
2 High
In the operation interface, the value of
productivity rate seems not working
right, as the operator has increased their
performance, the number of
productivity rate did not raise much. As
time goes by, the number of
productivities keep decreasing even the
operator speed up the process.
Re-check the variable used to
calculate the Productivity rate
and improve it.
3 High
In the management interface, the
production history data does not
benefit much towards the user as the
visualized data seems to complex. Data
visualization need to improve to
increase the ease of understanding of
the production results.
From the current visualized
data, make it as a variable for
the complex data. Change the
data into graph or chart format,
so it helps the user to
understand easier.
4 Medium
Cover the DVMS into the inventory
area so that the management interface
can access the inventory data also. As
Broader the coverage of the
DVMS into the stamping area
in the Autokeen. The product
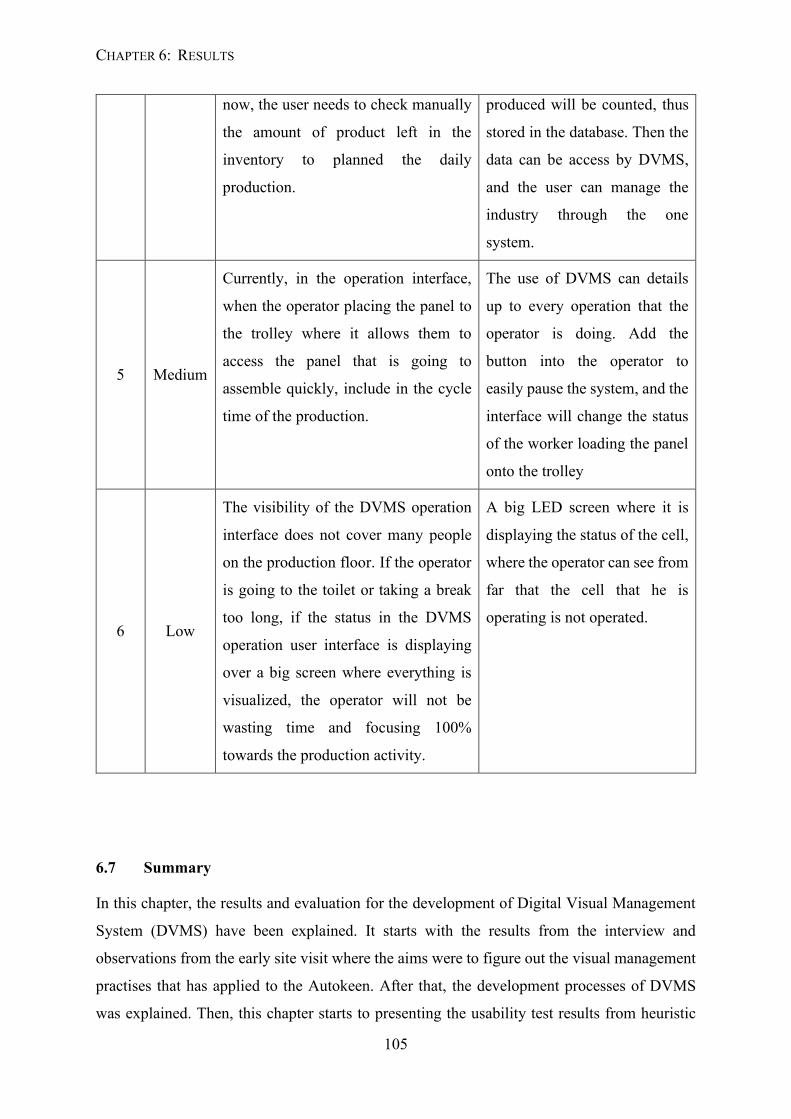
CHAPTER 6: RESULTS
105
now, the user needs to check manually
the amount of product left in the
inventory to planned the daily
production.
produced will be counted, thus
stored in the database. Then the
data can be access by DVMS,
and the user can manage the
industry through the one
system.
5 Medium
Currently, in the operation interface,
when the operator placing the panel to
the trolley where it allows them to
access the panel that is going to
assemble quickly, include in the cycle
time of the production.
The use of DVMS can details
up to every operation that the
operator is doing. Add the
button into the operator to
easily pause the system, and the
interface will change the status
of the worker loading the panel
onto the trolley
6 Low
The visibility of the DVMS operation
interface does not cover many people
on the production floor. If the operator
is going to the toilet or taking a break
too long, if the status in the DVMS
operation user interface is displaying
over a big screen where everything is
visualized, the operator will not be
wasting time and focusing 100%
towards the production activity.
A big LED screen where it is
displaying the status of the cell,
where the operator can see from
far that the cell that he is
operating is not operated.
6.7 Summary
In this chapter, the results and evaluation for the development of Digital Visual Management
System (DVMS) have been explained. It starts with the results from the interview and
observations from the early site visit where the aims were to figure out the visual management
practises that has applied to the Autokeen. After that, the development processes of DVMS
was explained. Then, this chapter starts to presenting the usability test results from heuristic
CHAPTER 6: RESULTS
106
evaluations, user-based testing method where different scenarios have been set up and the
structured usability questionnaire (PSSUQ) data. Finally, the summary of findings was
elaborating the results from this VM implementations, and some issues were figured out with
different priority. The future improvements will be explained later in chapter 7.
107
CHAPTER 7
Conclusion and Future Works
This thesis focused on improving visualization tools that will open the eyes of Autokeen
employees on how important the visual management (VM) application is towards managing
the production activity. Before the visual enforcement towards Autokeen has happened, the
employees seem not seriously considering how important the VM tools are around them. They
just thought it just works as a little guidance towards the employee and does not seem will
affecting the production activity of Autokeen. To answer the first research question, Autokeen
employee has not used much the visualization device around them. They were operating the
production by following the previous norm of working style. With the early DVMS
implementation, the employee seems stressed when using the system. But whenever they get
used to the DVMS, they seem found the system interested and enjoying using the system. They
can monitor their working activities through a digital device that they found attractive.
In addressing the second research question, the researcher has constructed a study plan
with following the evaluation process that focuses mainly on developing an interactive Digital
Visual Management System (DVMS). The study plan helps the researcher identify the best
visual elements that Autokeen employee use the most instantaneously, as this will allow more
interaction towards the DVMS. Otherwise, in the study plan, the researcher has planned an
iterative study where the UCD approach has become one method in developing the DVMS. A
multi development phase has helped the researcher identified the best visualization aspects
towards Autokeen as it highest engagement of users towards the development. So the
visualization aspects have been identified as the data according to the production operation
CHAPTER 7: CONCLUSION AND FUTURE WORKS
108
performance according to specific information (location, time, operator). It also helps the
Autokeen to have a daily production planning wherein the management interface. It allows the
management team to schedule the tasks towards specific information (location, time, operator,
shift) with the option can edit later, which was very useful to Autokeen. Otherwise, DVMS
also helps Autokeen control the production performance by strengthening the safety element
in the system. Keeping the operator up-to-date with their performance as it used three different
elements to attract the operator (digital screen, sound system, LED light).
With the new Industry 4.0, the features promoted, such as smart sensors, smart
networks, etc. have helped develop DVMS. The operation interface has been processed over
the small device name Raspberry Pi that is used to process the visualization UI in the production
cell. It tends to visualize the production activity, visually managing the daily production
activity and visually controlling the operator's production activity in Autokeen Sdn. Bhd. It
helped track down the production status and allowed the management to monitor the activity
remotely over the network's linkage. This method was ordered to match the third research
question. The employees need to interact with the digitalized VM tools. This improvement has
improved the transparencies at the production of Autokeen. This is because the user interface
(UI) for operator shows the indicator on their current production rate; meanwhile, the UI for
management shows the working cell's real-time situation. Suppose the operator was taking a
break too long. In that case, the manager directly could see it through the DVMS UI for
management as these two UI always interacted and displayed the real-time Autokeen
production floor situation.
In order to make the system easy to use. The UCD processes have been done from early
of designing the DVMS. The iterative study was then followed to match the DVMS with
Autokeen surrounding. Various tasks in different scenarios related to the Autokeen production
activities have been created to help Autokeen employees identified their normal process over
the system. In the same time, the evaluation process including the usability test was handle to
check the user satisfaction over the DVMS. With this, the final research questioned can be
answered, and the objective of this research has been achieved. The Digital Visual Management
System has been designed and thrive.
CHAPTER 7: CONCLUSION AND FUTURE WORKS
109
7.1 Summary of contributions to Visual Management (VM) in Autokeen
This research mainly was developing the DVMS for Autokeen that is one of the automotive
stamping industries. The area for this research to be done is a production environment that has
a very lack of digital approach, and the production processes were scattered. It means the flow
of the products has not well constructed. The production processes were mainly done
conventionally. The operator was given a pile of the stamped panel and an empty pallet filled
with a specific amount of assembled panel. From this, the researcher was given user
requirements for developing the DVMS to helps the production activity more aggressive. The
intention of Autokeen in developing the DVMS was to motivate their operator regarding the
production activities. They want their operator to keep the productivity on-track. Otherwise,
production planning also could be improved with the development of the DVMS.
In developing effective DVMS, the researcher has conducted an iterative study where
it allows the user to judge the design for every phase. This iterative study contains three
different phases named initial phase, prototyping phase, and implementing phase. Two
different methods have been conducted over the iterative study. At the beginning of the study,
the UCD cycle was actively done towards the first two phases. The DVMS development used
the UCD technique to actively involve the users in the developing process, while the researcher
was getting feedback on the designed DVMS. With the UCD approach, the stakeholders and
users was allowed to judge the design to make the developed system user-friendly. Otherwise,
this method also helped the researcher gain a conventional visualization system and analyzed
it with the literature study.
The UCD cycle has been conducted multiple times to achieve the desired design for the
next evaluation process. The evaluation process included the usability test where user
satisfaction was obtained whenever the evaluation process was conducted. In the evaluation
study, the desired DVMS was running the usability test. The developed DVMS was brought
over the Autokeen, and the DVMS was mounted over the specified production cell in
Autokeen. After that, the DVMS then was tested towards the real-time production situation in
Autokeen. The users were asked to operate the DVMS and the specified usability test were
handled.
These approaches were to make sure the objectives of the study have been fulfilled the
researcher. The interactions of the user towards DVMS was developed from the evaluation
processes. This evaluation study's usability metrics results were acquired from the standard
CHAPTER 7: CONCLUSION AND FUTURE WORKS
110
questionnaire, the PSSUQ version 3 designated of high satisfaction rates. The mean for system
usefulness (SysUse) was 2.22, information quality (InfoQual) was 2.20, and interface quality
(IntQual) was 2.39, where it was using the 7-point Likert scale (where 1 strongly agrees).
Meanwhile, the average score for overall user satisfaction toward the solution varied between
2.24 and 2.80. Based on the PSSUQ version 3 questionnaire, these results show high user
satisfaction and reliable results. Otherwise, from the interview with the users in Autokeen and
stakeholders, they have satisfied with the developed DVMS.
In conclusion, the user demonstrated high satisfaction towards DVMS UI, which
indicates higher usability results. It also indicates that the chosen various methods on
developing and evaluating the DVMS by the UCD cycle and usability testing method were
successful. Also, the various methods delivered comparable outcomes, which recommends that
the instruments perform comparatively. The outcomes additionally show the successful
integration of visual management (VM) tools towards the Internet of Things (IoT) in managing
the production activity. These achievements help Autokeen efficiently manage its production
activity. At the same time, keep motivating their operator in operating the tasks that can also
be applied to other industries that can widen the globalization of industry.
7.2 Future works
In the future, the Digital Visual Management System (DVMS) will be one of the VM tools that
considering all the user needs. It allows managers of organizations to manage their production
activity. Meanwhile, the production activity is being controlled by the system. The employees
controlled by DVMS will feel motivated, and peace of mind has been offered to them. In short,
listed below on some criteria and issues raised from the research findings need to be resolve to
make DVMS successful in the future:
• Memory management of Python Application
• Re-evaluate the variable who control the productivity indicator
• Simplified the visualization of production history data
• Wider the coverage of DVMS (warehouse to quality check)
• Detailed the production timing
• Improve the screen size of DVMS and replicate the screen to cover the whole
production floor
CHAPTER 7: CONCLUSION AND FUTURE WORKS
111
• Allow the remote access of the DVMS for management
The issues were ranked in priority: high, medium, and low. There were three issues with a high
priority, two with medium priority and one with low priority. The high priority issues are the
important issues that need to be resolved for the DVMS to be worked successfully in the real-
time production situation without having a problem. In contrast, the medium issue is the
consideration for the system in redesign or modification to make the production activities more
effective as it will broaden the coverage of DVMS. The issues are not urgent for the low
priority, and they are mainly 'nice to have'. These issues are the recommendation for DVMS to
be working as the real production management system.
112
References
Al-Musawi, M. (2015) DEVELOPMENT AND USER TESTING OF A WELLNESS DATA
VISUALIZATION SOLUTION.
Alasdair Gilchrist (2016) ‘THE INDUSTRIAL INTERNET OF THINGS Industry 4.0: Th e
Industrial Internet of Th ings’, Library of Congress Control Number. doi: 10.1007/978-1-4842-
2047-4.
Autokeen Sdn Bhd (no date). Available at: http://www.autokeen.com.my/ (Accessed: 5 June
2020).
Barbosa, G. et al. (2013) ‘HEIJUNKA SYSTEM TO LEVEL TELESCOPIC FORKLIFT
ACTIVITIES USING TABLETS IN CONSTRUCTION SITE’, (January).
Bastien, J. M. C. (2008) ‘Usability testing : a review of some methodological and technical
aspects of the method’, International Journal of Medical Informatics. Elsevier Ireland Ltd,
79(4), pp. e18–e23. doi: 10.1016/j.ijmedinf.2008.12.004.
Bateman, N., Philp, L. and Warrender, H. (2016) ‘Visual management and shop floor teams –
development, implementation and use’, International Journal of Production Research. doi:
10.1080/00207543.2016.1184349.
Bauer, W., Ganschar, O. and Gerlach, S. (2014) ‘Development of a Method for Visualization
and Evaluation of Production Logistics in a Multi-Variant Production’, Procedia CIRP.
Elsevier B.V., 17, pp. 481–486. doi: 10.1016/j.procir.2014.02.027.
Deloitte (2015) ‘Industry 4.0. Challenges and solutions for the digital transformation and use
of exponential technologies’, Deloitte, pp. 1–30.
Designing an Observation Study (no date). Available at:
https://www.sciencebuddies.org/science-fair-projects/references/observation-study-
experimental-design (Accessed: 6 June 2020).
CHAPTER 7: REFERENCES
113
Devi, K. R., Sen, A. M. and Hemachandran, K. (2012) ‘A working Framework for the User-
Centered Design Approach and a Survey of the available Methods’, 2(4), pp. 1–8.
Fitts, P. M. (1992) ‘The Information Capacity of the Human Motor System in Controlling the
Amplitude of Movement’, 121(3), pp. 262–269.
Ghasemifard, N. et al. (2015) ‘A New View at Usability Test Methods of Interfaces for
HumanComputer Interaction’, 15(1).
Greif, M. and Hamilton, B. (1991) The Visual Factory, The Visual Factory. Productivity Press.
doi: 10.1201/9780203719114.
Hamilton, V. L. E. E. and Sanders, J. (1983) ‘Universals in Judging Wrongdoing : Japanese
and Americans Compared Author ( s ): V . Lee Hamilton , Joseph Sanders , Yoko Hosoi ,
Zensuke Ishimura , Nozomu Published by : American Sociological Association Stable URL :
https://www.jstor.org/stable/2095105 ’, 48(2), pp. 199–211.
Hick, W. E. (2008) ‘On the rate of gain of information, Quarterly Journal of Experimental
Psychology’, (07 Apr 2008), pp. 37–41.
Hori, S. et al. (2009) ‘Collecting plant floor data using agent embedded in controller’, 2009
Iccas-Sice, pp. 1889–1894.
Hu, J. C. X. and Li, H. Q. M. (2018) ‘Production line 3D visualization monitoring system
design based on OpenGL’, Advances in Manufacturing. Shanghai University, 6(1), pp. 126–
135. doi: 10.1007/s40436-018-0217-x.
Innovation Strategy | Product Innovation Strategy | Strategyn (1999). Available at:
https://strategyn.com/innovation-strategy/ (Accessed: 5 June 2020).
ISO 13407:1999(en), Human-centred design processes for interactive systems (1999).
Available at: https://www.iso.org/obp/ui/#iso:std:iso:13407:ed-1:v1:en (Accessed: 5 June
2020).
ISO 9241-11:2018(en), Ergonomics of human-system interaction — Part 11: Usability:
Definitions and concepts (2018). Available at: https://www.iso.org/obp/ui/#iso:std:iso:9241:-
11:ed-2:v1:en (Accessed: 5 June 2020).
Jaca, C. et al. (2014) ‘Do companies with greater deployment of participation systems use
Visual Management more extensively? An exploratory study’, International Journal of
CHAPTER 7: REFERENCES
114
Production Research, 52(6), pp. 1755–1770. doi: 10.1080/00207543.2013.848482.
James P. Womack, Daniel Roos, D. T. J. (1990) ‘The Machine That Changed the World’.
James P. Womack, D. T. J. (1996) ‘Lean Thinking - Banish Waste and Create Wealth in Your
Corporation’.
Kawano, K., Sameshima, S. and Kato, H. (2010) ‘An approach standing on systems concept
for designing information service system architecture in manufacturing industry’, 2010 7th
International Conference on Service Systems and Service Management, Proceedings of
ICSSSM’ 10, (1), pp. 153–156. doi: 10.1109/ICSSSM.2010.5530249.
Kiritsis, D. (2016) Taking the LEAP: The Methods and Tools of the Linked Engineering and
Manufacturing Platform (LEAP), Taking the LEAP: The Methods and Tools of the Linked
Engineering and Manufacturing Platform (LEAP). doi: 10.1016/C2015-0-02474-1.
Koskela, L. (2000) ‘An exploration towards a production theory and its application to
construction An exploration towards a production theory and’.
Lewis, J. R. (2014) ‘Usability : Lessons Learned … and Yet to Be Learned Usability : Lessons
Learned . . . and Yet to Be Learned’, 7318(July 2016). doi: 10.1080/10447318.2014.930311.
Liker, J. K. (2007) ‘The Toyota way: 14 management principles from the world’s greatest
manufacturer’, Action Learning: Research and Practice, 4(1), pp. 109–111. doi:
10.1080/14767330701234002.
Maksimović, M. et al. (2014) ‘Raspberry Pi as Internet of Things hardware : Performances and
Constraints’, Proceedings of 1st International Conference on Electrical, Electronic and
Computing Engineering, p. 6.
Maksimovic, M. and Vujovic, V. (2015) ‘Raspberry Pi as a Sensor Web node for home
automation q’, 44, pp. 153–171. doi: 10.1016/j.compeleceng.2015.01.019.
Mohannad Ibrahim, Abdelghafor Elgamri, Sharief Babiker, A. M. (2015) ‘Internet of Things
based Smart Environmental Monitoring using the Raspberry-Pi Computer’.
Moser, L. and Santos, A. dos (2003) ‘EXPLORING THE ROLE OF VISUAL CONTROLS
ON MOBILE CELL MANUFACTURING : A CASE STUDY’.
Mrugalska, B. and Wyrwicka, M. K. (2017) ‘Towards Lean Production in Industry 4.0’,
Procedia Engineering. doi: 10.1016/j.proeng.2017.03.135.
CHAPTER 7: REFERENCES
115
Murata, K. and Katayama, H. (2016) ‘Performance evaluation of a visual management system
for effective case transfer’, International Journal of Production Research, 54(10). doi:
10.1080/00207543.2015.1125542.
Norman, D. A. (1998) The Design of Everyday Things.
Norman, D. A. (2013) The design of everyday things.
Ohno, T. (1988) Toyota Production System: Beyond Large-Scale Production, Toyota
Production System. doi: 10.4324/9780429273018.
Ooi, K. B. et al. (2018) ‘Cloud computing in manufacturing: The next industrial revolution in
Malaysia?’, Expert Systems with Applications. Elsevier Ltd, 93, pp. 376–394. doi:
10.1016/j.eswa.2017.10.009.
Ortiz, C. A. and Park, M. (2011) Visual controls : applying visual management to the factory.
Available at: http://www.crcpress.com/product/isbn/9781439820902.
Parry, G. C. and Turner, C. E. (2006) ‘Application of lean visual process management tools’,
Production Planning and Control, 17(1), pp. 77–86. doi: 10.1080/09537280500414991.
Powell, J. A. (2002) ‘AN EXPLORATORY STUDY ON THE APPLICABILITY OF’, 3(1),
pp. 35–54.
Ragnarsson, F. et al. (2017) ‘Storing and visualizing data using the Raspberry Pi’.
Sauro, J. and Lewis, J. R. (2012) Chapter 8 - Standardized Usability Questionnaires,
Quantifying the User Experience. Jeff Sauro and James R. Lewis. doi: 10.1016/B978-0-12-
384968-7.00008-4.
Segura, Á. et al. (2018) ‘Computers & Industrial Engineering Visual computing technologies
to support the Operator 4.0’, Computers & Industrial Engineering. Elsevier, (xxxx), pp. 1–8.
doi: 10.1016/j.cie.2018.11.060.
Snatkin, A. et al. (2015) ‘Production monitoring system development and modification’, pp.
567–580. doi: 10.3176/proc.2015.4S.04.
Steenkamp, L. P., Hagedorn-Hansen, D. and Oosthuizen, G. A. (2017) ‘Visual Management
System to Manage Manufacturing Resources’, Procedia Manufacturing. doi:
10.1016/j.promfg.2017.02.058.
Syed, Z. (2014) ‘Visual Management’. Available at:
CHAPTER 7: REFERENCES
116
http://pt.slideshare.net/zeeshan_agri/visual-management-5s-in-lean-tps-workshop-
slides%5Cn.
Tezel, A. and Aziz, Z. (2017) ‘From conventional to it based visual management: A conceptual
discussion for lean construction’, Journal of Information Technology in Construction,
22(October), pp. 220–246.
Tezel, B. A., Koskela, L. J. and Tzortzopoulos, P. (2009) ‘The functions of visual
management’, International Research Symposium, pp. 201–219. Available at:
http://usir.salford.ac.uk/10883/.
Tjell, J. and Bosch-sijtsema, P. M. (2015) ‘Visual management in mid-sized construction
design projects’, Procedia Economics and Finance. Elsevier B.V., 21(2014), pp. 193–200. doi:
10.1016/S2212-5671(15)00167-7.
Wilson, L. (2009) How To Implement Lean Manufacturing.
Wright, P., Mosser-Wooley, D. and Wooley, B. (1997) ‘Techniques & tools for using color in
computer interface design’, Crossroads, 3(3), pp. 3–6. doi: 10.1145/270974.270976.
Yuasa, M., Saito, K. and Mukawa, N. (2011) ‘Brain activity when reading sentences and
emoticons: An fMRI study of verbal and nonverbal communication’, Electronics and
Communications in Japan, 94(5), pp. 17–24. doi: 10.1002/ecj.10311.