Embed Size (px)
Citation preview

HAL Id: lirmm-01494957https://hal-lirmm.ccsd.cnrs.fr/lirmm-01494957
Submitted on 24 Mar 2017
HAL is a multi-disciplinary open accessarchive for the deposit and dissemination of sci-entific research documents, whether they are pub-lished or not. The documents may come fromteaching and research institutions in France orabroad, or from public or private research centers.
L’archive ouverte pluridisciplinaire HAL, estdestinée au dépôt et à la diffusion de documentsscientifiques de niveau recherche, publiés ou non,émanant des établissements d’enseignement et derecherche français ou étrangers, des laboratoirespublics ou privés.
Digitized 3D mesh segmentation based on curvatureanalysis
Silvère Gauthier, William Puech, Roseline Bénière, Gérard Subsol
To cite this version:Silvère Gauthier, William Puech, Roseline Bénière, Gérard Subsol. Digitized 3D mesh segmentationbased on curvature analysis. Electronic Imaging, Jan 2017, Burlingame, United States. pp.33-38,�10.2352/ISSN.2470-1173.2017.20.3DIPM-005�. �lirmm-01494957�

Digitized 3D mesh segmentation based on curvature analysisS. Gauthier1,2,∗, W. Puech1, R. Beniere2, G. Subsol1
1 LIRMM Laboratory, UMR 5506, CNRS, University of Montpellier, Montpellier, France2 C4W, Montpellier, France∗[email protected]
AbstractToday, it is increasingly frequent and easy to digitize the sur-
face of real 3D objects. However, the obtained meshes are ofteninaccurate and noisy. In this paper, we present a method to seg-ment a digitized 3D surface from a real object by analyzing itscurvature. Experimental results - applied on real digitized 3Dmeshes - show the efficiency of our proposed analysis, particu-larly in a reverse engineering process.
IntroductionThe availability of 3D scanners has increased the fast devel-
opment of applications in Computed-Aided Design (CAD), re-verse engineering, medical research and inspection. Many 3Dprocesses need to segment an object as a preprocess. In the pro-duction line of manufactured objects, steps can be distributed tomany partners, and some data can be missing at the end of theline. In reverse engineering, we try to reconstruct the continuousgeometry of an object from a 3D mesh, which is discrete. Thiscan lead to quality control or object modification issues for exam-ple. In fact, the mesh can be a discretization of a CAD object ora digitized one. To reconstruct the initial geometry, we must takeinto account the shape of the objects as they are related. But anobject shape can be very complex, and the measured data is oftennoisy. So, we need robust 3D descriptors to accurately define theobjects shape.
In previous works, geometry descriptors like curvatures[5, 8] allow us to deal with the 3D mesh shape. But curvaturesare locally computed, while it is often necessary to characterizethe shape globally. To do this, we can construct curvature distri-butions [4, 10] and analyze them.
In this paper, we propose a method based on the analysis ofa digitized 3D mesh curvature histogram. We use the curvatureapproximation from Beniere et al. [2] who incorporates two othermethods [5, 8]. Then, a distribution is constructed continuouslyby a kernel estimation from all of the curvature values. Finally, anaccurate curvature distribution analysis is realized. In the distri-bution, we propose to search for peaks and valleys, and automat-ically compute segmentation thresholds. Indeed, curvature distri-bution approximately describes the object shape, so these thresh-olds allow us to extract points belonging to object edges. In theproposed approach, we use the curvature histogram to segmentdigitized 3D meshes.This paper is organized as follow. We first present previous worksin this topic. Then, we expose in detail our proposed method of3D mesh segmentation. After, we apply it on digitized 3D sur-faces of real objects and show that our curvature analysis hugelyimproves the obtained results, particularly in reverse engineering.
Finally, we conclude and propose directions for future research.
Previous worksIn this section, we first present previous research in 3D mesh
segmentation. Next, we introduce curvature and previous workson 3D curvatures. Then, we develop previous research in distri-butions.
SegmentationA segmentation is the partitioning of a digital image, a 3D
mesh or a 3D point cloud in several regions, as illustrated in Fig. 1.
Figure 1. Example of a segmentation: a) A 3D point cloud, b) Segmentation
of the point cloud [12].
Many different 3D mesh segmentation algorithms have beenproposed in the literature [12, 13, 14], but each segmentation givesmore or less good results depending on the chosen application.Most of the time, a segmentation brings together points with sim-ilar criteria. For example, the segmentation can be based on awaterfall, hierarchical clustering, iterative merging or remeshing.In our case, the best results are reached using curvatures, becausein reverse engineering, features are extracted from curvature anal-ysis. Some methods use curvatures to segment by discontinuities[3, 4] or clustering [7], but are often not robust enough around ob-ject edges or are designed for CAD meshes [9, 1]. Indeed, curva-tures are often wrong around object edges because adjacent pointscan run over many different features. Moreover, we are searchingfor a fully automatic method, so we cannot use parameters like acluster number or ask for user help.
CurvaturesIntuitively, curvature quantifies the deviation between a
curve and a straight line, or between a surface and a plane in 3D.The curvature of a 2D curve at a point P equals the inverse of theosculating circle radius r at P. The osculating circle is the circulararc which best approximates the curve around P (Fig. 2.a).
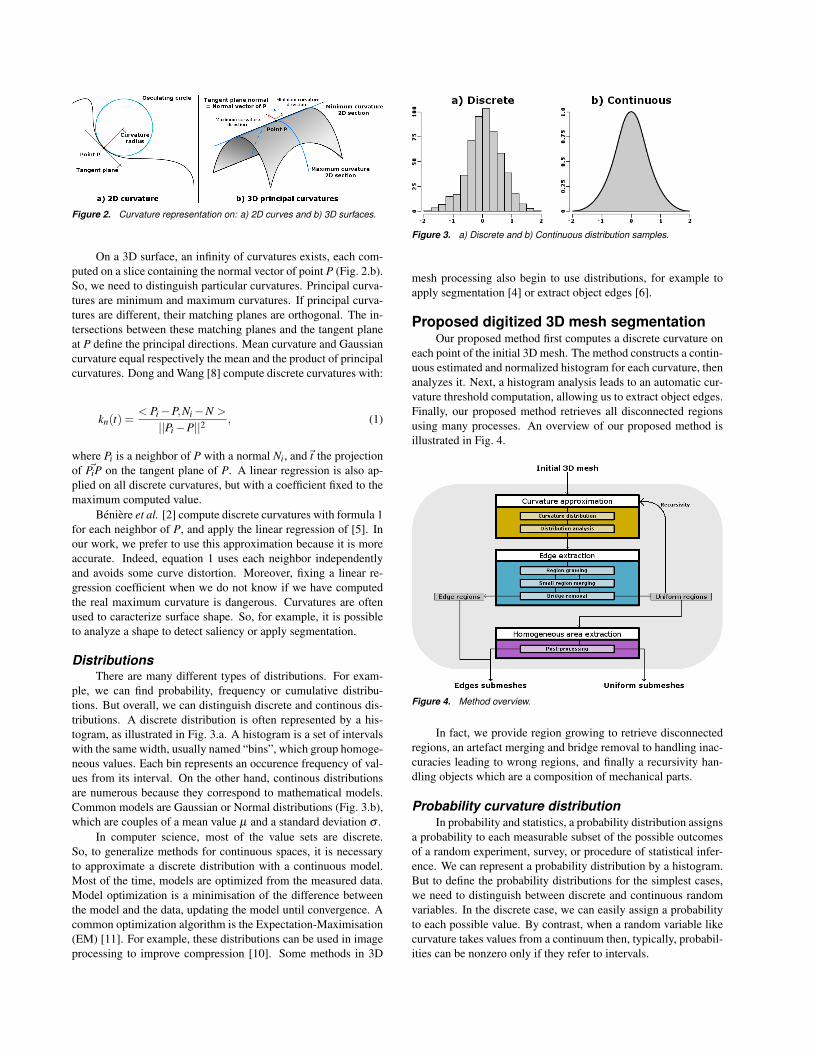
Figure 2. Curvature representation on: a) 2D curves and b) 3D surfaces.
On a 3D surface, an infinity of curvatures exists, each com-puted on a slice containing the normal vector of point P (Fig. 2.b).So, we need to distinguish particular curvatures. Principal curva-tures are minimum and maximum curvatures. If principal curva-tures are different, their matching planes are orthogonal. The in-tersections between these matching planes and the tangent planeat P define the principal directions. Mean curvature and Gaussiancurvature equal respectively the mean and the product of principalcurvatures. Dong and Wang [8] compute discrete curvatures with:
kn(t) =< Pi−P,Ni−N >
||Pi−P||2, (1)
where Pi is a neighbor of P with a normal Ni, and~t the projectionof ~PiP on the tangent plane of P. A linear regression is also ap-plied on all discrete curvatures, but with a coefficient fixed to themaximum computed value.
Beniere et al. [2] compute discrete curvatures with formula 1for each neighbor of P, and apply the linear regression of [5]. Inour work, we prefer to use this approximation because it is moreaccurate. Indeed, equation 1 uses each neighbor independentlyand avoids some curve distortion. Moreover, fixing a linear re-gression coefficient when we do not know if we have computedthe real maximum curvature is dangerous. Curvatures are oftenused to caracterize surface shape. So, for example, it is possibleto analyze a shape to detect saliency or apply segmentation.
DistributionsThere are many different types of distributions. For exam-
ple, we can find probability, frequency or cumulative distribu-tions. But overall, we can distinguish discrete and continous dis-tributions. A discrete distribution is often represented by a his-togram, as illustrated in Fig. 3.a. A histogram is a set of intervalswith the same width, usually named “bins”, which group homoge-neous values. Each bin represents an occurence frequency of val-ues from its interval. On the other hand, continous distributionsare numerous because they correspond to mathematical models.Common models are Gaussian or Normal distributions (Fig. 3.b),which are couples of a mean value µ and a standard deviation σ .
In computer science, most of the value sets are discrete.So, to generalize methods for continuous spaces, it is necessaryto approximate a discrete distribution with a continuous model.Most of the time, models are optimized from the measured data.Model optimization is a minimisation of the difference betweenthe model and the data, updating the model until convergence. Acommon optimization algorithm is the Expectation-Maximisation(EM) [11]. For example, these distributions can be used in imageprocessing to improve compression [10]. Some methods in 3D
Figure 3. a) Discrete and b) Continuous distribution samples.
mesh processing also begin to use distributions, for example toapply segmentation [4] or extract object edges [6].
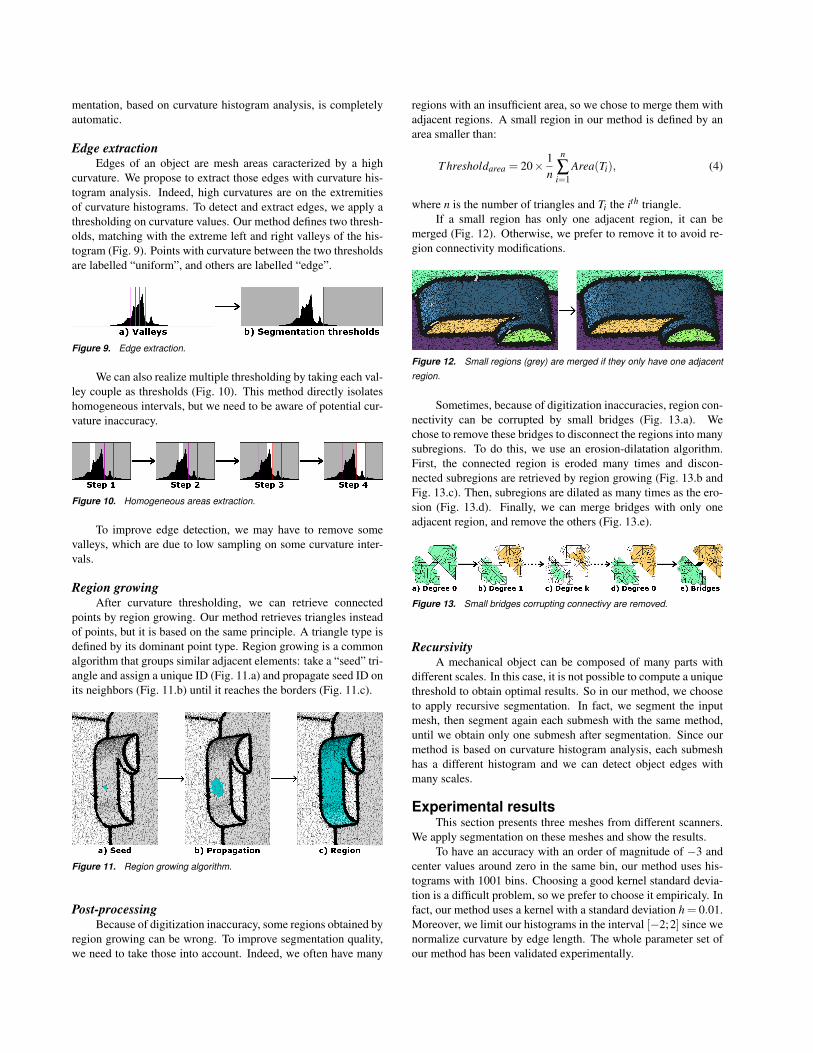
Proposed digitized 3D mesh segmentationOur proposed method first computes a discrete curvature on
each point of the initial 3D mesh. The method constructs a contin-uous estimated and normalized histogram for each curvature, thenanalyzes it. Next, a histogram analysis leads to an automatic cur-vature threshold computation, allowing us to extract object edges.Finally, our proposed method retrieves all disconnected regionsusing many processes. An overview of our proposed method isillustrated in Fig. 4.
Figure 4. Method overview.
In fact, we provide region growing to retrieve disconnectedregions, an artefact merging and bridge removal to handling inac-curacies leading to wrong regions, and finally a recursivity han-dling objects which are a composition of mechanical parts.
Probability curvature distributionIn probability and statistics, a probability distribution assigns
a probability to each measurable subset of the possible outcomesof a random experiment, survey, or procedure of statistical infer-ence. We can represent a probability distribution by a histogram.But to define the probability distributions for the simplest cases,we need to distinguish between discrete and continuous randomvariables. In the discrete case, we can easily assign a probabilityto each possible value. By contrast, when a random variable likecurvature takes values from a continuum then, typically, probabil-ities can be nonzero only if they refer to intervals.

To approximate continuous curvatures on a discrete 3Dmesh, we use the method from Beniere et al. [2]. In our case,meshes can be defined with different scales and can give differentcurvature ranges. So, to construct curvature histograms which canbe compared between many objects, we must normalize curvaturevalues with each mesh. Moreover, curvature values are real, so itis more suitable to estimate a continuous histogram, with kernel-estimation for example.
Normalized curvatureHistograms must have the same range to make a comparison.
To homogenize histogram range, curvature values have to be nor-malized. For example, our method normalizes curvature valuesby multiplying them by the mean edge length of the mesh.
If the object is correctly meshed, we can deduce minimumand maximum possible curvature values, as illustrated Fig. 5. Sowe propose to limit the histogram range according to extreme pos-sible values, since we normalize curvature by edge length.
Figure 5. Minimum and maximum possible for absolute curvature values.
Kernel estimationCurvature values are real, so it is more suitable to compute
a histogram with a continuous estimation. Our method computeshistograms with a kernel-type estimation. We chose a gaussiankernel because digitized meshes with only one feature often givegaussian-type curvature distributions. We compute the histogramwith:
fh(x) =1n
n
∑i=1
Kh(x− xi), (2)
where x is the central value of a bin, fh(x) is the quantity insidethe bin, n is the number of points, xi is the ith point and h is thekernel standard deviation. The gaussian kernel is defined by:
Kh(x− xi) =1
h√
2πe−
12 (
x−xih )2
. (3)
Each bin of the histogram is computed by centering the ker-nel on it. Then, kernel density estimation (KDE) is applied oneach curvature value and added to the bin. So each bin is com-puted with a neighborhood defined by the kernel standard devi-ation. Fig. 6 shows an example of normalized mean curvaturedistribution with a kernel deviation h = 0.01.
This continuous estimation makes histograms less sensibleto noise and bin number. Indeed, high frequency fluctuations arenaturally smoothed by the kernel.
Figure 6. Normalized mean curvature kernel-estimated histogram sample.
Distribution analysisMany caracteristics of a histogram can be useful to many
applications. We can for example search for modal number andpositions (named “peaks” here), pattern, sparsity and statistics.In our method, we essentialy provide robust peaks and valleysdetection, and use those to compute segmentation thresholds.
To detect homogeneous curvature intervals, we need to de-tect peaks and valleys in the histogram, as illustrated in Fig. 7.Here, a peak defines a dominant curvature value and a couple oftwo consecutive valleys defines an homogeneous interval of cur-vature.
We begin by detecting robust peaks (Fig. 7.b). A peak is abin with a higher probability than the two adjacent bins. A robustpeak is a bin with the higher probability in a window. Thus, wecan detect valleys between peaks (Fig. 7.c). For each adjacentpeaks couple, we compute the line passing through the two peaks.Then, a valley is a bin with a higher distance to the line than thetwo adjacent bins. A robust valley is a bin with the higher distancein a window. Our method uses sliding windows of 10 bins for bothpeaks and valleys detection.
Figure 7. Histogram peaks and valleys.
For valleys in the extremities, we proceed differently. Be-cause we have only one adjacent peak, we must define anotherextremity for the line. So we can compute mean Mu and stan-dard deviation Sigma of the first and last interval values (Fig. 8.a),and set the second extremity of the line as the matching bin withMu− 3× Sigma on the left and Mu + 3× Sigma on the right(Fig. 8.b).
Figure 8. Valley computing in the histogram extremities.
SegmentationIn reverse engineering, a segmentation is often needed. In
our case, we work on digitized meshes, with point coordinate in-accuracies and noise. To correctly segment those, we aim to ex-tract object edges matching with intersections between geometricfeatures. We can retrieve disconnected and homogeneous regionsmatching with these features. Finally, we also apply some post-processing and recursivity to improve results. Our proposed seg-
mentation, based on curvature histogram analysis, is completelyautomatic.
Edge extractionEdges of an object are mesh areas caracterized by a high
curvature. We propose to extract those edges with curvature his-togram analysis. Indeed, high curvatures are on the extremitiesof curvature histograms. To detect and extract edges, we apply athresholding on curvature values. Our method defines two thresh-olds, matching with the extreme left and right valleys of the his-togram (Fig. 9). Points with curvature between the two thresholdsare labelled “uniform”, and others are labelled “edge”.
Figure 9. Edge extraction.
We can also realize multiple thresholding by taking each val-ley couple as thresholds (Fig. 10). This method directly isolateshomogeneous intervals, but we need to be aware of potential cur-vature inaccuracy.
Figure 10. Homogeneous areas extraction.
To improve edge detection, we may have to remove somevalleys, which are due to low sampling on some curvature inter-vals.
Region growingAfter curvature thresholding, we can retrieve connected
points by region growing. Our method retrieves triangles insteadof points, but it is based on the same principle. A triangle type isdefined by its dominant point type. Region growing is a commonalgorithm that groups similar adjacent elements: take a “seed” tri-angle and assign a unique ID (Fig. 11.a) and propagate seed ID onits neighbors (Fig. 11.b) until it reaches the borders (Fig. 11.c).
Figure 11. Region growing algorithm.
Post-processingBecause of digitization inaccuracy, some regions obtained by
region growing can be wrong. To improve segmentation quality,we need to take those into account. Indeed, we often have many
regions with an insufficient area, so we chose to merge them withadjacent regions. A small region in our method is defined by anarea smaller than:
T hresholdarea = 20× 1n
n
∑i=1
Area(Ti), (4)
where n is the number of triangles and Ti the ith triangle.If a small region has only one adjacent region, it can be
merged (Fig. 12). Otherwise, we prefer to remove it to avoid re-gion connectivity modifications.
Figure 12. Small regions (grey) are merged if they only have one adjacent
region.
Sometimes, because of digitization inaccuracies, region con-nectivity can be corrupted by small bridges (Fig. 13.a). Wechose to remove these bridges to disconnect the regions into manysubregions. To do this, we use an erosion-dilatation algorithm.First, the connected region is eroded many times and discon-nected subregions are retrieved by region growing (Fig. 13.b andFig. 13.c). Then, subregions are dilated as many times as the ero-sion (Fig. 13.d). Finally, we can merge bridges with only oneadjacent region, and remove the others (Fig. 13.e).
Figure 13. Small bridges corrupting connectivy are removed.
RecursivityA mechanical object can be composed of many parts with
different scales. In this case, it is not possible to compute a uniquethreshold to obtain optimal results. So in our method, we chooseto apply recursive segmentation. In fact, we segment the inputmesh, then segment again each submesh with the same method,until we obtain only one submesh after segmentation. Since ourmethod is based on curvature histogram analysis, each submeshhas a different histogram and we can detect object edges withmany scales.
Experimental resultsThis section presents three meshes from different scanners.
We apply segmentation on these meshes and show the results.To have an accuracy with an order of magnitude of −3 and
center values around zero in the same bin, our method uses his-tograms with 1001 bins. Choosing a good kernel standard devia-tion is a difficult problem, so we prefer to choose it empiricaly. Infact, our method uses a kernel with a standard deviation h = 0.01.Moreover, we limit our histograms in the interval [−2;2] since wenormalize curvature by edge length. The whole parameter set ofour method has been validated experimentally.

Presentation of the used meshesFor experimental results, we used three digitized meshes
from two different structured light scanners. The first two comefrom a first scanner and are illustrated in Fig. 14 and Fig. 15 re-spectively. The third comes from a second scanner and is illus-trated in Fig. 16.
Figure 14. Initial mesh from Scanner 1: Aerospace.
Figure 15. Initial mesh from Scanner 1: Moldy.
Figure 16. Initial mesh from Scanner 2: Outlet.
Segmentation resultThis section presents results of our segmentation using cur-
vature histograms analysis. Each figure shows edge extractionand final set of submeshes. For a reverse engineering application,our results are very good, since most of the features are correctlydisconnected. Indeed, edge extraction is accurate since curvaturethresholds are computed from distribution and so are adaptative.
The sharp edges of Aerospace are properly detected(Fig. 17.a) and the features are correctly disconnected, except fora few tangent ones. We obtain 70 submeshes whose 94.3% matchwith only one feature (Fig. 17.b).
Figure 17. a) Edges extraction and b) Segmentation of Aerospace.
The sharp edges of Moldy are properly detected (Fig. 18.a)and the features are correctly disconnected. We note thatfreeforms are not over-segmented. We obtain 48 submesheswhose 100% match with only one feature (Fig. 18.b).
Figure 18. a) Edges extraction and b) Segmentation of Moldy.
The sharp edges of Outlet are properly detected (Fig. 19.a),except for the serrated cylinders, and the features are almost cor-rectly disconnected. We obtain 72 submeshes whose 100% matchwith only one feature (Fig. 19.b).
Figure 19. a) Edges extraction and b) Segmentation of Outlet.
We have segmented about 30 meshes, with a processorIntel R© Core
TMi7-4710 CPU @ 2.50GHz. Some results are pre-
sented in Table 1.We can see that our segmentation is fast: less than one
minute, except for very large amounts of triangles. Morover, thesetimes also include curvatures and mesh topology computation,which represent a large part of the time.
To validate our approach, we count the number of submeshesthat contain only one feature. We can see in Table 1 that about96% of submeshes match with only one feature (the remaining4% can contain similar tangent features).
Since features are correctly disconnected, obtained resultsare suitable for reverse engineering applications. Indeed, it ismore accurate and easy to extract only one feature, than manyon the same mesh, since we do not encounter curvature neighbor-hood problems or feature intersections.
ConclusionIn this paper, we propose a new digitized 3D mesh segmen-
tation based on curvature anaylsis. Our proposed method is fullyautomatic, which is an advantage for industrial applications likereverse engineering. Our proposed segmentation first constructsa continuous normalized curvature distribution and analyzes it.Then, thresholds are computed from the distribution to extractobject edges. In this way, it is possible to retrieve disconnectedregions corresponding to object features. We also provide somepost-processing like artefact merging, bridge removal and recur-sivity to improve results.
The most important part of our proposed method is the edgeextraction based on curvature distribution analysis. Indeed, finalsubmeshes are more homogeneous, and provide important infor-mation for reverse engineering, like neighborhood of the feature.
In future research, we propose to analyze more precisely ourcurvature distribution construction parameters, like bin number orkernel standard derivation, to improve threshold computing accu-racy. We can also improve post-processing in order to take moreparameters into account. A further objective consists of extendingour segmentation to natural objects.

Table 1: Segmentation performances and associated features.
Mesh Triangles Time Regions One feature regions in %Vase 20 000 <1s 6 6 100Fandisk 23 964 <1s 21 20 95.2Lego 24 748 <1s 35 35 100Lego small 26 371 <1s 10 10 100Cup 55 552 1s 32 32 100Yoke 62 276 1s 8 7 87.5Manique 65 090 1s 40 33 82.5Nespresso 71 012 1s 5 5 100MediumBolt 89 000 2s 11 10 90.9StripedShoe 100 000 1s 16 16 100Connector 195 424 4s 36 33 91.7Outlet 195 853 5s 72 72 100Etui 210 963 5s 3 3 100Shoe 258 994 3s 4 4 100Czslowakei 400 026 8s 162 162 100Part2 414 823 12s 20 20 100Chair 500 000 7s 85 79 92.9Gear 500 000 6s 283 279 98.6Aerospace 799 296 16s 70 66 94.3MasterCylinder 820 793 29s 53 49 92.5Moldy 851 194 13s 48 48 100Watertight 921 216 16s 40 35 87.5OilPump 1 064 031 22s 175 169 96.6Carter 1 067 079 34s 108 106 98.1Pump 1 105 570 21s 518 502 96.9MachinedBlock 1 125 832 33s 113 111 98.2Te 1 297 428 40s 39 36 92.3Splint 2 095 079 1m09s 21 19 90.5Metrologic 2 159 724 1m27s 14 13 92.9ProductPart 3 427 245 2m16s 191 182 95.3
References[1] R. Beniere, G. Subsol, G. Gesquiere, F. Le Breton, and W. Puech.
Recovering Primitives in 3D CAD meshes. SPIE Electronic Imaging2011, 3D Imaging, Interaction and Measurement, 7864:7864 0R–1–9, 2011.
[2] R. Beniere, G. Subsol, G. Gesquiere, F. Le Breton, and W. Puech.A comprehensive process of reverse engineering from 3d meshes tocad models. Computer-Aided Design, 45(11):1382 – 1393, 2013.
[3] P. Benko, R. Martin, and T. Varady. Algorithms for reverse engi-neering boundary representation models. Computer-Aided Design,33(11):839 – 851, 2001.
[4] J. Chen and H. Feng. Automatic prismatic feature segmentation ofscanning-derived meshes utilising mean curvature histograms. Vir-tual and Physical Prototyping, 9(1):45–61, 2014.
[5] X. Chen and F. Schmitt. Intrinsic surface properties from surfacetriangulation, pages 739–743. Springer Berlin Heidelberg, 1992.
[6] K. Demarsin, D. Vanderstraeten, and D. Roose. Meshless extrac-tion of closed feature lines using histogram thresholding. Computer-Aided Design and Applications, 5(5):589–600, 2008.
[7] L. Di Angelo and P. Di Stefano. Geometric segmentation of 3dscanned surfaces. Computer-Aided Design, 62:44–56, 2015.
[8] C. Dong and G. Wang. Curvatures estimation on triangular mesh.
Journal of Zhejiang University Science, 6(1):128–136, 2005.[9] G. Lavoue, F. Dupont, and A. Baskurt. A new cad mesh segmen-
tation method, based on curvature tensor analysis. Computer-AidedDesign, 37:975–987, 2004.
[10] A. Masmoudi, S. Chaoui, and A. Masmoudi. A finite mixture modelof geometric distributions for lossless image compression. Signal,Image and Video Processing, 10:671–678, 2016.
[11] G. Mclachlan and T. Krishnan. The EM Algorithm and Extensions.Wiley-Interscience, 1996.
[12] S. Petitjean. A survey of methods for recovering quadrics in trianglemeshes. ACM Computing Surveys, 2(34):1–61, 2002.
[13] A. Shamir. A survey on mesh segmentation techniques. ComputerGraphics Forum, 27(6):1539–1556, 2008.
[14] P. Theologou, I. Pratikakis, and T. Theoharis. A comprehensiveoverview of methodologies and performance evaluation frameworksin 3d mesh segmentation. Comput. Vis. Image Underst., 135(C):49–82, 2015.