Embed Size (px)
Citation preview

Ref: DIL/BSE/2019-20/F.No.:49
August 8, 2019 Corporate Relations BSE Limited, Phiroze Jeejeebhoy Towers, Dalal Street, Fort, Mumbai – 400 001 Dear Sir, Sub.: Intimation of Investor Presentation for August 2019 Ref: Scrip Code: 506414 Further to our intimation dated August 5, 2019 regarding approval of Unaudited Financial Results (Standalone
and Consolidated) by the Board of Directors for the quarter ended June 30, 2019, we hereby enclose a copy of
Investor Presentation for August 2019.
The said Investor Presentation is also available on Company’s website www.dil.net
Kindly take the same on records. Thanking you, Yours faithfully, for DIL LIMITED Srikant N Sharma Company Secretary CS Membership No: F3617 A-1601, Thane One, DIL Complex, Ghodbunder Road, Majiwade, Thane (W) 400610 Encl: As above
Vitamin D3
APIs
Integrated Biotechnology
Investor Presentation
August 2019

This presentation and the accompanying slides (the “Presentation”), which have been prepared by DIL Limited. (the “Company”), have been prepared solelyfor information purposes and do not constitute any offer, recommendation or invitation to purchase or subscribe for any securities, and shall not form thebasis or be relied on in connection with any contract or binding commitment whatsoever. No offering of securities of the Company will be made except bymeans of a statutory offering document containing detailed information about the Company.
This Presentation has been prepared by the Company based on information and data which the Company considers reliable, but the Company makes norepresentation or warranty, express or implied, whatsoever, and no reliance shall be placed on, the truth, accuracy, completeness, fairness andreasonableness of the contents of this Presentation. This Presentation may not be all inclusive and may not contain all of the information that you mayconsider material. Any liability in respect of the contents of, or any omission from, this Presentation is expressly excluded.
This presentation contains certain forward looking statements concerning the Company’s future business prospects and business profitability, which aresubject to a number of risks and uncertainties and the actual results could materially differ from those in such forward looking statements. The risks anduncertainties relating to these statements include, but are not limited to, risks and uncertainties regarding fluctuations in earnings, our ability to managegrowth, competition (both domestic and international), economic growth in India and abroad, ability to attract and retain highly skilled professionals, timeand cost over runs on contracts, our ability to manage our international operations, government policies and actions regulations, interest and other fiscalcosts generally prevailing in the economy. The Company does not undertake to make any announcement in case any of these forward looking statementsbecome materially incorrect in future or update any forward looking statements made from time to time by or on behalf of the Company.
2
Safe Harbor

3
Fermenta Biotech: Q1 Financial Highlights
Revenue* (Rs. Crs) EBITDA* (Rs. Crs) PAT^ (Rs. Crs)
79.7 80.1
Q1 FY20Q1 FY19
+1%
28.726.9
Q1 FY19 Q1 FY20
-6%
21.1
16.3
Q1 FY19 Q1 FY20
-23%
*Includes Other Income ^ PAT before share of profit / loss from associates & JV’s and Minority Interest
Business Update:
• In Q1 FY20, Company has taken a planned shutdown of Dahej plant to carry out major repairs and maintenance work and de-bottlenecking programme
• The shutdown was for nearly a month and was completed on May 29, 2019
• Post completion of this de-bottlenecking programme, the production capacity has increased by approximately 15%
• The de-bottlenecking programme is part of the overall strategy of FBL to increase the production capacity
4
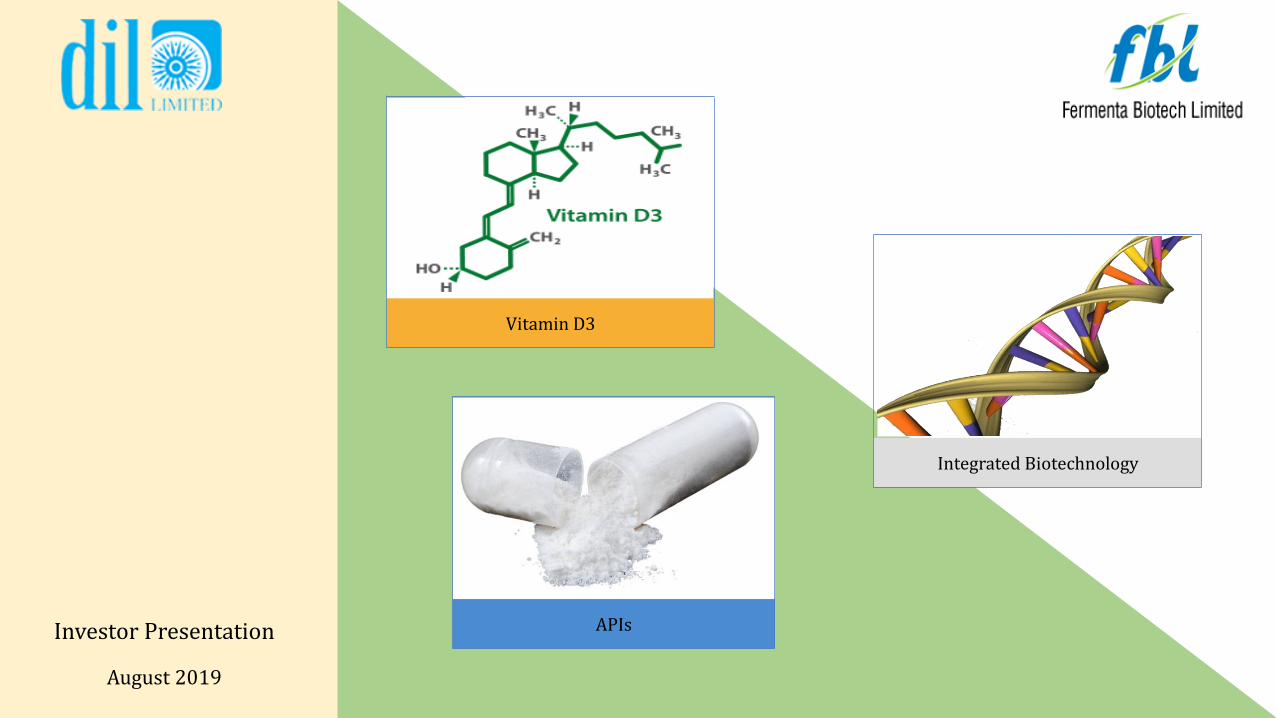
Fermenta Biotech: Profit and Loss
• Revenue from Vitamin D3for Human use contributed45% to overall revenue ascompared to 29% in Q1FY19
• Revenue from Vitamin D3for Animal Feed usecontributed 41% to overallrevenue as compared to47% in Q1 FY19
• The prices of Vitamin D3 forAnimal Feed have shownweaker tone as comparedto earlier quarters
Particulars (Rs. Crs) Q1 FY20 Q1 FY19 Y-o-Y
Revenue 77.0 76.5 0.7%
Other Income 3.1 3.2
Total Revenue 80.1 79.7 0.5%
Raw Material 19.8 20.3
Employee Expenses 12.9 9.0
Other Expenses 20.5 21.7
EBITDA 26.9 28.7 -6.2%
EBITDA Margin % 33.6% 35.9%
Depreciation 3.4 1.8
EBIT 23.5 26.9 -12.6%
EBIT Margin % 29.4% 33.7%
Finance Cost 1.1 0.5
PBT 22.4 26.4 -15.1%
Tax 6.1 5.3
PAT 16.3 21.1 -22.9%
PAT Margin % 20.3% 26.5%
5
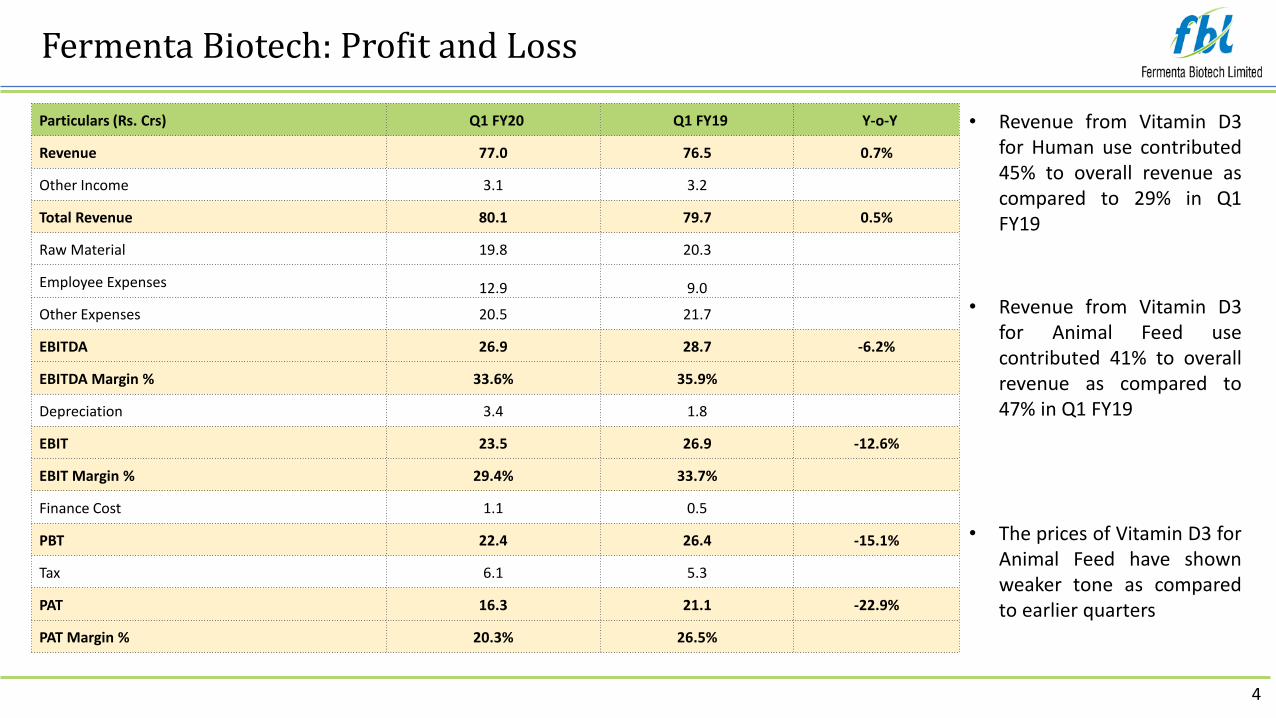
Q1 FY20 Consolidated Financial Highlights (YoY)
Revenue* (Rs. Crs) EBITDA* (Rs. Crs) PAT^ (Rs. Crs)
83.5 84.1
Q1 FY19 Q1 FY20
+1%
29.227.4
Q1 FY20Q1 FY19
-6%
16.7
14.1
Q1 FY19 Q1 FY20
-16%
*Includes Other Income On Consolidated Basis ^ PAT before share of profit / loss from associates & JV’s and Minority Interest

Particulars (Rs. Crs) Q1 FY20 Q1 FY19 YoY
Revenue 81.2 80.1 1.3%
Other Income 2.9 3.3
Total Revenue 84.1 83.5 0.8%
Raw Material 19.8 20.3
Employee Expenses 14.0 10.5
Other Expenses 22.9 23.4
EBITDA 27.4 29.2 -6.0%
EBITDA Margin % 32.6% 35.0%
Depreciation 3.5 2.8
EBIT 23.9 26.4 -9.2%
EBIT Margin % 28.5% 31.6%
Finance Cost 4.9 4.4
PBT 19.0 22.0 -13.5%
Tax 4.9 5.3
PAT 14.1 16.7 -15.7%
PAT Margin % 16.7% 20.0%
Share of profit /(loss) of JV’s and Associates 0.0 -0.1
PAT after share of profit / (loss) of JV’s and Associates 14.1 16.6 -15.2%
Minority Interest 0.0 0.0
PAT after MI 14.1 16.6 -15.2%
EPS (in Rs.) 14.2 16.6
6
Consolidated Profit and Loss
7
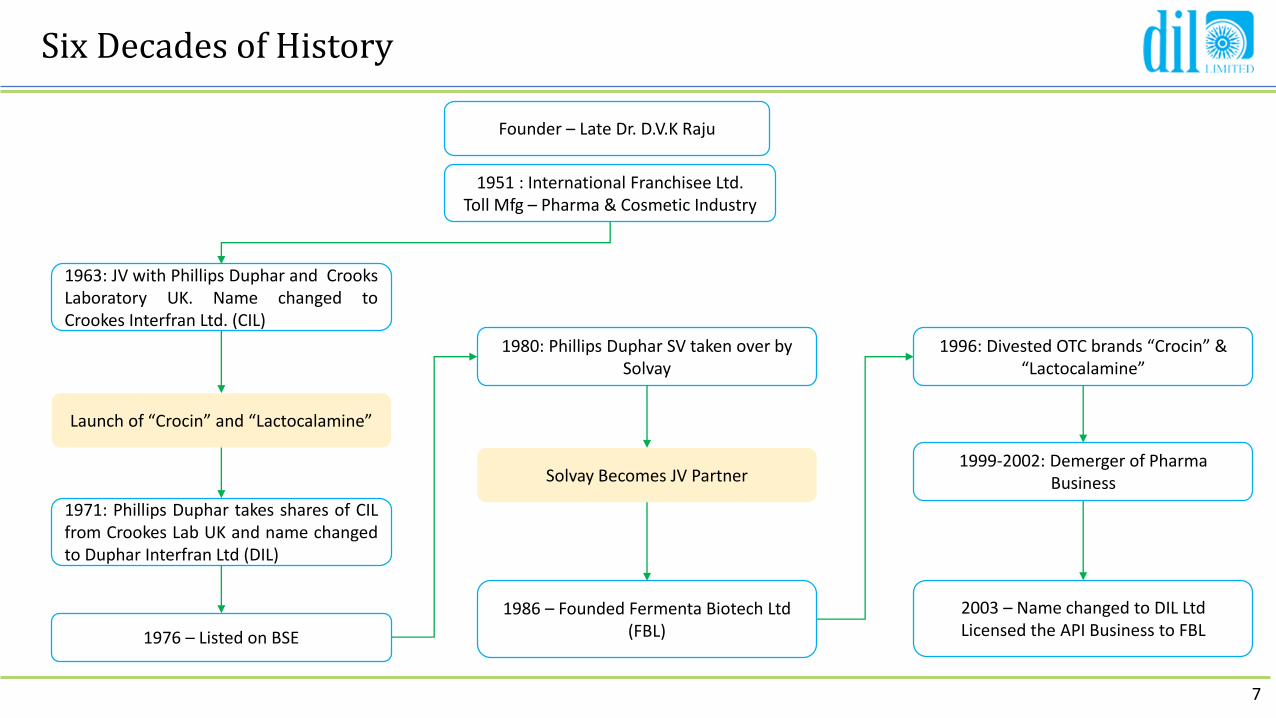
Six Decades of History
Founder – Late Dr. D.V.K Raju
1951 : International Franchisee Ltd.Toll Mfg – Pharma & Cosmetic Industry
1963: JV with Phillips Duphar and CrooksLaboratory UK. Name changed toCrookes Interfran Ltd. (CIL)
Launch of “Crocin” and “Lactocalamine”
1976 – Listed on BSE
1980: Phillips Duphar SV taken over by Solvay
1996: Divested OTC brands “Crocin” & “Lactocalamine”
Solvay Becomes JV Partner
1986 – Founded Fermenta Biotech Ltd (FBL)
2003 – Name changed to DIL LtdLicensed the API Business to FBL
1971: Phillips Duphar takes shares of CILfrom Crookes Lab UK and name changedto Duphar Interfran Ltd (DIL)
1999-2002: Demerger of Pharma Business
8
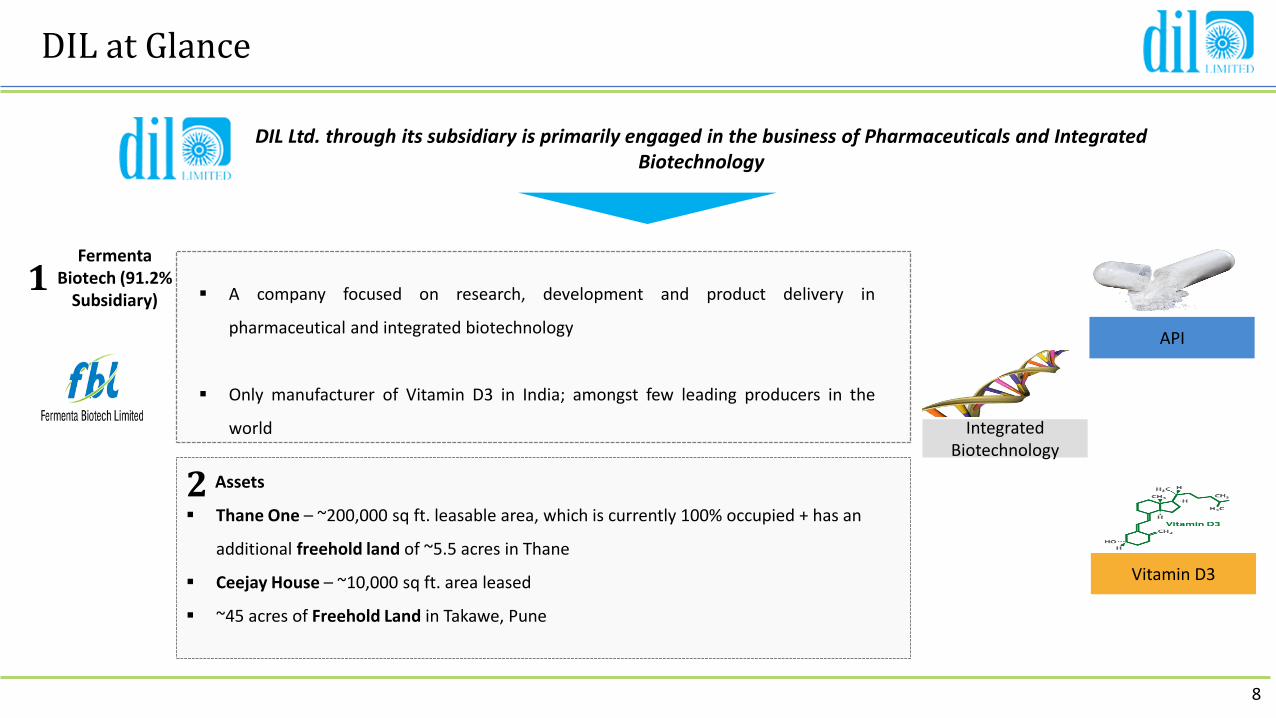
DIL at Glance
Assets
▪ Thane One – ~200,000 sq ft. leasable area, which is currently 100% occupied + has an
additional freehold land of ~5.5 acres in Thane
▪ Ceejay House – ~10,000 sq ft. area leased
▪ ~45 acres of Freehold Land in Takawe, Pune
DIL Ltd. through its subsidiary is primarily engaged in the business of Pharmaceuticals and Integrated Biotechnology
FermentaBiotech (91.2%
Subsidiary) ▪ A company focused on research, development and product delivery in
pharmaceutical and integrated biotechnology
▪ Only manufacturer of Vitamin D3 in India; amongst few leading producers in the
world
1
2
Vitamin D3
Integrated Biotechnology
API

9
Through Merger of FBL with DIL
Greater efficiency in cashmanagement of the groupand unfettered access tocash flow generated by thecombined business whichcan be deployed moreefficiently to fund organicand inorganic growthopportunities.
Improved organizationalcapability and leadership,arising from the pooling ofhuman capital havingdiverse skills, talent andvast experience to competesuccessfully in anincreasingly competitiveindustry
Cost savings are expectedto flow from morefocused operationalefforts, rationalization,standardization andsimplification of businessprocesses, and theelimination of duplication,and rationalization ofadministrative expenses
To optimally leverage thelarger assets base of themerged entity
Cash Flow Optimization
Leverage Assets
Cost Optimization
Leadership Team
Holding Company
91.2% Subsidiary Company
Syn
erg
ies
Syn
erg
ies
Syn
erg
ies
Syn
erg
ies
10
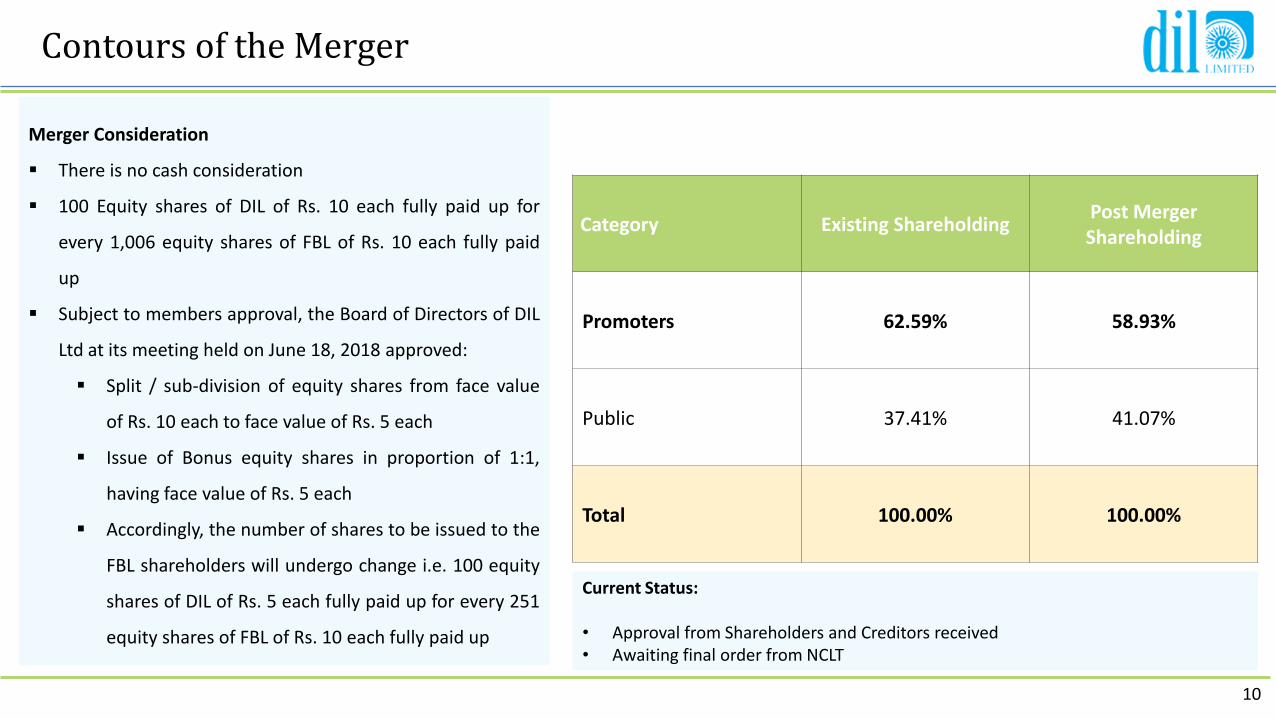
Contours of the Merger
Category Existing ShareholdingPost Merger Shareholding
Promoters 62.59% 58.93%
Public 37.41% 41.07%
Total 100.00% 100.00%
Merger Consideration
▪ There is no cash consideration
▪ 100 Equity shares of DIL of Rs. 10 each fully paid up for
every 1,006 equity shares of FBL of Rs. 10 each fully paid
up
▪ Subject to members approval, the Board of Directors of DIL
Ltd at its meeting held on June 18, 2018 approved:
▪ Split / sub-division of equity shares from face value
of Rs. 10 each to face value of Rs. 5 each
▪ Issue of Bonus equity shares in proportion of 1:1,
having face value of Rs. 5 each
▪ Accordingly, the number of shares to be issued to the
FBL shareholders will undergo change i.e. 100 equity
shares of DIL of Rs. 5 each fully paid up for every 251
equity shares of FBL of Rs. 10 each fully paid up
Current Status:
• Approval from Shareholders and Creditors received• Awaiting final order from NCLT
11
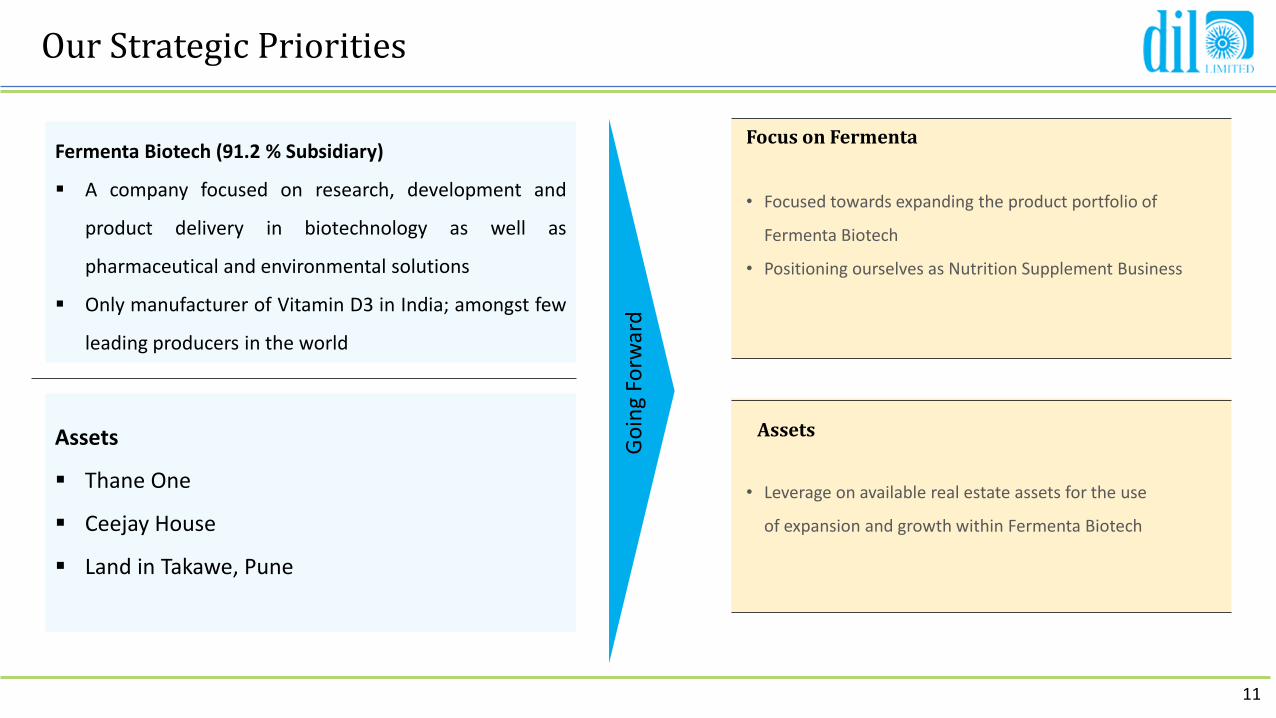
Our Strategic Priorities
Fermenta Biotech (91.2 % Subsidiary)
▪ A company focused on research, development and
product delivery in biotechnology as well as
pharmaceutical and environmental solutions
▪ Only manufacturer of Vitamin D3 in India; amongst few
leading producers in the world
Assets
▪ Thane One
▪ Ceejay House
▪ Land in Takawe, Pune
Go
ing
Forw
ard
Assets
• Leverage on available real estate assets for the use
of expansion and growth within Fermenta Biotech
Focus on Fermenta
• Focused towards expanding the product portfolio of
Fermenta Biotech
• Positioning ourselves as Nutrition Supplement Business

12
Fermenta’s Portfolio Outlook
Target Space
Fat-soluble vitamins & value added variantsMarketsPhase-1 Domestic
Phase-2 Global
ApplicationsPharma & DNS
Food Fortification:Flour/ Bakery/ Breakfast Cereals/ Diary/ Oils/ Beverages
Value Added Nutraceuticals
Quality Assurance
Innovation in R&D
Digitization Human Capital
World-Class Facilities
State of the Art Technology
Customer Segments
Infants Childhood Adolescence Adulthood Elderly
Smart Minerals
Novel Anti-oxidants
Pre- and Pro- Biotics
Omega Fatty Acids
Customized Premixes
Excellence in Operations

13
The Emerging Nutraceuticals Market
Source: ASSOCHAM Indian Nutraceuticals Market Report 2018
Well developed/ Matured market
Retail/Consumer driven approach
Well defined value chain
Ascertained awareness
Large population with increasing disposable income, emerging market
Favourable government policies for food fortification
Nutraceutical Market Size
Key Drivers
249.5
320.4348.6
379.3412.7
449.0488.5
531.5578.2
20242017 202320202018 2019 2021 2022 2025
CAGR: 11%
Global (USD Billion) Domestic (USD Billion)
4.04.8
5.97.1
8.6
10.4
12.6
15.2
18.4
2017 2018 2019 2024202320212020 2022 2025
CAGR: 21%
14
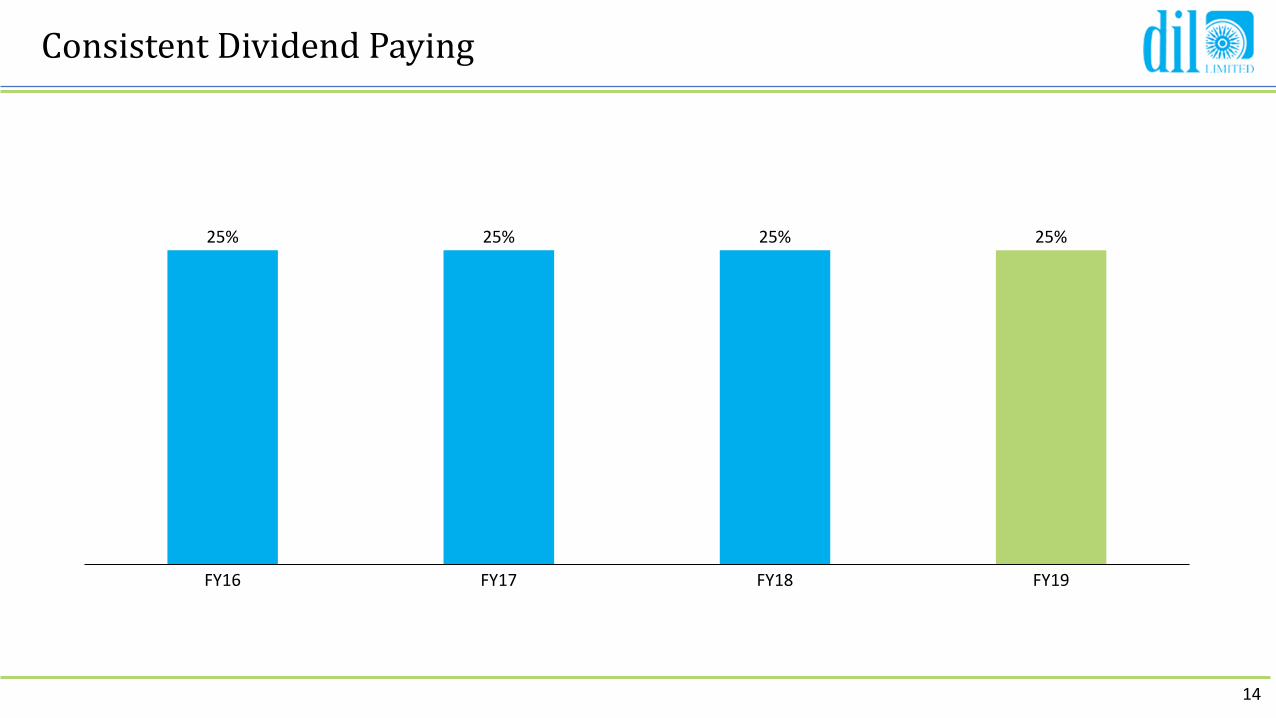
Consistent Dividend Paying
FY16 FY17
25%
FY18
25%
FY19
25%25%
15
About Fermenta Biotech Limited
16
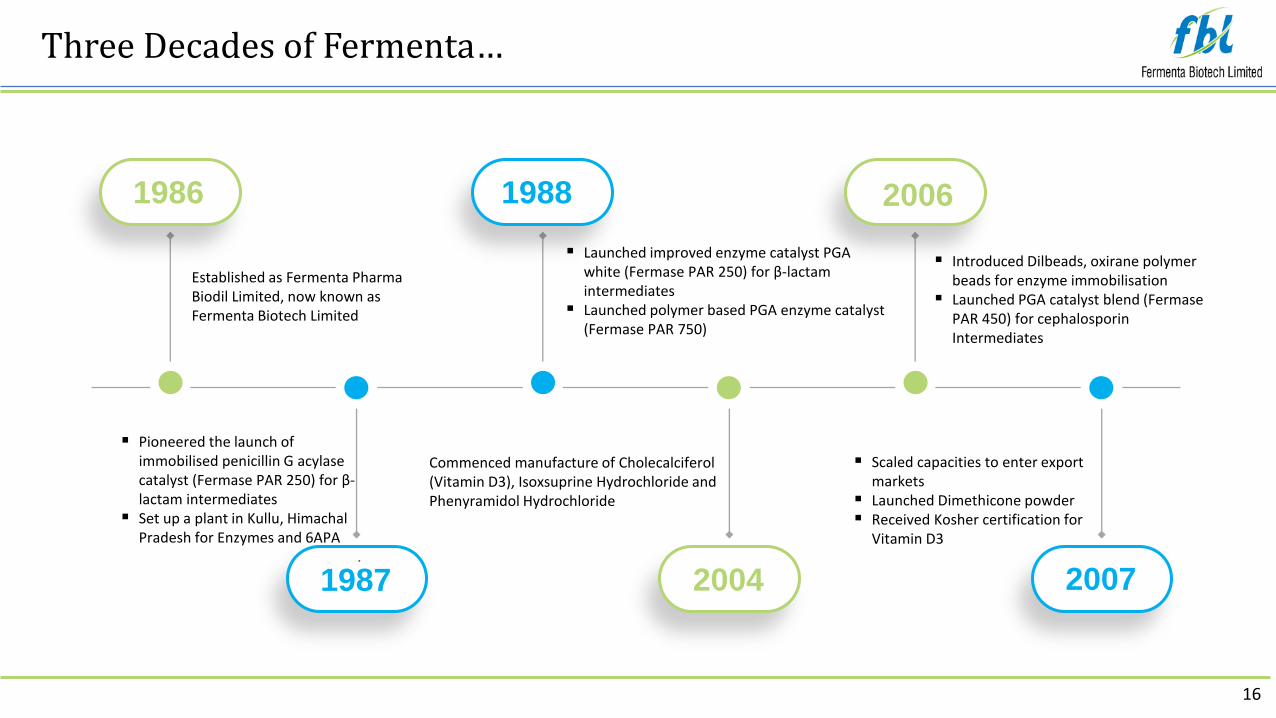
Three Decades of Fermenta…
1986 1988 2006
200720041987
Established as Fermenta Pharma Biodil Limited, now known as Fermenta Biotech Limited
▪ Launched improved enzyme catalyst PGA white (Fermase PAR 250) for β-lactam intermediates
▪ Launched polymer based PGA enzyme catalyst (Fermase PAR 750)
▪ Introduced Dilbeads, oxirane polymer beads for enzyme immobilisation
▪ Launched PGA catalyst blend (Fermase PAR 450) for cephalosporin Intermediates
▪ Pioneered the launch of immobilised penicillin G acylase catalyst (Fermase PAR 250) for β-lactam intermediates
▪ Set up a plant in Kullu, Himachal Pradesh for Enzymes and 6APA
.
Commenced manufacture of Cholecalciferol (Vitamin D3), Isoxsuprine Hydrochloride and Phenyramidol Hydrochloride
▪ Scaled capacities to enter export markets
▪ Launched Dimethicone powder▪ Received Kosher certification for
Vitamin D3

17
..progress over the Last Decade
2009
2017
▪ Completed construction of the Dahejfacility (SEZ) for mfg of Vitamin D3
▪ Ventured into animal feed and oil supplements of Vitamin D3
▪ Applied for Canadian DMF and US DMF
▪ Received CEP from EDQM for its Dahejfacility for Vitamin D
▪ Received FSSC 22000 and BRC Food Safety Approvals for both its plants for Vitamin D
▪ Launched novel penicillin G acylase (NPGA) for β-lactam antibiotic synthesis (e.g. Amoxicillin)
▪ Obtained CEP certification for Vitamin D3 from EDQM for its Kulluplant
▪ Started exporting Vitamin D3▪ Introduced Phenyramidol
formulations in India
2008▪ Received Halal
certification for Vitamin D3
2014▪ Initiated commercial
production of Vitamin D3 100 CWD to cater to the food and dietary nutraceutical supplements market
▪ Launched Phenyramidolformulations in Africa
2016▪ Enhanced Vitamin D3
capacity at its new plant at Dahej
▪ Launched new version of Vitamin D3 500 feed grade Powder
▪ Underwent US FDA inspection for dietary supplements at Kullu
▪ Commercialised novel penicillin G acylase (NPGA) Fermase PS 150 for major global customers
▪ Launched new and improved penicillin G acylase catalyst – Fermase PA 850
▪ Augmented Vitamin D3 resin manufacturing capacity in Dahej
2012
2011
2019
▪ Sayakha Land acquired▪ Completed debottlenecking
programme at Dahej Plant

18
Experienced Board of Directors
Mr. Satish Varma
Managing Director
Mr. Sanjay Buch
Chairman
Ms. Anupama Datla Desai
Executive Director
Mr. Krishna Datla
Non- Executive Director
Dr. GopakumarNair
Independent Director

19
Vitamin D3
Market Leader in India
Suppliers to
300+ Customers Globally
Only manufacturer in India;amongst few producers in the
World
Over 5 Decades of Manufacturing
experience
Applications
Human Health
Animal Health
PharmaceuticalsDietary
SupplementsFood
FeedVeterinary
20
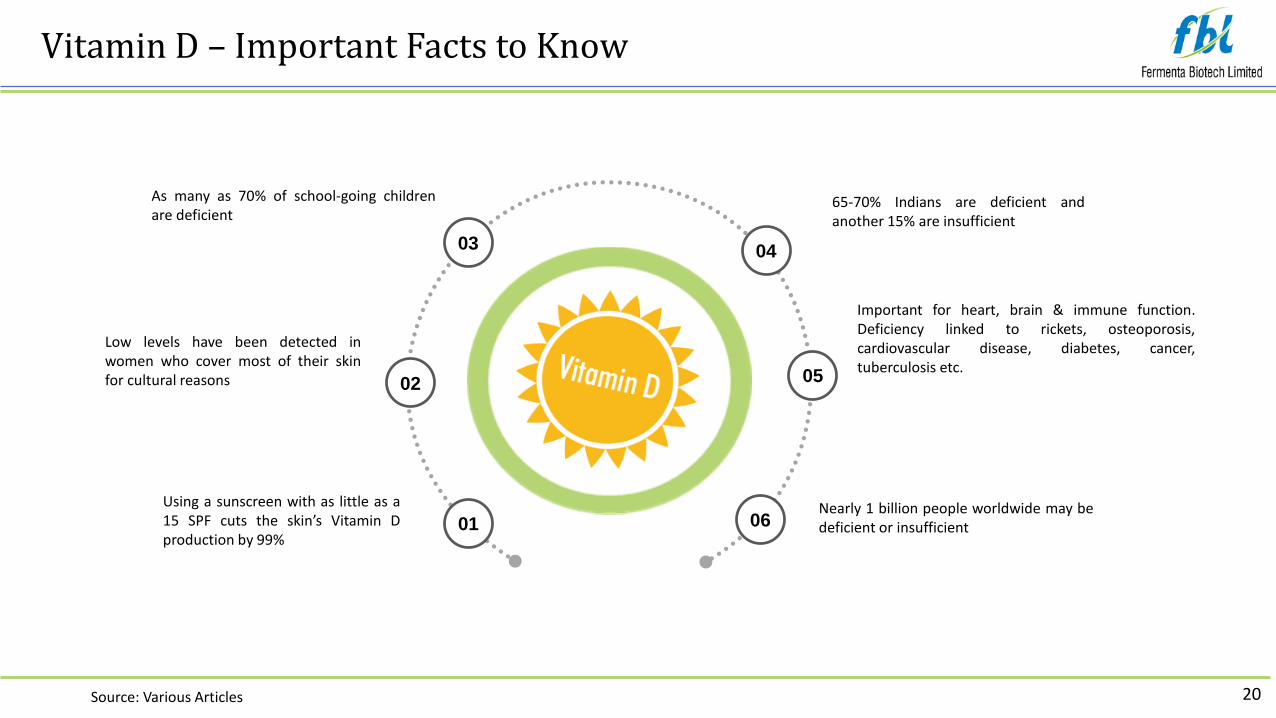
Vitamin D – Important Facts to Know
Using a sunscreen with as little as a15 SPF cuts the skin’s Vitamin Dproduction by 99%
65-70% Indians are deficient andanother 15% are insufficient
As many as 70% of school-going childrenare deficient
Important for heart, brain & immune function.Deficiency linked to rickets, osteoporosis,cardiovascular disease, diabetes, cancer,tuberculosis etc.
Low levels have been detected inwomen who cover most of their skinfor cultural reasons
Nearly 1 billion people worldwide may bedeficient or insufficient
0403
0502
0601
Source: Various Articles
21
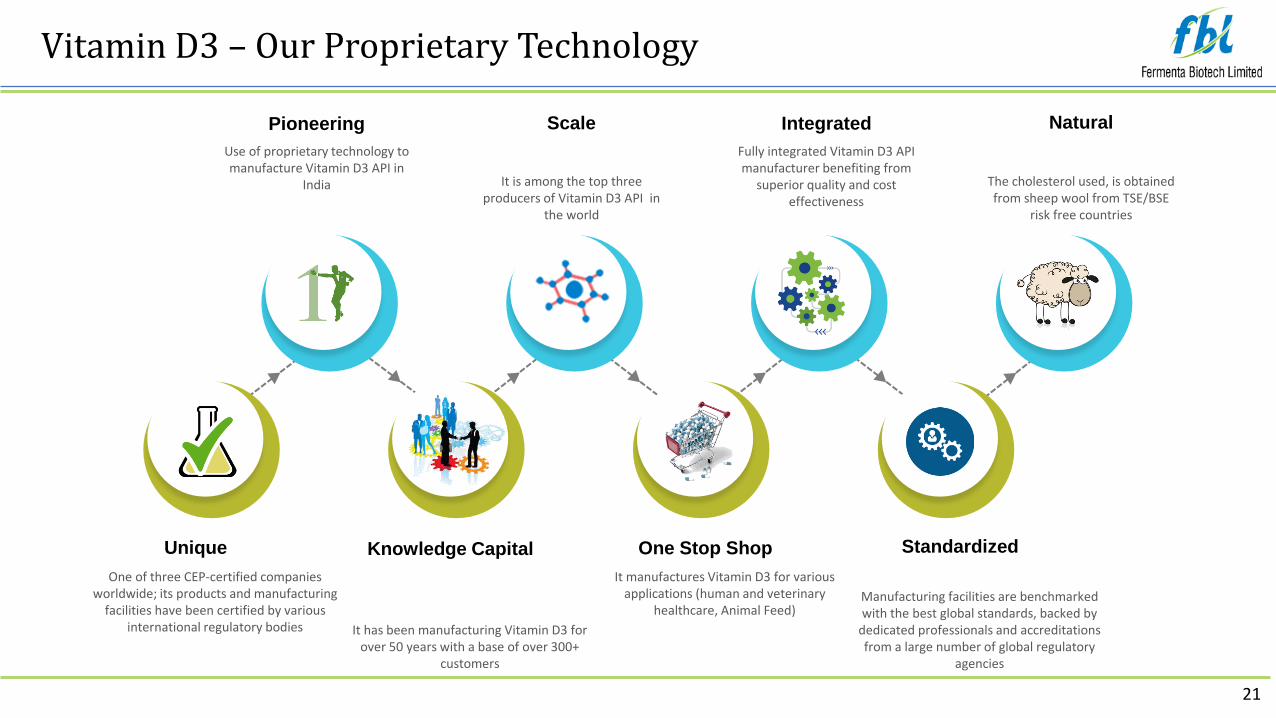
Vitamin D3 – Our Proprietary Technology
Use of proprietary technology to manufacture Vitamin D3 API in
India
Pioneering
It is among the top three producers of Vitamin D3 API in
the world
Scale
Fully integrated Vitamin D3 API manufacturer benefiting from
superior quality and cost effectiveness
Integrated
The cholesterol used, is obtained from sheep wool from TSE/BSE
risk free countries
Natural
One of three CEP-certified companies worldwide; its products and manufacturing
facilities have been certified by various international regulatory bodies
Unique
It has been manufacturing Vitamin D3 for over 50 years with a base of over 300+
customers
Knowledge Capital
It manufactures Vitamin D3 for various applications (human and veterinary
healthcare, Animal Feed)
One Stop Shop
Manufacturing facilities are benchmarked with the best global standards, backed by
dedicated professionals and accreditations from a large number of global regulatory
agencies
Standardized
22
Creating Sustainable Value in the Business
▪ Nascent and Mature business mix
▪ Globally Recognized Plants for key products
▪ Proprietary IPR-driven research
▪ Multi-decadal Experience
▪ Competent and experienced Human Capital
▪ Governance focus
▪ Global quality Certifications
▪ 50 countries across the world
▪ Growing number of Multi-year accounts
▪ Among the Worlds Largest D3 Makers and Leading PhenyramidolManufacturer
▪ Among top pioneering companies to introduce enzymatic antibiotics manufacturing technology
▪ Among few non-European companies with a CEP accreditation by EQDM for Vitamin D3
▪ Healthy Balance Sheet
▪ Profitable Growth
▪ Low cost borrowings due to significant exports
Niche PresenceGlobal Presence Financial Strength
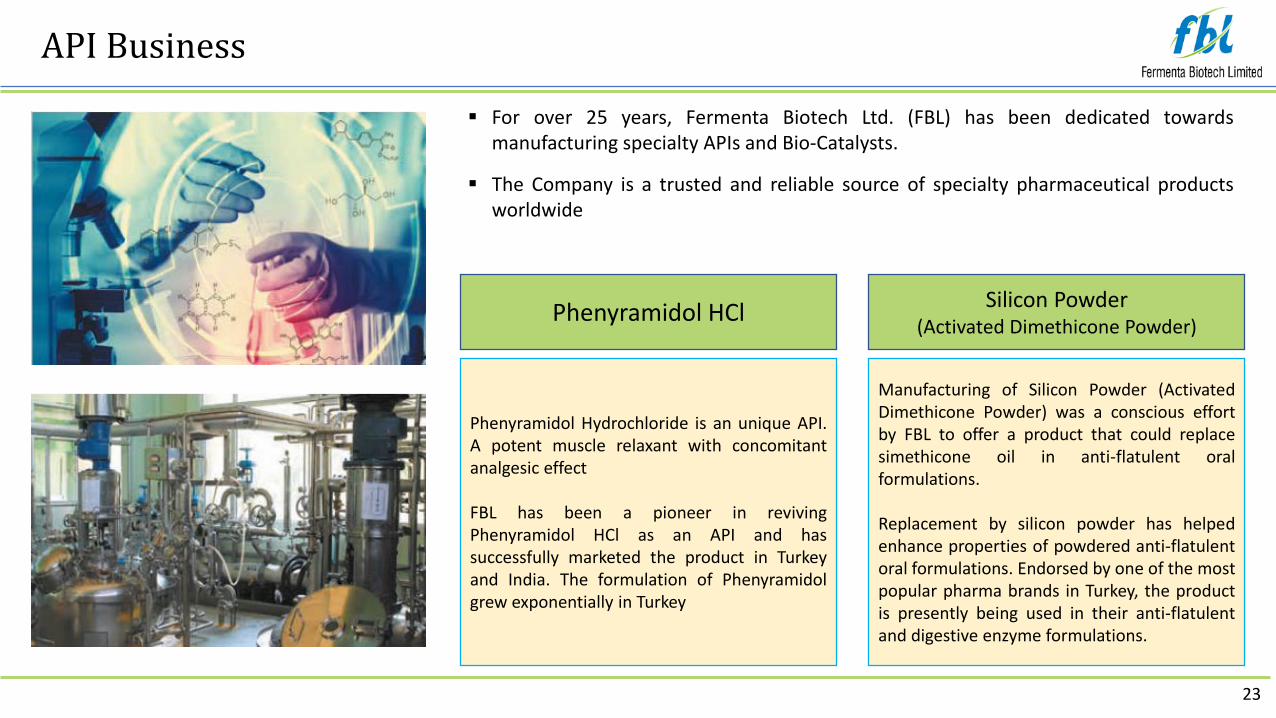
▪ For over 25 years, Fermenta Biotech Ltd. (FBL) has been dedicated towardsmanufacturing specialty APIs and Bio-Catalysts.
▪ The Company is a trusted and reliable source of specialty pharmaceutical productsworldwide
23
API Business
Phenyramidol Hydrochloride is an unique API.A potent muscle relaxant with concomitantanalgesic effect
FBL has been a pioneer in revivingPhenyramidol HCl as an API and hassuccessfully marketed the product in Turkeyand India. The formulation of Phenyramidolgrew exponentially in Turkey
Manufacturing of Silicon Powder (ActivatedDimethicone Powder) was a conscious effortby FBL to offer a product that could replacesimethicone oil in anti-flatulent oralformulations.
Replacement by silicon powder has helpedenhance properties of powdered anti-flatulentoral formulations. Endorsed by one of the mostpopular pharma brands in Turkey, the productis presently being used in their anti-flatulentand digestive enzyme formulations.
Phenyramidol HCl Silicon Powder
(Activated Dimethicone Powder)
24
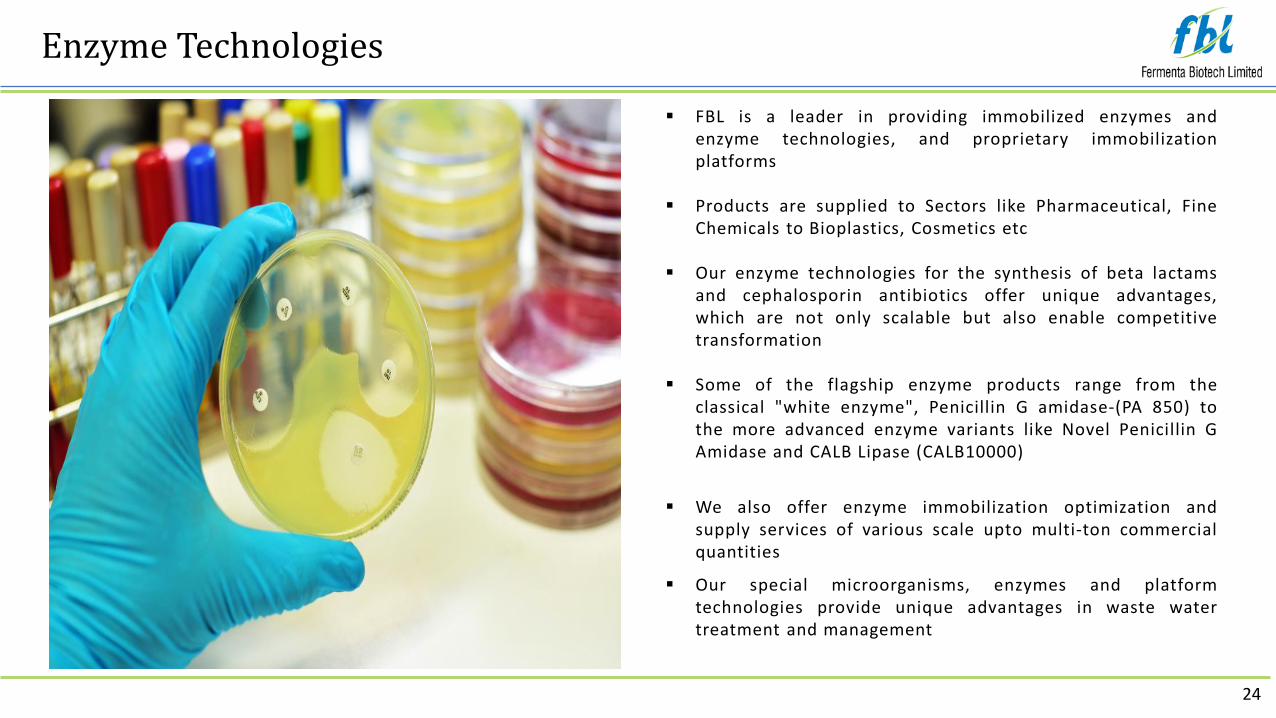
Enzyme Technologies
▪ FBL is a leader in providing immobilized enzymes andenzyme technologies, and proprietary immobilizationplatforms
▪ Products are supplied to Sectors like Pharmaceutical, FineChemicals to Bioplastics, Cosmetics etc
▪ Our enzyme technologies for the synthesis of beta lactamsand cephalosporin antibiotics offer unique advantages,which are not only scalable but also enable competitivetransformation
▪ Some of the flagship enzyme products range from theclassical "white enzyme", Penicillin G amidase-(PA 850) tothe more advanced enzyme variants like Novel Penicillin GAmidase and CALB Lipase (CALB10000)
▪ We also offer enzyme immobilization optimization andsupply services of various scale upto multi-ton commercialquantities
▪ Our special microorganisms, enzymes and platformtechnologies provide unique advantages in waste watertreatment and management

Driven by the Discover, Develop & Deliver philosophy
25
R&D Centre and Quality Management
Providing
Integrated Solutions,
processes and products for Biotech and
Active Pharmaceutical Ingredients (API)
Biotech R&D has got wide experience in the areas of bacterial fermentation, enzyme
expression, immobilization
platforms and process development in
various enzymatic applications
Enzyme technology
platform is aimed at helping
companies become environmentally responsible and
sustainable (Green Chemistry)
API R&D,combined with
expertise on photochemistry, chromatography and multi-step
process development skills
Modern, fully
equipped, DSIR approved Research
& Development facility complimented
by highly skilled and committed scientists.
Quality AssuranceResponsible for • Implementation of quality
systems and release of all manufactured products
• Audits including regulatory (national and international), customer and GMP
Quality ControlResponsible for all analyses, from analytical support to validations
Regulatory AffairsEnsures compliance with national and international regulatory requirements
Shifted to New R&D Centre of 15,000 sq. ft
26
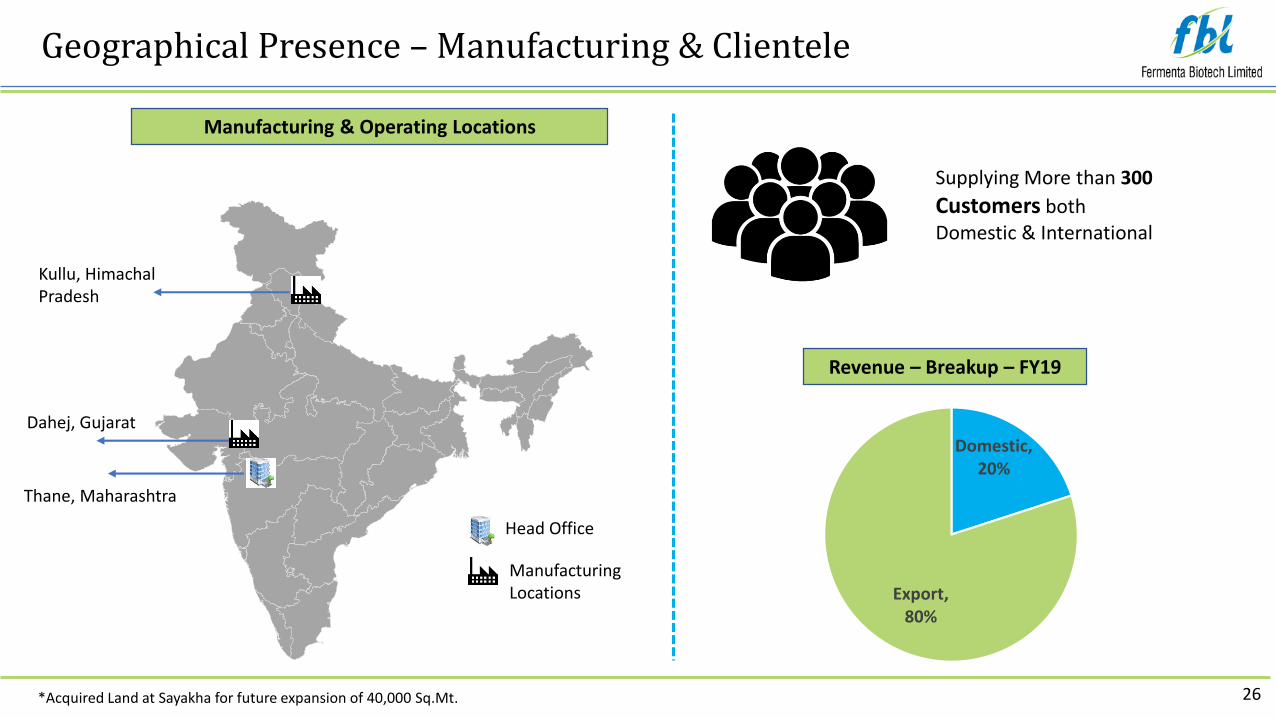
Geographical Presence – Manufacturing & Clientele
Kullu, Himachal Pradesh
Dahej, Gujarat
Thane, Maharashtra
Manufacturing & Operating Locations
Domestic, 20%
Export, 80%
Revenue – Breakup – FY19
Supplying More than 300
Customers both Domestic & International
Head Office
Manufacturing Locations
*Acquired Land at Sayakha for future expansion of 40,000 Sq.Mt.
27
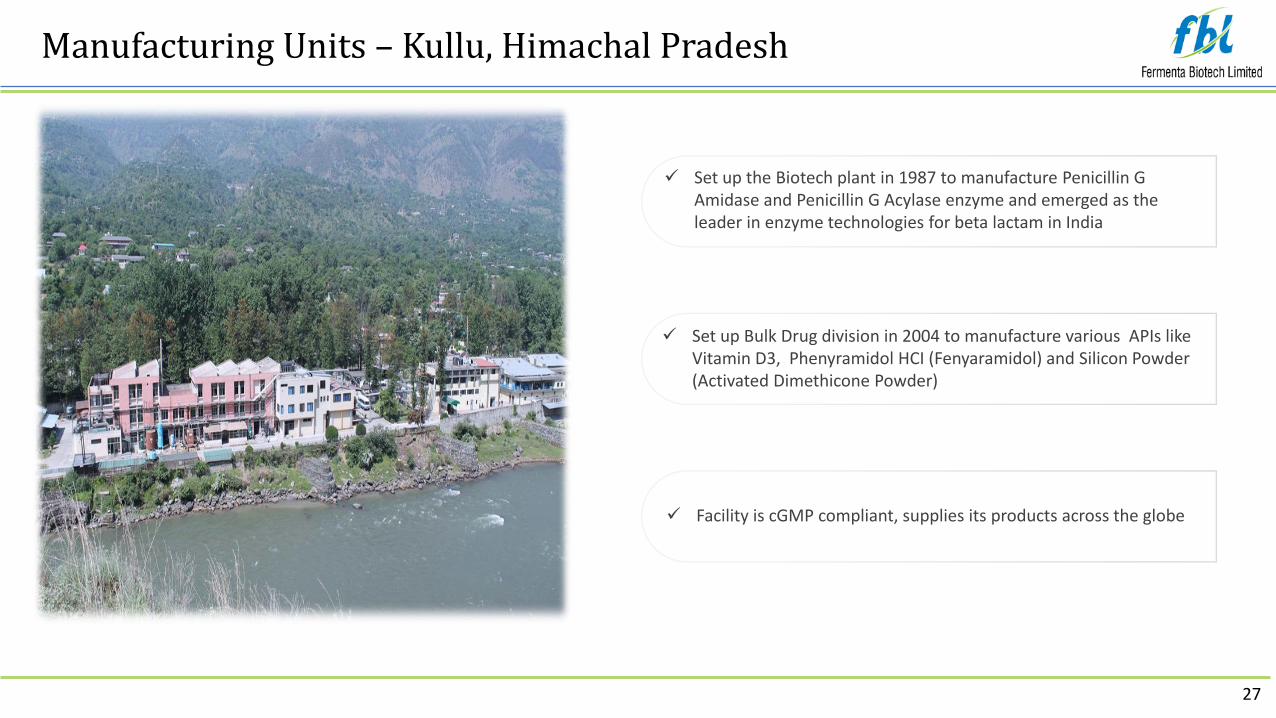
Manufacturing Units – Kullu, Himachal Pradesh
✓ Set up the Biotech plant in 1987 to manufacture Penicillin G Amidase and Penicillin G Acylase enzyme and emerged as the leader in enzyme technologies for beta lactam in India
✓ Set up Bulk Drug division in 2004 to manufacture various APIs like Vitamin D3, Phenyramidol HCI (Fenyaramidol) and Silicon Powder (Activated Dimethicone Powder)
✓ Facility is cGMP compliant, supplies its products across the globe

28
Manufacturing Units – Dahej Gujarat
✓ Established a green field manufacturing facility at Dahej SEZ Ltd. in 2011 to cater to the growing international market
✓ Site has dedicated manufacturing blocks for API’s/Intermediates
✓ Strict adherence to Safety, Health & Environment (SHE) policy
Both the manufacturing units are registered with US FDA "Food Facility Registration Module (FFRM)"
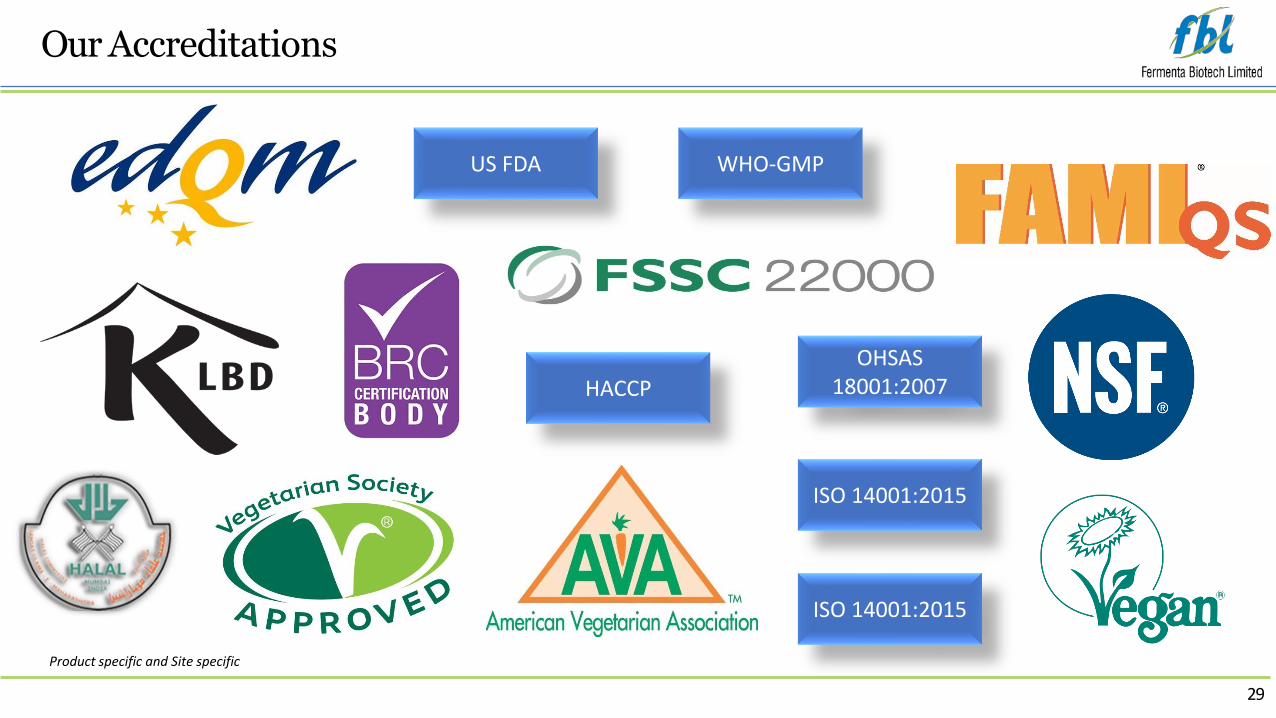
OurAccreditations
29
WHO-GMP
OHSAS 18001:2007
US FDA
ISO 14001:2015
ISO 14001:2015
HACCP
Product specific and Site specific
30
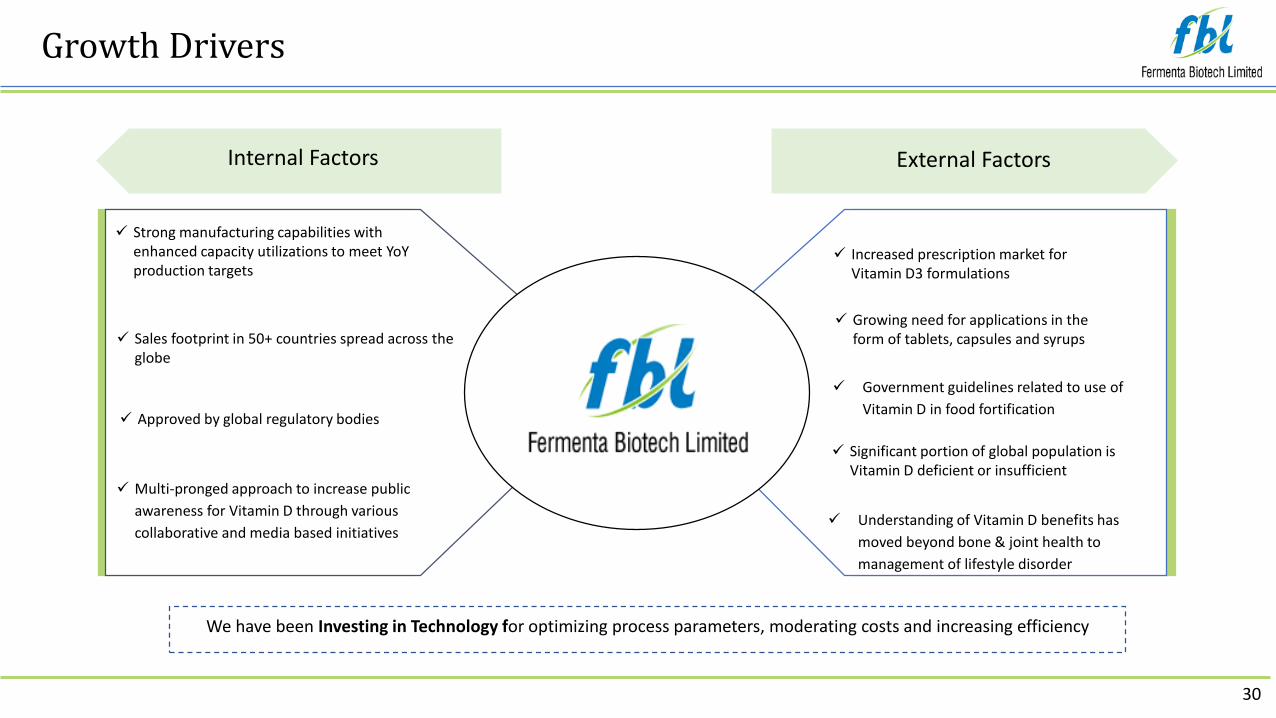
Growth Drivers
Internal Factors External Factors
✓ Increased prescription market for Vitamin D3 formulations
✓ Growing need for applications in the form of tablets, capsules and syrups
✓ Government guidelines related to use of
Vitamin D in food fortification
✓ Significant portion of global population is Vitamin D deficient or insufficient
✓ Strong manufacturing capabilities with enhanced capacity utilizations to meet YoY production targets
✓ Sales footprint in 50+ countries spread across the globe
✓ Approved by global regulatory bodies
✓ Multi-pronged approach to increase public
awareness for Vitamin D through various
collaborative and media based initiatives✓ Understanding of Vitamin D benefits has
moved beyond bone & joint health to
management of lifestyle disorder
We have been Investing in Technology for optimizing process parameters, moderating costs and increasing efficiency
31
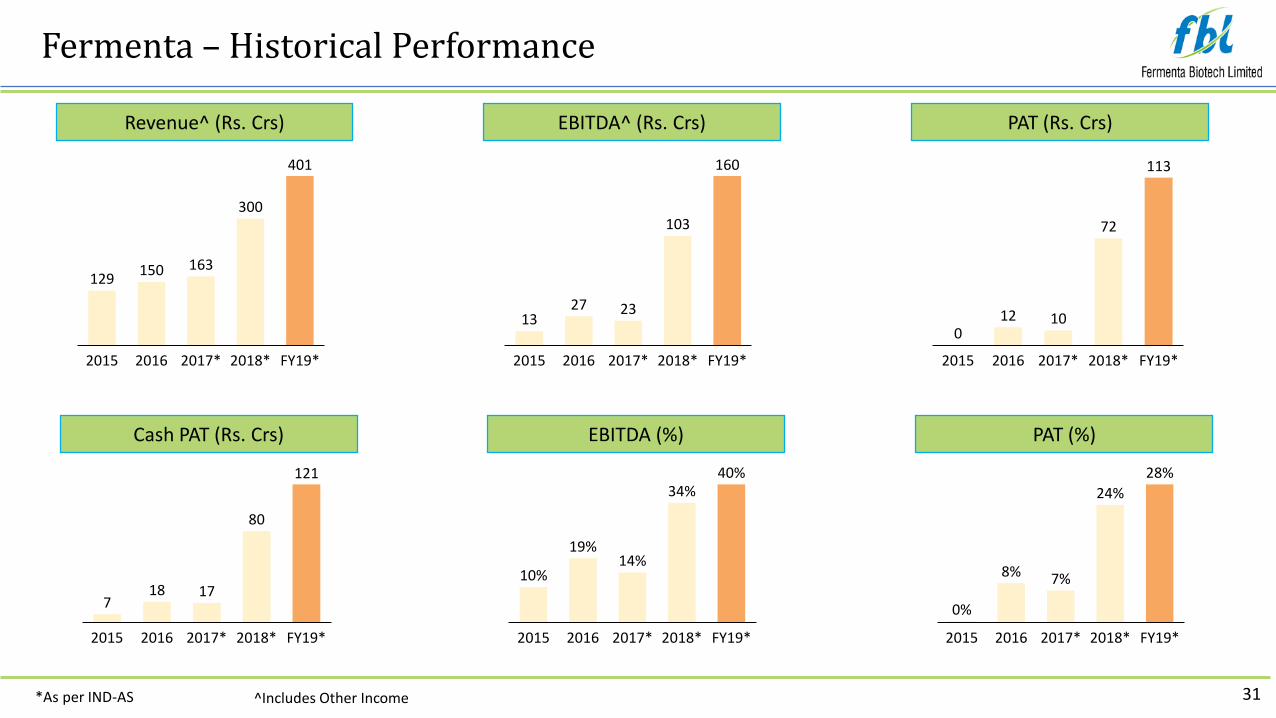
Fermenta – Historical Performance
129150 163
300
401
2017*2015 2016 FY19*2018*
1327 23
103
160
2018*2015 2016 2017* FY19*
2018*2015 FY19*2016 2017*
10%
19%14%
34%40%
12 10
72
113
20162015 2018*2017* FY19*
0
8%
2015
0%
7%
2016 2017* FY19*2018*
24%
28%
718 17
80
121
20162015 2017* 2018* FY19*
Revenue^ (Rs. Crs) EBITDA^ (Rs. Crs) PAT (Rs. Crs)
Cash PAT (Rs. Crs) EBITDA (%) PAT (%)
*As per IND-AS ^Includes Other Income
32
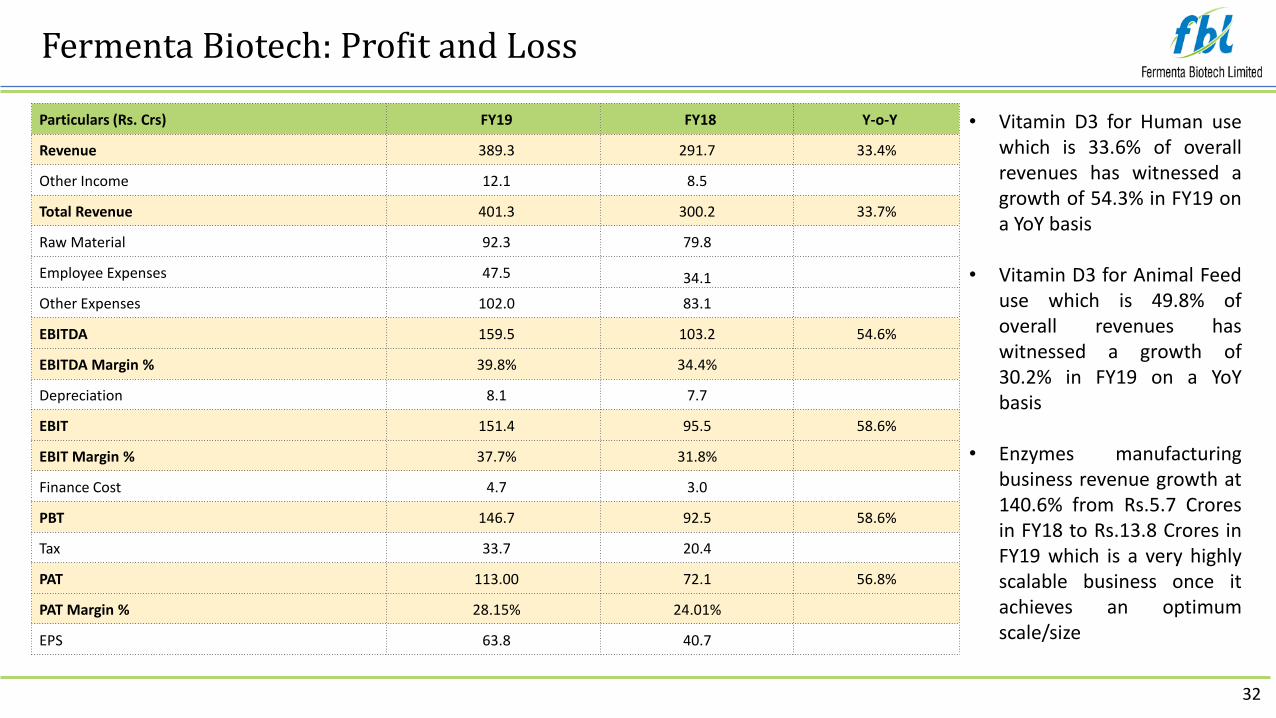
Fermenta Biotech: Profit and Loss
• Vitamin D3 for Human usewhich is 33.6% of overallrevenues has witnessed agrowth of 54.3% in FY19 ona YoY basis
• Vitamin D3 for Animal Feeduse which is 49.8% ofoverall revenues haswitnessed a growth of30.2% in FY19 on a YoYbasis
• Enzymes manufacturingbusiness revenue growth at140.6% from Rs.5.7 Croresin FY18 to Rs.13.8 Crores inFY19 which is a very highlyscalable business once itachieves an optimumscale/size
Particulars (Rs. Crs) FY19 FY18 Y-o-Y
Revenue 389.3 291.7 33.4%
Other Income 12.1 8.5
Total Revenue 401.3 300.2 33.7%
Raw Material 92.3 79.8
Employee Expenses 47.5 34.1
Other Expenses 102.0 83.1
EBITDA 159.5 103.2 54.6%
EBITDA Margin % 39.8% 34.4%
Depreciation 8.1 7.7
EBIT 151.4 95.5 58.6%
EBIT Margin % 37.7% 31.8%
Finance Cost 4.7 3.0
PBT 146.7 92.5 58.6%
Tax 33.7 20.4
PAT 113.00 72.1 56.8%
PAT Margin % 28.15% 24.01%
EPS 63.8 40.7
33
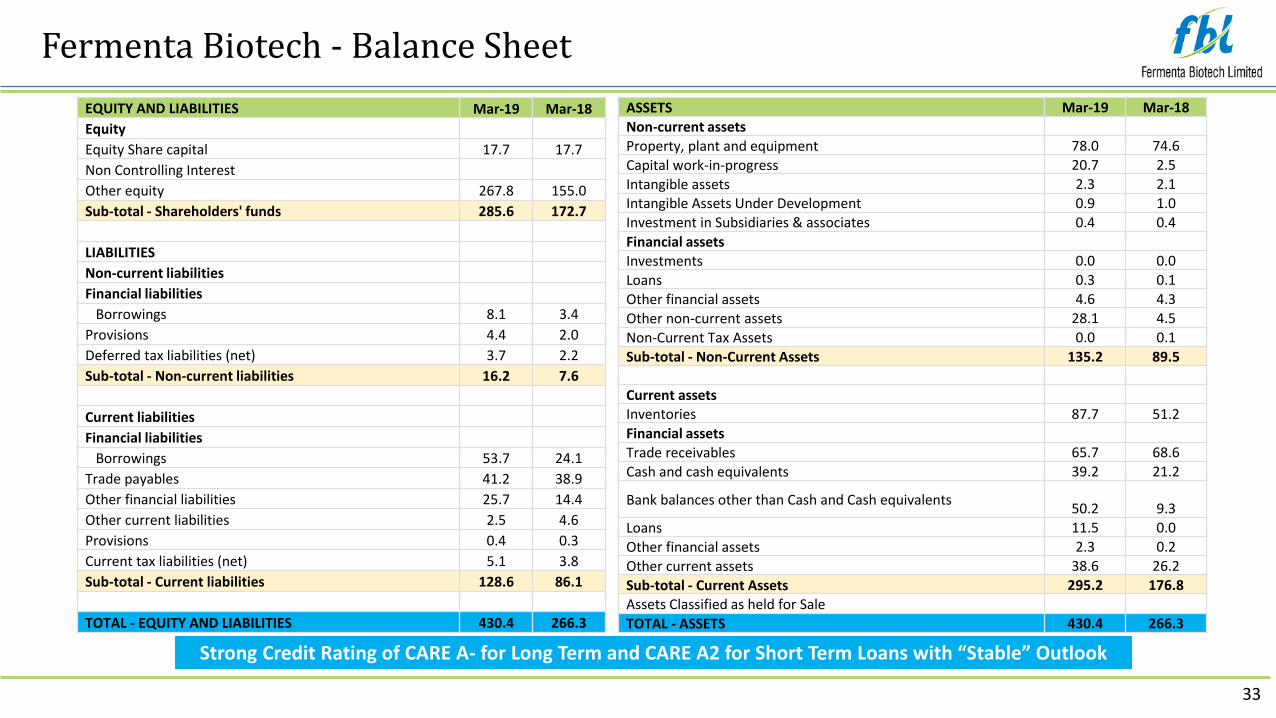
Fermenta Biotech - Balance Sheet
Strong Credit Rating of CARE A- for Long Term and CARE A2 for Short Term Loans with “Stable” Outlook
EQUITY AND LIABILITIES Mar-19 Mar-18
Equity
Equity Share capital 17.7 17.7
Non Controlling Interest
Other equity 267.8 155.0
Sub-total - Shareholders' funds 285.6 172.7
LIABILITIES
Non-current liabilities
Financial liabilities
Borrowings 8.1 3.4
Provisions 4.4 2.0
Deferred tax liabilities (net) 3.7 2.2
Sub-total - Non-current liabilities 16.2 7.6
Current liabilities
Financial liabilities
Borrowings 53.7 24.1
Trade payables 41.2 38.9
Other financial liabilities 25.7 14.4
Other current liabilities 2.5 4.6
Provisions 0.4 0.3
Current tax liabilities (net) 5.1 3.8
Sub-total - Current liabilities 128.6 86.1
TOTAL - EQUITY AND LIABILITIES 430.4 266.3
ASSETS Mar-19 Mar-18
Non-current assets
Property, plant and equipment 78.0 74.6
Capital work-in-progress 20.7 2.5
Intangible assets 2.3 2.1Intangible Assets Under Development 0.9 1.0Investment in Subsidiaries & associates 0.4 0.4
Financial assetsInvestments 0.0 0.0
Loans 0.3 0.1
Other financial assets 4.6 4.3
Other non-current assets 28.1 4.5
Non-Current Tax Assets 0.0 0.1
Sub-total - Non-Current Assets 135.2 89.5
Current assetsInventories 87.7 51.2
Financial assets
Trade receivables 65.7 68.6
Cash and cash equivalents 39.2 21.2
Bank balances other than Cash and Cash equivalents50.2 9.3
Loans 11.5 0.0
Other financial assets 2.3 0.2
Other current assets 38.6 26.2
Sub-total - Current Assets 295.2 176.8Assets Classified as held for Sale
TOTAL - ASSETS 430.4 266.3
34
About DIL Limited
35
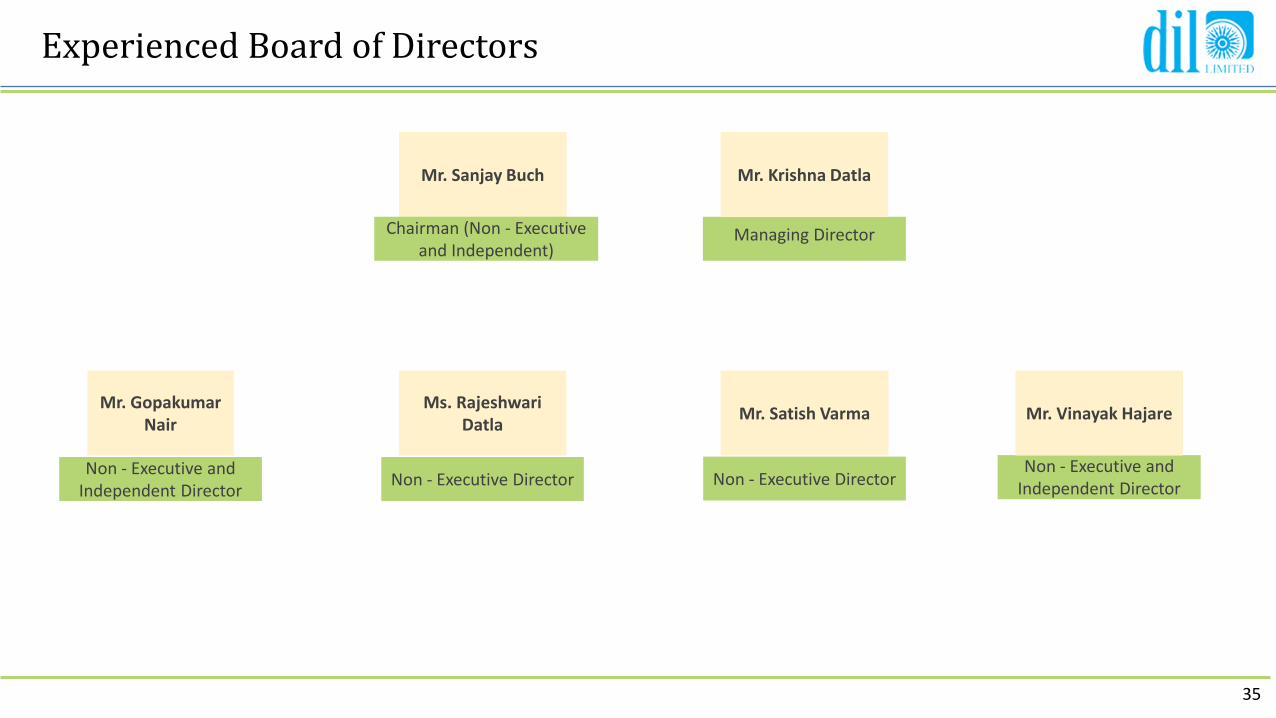
Experienced Board of Directors
Mr. GopakumarNair
Non - Executive and Independent Director
Ms. Rajeshwari Datla
Non - Executive Director
Mr. Satish Varma
Non - Executive Director
Mr. Sanjay Buch
Chairman (Non - Executive and Independent)
Mr. Krishna Datla
Managing Director
Mr. Vinayak Hajare
Non - Executive and Independent Director
36
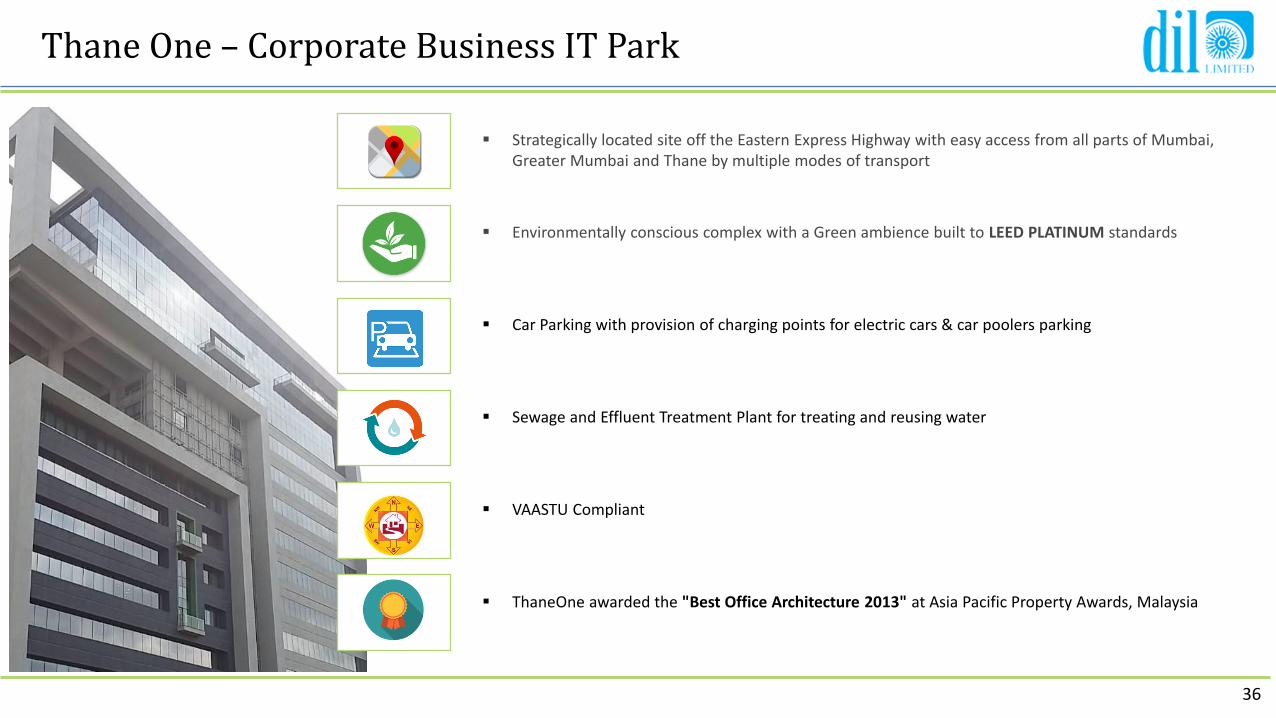
Thane One – Corporate Business IT Park
▪ Strategically located site off the Eastern Express Highway with easy access from all parts of Mumbai, Greater Mumbai and Thane by multiple modes of transport
▪ Environmentally conscious complex with a Green ambience built to LEED PLATINUM standards
▪ Car Parking with provision of charging points for electric cars & car poolers parking
▪ Sewage and Effluent Treatment Plant for treating and reusing water
▪ VAASTU Compliant
▪ ThaneOne awarded the "Best Office Architecture 2013" at Asia Pacific Property Awards, Malaysia

37
Standalone Profit & Loss
Particulars (Rs. Crs) Q1FY20 Q1FY19 YoY FY19 FY18 YoY
Revenue from Operations (Net of Excise) 5.4 4.5 18.2% 19.4 12.5 54.7%
Other Income 0.1 0.1 0.3 0.4
Total Revenue 5.4 4.6 16.9% 19.7 12.9 52.7%
Employee Cost 1.1 1.5 5.7 5.8
Provision for impairment of non current investments & financials asset in associates/ Joint venture
- - 9.0 6.0
Other Expenses 2.7 2.6 10.9 10.1
EBITDA 1.6 0.5 -242.9% -5.9 -9.0 34.4%
EBITDA Margin 30.1% 10.3% -30.0% -69.9%
Depreciation 0.9 1.0 3.8 3.8
EBIT 0.7 -0.5 228.2% -9.7 -12.8 24.5%
EBIT Margin 12.8% -11.7% -49.2% -99.6%
Finance Cost 4.1 3.9 16.0 10.6
Exceptional Item (Gain) / Loss - - - -
Profit before Tax -3.4 -4.4 22.3% -25.6 -23.5 -9.3%
PBT Margin -63.5% -95.5% -130.4% -182.1%
Tax -1.2 0 -23.0 0.7
PAT -2.2 -4.4 49.5% -2.67 -24.15 88.9%
PAT Margin % -41.3% -95.5% -13.6% -187.4%
38
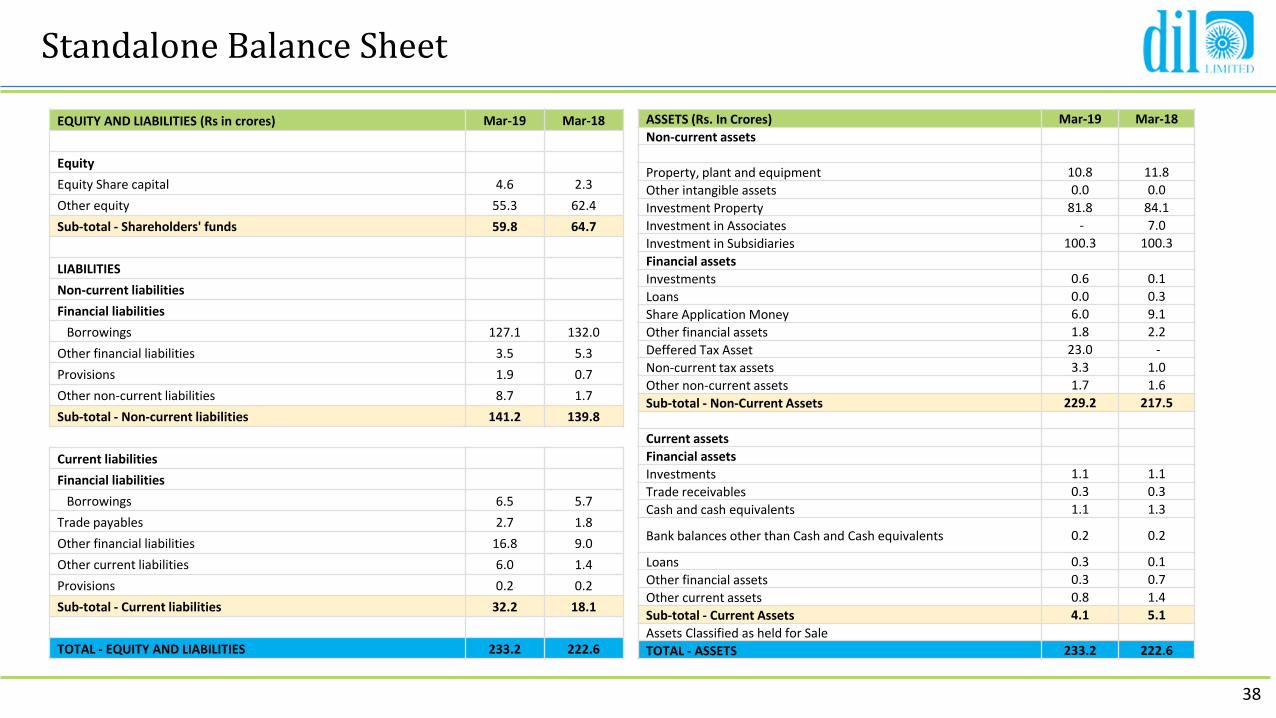
Standalone Balance Sheet
EQUITY AND LIABILITIES (Rs in crores) Mar-19 Mar-18
Equity
Equity Share capital 4.6 2.3
Other equity 55.3 62.4
Sub-total - Shareholders' funds 59.8 64.7
LIABILITIES
Non-current liabilities
Financial liabilities
Borrowings 127.1 132.0
Other financial liabilities 3.5 5.3
Provisions 1.9 0.7
Other non-current liabilities 8.7 1.7
Sub-total - Non-current liabilities 141.2 139.8
Current liabilities
Financial liabilities
Borrowings 6.5 5.7
Trade payables 2.7 1.8
Other financial liabilities 16.8 9.0
Other current liabilities 6.0 1.4
Provisions 0.2 0.2
Sub-total - Current liabilities 32.2 18.1
TOTAL - EQUITY AND LIABILITIES 233.2 222.6
ASSETS (Rs. In Crores) Mar-19 Mar-18
Non-current assets
Property, plant and equipment 10.8 11.8
Other intangible assets 0.0 0.0
Investment Property 81.8 84.1
Investment in Associates - 7.0
Investment in Subsidiaries 100.3 100.3
Financial assets
Investments 0.6 0.1
Loans 0.0 0.3
Share Application Money 6.0 9.1
Other financial assets 1.8 2.2
Deffered Tax Asset 23.0 -
Non-current tax assets 3.3 1.0
Other non-current assets 1.7 1.6
Sub-total - Non-Current Assets 229.2 217.5
Current assets
Financial assets
Investments 1.1 1.1
Trade receivables 0.3 0.3
Cash and cash equivalents 1.1 1.3
Bank balances other than Cash and Cash equivalents 0.2 0.2
Loans 0.3 0.1
Other financial assets 0.3 0.7
Other current assets 0.8 1.4
Sub-total - Current Assets 4.1 5.1
Assets Classified as held for Sale
TOTAL - ASSETS 233.2 222.6

39
Performance Highlights
40
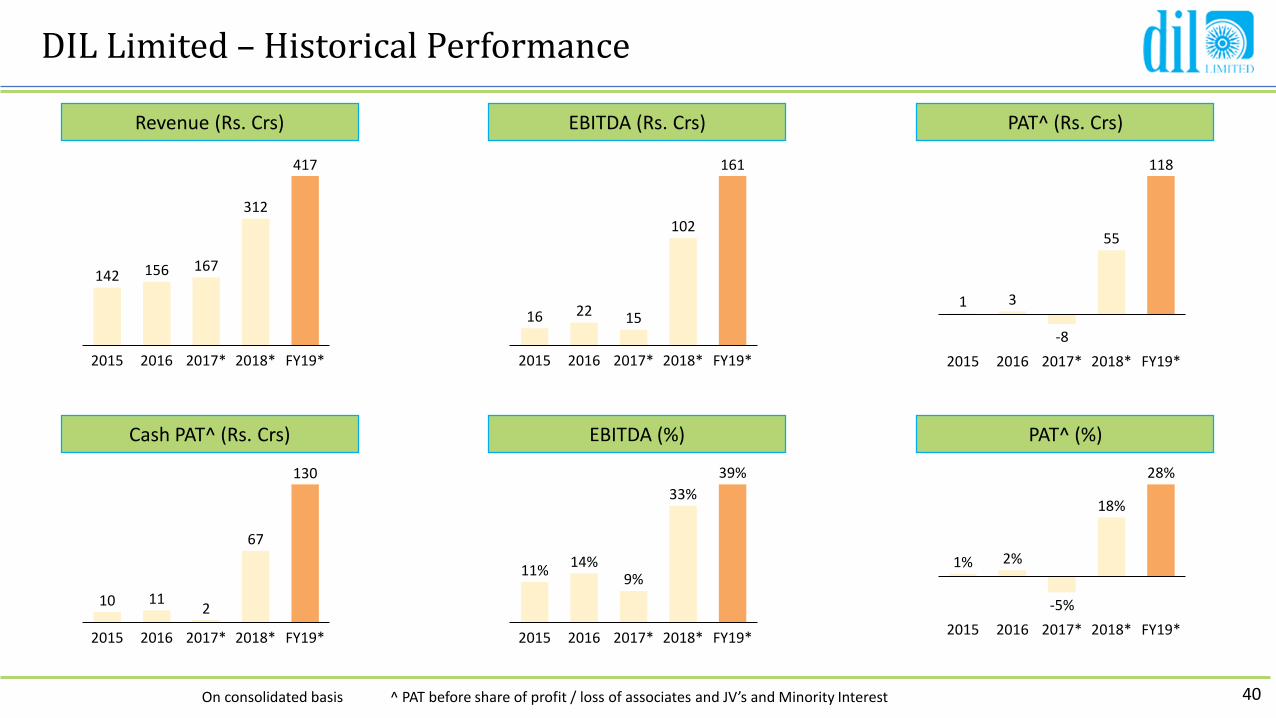
DIL Limited – Historical Performance
142 156 167
312
417
2015 FY19*2016 2018*2017*
16 22 15
102
161
2017*2015 2016 2018* FY19*
33%
2015
11%
2018*2016 2017* FY19*
14%9%
39%
1 3
-8
55
118
20162015 FY19*2017* 2018*
FY19*2015 2016 2017* 2018*
1% 2%
-5%
18%
28%
10 112
67
130
20162015 2018*2017* FY19*
Revenue (Rs. Crs) EBITDA (Rs. Crs) PAT^ (Rs. Crs)
Cash PAT^ (Rs. Crs) EBITDA (%) PAT^ (%)
On consolidated basis ^ PAT before share of profit / loss of associates and JV’s and Minority Interest

Particulars (Rs. Crs) FY19 FY18 YoY
Revenue 404.7 302.7 33.7%
Other Income 12.4 8.9
Total Revenue 417.0 311.6 33.8%
Raw Material 92.3 79.8
Employee Expenses 53.2 39.8
Other Expenses 110.4 90.0
EBITDA 161.2 102.0 58.1%
EBITDA Margin % 38.7% 32.7%
Depreciation 11.9 12.4
EBIT 149.4 89.6 66.7%
EBIT Margin % 35.8% 28.8%
Finance Cost 20.7 13.6
PBT 128.7 76.0 69.4%
Tax 10.8 21.1
PAT 117.9 54.8 115.0%
PAT Margin % 28.3% 17.6%
Share of profit /(loss) of JV’s and Associates -0.4 -8.5
PAT after share of profit / (loss) of JV’s and Associates 117.47 46.34 153.5%
Minority Interest -7.1 -12.6
PAT after MI 110.36 33.71 227.3%
EPS (in Rs.) 120.31 36.75
41
Consolidated Profit and Loss
42
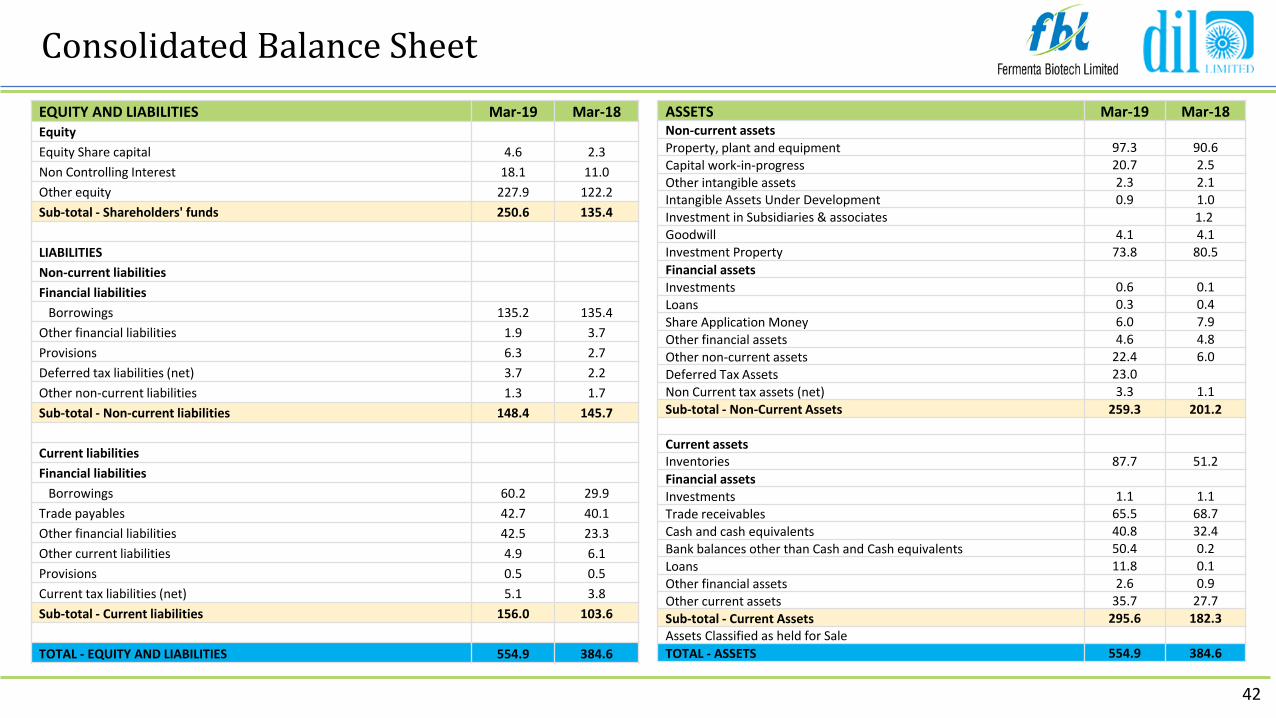
Consolidated Balance Sheet
EQUITY AND LIABILITIES Mar-19 Mar-18Equity
Equity Share capital 4.6 2.3
Non Controlling Interest 18.1 11.0
Other equity 227.9 122.2
Sub-total - Shareholders' funds 250.6 135.4
LIABILITIES
Non-current liabilities
Financial liabilities
Borrowings 135.2 135.4
Other financial liabilities 1.9 3.7
Provisions 6.3 2.7
Deferred tax liabilities (net) 3.7 2.2
Other non-current liabilities 1.3 1.7
Sub-total - Non-current liabilities 148.4 145.7
Current liabilities
Financial liabilities
Borrowings 60.2 29.9
Trade payables 42.7 40.1
Other financial liabilities 42.5 23.3
Other current liabilities 4.9 6.1
Provisions 0.5 0.5
Current tax liabilities (net) 5.1 3.8
Sub-total - Current liabilities 156.0 103.6
TOTAL - EQUITY AND LIABILITIES 554.9 384.6
ASSETS Mar-19 Mar-18Non-current assetsProperty, plant and equipment 97.3 90.6
Capital work-in-progress 20.7 2.5
Other intangible assets 2.3 2.1Intangible Assets Under Development 0.9 1.0Investment in Subsidiaries & associates 1.2Goodwill 4.1 4.1Investment Property 73.8 80.5
Financial assetsInvestments 0.6 0.1
Loans 0.3 0.4
Share Application Money 6.0 7.9
Other financial assets 4.6 4.8
Other non-current assets 22.4 6.0
Deferred Tax Assets 23.0
Non Current tax assets (net) 3.3 1.1
Sub-total - Non-Current Assets 259.3 201.2
Current assetsInventories 87.7 51.2
Financial assetsInvestments 1.1 1.1
Trade receivables 65.5 68.7
Cash and cash equivalents 40.8 32.4
Bank balances other than Cash and Cash equivalents 50.4 0.2
Loans 11.8 0.1
Other financial assets 2.6 0.9
Other current assets 35.7 27.7
Sub-total - Current Assets 295.6 182.3Assets Classified as held for Sale
TOTAL - ASSETS 554.9 384.6
43
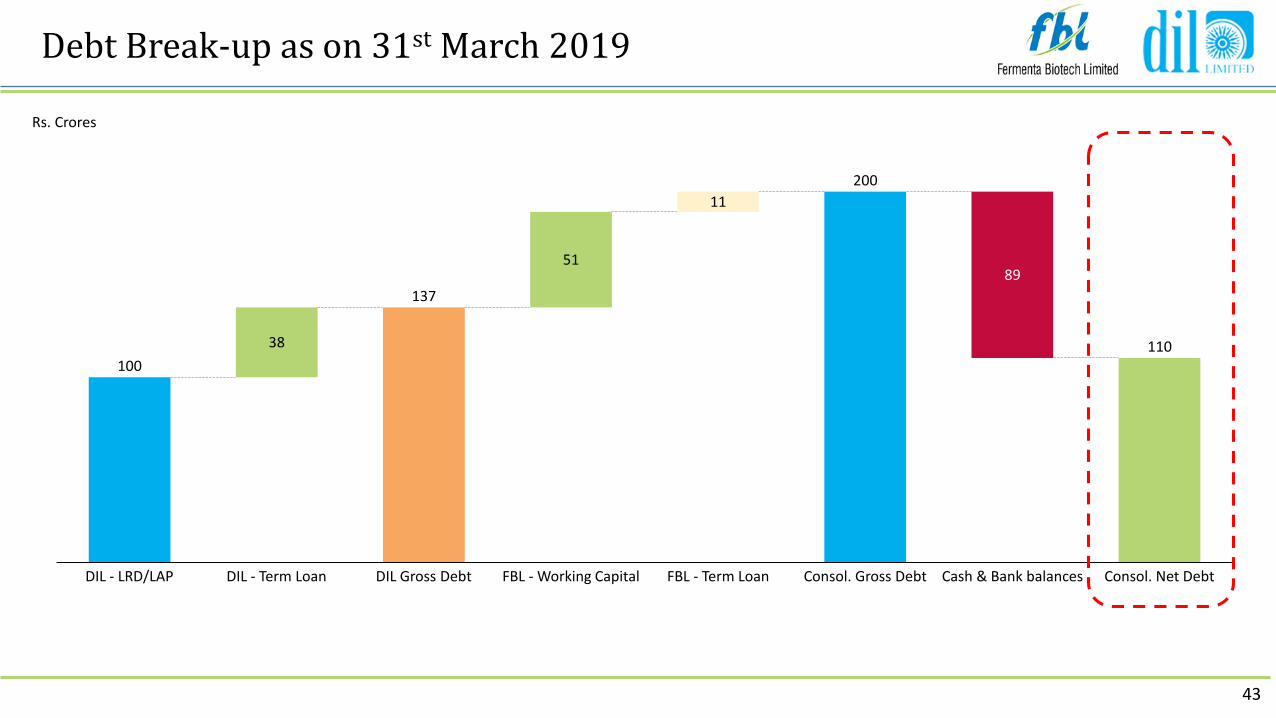
Debt Break-up as on 31st March 2019
100
137
200
11038
51
11
89
Consol. Gross DebtFBL - Working CapitalDIL - LRD/LAP DIL - Term Loan Consol. Net DebtCash & Bank balancesDIL Gross Debt FBL - Term Loan
Rs. Crores

Associates / Joint Venture Status
Agastya Films LLP (Joint Venture) Exited the Joint Venture as on 1st January 2019
Zela Wellness Pvt Ltd (Associate) No more an associate company post reduction of stake from 1st January 2019
Health & Wellness Pvt Ltd (Associate) All investments provided for as on 31st March 2019 financials
44
Status of Non-core Investments
45
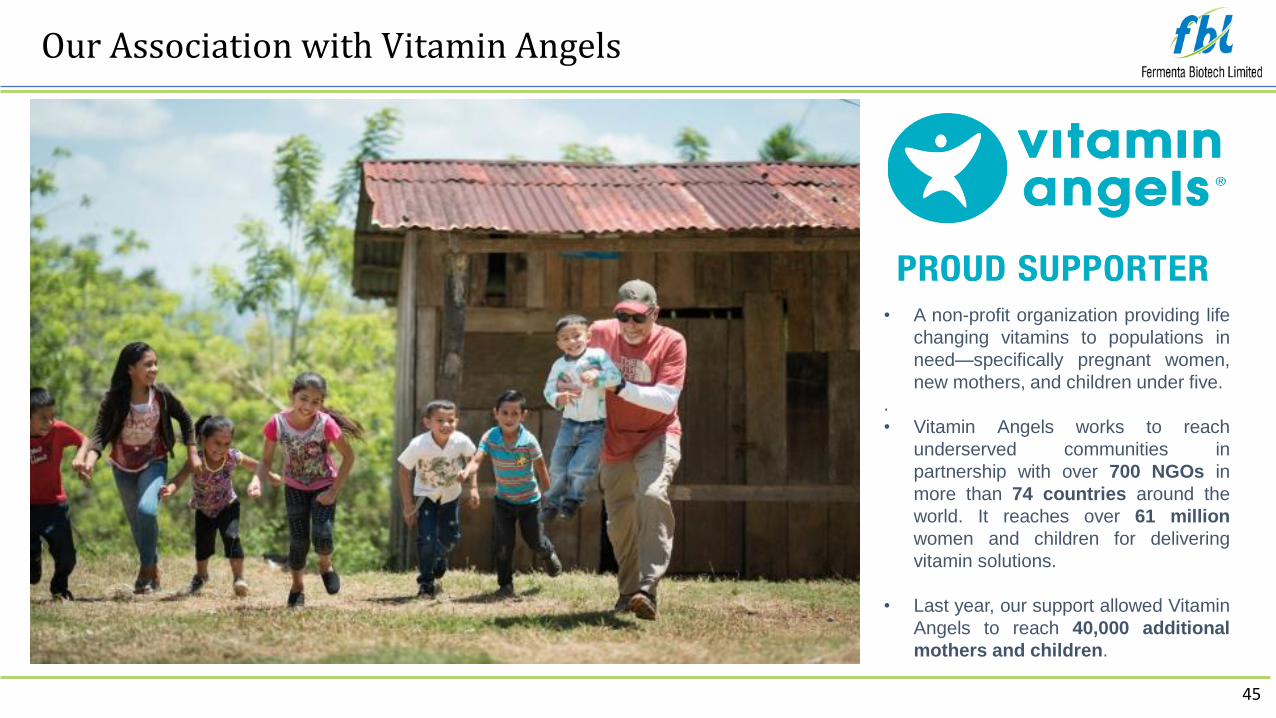
Our Association with Vitamin Angels
• A non-profit organization providing life
changing vitamins to populations in
need—specifically pregnant women,
new mothers, and children under five.
.
• Vitamin Angels works to reach
underserved communities in
partnership with over 700 NGOs in
more than 74 countries around the
world. It reaches over 61 million
women and children for delivering
vitamin solutions.
• Last year, our support allowed Vitamin
Angels to reach 40,000 additional
mothers and children.
46
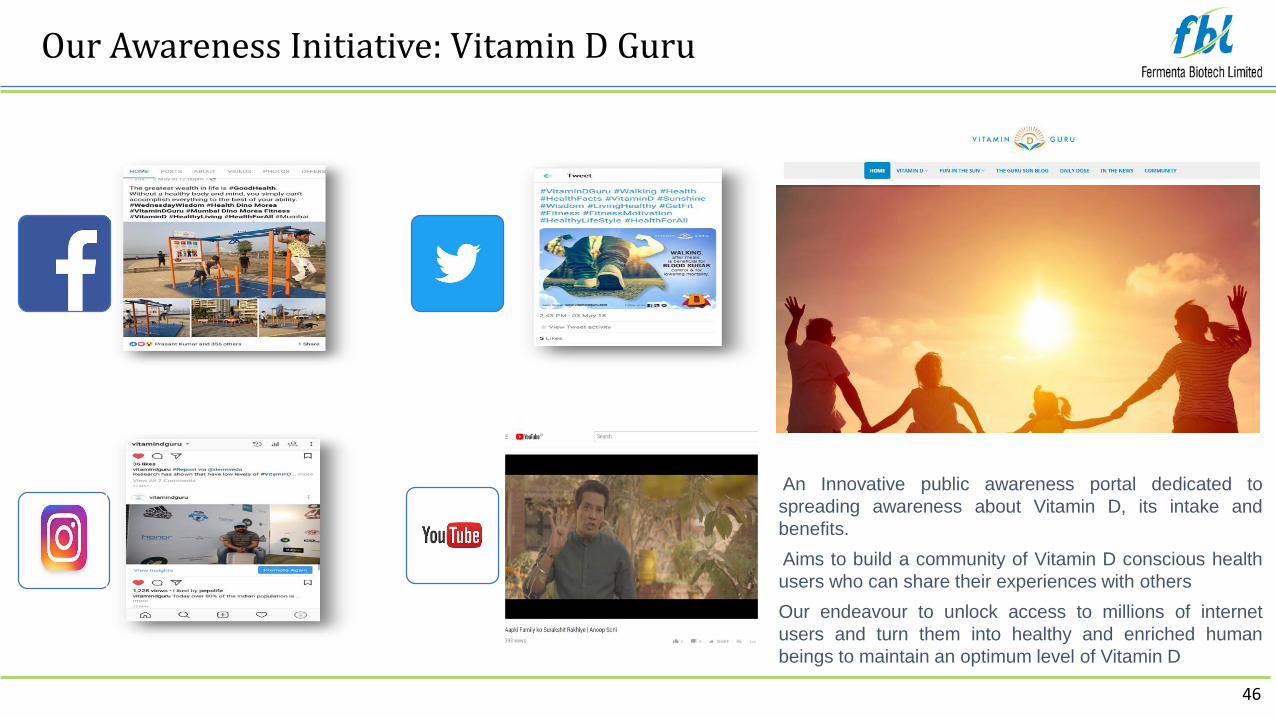
Our Awareness Initiative: Vitamin D Guru
An Innovative public awareness portal dedicated to
spreading awareness about Vitamin D, its intake and
benefits.
Aims to build a community of Vitamin D conscious health
users who can share their experiences with others
Our endeavour to unlock access to millions of internet
users and turn them into healthy and enriched human
beings to maintain an optimum level of Vitamin D
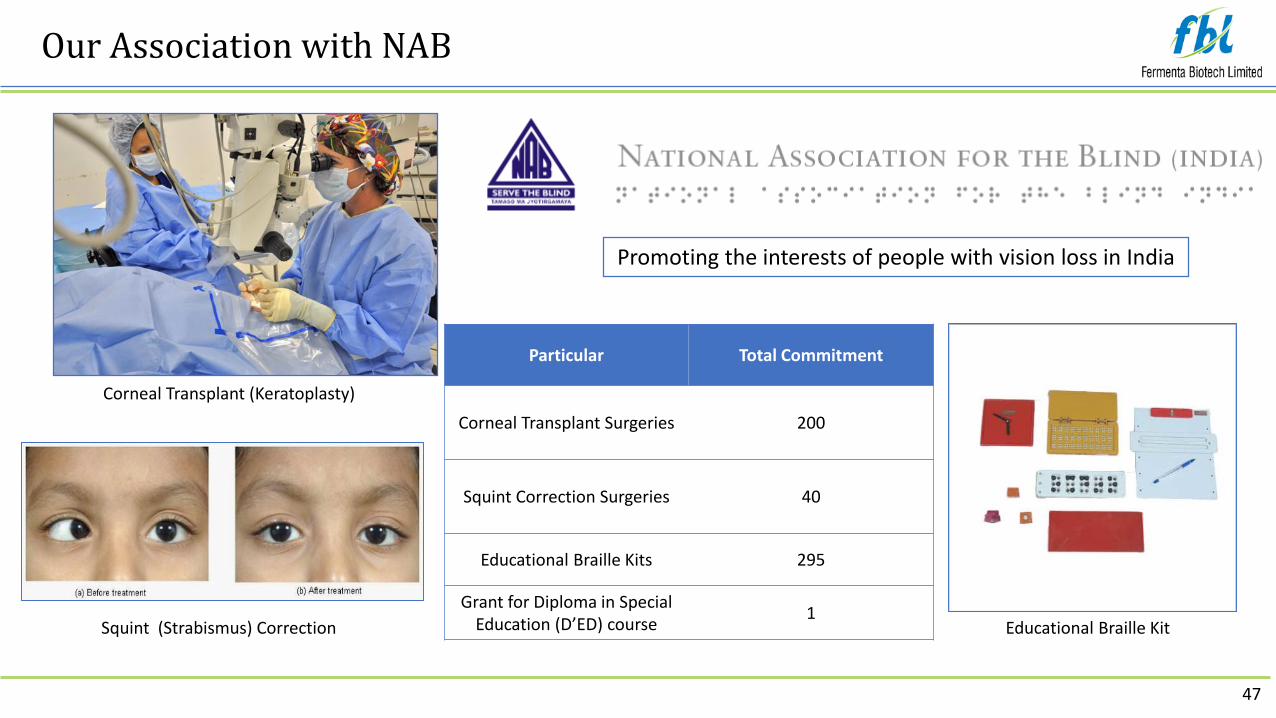
Our Association with NAB
Promoting the interests of people with vision loss in India
Particular Total Commitment
Corneal Transplant Surgeries 200
Squint Correction Surgeries 40
Educational Braille Kits 295
Grant for Diploma in Special Education (D’ED) course
1
Corneal Transplant (Keratoplasty)
Squint (Strabismus) Correction Educational Braille Kit
47

48
FBL’s Awards
Manufacturing – Pharmaceuticals
Excellence in CSRExcellence in
Export PromotionPharma International
Excellence
National Best Employer Brand Business Leader of the Year Top 101 HR Minds
Healthcare, Pharma and Biotech Manufacturing
India Pharma Awards 2018 on 12th December 2018
World HRD Congress 2018 on 16th February 2019Pride of Maharashtra: Best CEO of the Year 21st February 2019
Hindustan Times Thane RatnaAward on 31st January 2019
Great Place To Work® Certified
Insights Success Magazine – April 2019
Company : Investor Relations Advisors :
CIN No: L99999MH1951PLC008485
Mr. Sumesh [email protected]
www.dil.net
CIN - U74140MH2010PTC204285
Mr. Jigar [email protected]+91 9920602034
www.sgapl.net
49