Embed Size (px)
Citation preview
Diminishing Returns in K-12 Education
Has Wisconsin hit a wall where an additional dollar in education spending
will not bring improvements in student outcomes?
Martin F. Lueken, Ph.D.
Education Research Director
Rick Esenberg President
CJ Szafir
Education Policy Director
April 2, 2015

2
About the Wisconsin Institute for Law & Liberty
WILL is a nonprofit law and policy center based in Milwaukee that advocates for individual liberty,
constitutional rights, limited government, the rule of law, and a robust civil society

3
Table of Contents
EXECUTIVE SUMMARY ........................................................................................................ 4
I. Introduction .................................................................................................................. 8
II. Wisconsin’s K-12 Education System ....................................................................... 9
a. The U.S. Spends More than Others, Lags in Results .................................................. 9
b. Wisconsin: A High Price for Mediocrity .................................................................... 13
i. A microcosm of the United States ........................................................................ 13
ii. Global Report Card results .................................................................................. 14
III. Wisconsin can no longer spend its way to a better education ..................... 19
a. Per-Pupil Spending and ACT Scores ......................................................................... 19
b. Econometric Model: The Relationship Between Spending and Student Outcomes 21
IV. Can More School Choice Revitalize the Wisconsin Education System? .. 26
a. School Choice in Milwaukee: Better Results for Less Money .................................. 26
i. Funding disparities between schools ................................................................. 26
ii. Research on vouchers in Milwaukee .................................................................. 28
iii. Research on Wisconsin charter schools ............................................................. 29
b. Can School Choice Work Outside of Milwaukee and Racine? ................................. 30
c. Wide Support for School Choice ............................................................................... 32
V. Conclusion ................................................................................................................... 33
References .............................................................................................................................. 34
Appendix A ............................................................................................................................ 37
Appendix B ............................................................................................................................ 42
Appendix C ............................................................................................................................ 48
4
EXECUTIVE SUMMARY
Over the years, school choice has made significant gains in Milwaukee and Racine. Since the
voucher enrollment cap was lifted in 1998, the Milwaukee Parental Choice Program expanded by an
average of 11% per year to about 28,000 students. Enrollment in the Racine Parental Choice
Program more than doubled each year between 2012 and 2014. Yet, throughout Wisconsin, the
traditional “one-size-fits-all” public school remains dominant – 88% of all students in Wisconsin
are enrolled at a traditional public school. There is relatively little difference among these schools.
The districts hire teachers under similar compensation schemes, and teach the same curriculum. All
teachers must be licensed by the state, and teachers with licenses from out of state must jump
through many hoops to obtain a Wisconsin license. All schools are overseen by a central
administration.
Governor Scott Walker has proposed an expansion of independent charter schools and lifting the
caps on the statewide voucher program. Opponents to these alternatives to traditional public
schools argue that there is no reason to extend these choices to low-income families. They say that
the present model – in which such students go to the public school that is assigned to them with the
limited ability to move to another such school – is just fine. If it’s not broke, don’t fix it.
But the system is broke, particularly for low-income families. Public perceptions that most of
Wisconsin’s public schools are excellent or even above average are not true. This report examines
the state of K-12 education in Wisconsin and analyzes the effectiveness of spending on public
education. The main findings are:
1. The U.S. spends more on education than other nations, yet lags behind in student outcomes
(see page 9 of report). In 2011, the United States spent $11,841 for every student enrolled in
primary and secondary public schools. This level is the 5th highest among economically developed
countries (OECD) and $2,973 per pupil (or 34%) higher than the OECD average (p. 9). And yet,
despite spending lavishly, the United States has not created a world-class educational system.
Among the OECD countries, the U.S. ranks 27th in math, 17th in reading, and 20th in science (p.
10).
These struggles abroad are reflected at home. Less than one-third of students in the United States
are proficient in math and reading. The number of children born into low-income families who
eventually “beat the odds” by improving their educational outcomes is lower in the United States
than most every other country (p. 12). Moreover, employers complain about not finding people
with the skills needed for their job openings.
2. The K-12 education system in Wisconsin is a microcosm of the United States (p. 13). In a
country that spends more on public education than nearly every other OECD country, Wisconsin
spends over $1,000 more than the U.S. average, ranking 16th out of 50 states. Yet, like the U.S.,
Wisconsin does not seem to be receiving a good return when measured against global benchmarks.
When students in Wisconsin’s K-12 education system are compared to students in other
economically developed countries, it becomes evident that Wisconsin is spending a lot for, at best,
5
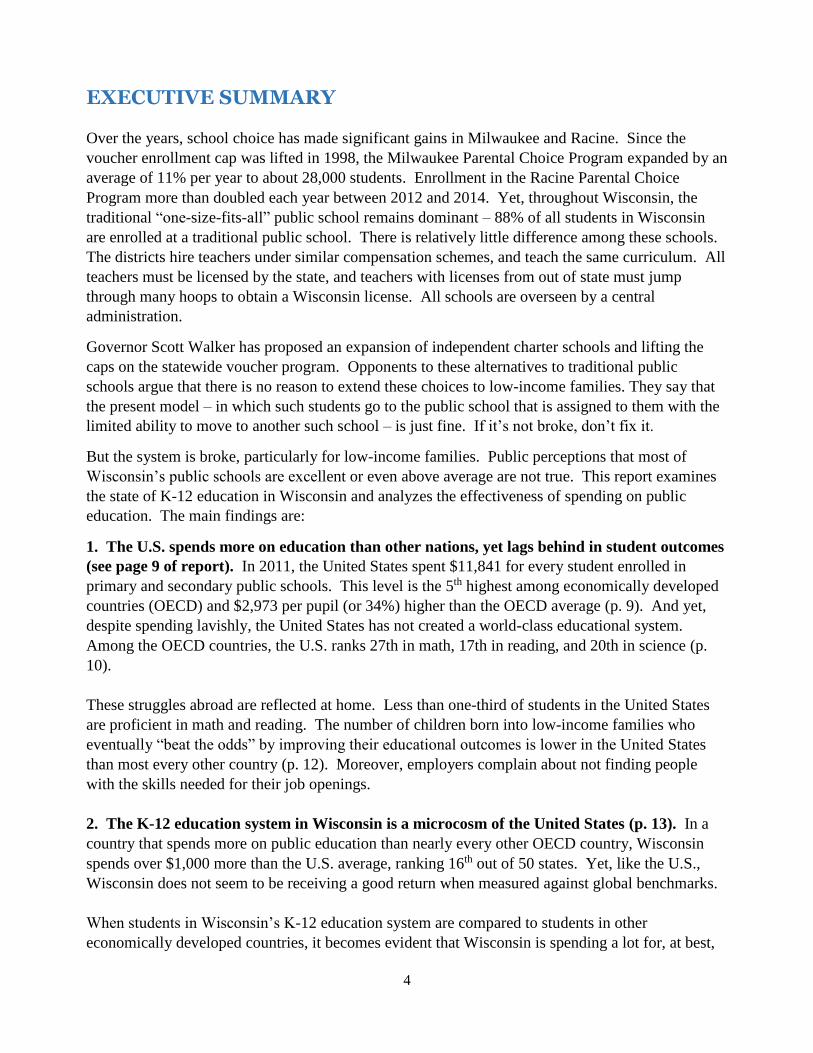
mediocre outcomes. By using OECD data from the Global Report Card, we were able to compare
the average student in Wisconsin and in individual school districts to those in other economically
developed countries. The average public school student in Wisconsin scores better than only 52%
of students in the international group on reading and 47% of students in math. While this could be
defended as average – for those willing to settle for mediocrity – remember that Wisconsin spends
$3,078 more per pupil than these other countries. The average student in 10 of the largest school
districts in Wisconsin scores lower than half of all students in the international group in math – even
though these districts spend well above the OECD average (see graph below).
These results are worse when Wisconsin is compared to Canada, a country that resembles the U.S.,
as well as being the U.S.’s largest trading partner, and other countries. Overall, the average student
in Wisconsin scores higher than only 39% of the Canadian students in math and 41% in reading (p.
17). What about Wisconsin’s best school districts? The average student in only 4 of the top 20
school districts reaches the 75th percentile in the international group of students (p. 17). The
average student in Mequon-Thiensville, for example, scores higher than 55% of all students in
Singapore, 66% in Finland, and 66% in Switzerland.
In short, when stacked up against our international competitors, there appears to be trends – despite
outspending the OECD nations: Wisconsin’s lowest-performing schools are struggling to compete,
the average Wisconsin student is very mediocre, and Wisconsin’s best schools are not the best in the
world. These outcomes do not bode well in a 21st century global economy.
3. Econometric Modeling: The relationship between spending and student outcomes in
Wisconsin (p. 21). To improve academic outcomes, the political instinct of many is to call for
increased spending. In order to further understand the effect of public spending in Wisconsin on
6
education, we search for evidence for a relationship between schools districts’ educational spending
and student academic achievement. To do this, we employed a set of econometric models using a
rich, longitudinal data set. These data allow us to employ statistical techniques that control for any
unobserved or unmeasured factors that do not change over time (i.e. so-called fixed effects) in
addition to the relevant factors that we can observe. We analyze the impact of spending on different
student outcomes - ACT test scores, graduation rates, college readiness in reading, math, English,
and science, and WKCE math and reading scores. We observed the following results from our
econometric analysis (p. 23):
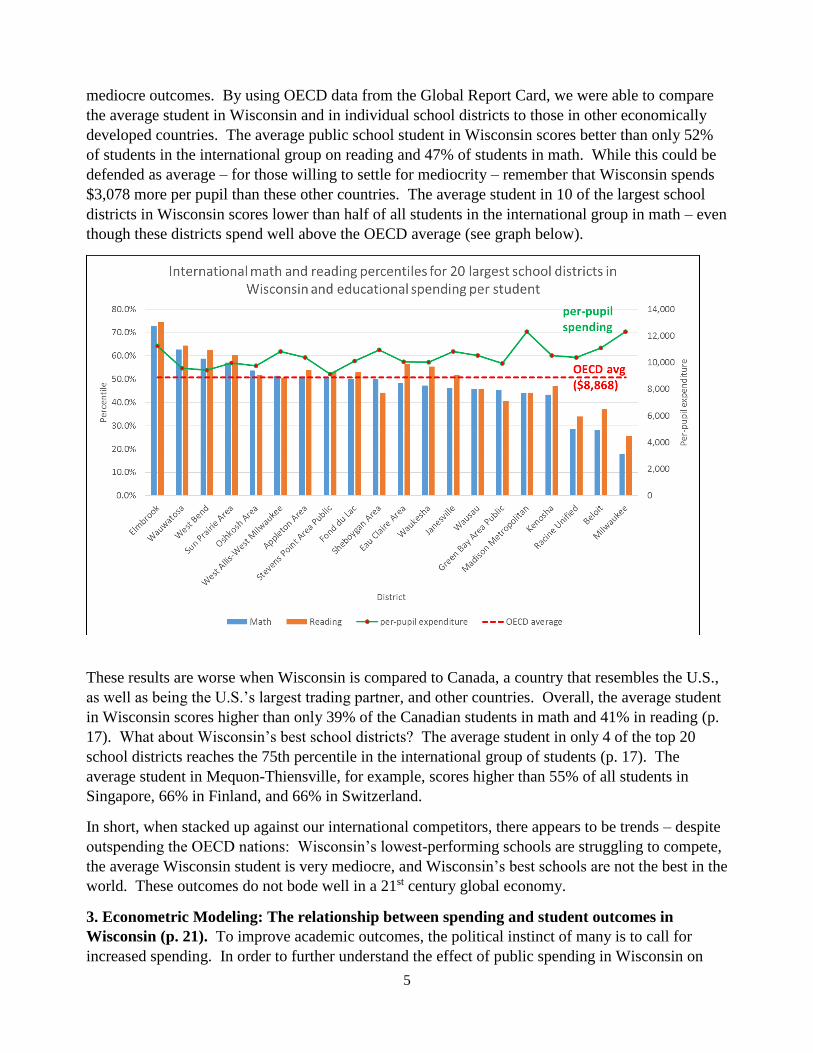
No consistent relationship between
real (i.e. inflation-adjusted) per-pupil
spending by districts and student
performance on the ACT.
No consistent relationship between
real per-pupil spending by districts
and the proportion of students in a
district who finish high school as
college-ready.
No consistent relationship between
real per-pupil spending by districts
and students’ performance on the
WKCE exams.
No consistent relationship between
real per-pupil spending by districts
and graduation rates.
Has Wisconsin hit a wall where an additional dollar in education spending will not bring
improvements in student outcomes? The results of our research indicate that this may be the case.
4. Is more school choice the answer to Wisconsin’s woes? (p. 26) Our study concludes that
Wisconsin’s K-12 public education system needs drastic reform. We spend too much for too little
in student achievement. While school choice – the allocation of vouchers and growth of
independent charter schools – may not be a silver bullet, it could be part of the solution. Consider:
More for less. Significant - and unfair - funding disparities exist between traditional public schools
and private schools in the choice program, as well as independent charter schools (p. 26). Yet,
despite the disparity, research shows that student outcomes in charter and private schools in the
choice program are as good, if not better, than public schools.
A study released recently by the Center for Research on Education Outcomes at Stanford University
found that students in Milwaukee charter schools experienced greater academic growth than similar
students in traditional public schools (p. 29) (CREDO, 2015). In addition, research by the School
Choice Demonstration Project indicated that students who used a voucher to attend a private school
in Milwaukee perform at least as well academically as a matched group of similar peers in
traditional public schools (p. 28) (Wolf, 2012). They were also more likely to graduate from high
school in four years, enroll in a 4-year college, and persist in college through the first year (Cowen
et al., 2012). These findings are similar to those studies elsewhere. There have been at least
-4-2
02
4
AC
T s
core
-5000 0 5000 10000change in per-pupil expenditures (inflation-adjusted)
Districts Fitted values
Scatterplot: district spending vs. ACT scores
slope = -0.0000226; p=0.611
7
thirteen studies based on random assignment (i.e. the “gold standard” of research), and all but one
of those studies showed that vouchers had beneficial outcomes (the other study found no impact).
School choice could work in rural Wisconsin. If school choice can succeed in Milwaukee – which
the vast majority of highly respected studies indicate as much – can it have an impact in rural and
small town areas in Wisconsin? There is likely to be a marketplace for it, with a demand for
vouchers from families and a supply line of
private schools.
In two-thirds of Wisconsin’s school districts,
the number of children (5 to 17 year old) in
poverty increased by at least 50% during the
last decade. As a result, more than 107,000
children outside Milwaukee and Racine who
live under the Federal Poverty Limit would
likely qualify for a voucher under Governor
Walker’s proposed budget (p. 31). On the
supply side, private schooling is not only an
urban or suburban phenomenon; almost half (47%) of all private schools in Wisconsin are located in
towns and rural districts (p. 31).
School choice is popular. Poll after poll shows that a majority of Wisconsinites, as well as
Americans nationwide, support school choice. In every case but one, the margin of support for
school choice policies in Wisconsin is positive and in the double-digits (p. 32). In one Wisconsin
poll, the margin of support for the formation of charter schools was 17 percentage points (Howell,
2012). Another poll found that 63% of respondents in Wisconsin favored the use the tax dollars to
send their children to the public or private school of their choice (NMB Research, 2014). The
majority of respondents in this poll favored expanding the statewide parental choice program to
include “any working class Wisconsin parent,” and 56% favored eliminating the current cap.
While one-size-fits-all government educational systems may have been enough to educate children
in the past, this model is outdated for today’s rapidly changing world. There is clearly a need for
systemic change that creates a more robust and responsive education for different people.
8
I. Introduction
Over the years, school choice has made significant gains in Milwaukee and Racine. Since its
enrollment cap was lifted in 1998, the Milwaukee Parental Choice Program (MPCP) has expanded
by an average of 11% per year to about 28,000 students, while enrollment in the Racine Parental
Choice Program (RPCP) more than doubled each year between 2012 and 2014. In the Wisconsin
Parental Choice Program (WPCP), the number of applicants significantly outnumbered the seats
available. Applications totaled over six times the number of new seats in the program in 2014
(School Choice Wisconsin, 2014). Charter school enrollment has expanded by about 10% each
year over the last ten years to over 44,000 students in 2013.
Yet, the number of children exercising choice represents a small portion of students in Wisconsin.
State law currently limits vouchers by geography, income-level, and, throughout most of the state,
arbitrary caps.1 It prohibits independent charter schools outside of Milwaukee.2 There are still
many more Wisconsin families who have no – or very limited – options for their children.
By and large, the traditional public school K-12
“one-size-fits-all” education model remains
dominant. Throughout Wisconsin, 88% of all
students are enrolled at a traditional public
school.3 Schools within most public school
districts are governed by the same board, hire
teachers under similar compensation schemes, and
teach the same curriculum. All schools are
overseen by a central administration. All teachers
must be licensed by the state. In fact, the
Wisconsin Constitution requires some sort of
uniformity.4 The problem is that we still do not know how to best educate kids; yet, we impose a
top-down one-size-fits-all system with public education. There is no single model, certainly none
that has been proven, to be superior to any other model for educating all students.
But Governor Walker’s proposed budget would expand independent public charter schools and
lifting the caps on the statewide voucher program. Under the Walker plan, more than 107,000
1 The Milwaukee Parental Choice Program (MPCP) started in 1991 under Act 336 and is one of the oldest education
voucher programs in the nation (LFB, 2013). The Racine Parental Choice Program (RPCP) began in 2011-2012. These
two programs service students who reside within the Milwaukee and Racine public school districts. In 2013, the
Wisconsin Parental Choice Program (WPCP) was launched and services students who reside outside of the Racine and
Milwaukee school districts. There are currently no caps on the MPCP and RPCP while access to the WPCP is presently
limited to 1,000 students. 2 Independent charter schools must be located within the boundaries of Milwaukee Public Schools (LFB, 2015). 3 Act 10 gives school districts greater flexibility to move away from the “one-size fits all” model. However, this reform
is still relatively new and its impact cannot yet be measured yet. In addition, there are a small number of public schools
in Milwaukee that differ from the traditional education model, such as Montessori schools and International
Baccalaureate schools. 4 Article X, Section 3 of the Wisconsin Constitution defines public schools as the following: “The legislature shall
provide by law for the establishment of district schools, which shall be as nearly uniform as practicable.”
9
children living outside of Milwaukee and Racine under the Federal Poverty Limit would likely
qualify for a voucher.5 Many of these children, over 42,000, are currently enrolled in failing
schools by state standards.6 It is worth considering whether such reforms are necessary. This
study analyzes the efficiency of the traditional Wisconsin K-12 education system.
II. Wisconsin’s K-12 Education System
a. The U.S. Spends More than Others, Lags in Results
In order to fully understand the Wisconsin education system, we first must explore the system in the
United States. Since 1966, per-pupil spending in constant dollars on public education in the U.S.
has increased four-fold (Springer, Houck, & Guthrie, 2008). This has resulted in the U.S. spending
more on education than nearly every other economically developed country on education. In 2011,
the United States spent, on average, $11,841 for every student enrolled in primary and secondary
public schools (OECD, 2015). This level is the
5th highest among OECD countries (Figure 1)
and $2,973 per pupil (or 34%) higher than the
OECD average.7
5 This estimate excludes the Milwaukee Public Schools and Racine Unified school districts. With these districts, the
number exceeds 156,000. The estimate is based on data from the Small Area Income & Poverty Estimates from the U.S.
Census Bureau, http://www.census.gov/did/www/saipe/ 6 Figure based on school-level State Report Card data from the Wisconsin Department of Public Instruction (DPI),
https://apps2.dpi.wi.gov/reportcards/ 7 When making comparisons across countries, the OECD reflects total employer compensation for teachers and includes
job-related health insurance. About 10% of compensation for U.S. teachers involves the cost of providing health and
related insurance (U.S. Bureau of Labor Statistics, 2014). While the analogous cost in other OECD countries are likely
somewhat lower, the difference could play only a modest role in boosting U.S. spending relative to other countries.
Researchers at the OECD were helpful in providing us with this information. Even if all of the United States’ per pupil
expenditure were for teacher compensation (and it is not) and international numbers included nothing for health
insurance (they do), a reduction of 10% would not affect the U.S.’s rankings much, if at all. We tested this. Using
expenditure data from the U.S. Department of Education on salaries and benefits in public elementary and secondary
schools, a back-of-the-envelope calculation indicates that the full (10%) reduction in total compensation would reduce
the per-pupil expenditure figure reported by the OECD by roughly 7%. The new figure is about $11,000, not enough to
bump the U.S. ranking down.
10
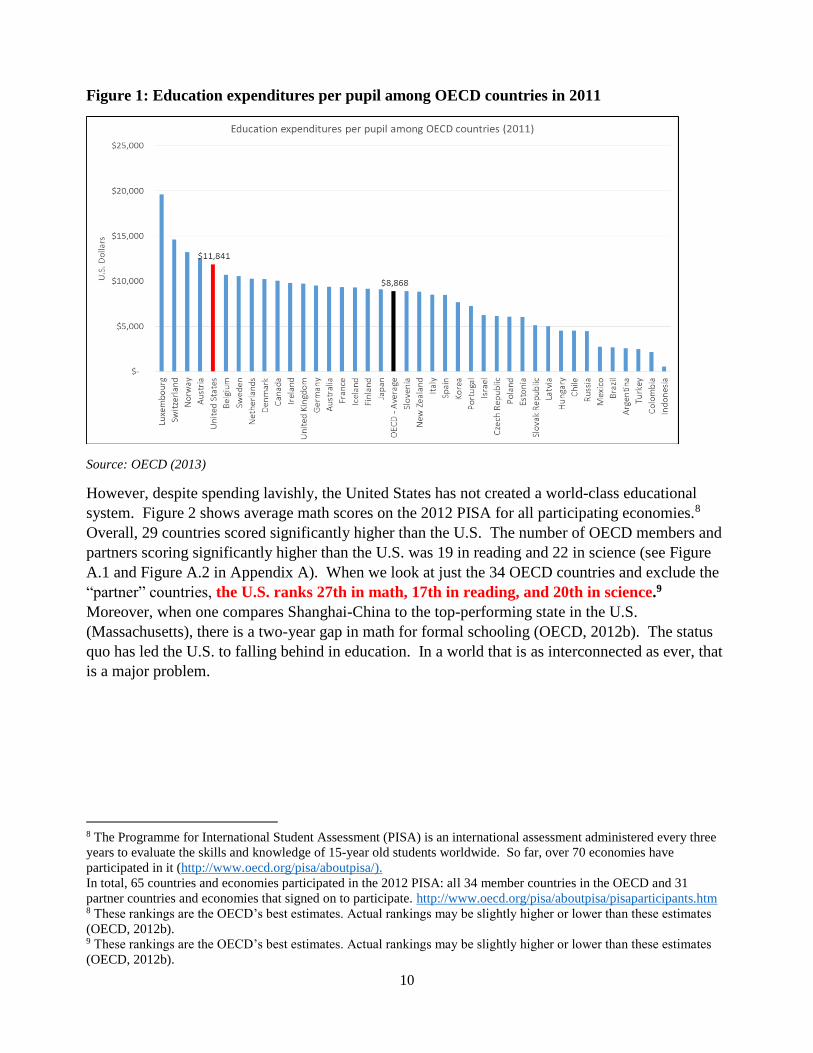
Figure 1: Education expenditures per pupil among OECD countries in 2011
Source: OECD (2013)
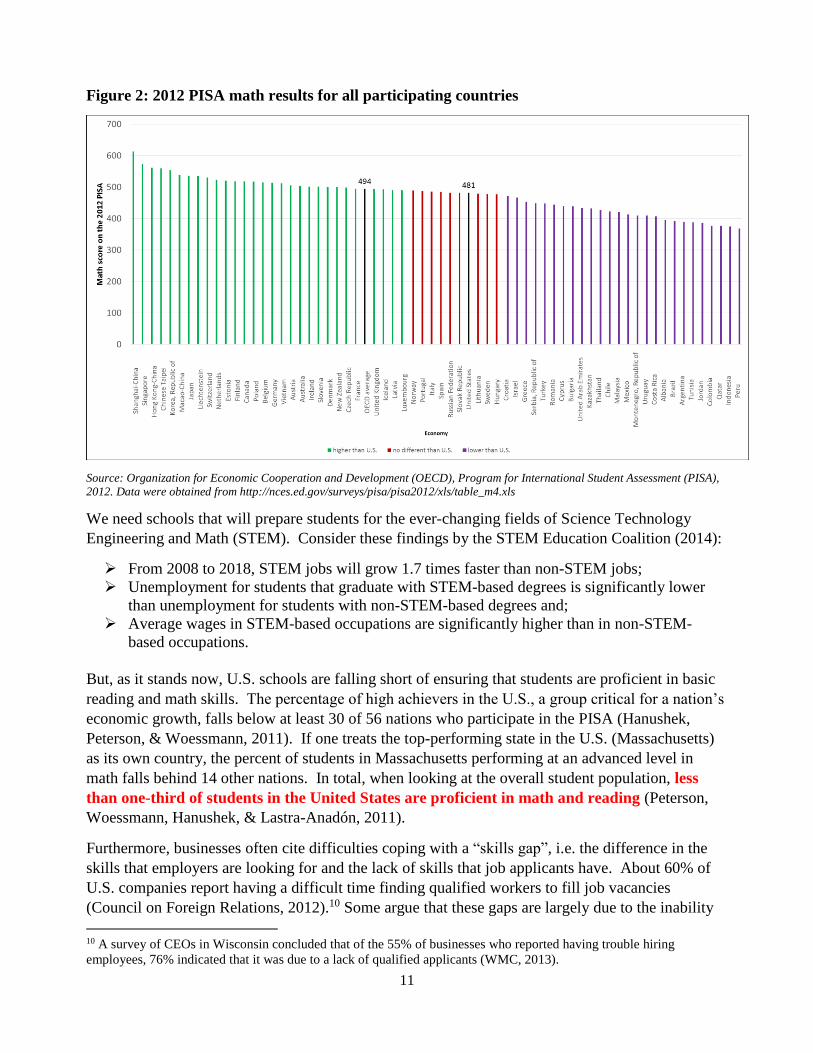
However, despite spending lavishly, the United States has not created a world-class educational
system. Figure 2 shows average math scores on the 2012 PISA for all participating economies.8
Overall, 29 countries scored significantly higher than the U.S. The number of OECD members and
partners scoring significantly higher than the U.S. was 19 in reading and 22 in science (see Figure
A.1 and Figure A.2 in Appendix A). When we look at just the 34 OECD countries and exclude the
“partner” countries, the U.S. ranks 27th in math, 17th in reading, and 20th in science.9
Moreover, when one compares Shanghai-China to the top-performing state in the U.S.
(Massachusetts), there is a two-year gap in math for formal schooling (OECD, 2012b). The status
quo has led the U.S. to falling behind in education. In a world that is as interconnected as ever, that
is a major problem.
8 The Programme for International Student Assessment (PISA) is an international assessment administered every three
years to evaluate the skills and knowledge of 15-year old students worldwide. So far, over 70 economies have
participated in it (http://www.oecd.org/pisa/aboutpisa/).
In total, 65 countries and economies participated in the 2012 PISA: all 34 member countries in the OECD and 31
partner countries and economies that signed on to participate. http://www.oecd.org/pisa/aboutpisa/pisaparticipants.htm 8 These rankings are the OECD’s best estimates. Actual rankings may be slightly higher or lower than these estimates
(OECD, 2012b). 9 These rankings are the OECD’s best estimates. Actual rankings may be slightly higher or lower than these estimates
(OECD, 2012b).
11
Figure 2: 2012 PISA math results for all participating countries
Source: Organization for Economic Cooperation and Development (OECD), Program for International Student Assessment (PISA),
2012. Data were obtained from http://nces.ed.gov/surveys/pisa/pisa2012/xls/table_m4.xls
We need schools that will prepare students for the ever-changing fields of Science Technology
Engineering and Math (STEM). Consider these findings by the STEM Education Coalition (2014):
From 2008 to 2018, STEM jobs will grow 1.7 times faster than non-STEM jobs;
Unemployment for students that graduate with STEM-based degrees is significantly lower
than unemployment for students with non-STEM-based degrees and;
Average wages in STEM-based occupations are significantly higher than in non-STEM-
based occupations.
But, as it stands now, U.S. schools are falling short of ensuring that students are proficient in basic
reading and math skills. The percentage of high achievers in the U.S., a group critical for a nation’s
economic growth, falls below at least 30 of 56 nations who participate in the PISA (Hanushek,
Peterson, & Woessmann, 2011). If one treats the top-performing state in the U.S. (Massachusetts)
as its own country, the percent of students in Massachusetts performing at an advanced level in
math falls behind 14 other nations. In total, when looking at the overall student population, less
than one-third of students in the United States are proficient in math and reading (Peterson,
Woessmann, Hanushek, & Lastra-Anadón, 2011).
Furthermore, businesses often cite difficulties coping with a “skills gap”, i.e. the difference in the
skills that employers are looking for and the lack of skills that job applicants have. About 60% of
U.S. companies report having a difficult time finding qualified workers to fill job vacancies
(Council on Foreign Relations, 2012).10 Some argue that these gaps are largely due to the inability
10 A survey of CEOs in Wisconsin concluded that of the 55% of businesses who reported having trouble hiring
employees, 76% indicated that it was due to a lack of qualified applicants (WMC, 2013).

12
of enough people acquiring needed technical skills (Bessen, 2014). 11 In Wisconsin, researchers
projected a skills gap for computer science and information technology (Loritz, Nerad, Sletten, &
Cunha, 2013).
In addition to equipping a global workforce, a high-quality education can be a poor child’s one-way
ticket out poverty. But, our schools are not serving low-income children. When it comes to
advancing socio-economically disadvantaged students to the top, the U.S. is doing worse than many
countries. About 6% of students in all OECD countries were identified as “resilient,” i.e. a student
who both comes from a socio-economically disadvantaged background12 and “beats the odds” by
performing among the top 25% of all students in participating OECD countries (OECD, 2013). As
Figure 3 shows below, notwithstanding the much higher spending, only 5.2% of the students in the
U.S. “beat the odds.” Moreover, 36 countries – over half of participating countries and
economies – had higher proportions of resilient students than the U.S. To add another
perspective, 21% of disadvantaged students in the U.S. were resilient, whereas over 75% of all
disadvantaged students in Shanghai-China performed in the top 25% in the OECD world.13
Figure 3: Percentage of OECD countries’ students who are resilient
11 Others have argued that a skills gap does not exist (Levine, 2013), believing that employers are unaware of their own
markets or are “making it up.” A full response is beyond the scope of this paper, but we are comfortable with the
proposition that we ought to seek to beat – rather than simply match – international averages and achieve higher levels
of proficiency. This is particularly so if we are going to remain committed to spending more money than the rest of the
developed world. 12 Socio-economically disadvantaged students are defined by the OECD as those who are “in the bottom quarter of the
socio-economic distribution in their country, or one standard deviation below the average on the PISA index of
economic, social and cultural status” (OECD, 2013). 13 These proportions are estimated by multiplying the percentage values for each participant from Figure 3 by 4 and
follows Table 2.2 in OECD (2011). While this is a rough estimate, it allows us to get a sense of how many socio-
economically disadvantaged children are moving ahead.

13
Why the one-size-fits-all model of public education
is unsustainable in Wisconsin
Changing demographics in the population of the U.S.,
including Wisconsin, will pose a monumental
challenge that will have profound implications for K-
12 education (Ladner, 2015). A growing elderly
population and, to a lesser extent, a growing youth
population will increase the demand for government
spending on social services and income maintenance,
such as Medicare and Medicaid, Social Security,
public employee retirement benefits, and education.
But there will simply not be enough taxpayers to pay
for the desired increases in spending. In Wisconsin,
the population of people age 65 and older is projected
to increase by 70% by 2030. By then, the “age
dependency ratio” (the ratio of the number of non-
working people to the number of working people in
Wisconsin) will be 0.77. In other words, for almost
every 8 non-working people in Wisconsin, 10
working-age people will be supporting them. This
ratio in 2010 was 0.59, i.e., six non-working persons
for every ten who were working.
In short, Wisconsin will need to figure out how to
provide a higher quality of education at a lower cost.
Source: OECD (2013)
In short, we spend more in the United States, but do not see better results. Low-income students, in
particular, are not performing well.
b. Wisconsin: A High Price for Mediocrity
i. A microcosm of the United States
In terms of its structure, expenditures, and student outcomes, Wisconsin’s K-12 public education
system is a microcosm of the United States. Among a country that spends more than nearly every
other OECD country, Wisconsin spends over $1,000 more on public education than the average
state in the U.S. and ranks 16th out of 50 states in highest expenditures for public elementary
and secondary education.14
Like the United States, Wisconsin is getting a
poor return on this investment into education.
According to the DPI, two-thirds of all
students in Wisconsin are below proficient
in reading, and half are below proficient in
math.15 Like the United States, when
Wisconsin’s K-12 education system is
compared to those of economically developed
countries, it appears that we are paying a lot
for, at best, mediocrity. These outcomes are
not satisfactory in the 21st century global
economy. Students increasingly find
themselves competing for jobs with students
outside of the United States, especially as
jobs evolve and become more streamlined.
Moreover, changing demographics in the
composition of the workforce will strain our
social safety nets, thereby increasing the
burden placed on the next generations (see
box to right). We can no longer afford to
continue down the same path of spending
more for mediocre results.
14 Based on data from the U.S. Department of Education, National Center for Education Statistics, Common Core of
Data (CCD). 15 Matthew DeFour, “Less than half of state's students measure proficient under new national standards,” Wisconsin
State Journal, July 17, 2012. http://host.madison.com/news/local/education/local_schools/less-than-half-of-state-s-
students-measure-proficient-under/article_5c9a2860-cf9b-11e1-9250-0019bb2963f4.html
14
ii. Global Report Card results
The Global Report Card, created by researchers Jay P. Greene and Josh McGee from the University
of Arkansas, allows for comparisons of individual school districts in the United States with other
districts in the U.S. and other countries.16 The comparisons consist of average student achievement
scores in math and reading across the world.17 The Global Report Card is an invaluable tool that
conveys information about how competitive a state in the U.S. is with other countries.
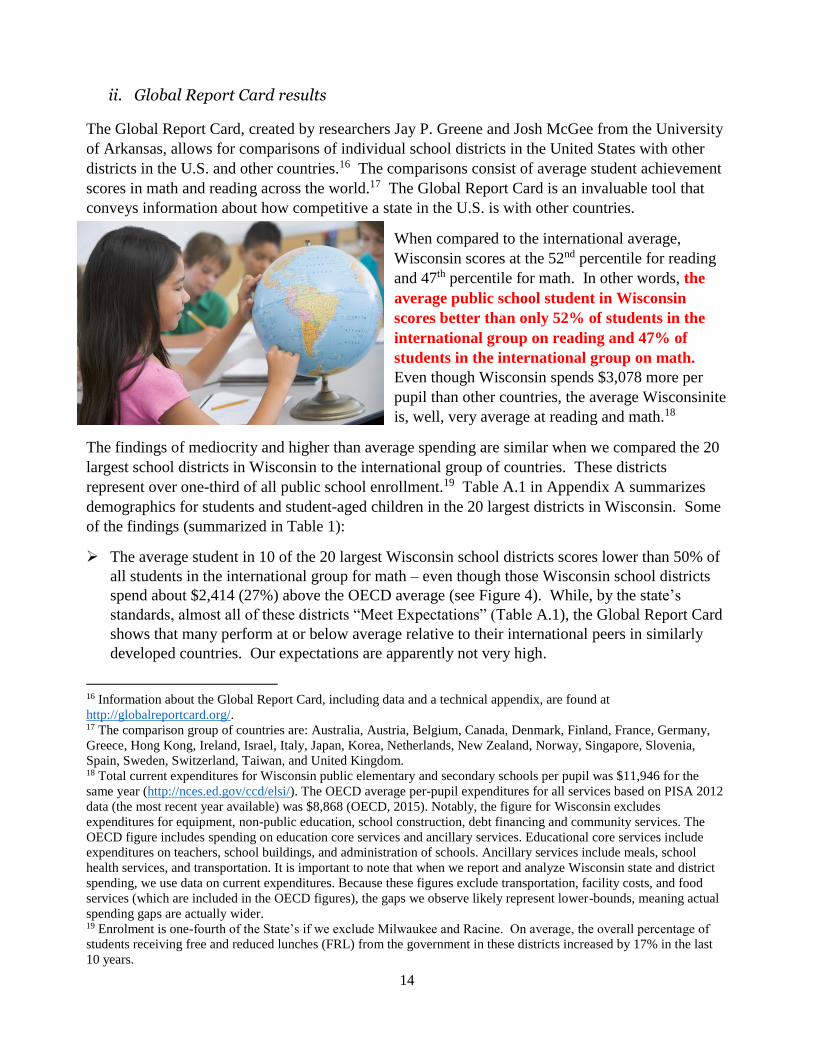
When compared to the international average,
Wisconsin scores at the 52nd percentile for reading
and 47th percentile for math. In other words, the
average public school student in Wisconsin
scores better than only 52% of students in the
international group on reading and 47% of
students in the international group on math.
Even though Wisconsin spends $3,078 more per
pupil than other countries, the average Wisconsinite
is, well, very average at reading and math.18
The findings of mediocrity and higher than average spending are similar when we compared the 20
largest school districts in Wisconsin to the international group of countries. These districts
represent over one-third of all public school enrollment.19 Table A.1 in Appendix A summarizes
demographics for students and student-aged children in the 20 largest districts in Wisconsin. Some
of the findings (summarized in Table 1):
The average student in 10 of the 20 largest Wisconsin school districts scores lower than 50% of
all students in the international group for math – even though those Wisconsin school districts
spend about $2,414 (27%) above the OECD average (see Figure 4). While, by the state’s
standards, almost all of these districts “Meet Expectations” (Table A.1), the Global Report Card
shows that many perform at or below average relative to their international peers in similarly
developed countries. Our expectations are apparently not very high.
16 Information about the Global Report Card, including data and a technical appendix, are found at
http://globalreportcard.org/. 17 The comparison group of countries are: Australia, Austria, Belgium, Canada, Denmark, Finland, France, Germany,
Greece, Hong Kong, Ireland, Israel, Italy, Japan, Korea, Netherlands, New Zealand, Norway, Singapore, Slovenia,
Spain, Sweden, Switzerland, Taiwan, and United Kingdom. 18 Total current expenditures for Wisconsin public elementary and secondary schools per pupil was $11,946 for the
same year (http://nces.ed.gov/ccd/elsi/). The OECD average per-pupil expenditures for all services based on PISA 2012
data (the most recent year available) was $8,868 (OECD, 2015). Notably, the figure for Wisconsin excludes
expenditures for equipment, non-public education, school construction, debt financing and community services. The
OECD figure includes spending on education core services and ancillary services. Educational core services include
expenditures on teachers, school buildings, and administration of schools. Ancillary services include meals, school
health services, and transportation. It is important to note that when we report and analyze Wisconsin state and district
spending, we use data on current expenditures. Because these figures exclude transportation, facility costs, and food
services (which are included in the OECD figures), the gaps we observe likely represent lower-bounds, meaning actual
spending gaps are actually wider. 19 Enrolment is one-fourth of the State’s if we exclude Milwaukee and Racine. On average, the overall percentage of
students receiving free and reduced lunches (FRL) from the government in these districts increased by 17% in the last
10 years.
15
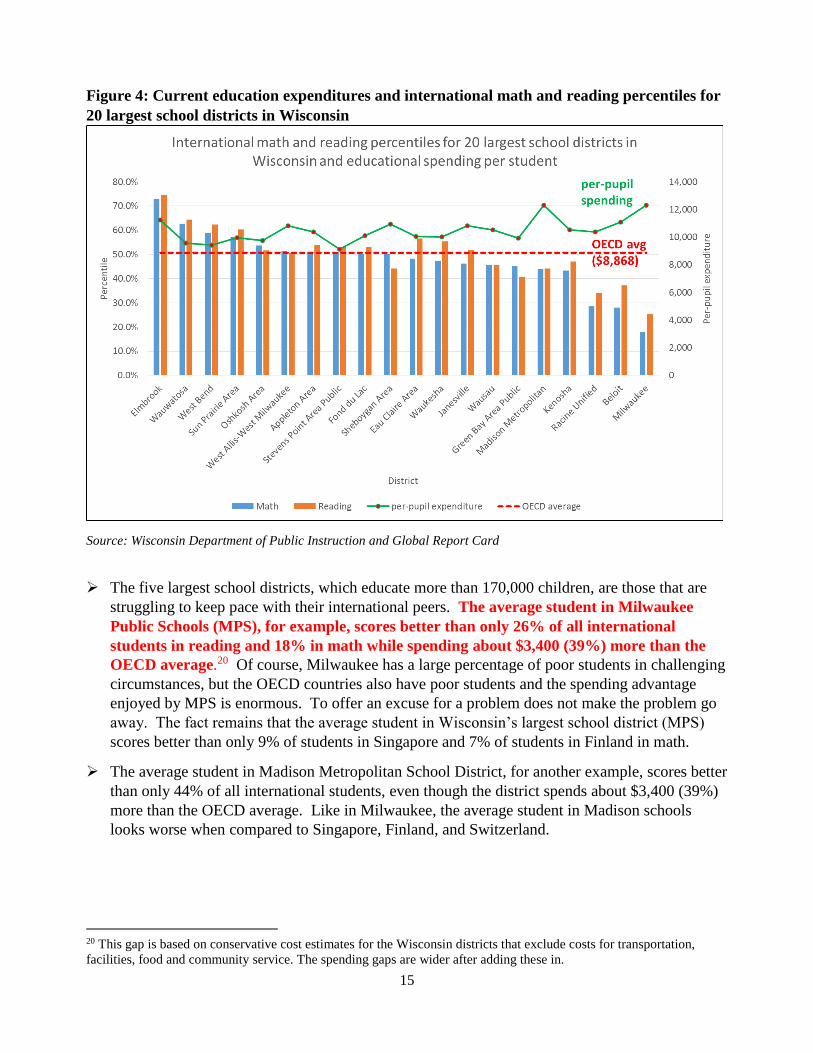
Figure 4: Current education expenditures and international math and reading percentiles for
20 largest school districts in Wisconsin
Source: Wisconsin Department of Public Instruction and Global Report Card
The five largest school districts, which educate more than 170,000 children, are those that are
struggling to keep pace with their international peers. The average student in Milwaukee
Public Schools (MPS), for example, scores better than only 26% of all international
students in reading and 18% in math while spending about $3,400 (39%) more than the
OECD average.20 Of course, Milwaukee has a large percentage of poor students in challenging
circumstances, but the OECD countries also have poor students and the spending advantage
enjoyed by MPS is enormous. To offer an excuse for a problem does not make the problem go
away. The fact remains that the average student in Wisconsin’s largest school district (MPS)
scores better than only 9% of students in Singapore and 7% of students in Finland in math.
The average student in Madison Metropolitan School District, for another example, scores better
than only 44% of all international students, even though the district spends about $3,400 (39%)
more than the OECD average. Like in Milwaukee, the average student in Madison schools
looks worse when compared to Singapore, Finland, and Switzerland.
20 This gap is based on conservative cost estimates for the Wisconsin districts that exclude costs for transportation,
facilities, food and community service. The spending gaps are wider after adding these in.
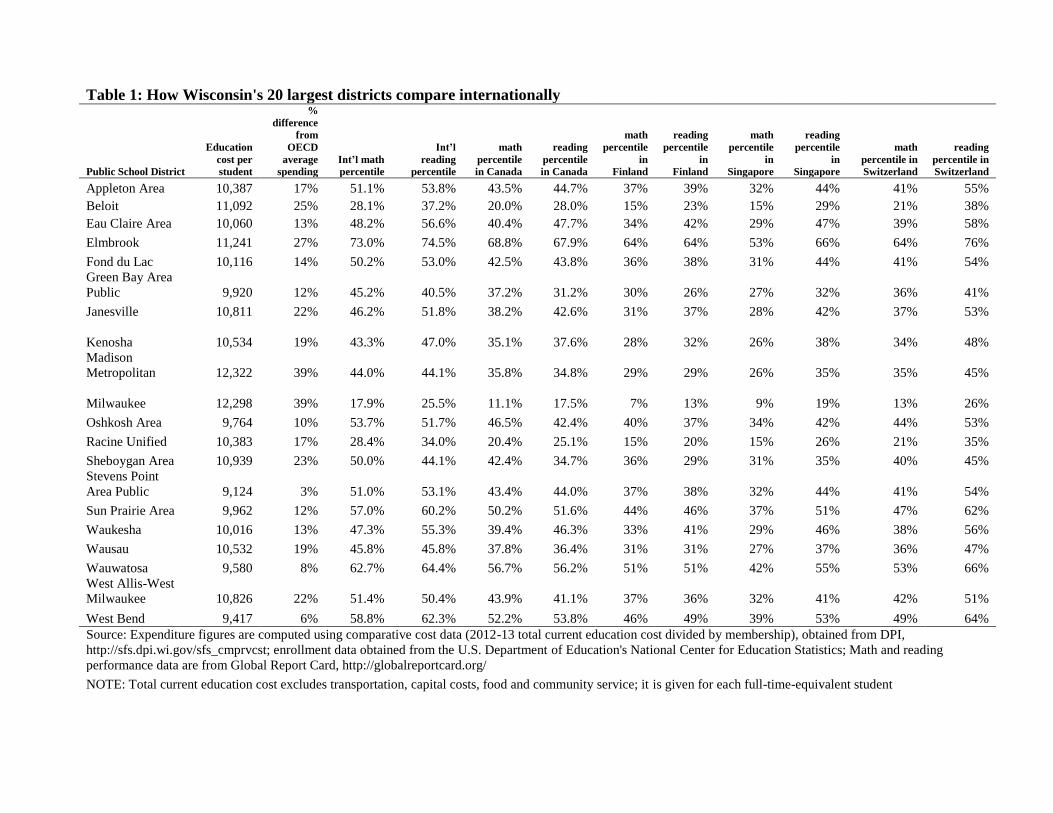
Table 1: How Wisconsin's 20 largest districts compare internationally
Public School District
Education
cost per
student
%
difference
from
OECD
average
spending
Int’l math
percentile
Int’l
reading
percentile
math
percentile
in Canada
reading
percentile
in Canada
math
percentile
in
Finland
reading
percentile
in
Finland
math
percentile
in
Singapore
reading
percentile
in
Singapore
math
percentile in
Switzerland
reading
percentile in
Switzerland
Appleton Area 10,387 17% 51.1% 53.8% 43.5% 44.7% 37% 39% 32% 44% 41% 55%
Beloit 11,092 25% 28.1% 37.2% 20.0% 28.0% 15% 23% 15% 29% 21% 38%
Eau Claire Area 10,060 13% 48.2% 56.6% 40.4% 47.7% 34% 42% 29% 47% 39% 58%
Elmbrook 11,241 27% 73.0% 74.5% 68.8% 67.9% 64% 64% 53% 66% 64% 76%
Fond du Lac 10,116 14% 50.2% 53.0% 42.5% 43.8% 36% 38% 31% 44% 41% 54%
Green Bay Area
Public 9,920 12% 45.2% 40.5% 37.2% 31.2% 30% 26% 27% 32% 36% 41%
Janesville 10,811 22% 46.2% 51.8% 38.2% 42.6% 31% 37% 28% 42% 37% 53%
Kenosha
10,534 19% 43.3% 47.0% 35.1% 37.6% 28% 32% 26% 38% 34% 48%
Madison
Metropolitan
12,322 39% 44.0% 44.1% 35.8% 34.8% 29% 29% 26% 35% 35% 45%
Milwaukee
12,298 39% 17.9% 25.5% 11.1% 17.5% 7% 13% 9% 19% 13% 26%
Oshkosh Area 9,764 10% 53.7% 51.7% 46.5% 42.4% 40% 37% 34% 42% 44% 53%
Racine Unified 10,383 17% 28.4% 34.0% 20.4% 25.1% 15% 20% 15% 26% 21% 35%
Sheboygan Area 10,939 23% 50.0% 44.1% 42.4% 34.7% 36% 29% 31% 35% 40% 45%
Stevens Point
Area Public 9,124 3% 51.0% 53.1% 43.4% 44.0% 37% 38% 32% 44% 41% 54%
Sun Prairie Area 9,962 12% 57.0% 60.2% 50.2% 51.6% 44% 46% 37% 51% 47% 62%
Waukesha 10,016 13% 47.3% 55.3% 39.4% 46.3% 33% 41% 29% 46% 38% 56%
Wausau 10,532 19% 45.8% 45.8% 37.8% 36.4% 31% 31% 27% 37% 36% 47%
Wauwatosa 9,580 8% 62.7% 64.4% 56.7% 56.2% 51% 51% 42% 55% 53% 66%
West Allis-West
Milwaukee 10,826 22% 51.4% 50.4% 43.9% 41.1% 37% 36% 32% 41% 42% 51%
West Bend 9,417 6% 58.8% 62.3% 52.2% 53.8% 46% 49% 39% 53% 49% 64%
Source: Expenditure figures are computed using comparative cost data (2012-13 total current education cost divided by membership), obtained from DPI,
http://sfs.dpi.wi.gov/sfs_cmprvcst; enrollment data obtained from the U.S. Department of Education's National Center for Education Statistics; Math and reading
performance data are from Global Report Card, http://globalreportcard.org/
NOTE: Total current education cost excludes transportation, capital costs, food and community service; it is given for each full-time-equivalent student

These results worsen when Wisconsin is
compared to Canada, the country that most
resembles the U.S., as well as being the
U.S.’s largest trading partner.
Overall, the average student in
Wisconsin scores higher than only
39% of all Canadian students in math
and 41% in reading.
The average student in 16 of the 20
largest school districts scores lower than
at least 50% of all Canadian students in
both math and reading.
For example, in Kenosha Unified School
District, despite spending over $1,000
per pupil more than Canada, the average
student scores better than only 38% of all
Canadian students in math and reading.
But what about Wisconsin’s highest performing districts? They perform better against international
benchmarks, but not as well as one may like and perhaps not nearly as well as families in those
districts believe. Similarly, we look at the top 20 school districts in Wisconsin (see Table A.2 in
Appendix A).21 Each of these districts received “Significantly Exceeds Expectations” or “Exceeds
Expectations” on the state Report Card. The student enrollment in these districts is quite small; they
educate less than 5% of the State’s student population.
The average student in only 4 of the top 20 school districts reaches the 75th percentile in the
international group of students. In other words, the vast majority of top Wisconsin school
districts fall short – some just barely – from reaching the top 25% in math. One could be satisfied
with this; it’s well above average. But these school districts are Wisconsin’s top performers. It may
not be the case, for example, that parents in the Elmbrook School District would be happy to know
that the average student in their district is outperformed by 25% of international students,
particularly given that Elmbrook spends 27% more than the OECD average.
Moreover, the average students from Wisconsin’s top school districts are less impressive when
compared to particular countries. Country-level data is available for Singapore, Finland, and
Switzerland. The average Elmbrook student, for instance, scores higher in math than only 53% of
all students in Singapore, 64% in Finland, and 64% in Switzerland. Likewise, Mequon-Thiensville
School District, where the average student scores near the top 25% in the international group, does
not appear to be elite when compared to some of the top countries for math. The average student in
Mequon-Thiensville scores higher than 66% of all students in Finland, 55% in Singapore, and 66%
in Switzerland.
21 We identify the Top 20 districts using scores from DPI Report Cards.
18
In short, when stacked up against our international competitors, there appears to be trends – despite
outspending the OECD nations. Wisconsin’s lowest-performing schools are struggling to
compete, the average Wisconsin student is very mediocre, and Wisconsin’s best schools are
not the best in the world.
These trends can be seen throughout other districts. For example, the parents of children in
Whitefish Bay Schools may be surprised to know that their average student would only be average
in Singapore (scores higher than only 52% of all Singapore students). The average student in
Chippewa Falls is below average in math and reading when compared to all students in Canada,
Singapore, and Finland. In Northern Wisconsin, the average student in Wausau scores better than
only 38% of children in Canada for math and 36% for reading; 31% of children in Finland for both
math and reading; and 27% of children in Singapore in math and 37% in reading.
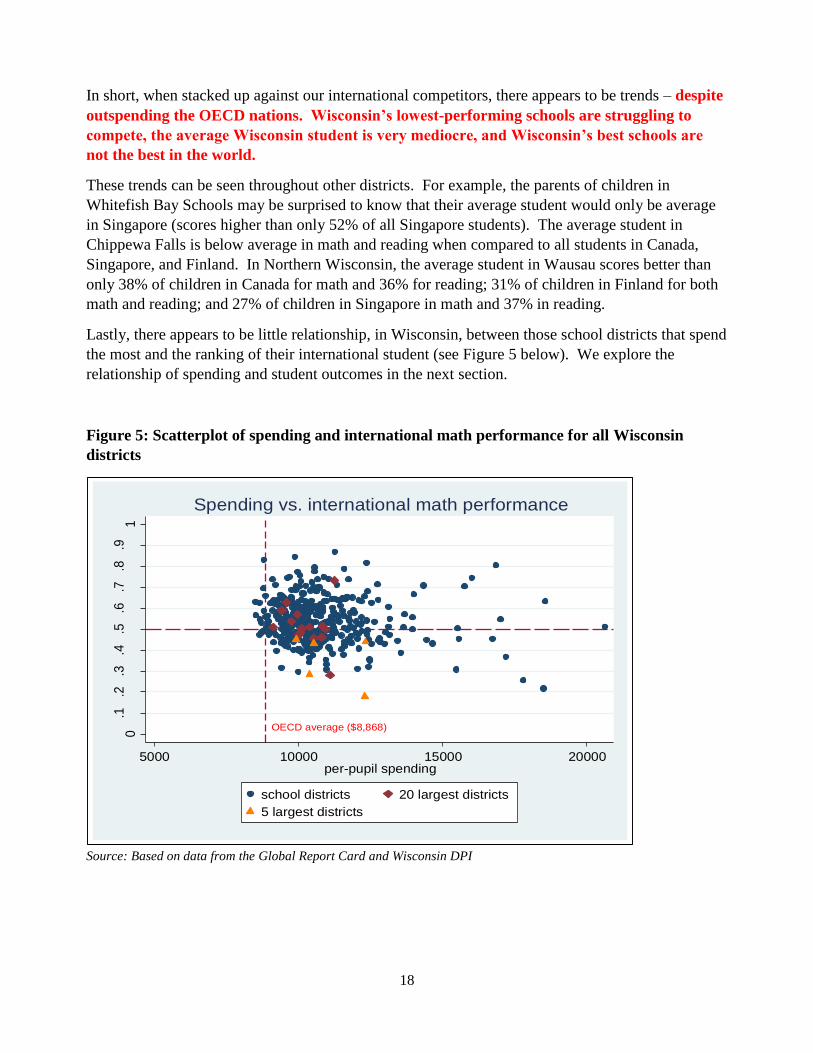
Lastly, there appears to be little relationship, in Wisconsin, between those school districts that spend
the most and the ranking of their international student (see Figure 5 below). We explore the
relationship of spending and student outcomes in the next section.
Figure 5: Scatterplot of spending and international math performance for all Wisconsin
districts
Source: Based on data from the Global Report Card and Wisconsin DPI
OECD average ($8,868)
0.1
.2.3
.4.5
.6.7
.8.9
1
Inte
rnatio
na
l ma
th p
erc
entil
e
5000 10000 15000 20000per-pupil spending
school districts 20 largest districts
5 largest districts
Spending vs. international math performance
19
III. Wisconsin can no longer spend its way to a better
education
a. Per-Pupil Spending and ACT Scores
Given all that we spend on public education, one
would expect us to perform better. In fiscal year
2012-13, the largest slice of the Wisconsin state
budget - $4.9 billion, or 35% of the general fund
budget - was appropriated to school aid (LFB,
2013). This commitment to funding education
has increased steadily over the last several
decades. Looking back to 1970, inflation-
adjusted spending in both the U.S. and
Wisconsin has increased in real terms by an
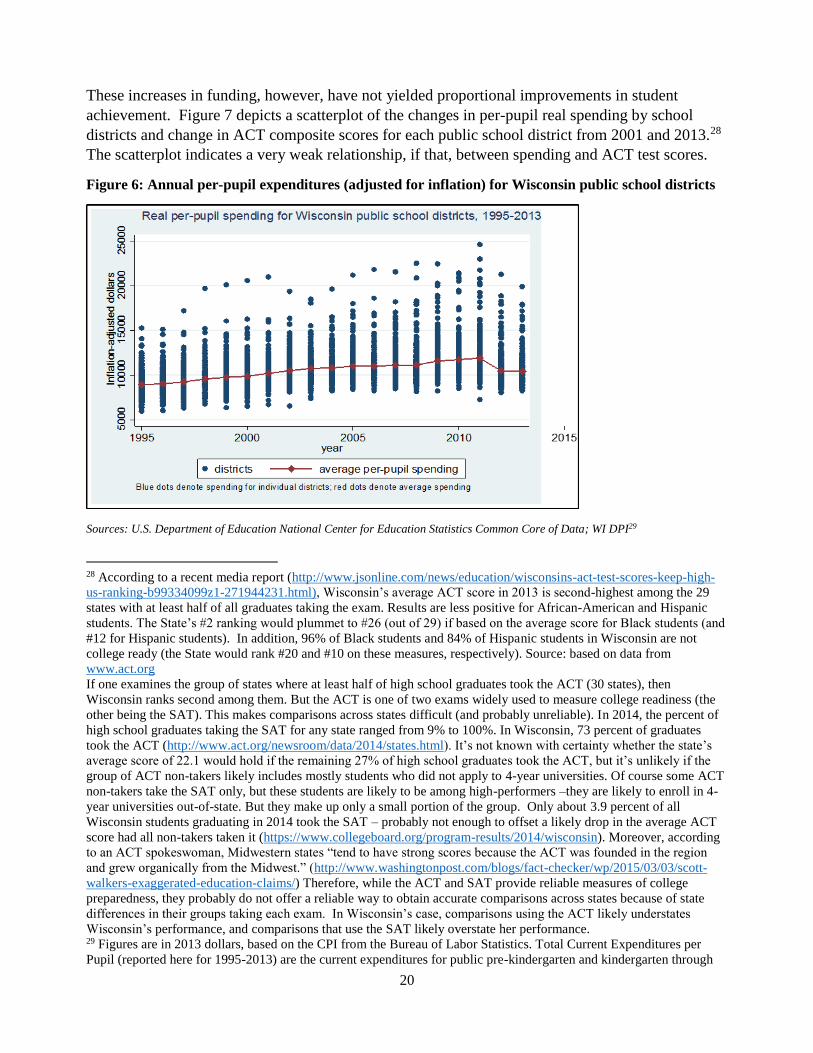
average of almost 4% every year.22 We can examine district spending using NCES data from
1995. Figure 6 plots per-pupil spending in constant dollars for each school district in Wisconsin
from 1995 to 2013 (blue dots).23,24 It is clear that some districts are relatively low-spending (e.g.
roughly $9,000 per student) while a handful are big spenders (e.g. over $15,000).25
The overall trend, however, remains clear: real spending has trended up. In the figure below, the
red dots represent the average per-pupil real expenditures across districts for each year. In constant,
dollars, the average district spent $9,253 in 1995. This amount rose to $12,334 by 2011 – an
increase of 33% in real spending – before dipping to $10,777 since Act 10 was enacted.26 A
significant part of the decrease is due to districts saving on health care costs (Costrell & Dean,
2013) rather than a reduction in resources deployed to schools.27
22 U.S. Department of Education, National Center for Education Statistics, Statistics of State School Systems, 1969-70;
Revenues and Expenditures for Public Elementary and Secondary Schools, 1979-80; and Common Core of Data (CCD). 23 Data on expenditures are obtained from the U.S. Department of Education’s National Center for Education Statistics,
with 2011 the last year data are reported. We also extended the analyses to include Total Cost per Member for 2012 and
2013, obtained from the DPI (http://sfs.dpi.wi.gov/sfs_cmpcst). While the state average experienced a slight downtick
for these two years due to Act 10, adding them to the analyses have no material effect on any of the results or inferences
we make here and later in this paper. Limiting collective bargaining and preventing districts from “picking up”
employees’ retirement contributions have allowed districts to regain a measure of control over a significant portion of
their budgets. 24 Figures are in 2013 dollars, based on the CPI from the Bureau of Labor Statistics. Total Current Expenditures per
Pupil (reported here for 1995-2013) are the current expenditures for public pre-kindergarten and kindergarten through
grade 12 programs divided by the fall membership; they reflect the day-to-day operations of schools and school districts
and exclude expenditures for capital outlays, equipment, school construction, and debt service. 25 Variation in per-pupil spending across districts can occur from differences in the use of their authority to levy
property taxes up to the revenue limit. Some may “tax to the max” while others levy property taxes below their revenue
limits. This can lead to significant variation, especially if these differences persist over time. 26 We also examine comparative cost data from the DPI, which is provided for the period 2000-2014. Since 2011,
average education costs per member declined by about 9%. 27 Costrell and Dean (2013) estimate that districts saved, on average, $2,614 for family coverage and $1,304 for single
coverage from 2011 to 2012. The authors note that district costs remain well above the national average for teachers.
20
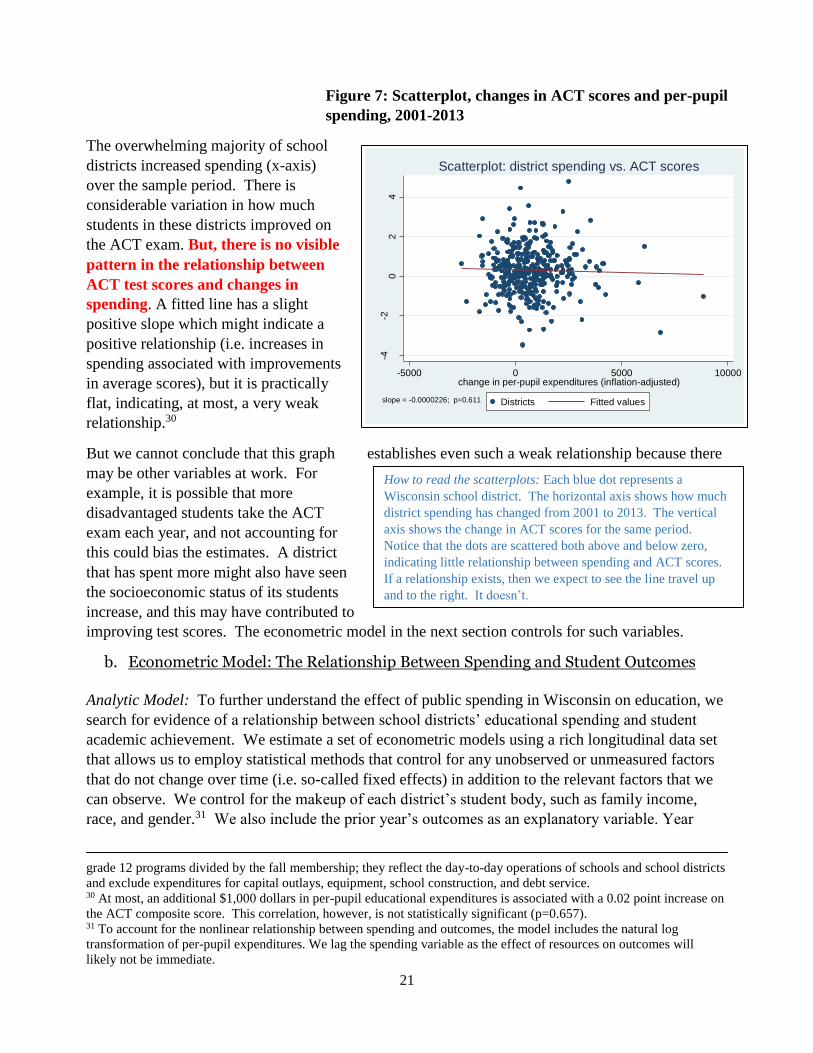
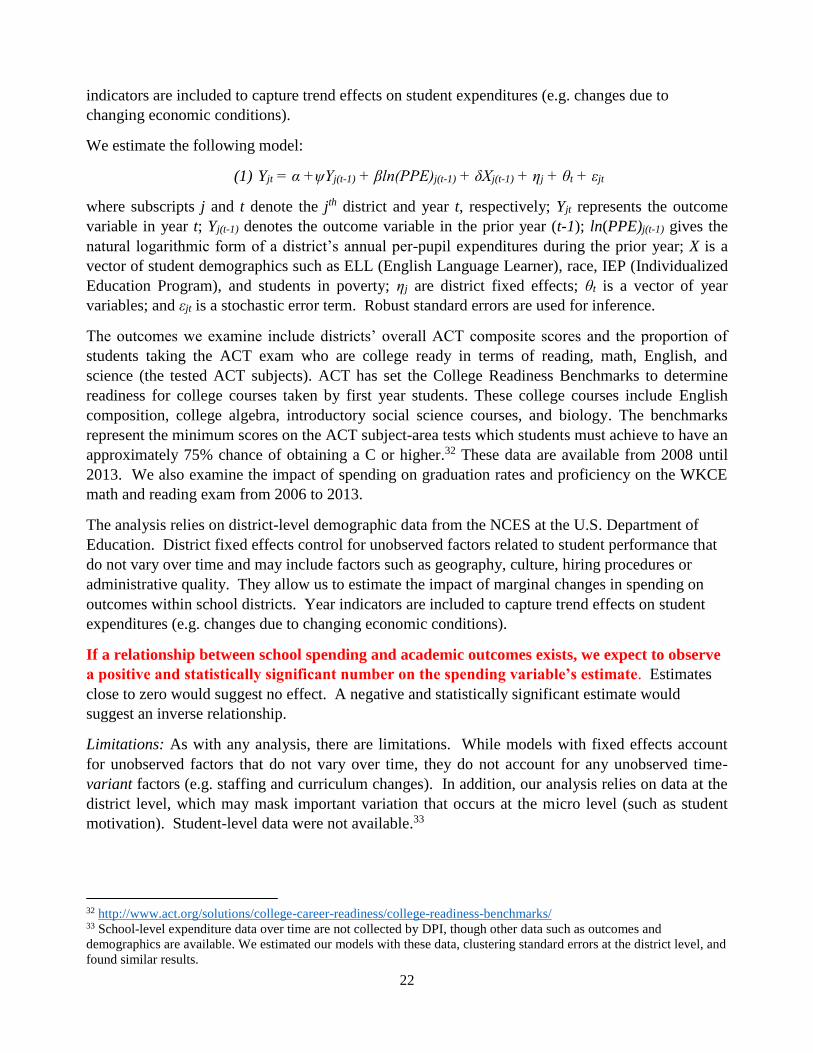
These increases in funding, however, have not yielded proportional improvements in student
achievement. Figure 7 depicts a scatterplot of the changes in per-pupil real spending by school
districts and change in ACT composite scores for each public school district from 2001 and 2013.28
The scatterplot indicates a very weak relationship, if that, between spending and ACT test scores.
Figure 6: Annual per-pupil expenditures (adjusted for inflation) for Wisconsin public school districts
Sources: U.S. Department of Education National Center for Education Statistics Common Core of Data; WI DPI29
28 According to a recent media report (http://www.jsonline.com/news/education/wisconsins-act-test-scores-keep-high-
us-ranking-b99334099z1-271944231.html), Wisconsin’s average ACT score in 2013 is second-highest among the 29
states with at least half of all graduates taking the exam. Results are less positive for African-American and Hispanic
students. The State’s #2 ranking would plummet to #26 (out of 29) if based on the average score for Black students (and
#12 for Hispanic students). In addition, 96% of Black students and 84% of Hispanic students in Wisconsin are not
college ready (the State would rank #20 and #10 on these measures, respectively). Source: based on data from
www.act.org
If one examines the group of states where at least half of high school graduates took the ACT (30 states), then
Wisconsin ranks second among them. But the ACT is one of two exams widely used to measure college readiness (the
other being the SAT). This makes comparisons across states difficult (and probably unreliable). In 2014, the percent of
high school graduates taking the SAT for any state ranged from 9% to 100%. In Wisconsin, 73 percent of graduates
took the ACT (http://www.act.org/newsroom/data/2014/states.html). It’s not known with certainty whether the state’s
average score of 22.1 would hold if the remaining 27% of high school graduates took the ACT, but it’s unlikely if the
group of ACT non-takers likely includes mostly students who did not apply to 4-year universities. Of course some ACT
non-takers take the SAT only, but these students are likely to be among high-performers –they are likely to enroll in 4-
year universities out-of-state. But they make up only a small portion of the group. Only about 3.9 percent of all
Wisconsin students graduating in 2014 took the SAT – probably not enough to offset a likely drop in the average ACT
score had all non-takers taken it (https://www.collegeboard.org/program-results/2014/wisconsin). Moreover, according
to an ACT spokeswoman, Midwestern states “tend to have strong scores because the ACT was founded in the region
and grew organically from the Midwest.” (http://www.washingtonpost.com/blogs/fact-checker/wp/2015/03/03/scott-
walkers-exaggerated-education-claims/) Therefore, while the ACT and SAT provide reliable measures of college
preparedness, they probably do not offer a reliable way to obtain accurate comparisons across states because of state
differences in their groups taking each exam. In Wisconsin’s case, comparisons using the ACT likely understates
Wisconsin’s performance, and comparisons that use the SAT likely overstate her performance. 29 Figures are in 2013 dollars, based on the CPI from the Bureau of Labor Statistics. Total Current Expenditures per
Pupil (reported here for 1995-2013) are the current expenditures for public pre-kindergarten and kindergarten through
21
How to read the scatterplots: Each blue dot represents a
Wisconsin school district. The horizontal axis shows how much
district spending has changed from 2001 to 2013. The vertical
axis shows the change in ACT scores for the same period.
Notice that the dots are scattered both above and below zero,
indicating little relationship between spending and ACT scores.
If a relationship exists, then we expect to see the line travel up
and to the right. It doesn’t.
Figure 7: Scatterplot, changes in ACT scores and per-pupil
spending, 2001-2013
The overwhelming majority of school
districts increased spending (x-axis)
over the sample period. There is
considerable variation in how much
students in these districts improved on
the ACT exam. But, there is no visible
pattern in the relationship between
ACT test scores and changes in
spending. A fitted line has a slight
positive slope which might indicate a
positive relationship (i.e. increases in
spending associated with improvements
in average scores), but it is practically
flat, indicating, at most, a very weak
relationship.30
But we cannot conclude that this graph establishes even such a weak relationship because there
may be other variables at work. For
example, it is possible that more
disadvantaged students take the ACT
exam each year, and not accounting for
this could bias the estimates. A district
that has spent more might also have seen
the socioeconomic status of its students
increase, and this may have contributed to
improving test scores. The econometric model in the next section controls for such variables.
b. Econometric Model: The Relationship Between Spending and Student Outcomes
Analytic Model: To further understand the effect of public spending in Wisconsin on education, we
search for evidence of a relationship between school districts’ educational spending and student
academic achievement. We estimate a set of econometric models using a rich longitudinal data set
that allows us to employ statistical methods that control for any unobserved or unmeasured factors
that do not change over time (i.e. so-called fixed effects) in addition to the relevant factors that we
can observe. We control for the makeup of each district’s student body, such as family income,
race, and gender.31 We also include the prior year’s outcomes as an explanatory variable. Year
grade 12 programs divided by the fall membership; they reflect the day-to-day operations of schools and school districts
and exclude expenditures for capital outlays, equipment, school construction, and debt service. 30 At most, an additional $1,000 dollars in per-pupil educational expenditures is associated with a 0.02 point increase on
the ACT composite score. This correlation, however, is not statistically significant (p=0.657). 31 To account for the nonlinear relationship between spending and outcomes, the model includes the natural log
transformation of per-pupil expenditures. We lag the spending variable as the effect of resources on outcomes will
likely not be immediate.
-4-2
02
4
AC
T s
core
-5000 0 5000 10000change in per-pupil expenditures (inflation-adjusted)
Districts Fitted values
Scatterplot: district spending vs. ACT scores
slope = -0.0000226; p=0.611
22
indicators are included to capture trend effects on student expenditures (e.g. changes due to
changing economic conditions).
We estimate the following model:
(1) Yjt = α +ψYj(t-1) + βln(PPE)j(t-1) + δXj(t-1) + ηj + θt + εjt
where subscripts j and t denote the jth district and year t, respectively; Yjt represents the outcome
variable in year t; Yj(t-1) denotes the outcome variable in the prior year (t-1); ln(PPE)j(t-1) gives the
natural logarithmic form of a district’s annual per-pupil expenditures during the prior year; X is a
vector of student demographics such as ELL (English Language Learner), race, IEP (Individualized
Education Program), and students in poverty; ηj are district fixed effects; θt is a vector of year
variables; and εjt is a stochastic error term. Robust standard errors are used for inference.
The outcomes we examine include districts’ overall ACT composite scores and the proportion of
students taking the ACT exam who are college ready in terms of reading, math, English, and
science (the tested ACT subjects). ACT has set the College Readiness Benchmarks to determine
readiness for college courses taken by first year students. These college courses include English
composition, college algebra, introductory social science courses, and biology. The benchmarks
represent the minimum scores on the ACT subject-area tests which students must achieve to have an
approximately 75% chance of obtaining a C or higher.32 These data are available from 2008 until
2013. We also examine the impact of spending on graduation rates and proficiency on the WKCE
math and reading exam from 2006 to 2013.
The analysis relies on district-level demographic data from the NCES at the U.S. Department of
Education. District fixed effects control for unobserved factors related to student performance that
do not vary over time and may include factors such as geography, culture, hiring procedures or
administrative quality. They allow us to estimate the impact of marginal changes in spending on
outcomes within school districts. Year indicators are included to capture trend effects on student
expenditures (e.g. changes due to changing economic conditions).
If a relationship between school spending and academic outcomes exists, we expect to observe
a positive and statistically significant number on the spending variable’s estimate. Estimates
close to zero would suggest no effect. A negative and statistically significant estimate would
suggest an inverse relationship.
Limitations: As with any analysis, there are limitations. While models with fixed effects account
for unobserved factors that do not vary over time, they do not account for any unobserved time-
variant factors (e.g. staffing and curriculum changes). In addition, our analysis relies on data at the
district level, which may mask important variation that occurs at the micro level (such as student
motivation). Student-level data were not available.33
32 http://www.act.org/solutions/college-career-readiness/college-readiness-benchmarks/ 33 School-level expenditure data over time are not collected by DPI, though other data such as outcomes and
demographics are available. We estimated our models with these data, clustering standard errors at the district level, and
found similar results.
23
In addition, private schools and independent charter schools cannot be included in the analysis
because of data limitations. Financial data are not reported for independent charter schools, and
demographic data are not available for private schools.
Despite these limitations, we believe the analysis offers valuable insights for policy decisions. We
are better off having this knowledge than not having it.
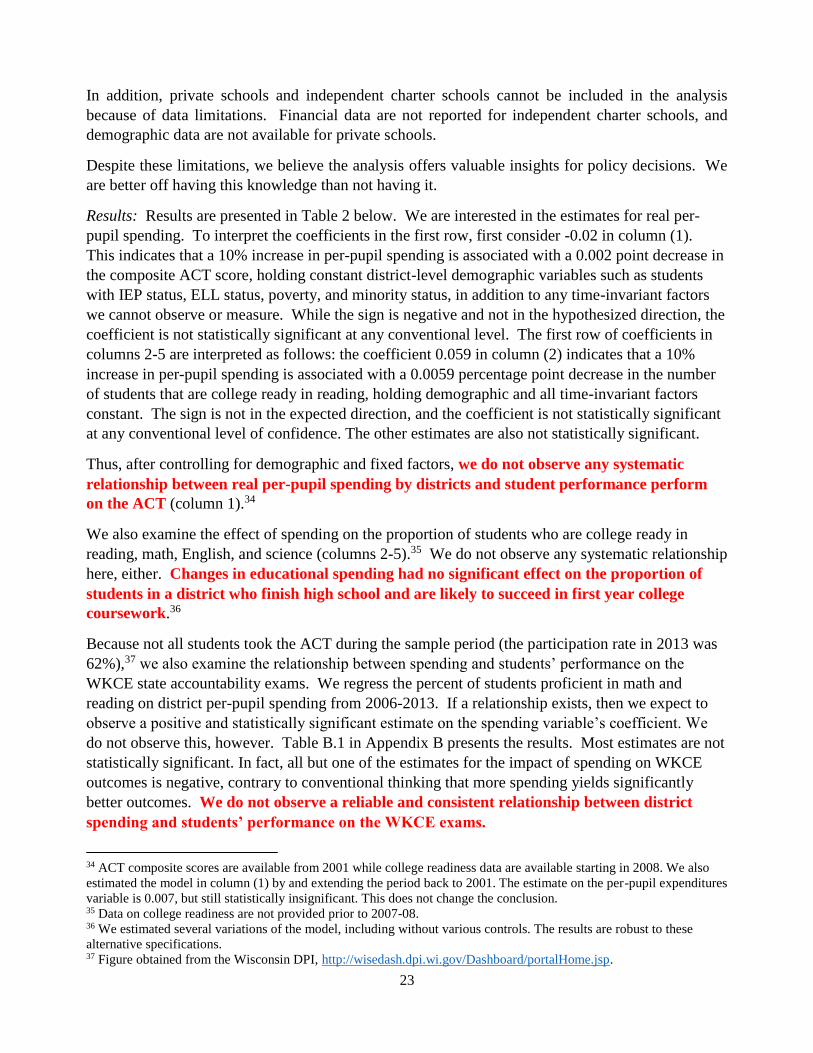
Results: Results are presented in Table 2 below. We are interested in the estimates for real per-
pupil spending. To interpret the coefficients in the first row, first consider -0.02 in column (1).
This indicates that a 10% increase in per-pupil spending is associated with a 0.002 point decrease in
the composite ACT score, holding constant district-level demographic variables such as students
with IEP status, ELL status, poverty, and minority status, in addition to any time-invariant factors
we cannot observe or measure. While the sign is negative and not in the hypothesized direction, the
coefficient is not statistically significant at any conventional level. The first row of coefficients in
columns 2-5 are interpreted as follows: the coefficient 0.059 in column (2) indicates that a 10%
increase in per-pupil spending is associated with a 0.0059 percentage point decrease in the number
of students that are college ready in reading, holding demographic and all time-invariant factors
constant. The sign is not in the expected direction, and the coefficient is not statistically significant
at any conventional level of confidence. The other estimates are also not statistically significant.
Thus, after controlling for demographic and fixed factors, we do not observe any systematic
relationship between real per-pupil spending by districts and student performance perform
on the ACT (column 1).34
We also examine the effect of spending on the proportion of students who are college ready in
reading, math, English, and science (columns 2-5).35 We do not observe any systematic relationship
here, either. Changes in educational spending had no significant effect on the proportion of
students in a district who finish high school and are likely to succeed in first year college
coursework.36
Because not all students took the ACT during the sample period (the participation rate in 2013 was
62%),37 we also examine the relationship between spending and students’ performance on the
WKCE state accountability exams. We regress the percent of students proficient in math and
reading on district per-pupil spending from 2006-2013. If a relationship exists, then we expect to
observe a positive and statistically significant estimate on the spending variable’s coefficient. We
do not observe this, however. Table B.1 in Appendix B presents the results. Most estimates are not
statistically significant. In fact, all but one of the estimates for the impact of spending on WKCE
outcomes is negative, contrary to conventional thinking that more spending yields significantly
better outcomes. We do not observe a reliable and consistent relationship between district
spending and students’ performance on the WKCE exams.
34 ACT composite scores are available from 2001 while college readiness data are available starting in 2008. We also
estimated the model in column (1) by and extending the period back to 2001. The estimate on the per-pupil expenditures
variable is 0.007, but still statistically insignificant. This does not change the conclusion. 35 Data on college readiness are not provided prior to 2007-08. 36 We estimated several variations of the model, including without various controls. The results are robust to these
alternative specifications. 37 Figure obtained from the Wisconsin DPI, http://wisedash.dpi.wi.gov/Dashboard/portalHome.jsp.
24
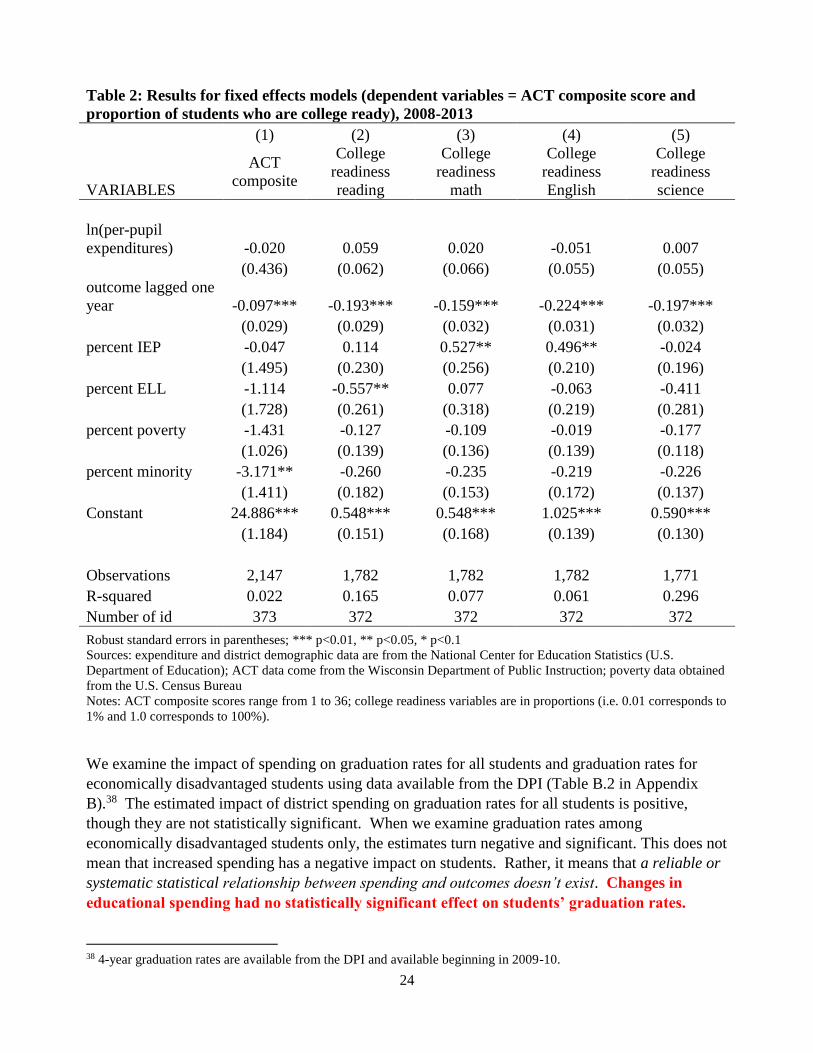
Table 2: Results for fixed effects models (dependent variables = ACT composite score and
proportion of students who are college ready), 2008-2013
(1) (2) (3) (4) (5)
VARIABLES
ACT
composite
College
readiness
reading
College
readiness
math
College
readiness
English
College
readiness
science
ln(per-pupil
expenditures) -0.020 0.059 0.020 -0.051 0.007
(0.436) (0.062) (0.066) (0.055) (0.055)
outcome lagged one
year -0.097*** -0.193*** -0.159*** -0.224*** -0.197***
(0.029) (0.029) (0.032) (0.031) (0.032)
percent IEP -0.047 0.114 0.527** 0.496** -0.024
(1.495) (0.230) (0.256) (0.210) (0.196)
percent ELL -1.114 -0.557** 0.077 -0.063 -0.411
(1.728) (0.261) (0.318) (0.219) (0.281)
percent poverty -1.431 -0.127 -0.109 -0.019 -0.177
(1.026) (0.139) (0.136) (0.139) (0.118)
percent minority -3.171** -0.260 -0.235 -0.219 -0.226
(1.411) (0.182) (0.153) (0.172) (0.137)
Constant 24.886*** 0.548*** 0.548*** 1.025*** 0.590***
(1.184) (0.151) (0.168) (0.139) (0.130)
Observations 2,147 1,782 1,782 1,782 1,771
R-squared 0.022 0.165 0.077 0.061 0.296
Number of id 373 372 372 372 372
Robust standard errors in parentheses; *** p<0.01, ** p<0.05, * p<0.1
Sources: expenditure and district demographic data are from the National Center for Education Statistics (U.S.
Department of Education); ACT data come from the Wisconsin Department of Public Instruction; poverty data obtained
from the U.S. Census Bureau
Notes: ACT composite scores range from 1 to 36; college readiness variables are in proportions (i.e. 0.01 corresponds to
1% and 1.0 corresponds to 100%).
We examine the impact of spending on graduation rates for all students and graduation rates for
economically disadvantaged students using data available from the DPI (Table B.2 in Appendix
B).38 The estimated impact of district spending on graduation rates for all students is positive,
though they are not statistically significant. When we examine graduation rates among
economically disadvantaged students only, the estimates turn negative and significant. This does not
mean that increased spending has a negative impact on students. Rather, it means that a reliable or
systematic statistical relationship between spending and outcomes doesn’t exist. Changes in
educational spending had no statistically significant effect on students’ graduation rates.
38 4-year graduation rates are available from the DPI and available beginning in 2009-10.
25
Robustness checks: Lastly, to check if the estimates from our main analysis behave differently when
we modify our models, we conduct a series of robustness checks in our analysis. We estimate
models with alternate specifications, disaggregate the spending variable by function, and examine
an alternate data set that includes one year of school-level expenditures. Details about these
approaches and their results are described and reported in Appendix B. As with our main analysis,
we did not find conclusive evidence to indicate that marginal changes in spending had a
significant impact on student outcomes.
Conclusion: We do not find reliable evidence in the data that a systematic relationship exists
between additional spending and student outcomes. These results are similar to a larger body of
research on the effectiveness of spending. Economist Eric Hanushek (2003), for example,
systematically reviewed research on the effectiveness of key educational resources in U.S. schools.
In examining the impact of per-pupil educational expenditures, he tallied the statistical significance
and impact of 163 estimates on the impact of spending on student outcomes and found that 27% of
these estimates were positive and statistically significant, while 66% were not statistically
significant, meaning no impacts were detected.39
Advocates for keeping the status quo argue for increasing education spending to solve problems
with our education system. But, it is not the case that resources alone will bring about improvement
– even substantial infusions of resources, as was the case with Kansas City’s experience.40 One
plausible explanation may be that districts have reached what economists call diminishing
returns. This occurs when an organization reaches a point where additional dollars spent do not
produce proportional benefits, holding everything else constant. For example, a dollar spent on
education in developing counties, such as India, is more likely to have a greater impact than in
Wisconsin - or elsewhere in the United States - which spends more than most of the developed
world. 41
This raises a question for policymakers: Has Wisconsin hit a wall where an additional dollar in
education spending will not bring improvements in student outcomes? The results of our
research indicate that this may be the case.
39 One of the inclusion criteria mandated that models must control for some measure of family background, which we
do in our analysis. 40 In 1985, a Federal judge ordered the Kansas City Public School District and the state of Kansas to spend almost $2
billion over 12 years to update dilapidated facilities, build new ones, integrate classrooms, and improve student
academic achievement up to national norms (Ciotti, 1998). But while the ruling brought about state-of-the-art facilities
for the high-poverty high-minority inner-city school district, it didn’t bring about improvements in student learning. The
black-white achievement gap didn’t change, and the dropout rate actually went up. 41 Research illustrates why directing more resources to schools in countries such as India will likely have a larger impact
on student outcomes than if the same was done in the U.S. Habitual truancy among teachers is a problem in India. A
team of researchers conducted unannounced visits to primary schools in India and found that 25% of the teachers were
absent while only half were actually engaged in any teaching (Kremer et al., 2005). When an incentive program was
implemented and studied in Indian state Andhra Pradesh, economists found substantially marked improvements in
student outcomes (Muralidharan & Sundararaman, 2011). The researchers attributed this at least partly to teachers
showing up more frequently.
26
IV. Can More School Choice Revitalize the Wisconsin
Education System?
Hafer (2014) presents evidence that a positive relationship exists between educational attainment
and economic growth at the state level. As a result, it is absolutely essential for Wisconsin’s
economic growth to have education policies that will improve student outcomes. Unfortunately, as
demonstrated above, spending more on the “one-size-fits-all” government schools will not lead to
better student outcomes. While school choice may not be a silver bullet to what ails Wisconsin’s K-
12 education system, it should be part of the solution. Consider:
a. School Choice in Milwaukee: Better Results for Less Money
While charter schools and private schools in the choice program have experienced growing demand
over the course of their existence, large inequities exist in school funding. Independent public
charter schools and private schools in the choice program receive significantly less funding than
public schools. However, even on shoe-string budgets, they produce impressive results.
i. Funding disparities between schools
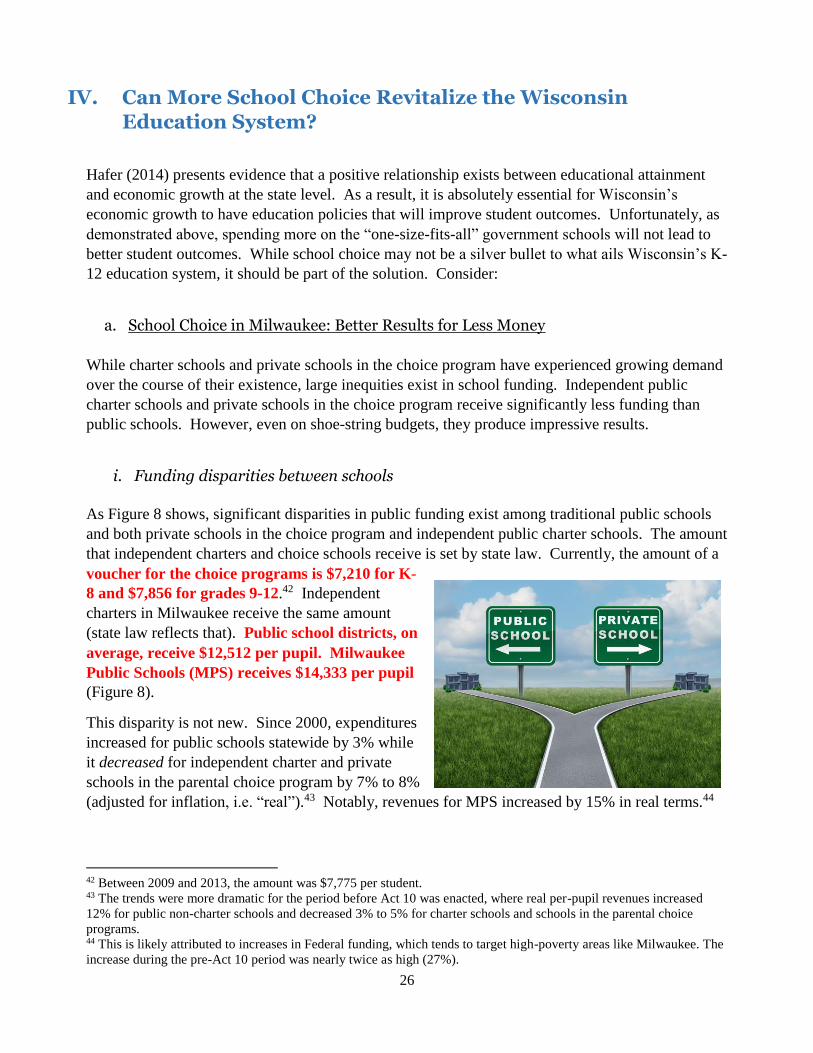
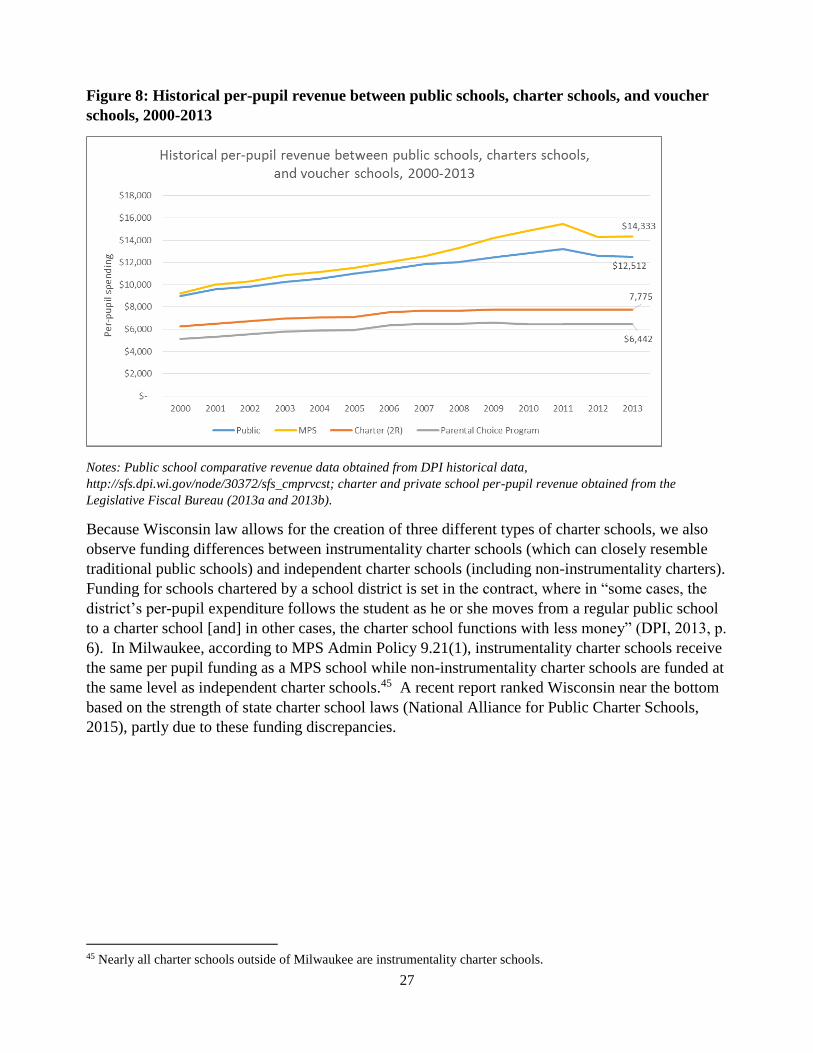
As Figure 8 shows, significant disparities in public funding exist among traditional public schools
and both private schools in the choice program and independent public charter schools. The amount
that independent charters and choice schools receive is set by state law. Currently, the amount of a
voucher for the choice programs is $7,210 for K-
8 and $7,856 for grades 9-12.42 Independent
charters in Milwaukee receive the same amount
(state law reflects that). Public school districts, on
average, receive $12,512 per pupil. Milwaukee
Public Schools (MPS) receives $14,333 per pupil
(Figure 8).
This disparity is not new. Since 2000, expenditures
increased for public schools statewide by 3% while
it decreased for independent charter and private
schools in the parental choice program by 7% to 8%
(adjusted for inflation, i.e. “real”).43 Notably, revenues for MPS increased by 15% in real terms.44
42 Between 2009 and 2013, the amount was $7,775 per student. 43 The trends were more dramatic for the period before Act 10 was enacted, where real per-pupil revenues increased
12% for public non-charter schools and decreased 3% to 5% for charter schools and schools in the parental choice
programs. 44 This is likely attributed to increases in Federal funding, which tends to target high-poverty areas like Milwaukee. The
increase during the pre-Act 10 period was nearly twice as high (27%).
27
Figure 8: Historical per-pupil revenue between public schools, charter schools, and voucher
schools, 2000-2013
Notes: Public school comparative revenue data obtained from DPI historical data,
http://sfs.dpi.wi.gov/node/30372/sfs_cmprvcst; charter and private school per-pupil revenue obtained from the
Legislative Fiscal Bureau (2013a and 2013b).
Because Wisconsin law allows for the creation of three different types of charter schools, we also
observe funding differences between instrumentality charter schools (which can closely resemble
traditional public schools) and independent charter schools (including non-instrumentality charters).
Funding for schools chartered by a school district is set in the contract, where in “some cases, the
district’s per-pupil expenditure follows the student as he or she moves from a regular public school
to a charter school [and] in other cases, the charter school functions with less money” (DPI, 2013, p.
6). In Milwaukee, according to MPS Admin Policy 9.21(1), instrumentality charter schools receive
the same per pupil funding as a MPS school while non-instrumentality charter schools are funded at
the same level as independent charter schools.45 A recent report ranked Wisconsin near the bottom
based on the strength of state charter school laws (National Alliance for Public Charter Schools,
2015), partly due to these funding discrepancies.
45 Nearly all charter schools outside of Milwaukee are instrumentality charter schools.
28
How school choice helped the Torres’ family
Life was difficult for the Torres’ family. They
moved 9 times because they could not afford
their apartments. The many moves meant late
nights with missed homework and, often, a
new school. In the four elementary and middle
schools that David passed through, teachers
didn’t understand why he was often tired,
uninterested, and often combative.
“In elementary and middle school, I never
felt welcomed and was bullied. They said,
oh, he’s different,” David recalls.
Not surprisingly, he was the student who sat
in the back of the class and never raised his
hand. His grades suffered; his dream – to
enroll in college and become an engineer –
seemed impossible.
All that changed, when the Wisconsin
Parental Choice Program expanded
statewide for the first time. David used a
voucher to attend Notre Dame de la Baie
Academy, a Catholic high school, in Green
Bay. His family settled into a new home
built by Habitat for Humanity and blessed
by their priest.
“I wasn’t very liked for my cultural
background in other schools,” David says,
shyly but emphatically, as his parents sit
beside him in a conference room at Notre
Dame.
“Now, I will be a success, and no one can tell
me otherwise.” (School Choice Wisconsin,
2014).
ii. Research on vouchers in Milwaukee
Opponents of school choice have argued that schools in
parental choice programs “do not deliver on the promise
of significantly improved academic performance.”46 This
is simply untrue. There is a vast body of well-respected
research based on student-level longitudinal data that have
evaluated charter schools and voucher programs in
Wisconsin that have established that school choice works.
The School Choice Demonstration Project (SCDP)
concluded a 5-year evaluation of the Milwaukee Parental
Choice Program (MPCP) and charter schools in
Milwaukee. The SCDP’s reports, the best source of
information based in research to date on the impact of
school vouchers on Milwaukee students, found that
students in the MPCP were more likely to graduate
from high school in four years, enroll in a 4-year
college, and persist in college through the first year
(Cowen et al., 2012). They also gained at least as much
as MPS students in terms of academic achievement. The
net fiscal benefit from the MPCP in FY2011 was $46.7
million (Costrell, 2010),47 while the cumulative savings
from the MPCP since the program began is $238.5 million
(Spalding, 2014).48
In addition, WILL (2015b) observed greater portions of
students proficient in math and reading in Catholic and
Lutheran schools in the MPCP – the schools that educate
the majority of students in the parental choice program –
when compared to MPS schools.
46 Letter to the U.S. GAO by Reps. Mark Pocan, Gwen Moore, and David Loebsack,
http://pocan.house.gov/sites/pocan.house.gov/files/Final_GAO_Request_12_11.pdf. 47 This fiscal impact, according to Costrell, is distributed unevenly among different taxpayers. State and local taxpayers
outside of Milwaukee save from the program while Milwaukee taxpayers incur a negative fiscal impact. This negative
fiscal impact on local taxpayers, is currently being phased down so that state taxpayers will eventually pick up the
entire tab. 48 The report also estimated that the savings from all of the voucher programs throughout the United States since 1990
(ten voucher programs) had a fiscal benefit worth $1.7 billion. Remarkably, $1.3 billion of these savings occurred since
2007 (in part due to the introduction of four new programs).
29
How school choice helped the Coleman family
For 15-year old Donnica Coleman and her younger sister, Timia,
the Racine Parental Choice Program allowed them an
opportunity to get back on track.
Donnica was always fighting and skipping class in her public
middle school. “I wasn’t even an OK student,” she says
unabashedly. “I was skipping class and had something like 100
truancies. I was an ‘F’ and ‘D’ student. I was always fighting.”
Her mother agrees. “I never got called,” the 34-year-old mother
says. “At the time, I was working a night shift and I was home
during the day. No one ever called. I was furious by the end of
the year. I was trying to teach one thing at home and another
was happening at school.”
Donnica’s younger sister, Timia, was also getting into fights
frequently at her elementary school.
Her mom agrees that fighting was a frequent occurrence at the
schools. “As a parent, we would be waiting to pick up our
children and learn that whole classrooms were held late because
of the number of fights happening in the school.”
Timia heard about school choice on the news and begged her
mother to send her to a private school. Now, the two sisters are in
their second year of the RPCP.
“At Concordia [Lutheran School], everything changed,” says
Timia. “I understand things more clearly. The teachers deal with
someone’s behavior. I got accepted. And, I met my best friend,
Amy. I love this school.”
Timia has more friends and better grades. She is on the honor
role.
“They teach a foundation I talk about at home and help them to
resist peer pressure,” she adds.
Peer pressure is a real game-changer, nods Donnica.
“Before, I was with kids that didn’t want to learn,” says Donnica
of her old cluster of friends at McKinley. “But, when I got to
private school, all of the students wanted to learn. They
encouraged me to do my work. The teachers are on you –
‘You’re going to do this!’.” (School Choice Wisconsin, 2014).
These findings are similar to studies
conducted outside of Wisconsin.
According to the Friedman
Foundation, there have been at least
thirteen studies based on random
assignment (i.e. the “gold standard”
of research), and all but one of those
studies showed that vouchers had
beneficial outcomes.49 The other
study found that vouchers had no
impact, which meant that vouchers are
at worst a less expensive alternative to
public schools.
iii. Research on Wisconsin
charter schools
A study released recently by the
Center for Research on Education
Outcomes at Stanford University
found that students in Milwaukee
charter schools experienced greater
academic growth than similar students
in traditional public schools (CREDO,
2015).
The SCDP also analyzed the impact
of independent charters. In many
cases, their students outperformed
similar students in MPS schools.
Witte et al. (2011) found that students
who stayed in charter schools for more
than five years made large gains in
math and reading relative to similar
students in MPS non-charter schools.50
In addition, students in “conversion”
charter schools (charters that were
previously private schools) “consistently outperformed similar MPS students in the matched sample
49 http://www.edchoice.org/Research/Gold-Standard-Studies 50 Nisar (2013a) provides additional evidence that autonomous charter schools are effective at boosting academic
outcomes of their students. He estimated that on average students who attend a non-instrumentality charter school
would read at a grade level higher than similar students who attend an instrumentality charter school in two years, and
students who attend a traditional public school in three years. Moreover, over a two-year period students enrolled in
instrumentality charters on average would gain one grade level more than students in traditional public schools.

30
in every year” (Witte et al., 2012, p. iii). Along similar lines, WILL (2015b) found that the
percentage of students proficient in math and reading was significantly higher in independent
charter schools than non-charter MPS schools.
Finally, Nisar (2013b) offers evidence that competition from independent charter schools can
actually improve public schools. Competitive pressure from independent charter schools induced
nearby traditional public schools to improve the math and reading performance of their students.
The groups that benefited most included African American students and previously low-achieving
students.
b. Can School Choice Work Outside of Milwaukee and Racine?
If school choice can succeed in Milwaukee – which the vast majority of highly respected studies
indicate as much – can it have an impact in rural and small town areas in Wisconsin? There is
likely to be a marketplace for it, with a demand for vouchers from families and a supply line
of private schools.51
A major misconception surrounding Wisconsin education policy is that school choice can only work
in the inner city. Finding schools that match individual children’s needs is an important goal for all
school districts to achieve. However, this is no easy task. Some private schools have demonstrated
that they are particularly effective at educating disadvantaged students, as suggested by the previous
section on school choice research.
The number of children
throughout Wisconsin who come
from families that cannot afford to
send their children to schools
other than public schools is not
trivial. There are 77 school
districts in Wisconsin where at
least one in five children (ages 5-
17) live in poverty. This accounts
for nearly half of the state’s 5-17
year olds in poverty.52 As Figure
9 shows below, this is far from a
Milwaukee or Racine problem.
To make matters worse, the
number of children living in
poverty has been rising rapidly in
many districts. Table 3 indicates
51 According to the Milwaukee State Journal, “Ninety-eight private and religious schools have registered to participate
in Wisconsin's statewide voucher program for the 2015-'16 school year — more than three times the current number —
but a third of them are in Milwaukee or Racine and unlikely to get seats.” http://www.jsonline.com/news/education/as-
questions-swirl-around-voucher-programs-schools-rush-to-apply-b99454338z1-294724801.html 52 Calculations are based on data from U.S. Census Bureau, Small Area Income and Poverty Estimates (SAIPE)
Program, released December 2013.
Figure 9
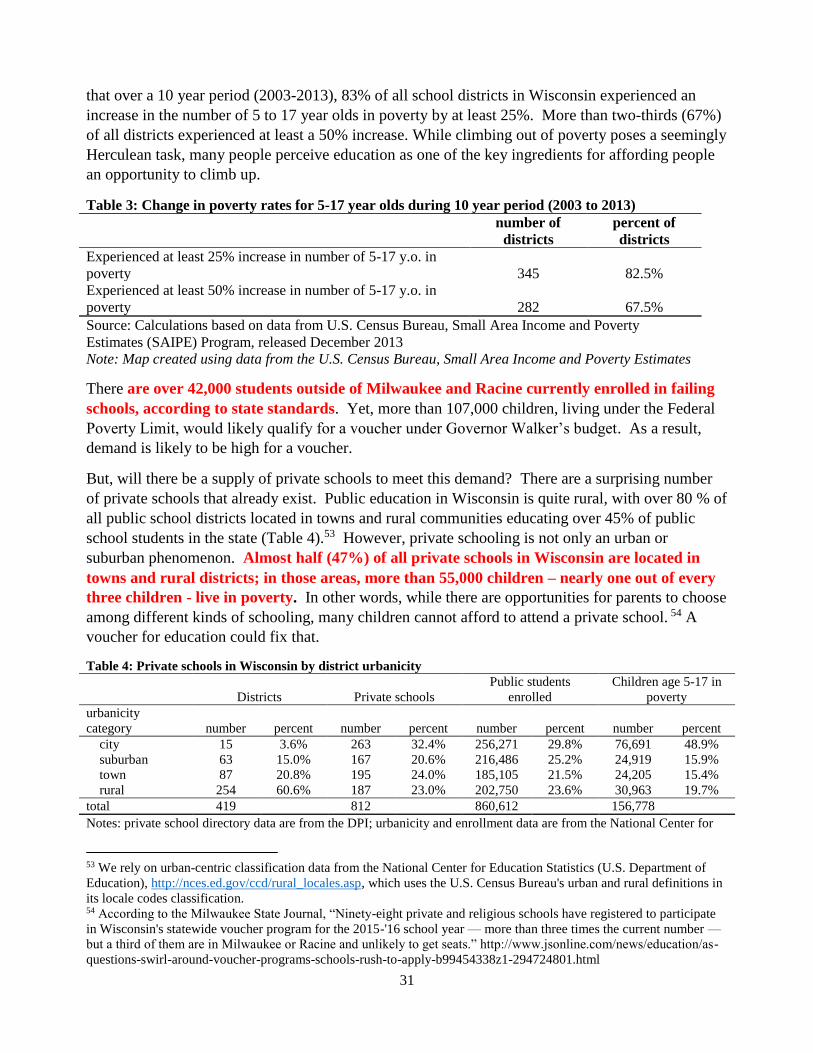
31
that over a 10 year period (2003-2013), 83% of all school districts in Wisconsin experienced an
increase in the number of 5 to 17 year olds in poverty by at least 25%. More than two-thirds (67%)
of all districts experienced at least a 50% increase. While climbing out of poverty poses a seemingly
Herculean task, many people perceive education as one of the key ingredients for affording people
an opportunity to climb up.
Table 3: Change in poverty rates for 5-17 year olds during 10 year period (2003 to 2013)
number of
districts
percent of
districts
Experienced at least 25% increase in number of 5-17 y.o. in
poverty 345 82.5%
Experienced at least 50% increase in number of 5-17 y.o. in
poverty 282 67.5%
Source: Calculations based on data from U.S. Census Bureau, Small Area Income and Poverty
Estimates (SAIPE) Program, released December 2013
Note: Map created using data from the U.S. Census Bureau, Small Area Income and Poverty Estimates
There are over 42,000 students outside of Milwaukee and Racine currently enrolled in failing
schools, according to state standards. Yet, more than 107,000 children, living under the Federal
Poverty Limit, would likely qualify for a voucher under Governor Walker’s budget. As a result,
demand is likely to be high for a voucher.
But, will there be a supply of private schools to meet this demand? There are a surprising number
of private schools that already exist. Public education in Wisconsin is quite rural, with over 80 % of
all public school districts located in towns and rural communities educating over 45% of public
school students in the state (Table 4).53 However, private schooling is not only an urban or
suburban phenomenon. Almost half (47%) of all private schools in Wisconsin are located in
towns and rural districts; in those areas, more than 55,000 children – nearly one out of every
three children - live in poverty. In other words, while there are opportunities for parents to choose
among different kinds of schooling, many children cannot afford to attend a private school. 54 A
voucher for education could fix that.
Table 4: Private schools in Wisconsin by district urbanicity
Districts Private schools
Public students
enrolled
Children age 5-17 in
poverty
urbanicity
category number percent number percent number percent number percent
city 15 3.6% 263 32.4% 256,271 29.8% 76,691 48.9%
suburban 63 15.0% 167 20.6% 216,486 25.2% 24,919 15.9%
town 87 20.8% 195 24.0% 185,105 21.5% 24,205 15.4%
rural 254 60.6% 187 23.0% 202,750 23.6% 30,963 19.7%
total 419 812 860,612 156,778
Notes: private school directory data are from the DPI; urbanicity and enrollment data are from the National Center for
53 We rely on urban-centric classification data from the National Center for Education Statistics (U.S. Department of
Education), http://nces.ed.gov/ccd/rural_locales.asp, which uses the U.S. Census Bureau's urban and rural definitions in
its locale codes classification. 54 According to the Milwaukee State Journal, “Ninety-eight private and religious schools have registered to participate
in Wisconsin's statewide voucher program for the 2015-'16 school year — more than three times the current number —
but a third of them are in Milwaukee or Racine and unlikely to get seats.” http://www.jsonline.com/news/education/as-
questions-swirl-around-voucher-programs-schools-rush-to-apply-b99454338z1-294724801.html
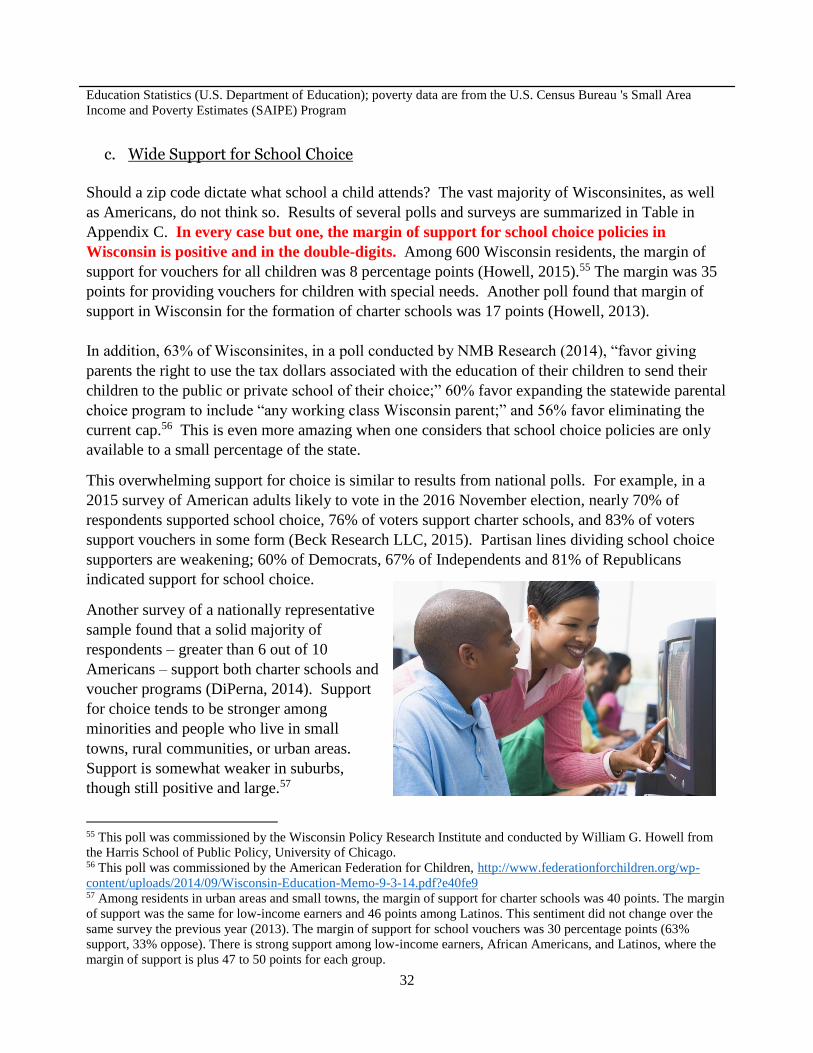
32
Education Statistics (U.S. Department of Education); poverty data are from the U.S. Census Bureau 's Small Area
Income and Poverty Estimates (SAIPE) Program
c. Wide Support for School Choice
Should a zip code dictate what school a child attends? The vast majority of Wisconsinites, as well
as Americans, do not think so. Results of several polls and surveys are summarized in Table in
Appendix C. In every case but one, the margin of support for school choice policies in
Wisconsin is positive and in the double-digits. Among 600 Wisconsin residents, the margin of
support for vouchers for all children was 8 percentage points (Howell, 2015).55 The margin was 35
points for providing vouchers for children with special needs. Another poll found that margin of
support in Wisconsin for the formation of charter schools was 17 points (Howell, 2013).
In addition, 63% of Wisconsinites, in a poll conducted by NMB Research (2014), “favor giving
parents the right to use the tax dollars associated with the education of their children to send their
children to the public or private school of their choice;” 60% favor expanding the statewide parental
choice program to include “any working class Wisconsin parent;” and 56% favor eliminating the
current cap.56 This is even more amazing when one considers that school choice policies are only
available to a small percentage of the state.
This overwhelming support for choice is similar to results from national polls. For example, in a
2015 survey of American adults likely to vote in the 2016 November election, nearly 70% of
respondents supported school choice, 76% of voters support charter schools, and 83% of voters
support vouchers in some form (Beck Research LLC, 2015). Partisan lines dividing school choice
supporters are weakening; 60% of Democrats, 67% of Independents and 81% of Republicans
indicated support for school choice.
Another survey of a nationally representative
sample found that a solid majority of
respondents – greater than 6 out of 10
Americans – support both charter schools and
voucher programs (DiPerna, 2014). Support
for choice tends to be stronger among
minorities and people who live in small
towns, rural communities, or urban areas.
Support is somewhat weaker in suburbs,
though still positive and large.57
55 This poll was commissioned by the Wisconsin Policy Research Institute and conducted by William G. Howell from
the Harris School of Public Policy, University of Chicago. 56 This poll was commissioned by the American Federation for Children, http://www.federationforchildren.org/wp-
content/uploads/2014/09/Wisconsin-Education-Memo-9-3-14.pdf?e40fe9 57 Among residents in urban areas and small towns, the margin of support for charter schools was 40 points. The margin
of support was the same for low-income earners and 46 points among Latinos. This sentiment did not change over the
same survey the previous year (2013). The margin of support for school vouchers was 30 percentage points (63%
support, 33% oppose). There is strong support among low-income earners, African Americans, and Latinos, where the
margin of support is plus 47 to 50 points for each group.
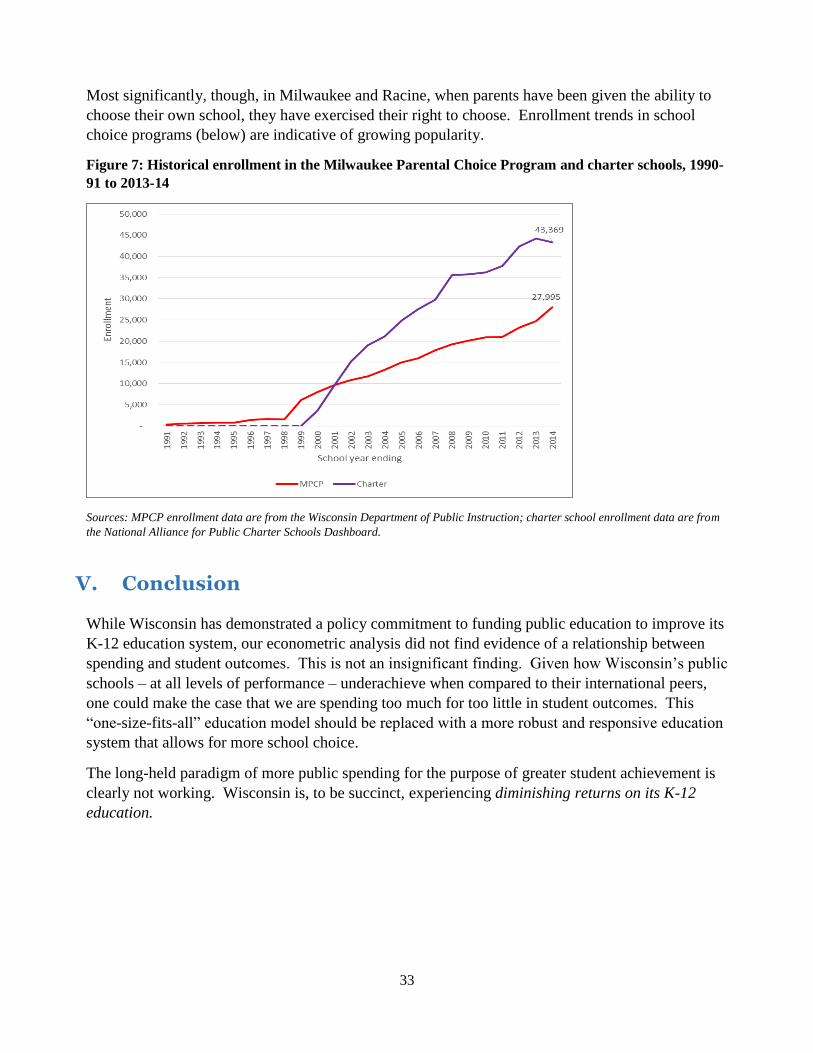
33
Most significantly, though, in Milwaukee and Racine, when parents have been given the ability to
choose their own school, they have exercised their right to choose. Enrollment trends in school
choice programs (below) are indicative of growing popularity.
Figure 7: Historical enrollment in the Milwaukee Parental Choice Program and charter schools, 1990-
91 to 2013-14
Sources: MPCP enrollment data are from the Wisconsin Department of Public Instruction; charter school enrollment data are from
the National Alliance for Public Charter Schools Dashboard.
V. Conclusion
While Wisconsin has demonstrated a policy commitment to funding public education to improve its
K-12 education system, our econometric analysis did not find evidence of a relationship between
spending and student outcomes. This is not an insignificant finding. Given how Wisconsin’s public
schools – at all levels of performance – underachieve when compared to their international peers,
one could make the case that we are spending too much for too little in student outcomes. This
“one-size-fits-all” education model should be replaced with a more robust and responsive education
system that allows for more school choice.
The long-held paradigm of more public spending for the purpose of greater student achievement is
clearly not working. Wisconsin is, to be succinct, experiencing diminishing returns on its K-12
education.
34
References
Beck Research LLC (2015). School Choice Survey Research Results [memo], January 22, 2015.
http://www.federationforchildren.org/wp-content/uploads/2015/01/1_22_15-Polling-Memo-
and-Questions_final.pdf
Bessen, J. (2014). “Employers Aren’t Just Whining – the “Skills Gap” Is Real,” Harvard Business
Review, August 25, 2014.
Center for Research on Education Outcomes (2015). Urban Charter School Study: Report on 41
Regions, CREDO, Stanford University.
Ciotti, P. (1998). Money and School Performance: Lessons from the Kansas City Desegregation
Experiment, CATO Policy Analysis, No. 298, March 16, 1998.
Costrell, R. M. (2010). The Fiscal Impact of the Milwaukee Parental Choice Program: 2010 – 2011
Update and Policy Options, School Choice Demonstration Project, Report #22, December
2010.
Costrell, R. M., and Dean, J. (2013). The rising cost of teachers' health care. Education Next, 13(2),
66.
Cowen, J. M., Fleming, D. J., Witte, J. F., Wolf, P. J., and Kisida, B. (2012). Student Attainment
and the Milwaukee Parental Choice Program: Final Follow-up Analysis, School Choice
Demonstration Project, Report #30, updated and corrected March 8, 2012.
DiPerna, P. (2014). 2014 Schooling in America Survey: Perspectives on School Choice, Common
Core, and Standardized Testing, The Friedman Foundation, Polling Paper No. 20, June
2014.
Esenberg, R., Szafir, C., and Lueken, M. F. (2015b). Apples-to-Oranges? When comparisons are
made between MPCP and MPS schools, Wisconsin Institute for Law & Liberty Policy Brief,
February 9, 2015.
Fleischman, H.L., Hopstock, P.J., Pelczar, M.P., and Shelley, B.E. (2010). Highlights From PISA
2009: Performance of U.S. 15-Year-Old Students in Reading, Mathematics, and Science
Literacy in an International Context (NCES 2011-004). U.S. Department of Education,
National Center for Education Statistics. Washington, DC: U.S. Government Printing
Office.
Hafer, R. W. (2014). Are education and economic growth related? Some evidence from the states,
Show Me Institute, Essay, June 2014.
Hanushek, E. A. (2003). The Failure of Input‐based Schooling Policies. The Economic Journal,
113(485), F64-F98.
Hanushek, E. A., Peterson, P. E., & Woessmann, L. (2011). Teaching Math to the Talented: Which
Countries-And States-Are Producing High-Achieving Students? Education Next, Winter.
Howell, W. (2013). “What Milwaukee Thinks About Its Schools: The Results of Polling and Focus
Groups,” chapter in Pathway to Success for Milwaukee Schools, the Wisconsin Policy
Research Institute.
35
Howell, W. G. (2015). WPRI Survey of Wisconsin Residents [presentation], January 12, 2015.
http://www.wpri.org/WPRI-Files/Polls/WPRI_Presentation_Final.pdf
Klein, J. L. and Rice, C. (2012). U.S. Education Reform and National Security, Council on Foreign
Relations, Independent Task Force Report No. 68.
Kremer, M., Chaudhury, N., Rogers, F. H., Muralidharan, K., & Hammer, J. (2005). Teacher
absence in India: A snapshot. Journal of the European Economic Association, 3(2‐3), 658-
667.
Ladner, M. (2015). Turn and Face the Strain: Age Demographic Change and the Near Future of
American Education, The Friedman Foundation for Educational Choice, January 2015.
Levine, M. V. (2013). The Skills Gap and Unemployment in Wisconsin: Separating Fact from
Fiction, University of Wisconsin-Milwaukee Center for Economic Development, working
paper, February 2013.
Lortiz, M., Nerad, B., Sletten, P. and Cunha, J. (2013). Examining the Skills Gap in Wisconsin,
Paper prepared for the Wisconsin Leglislative Council, Spring 2013.
Muralidharan, K., and Sundararaman, V. (2011). Teacher Performance Pay: Experimental Evidence
from India. The Journal of Political Economy, 119(1), 39-77.
National Alliance for Public Charter Schools (2014). The Health of the Public Charter School
Movement: A State-By-State Analysis, October 2014. http://www.publiccharters.org/wp-
content/uploads/2015/01/model_law_2015.pdf
Nisar, H. (2013a). Heterogeneous Charter Schools Impacts on Student Achievement, working paper,
May 2013.
Nisar, H. (2013b). Heterogeneous Competitive Effects of Charter Schools in Milwaukee, working
paper, January 2013.
NMB Research (2014). Wisconsin Education Poll Findings [memorandum], September 3, 2014,
http://www.federationforchildren.org/wp-content/uploads/2014/09/Wisconsin-Education-
Memo-9-3-14.pdf?e40fe9
OECD (2011). “Can disadvantaged students defy the odds against them?”, in PISA 2009 at a
Glance, OECD Publishing. http://dx.doi.org/10.1787/9789264095250-21-en
OECD (2012). Programme for International Student Assessment Results from PISA 2012: United
States, http://www.oecd.org/unitedstates/PISA-2012-results-US.pdf
OECD (2013), PISA 2012 Results: Excellence Through Equity: Giving Every Student the Chance to
Succeed (Volume II), PISA, OECD Publishing. http://dx.doi.org/10.1787/9789264201132-en
OECD (2015), Education spending (indicator). doi: 10.1787/ca274bac-en (Accessed on 04 March
2015)
Peterson, P. E., Woessmann, L., Hanushek, E. A., & Lastra-Anadón, C. X. (2011). Globally
Challenged: Are US Students Ready to Compete? The Latest on Each State's International
Standing in Math and Reading. PEPG 11-03. Program on Education Policy and Governance,
Harvard University.
36
School Choice Wisconsin (2014). Demand for School Choice Surges Ahead: Caps Are Barrier to
Program, Press release, May 20, 2014.
http://www.schoolchoicewi.org/files/5414/0061/2726/SCW.WPCP.PressRelease.May2014.
Final.pdf
Spalding, J. (2014). The School Voucher Audit: Do Publicly Funded Private School Choice
Programs Save Money? The Friedman Foundation, September 2014.
Springer, M. G., Houck, E. A., and Guthrie, J. W. (2008). “History and scholarship regarding
United States education finance and policy,” in Handbook of research in education finance
and policy, ed. Helen F. Ladd and Edward B. Fiske (New York: Rutledge), 3-22.
STEM Education Coalition (2014). The Case for STEM Education as a National Priority: Good
Jobs and American Competitiveness, updated September 2014.
U.S. Bureau of Labor Statistics (2014). Table 4, State and local government, by occupational and
industry group, December 2014, http://data.bls.gov/cgi-
bin/print.pl/news.release/ecec.t04.htm.
Wisconsin Department of Education (2013). Wisconsin Charter Schools Yearbook 2013–2014,
Bulletin No. 14053, http://sms.dpi.wi.gov/sites/default/files/imce/sms/pdf/2013-
14yearbook.pdf.
Wisconsin Legislative Fiscal Bureau (2013a). Milwaukee and Racine Parental Choice Programs,
Wisconsin Legislative Fiscal Bureau Informational Paper 26, January 2013.
Wisconsin Legislative Fiscal Bureau (2013b). Charter Schools, Wisconsin Legislative Fiscal
Bureau Informational Paper 28, January 2013.
Wisconsin Manufacturers & Commerce (2013). 2013 Economic Outlook Survey, Mid-Year Report:
June 2013, https://www.wmc.org/wp-content/uploads/WMC_CEOsurvey_June2013.pdf
Witte, J. F., Wolf, P. J., Dean, A., and Carlson, D. (2011). Milwaukee Independent Charter Schools
Study: Report on Two- and Three-Year Achievement Gains, SCDP Milwaukee Evaluation
Report #25, March 2011. http://www.uaedreform.org/downloads/2011/03/report-25-
milwuakee-independent-charter-schools-study-report-on-two-and-three-year-achievement-
gains.pdf
Witte, J. F., Wolf, P. J., Dean, A., and Carlson, D. (2012). Milwaukee Independent Charter Schools
Study: Final Report on Four-Year Achievement Gains, SCDP Milwaukee Evaluation Report
#31, February 2012. http://www.uaedreform.org/downloads/2012/02/report-31-milwaukee-
independent-charter-schools-study-final-report-on-four-year-achievement-gains.pdf
Wolf, P. J. (2007). Civics Exam, Education Next, Summer 2007.
Wolf, P. J. (2012). The Comprehensive Longitudinal Evaluation of the Milwaukee Parental Choice
Program: Summary of Final Reports, School Choice Demonstration Project, Report #36,
February 2012.
Wolf, P. J., Cheng, A., Batdorff, M., Maloney, L., May, J. F., and Speakman, S. T. (2014). The
Productivity of Public Charter Schools, School Choice Demonstration Project, July 2014.
http://www.uaedreform.org/downloads/2014/07/the-productivity-of-public-charter-
schools.pdf
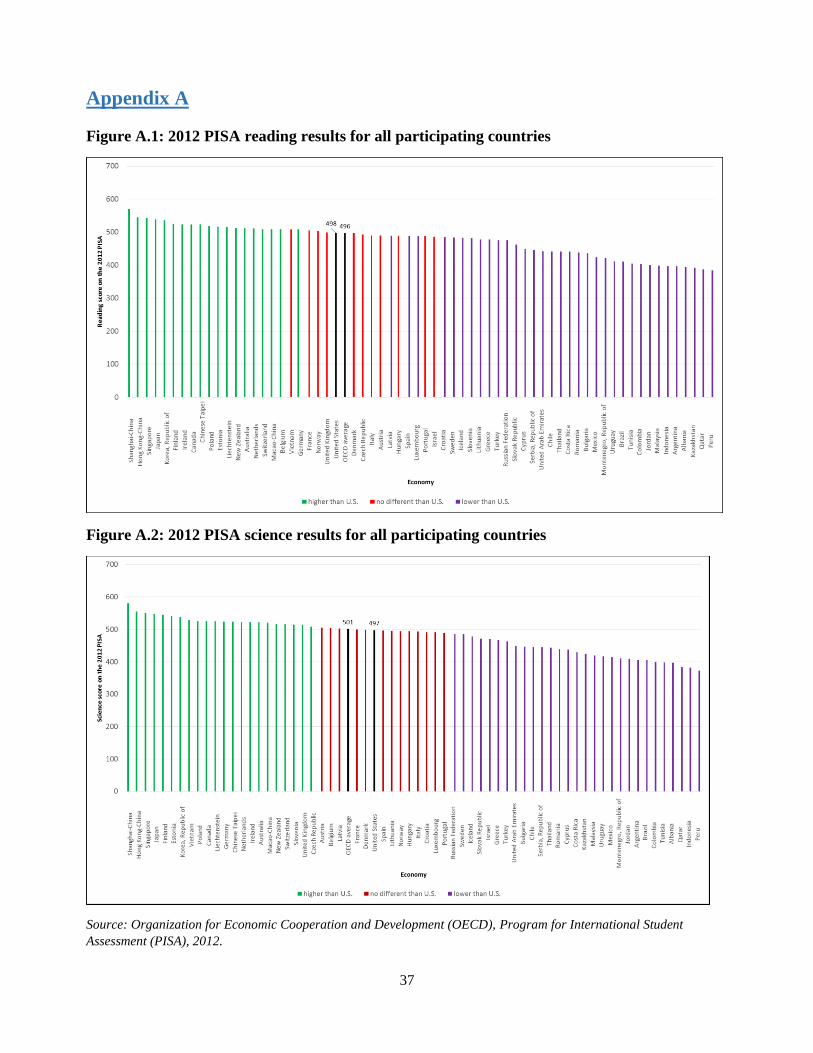
37
Appendix A
Figure A.1: 2012 PISA reading results for all participating countries
Figure A.2: 2012 PISA science results for all participating countries
Source: Organization for Economic Cooperation and Development (OECD), Program for International Student
Assessment (PISA), 2012.
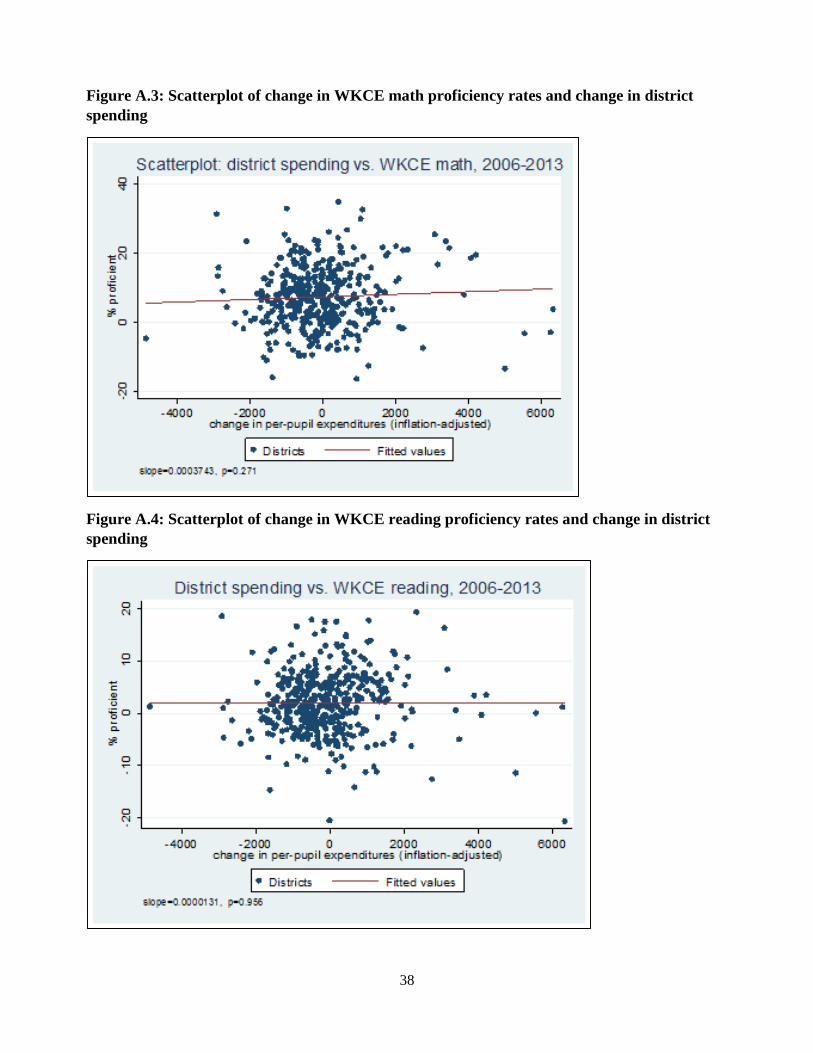
38
Figure A.3: Scatterplot of change in WKCE math proficiency rates and change in district
spending
Figure A.4: Scatterplot of change in WKCE reading proficiency rates and change in district
spending
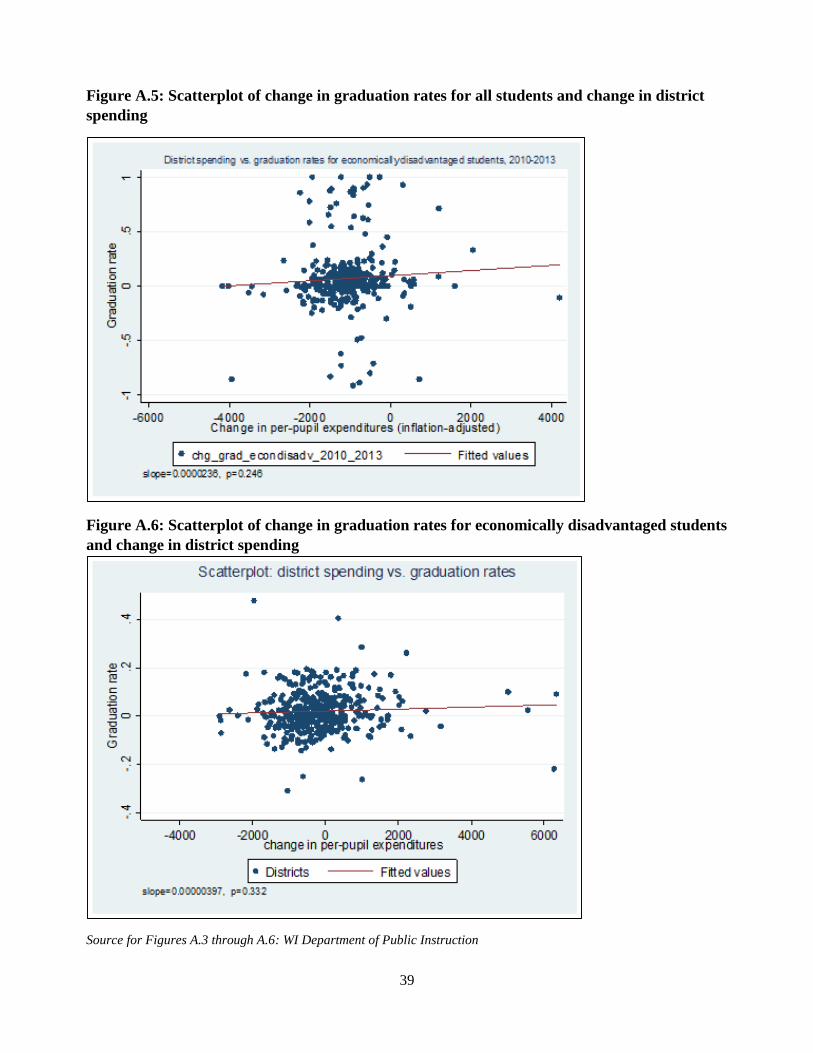
39
Figure A.5: Scatterplot of change in graduation rates for all students and change in district
spending
Figure A.6: Scatterplot of change in graduation rates for economically disadvantaged students
and change in district spending
Source for Figures A.3 through A.6: WI Department of Public Instruction
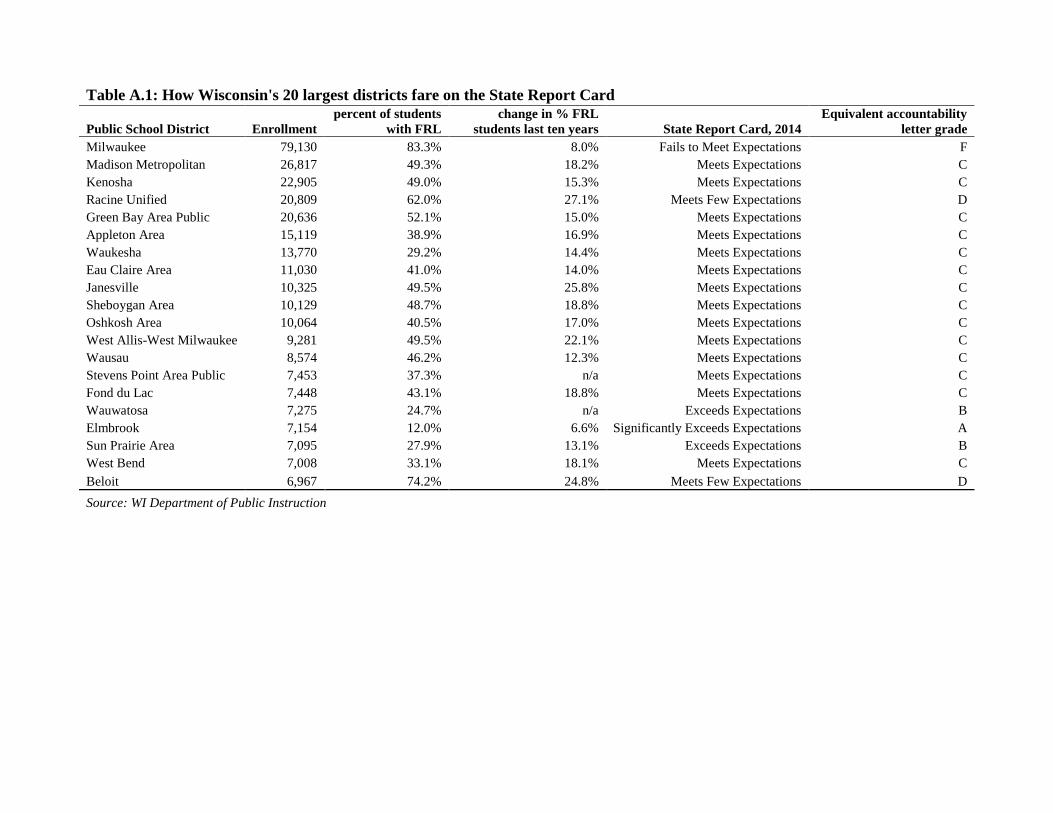
Table A.1: How Wisconsin's 20 largest districts fare on the State Report Card
Public School District Enrollment
percent of students
with FRL
change in % FRL
students last ten years State Report Card, 2014
Equivalent accountability
letter grade
Milwaukee 79,130 83.3% 8.0% Fails to Meet Expectations F
Madison Metropolitan 26,817 49.3% 18.2% Meets Expectations C
Kenosha 22,905 49.0% 15.3% Meets Expectations C
Racine Unified 20,809 62.0% 27.1% Meets Few Expectations D
Green Bay Area Public 20,636 52.1% 15.0% Meets Expectations C
Appleton Area 15,119 38.9% 16.9% Meets Expectations C
Waukesha 13,770 29.2% 14.4% Meets Expectations C
Eau Claire Area 11,030 41.0% 14.0% Meets Expectations C
Janesville 10,325 49.5% 25.8% Meets Expectations C
Sheboygan Area 10,129 48.7% 18.8% Meets Expectations C
Oshkosh Area 10,064 40.5% 17.0% Meets Expectations C
West Allis-West Milwaukee 9,281 49.5% 22.1% Meets Expectations C
Wausau 8,574 46.2% 12.3% Meets Expectations C
Stevens Point Area Public 7,453 37.3% n/a Meets Expectations C
Fond du Lac 7,448 43.1% 18.8% Meets Expectations C
Wauwatosa 7,275 24.7% n/a Exceeds Expectations B
Elmbrook 7,154 12.0% 6.6% Significantly Exceeds Expectations A
Sun Prairie Area 7,095 27.9% 13.1% Exceeds Expectations B
West Bend 7,008 33.1% 18.1% Meets Expectations C
Beloit 6,967 74.2% 24.8% Meets Few Expectations D
Source: WI Department of Public Instruction
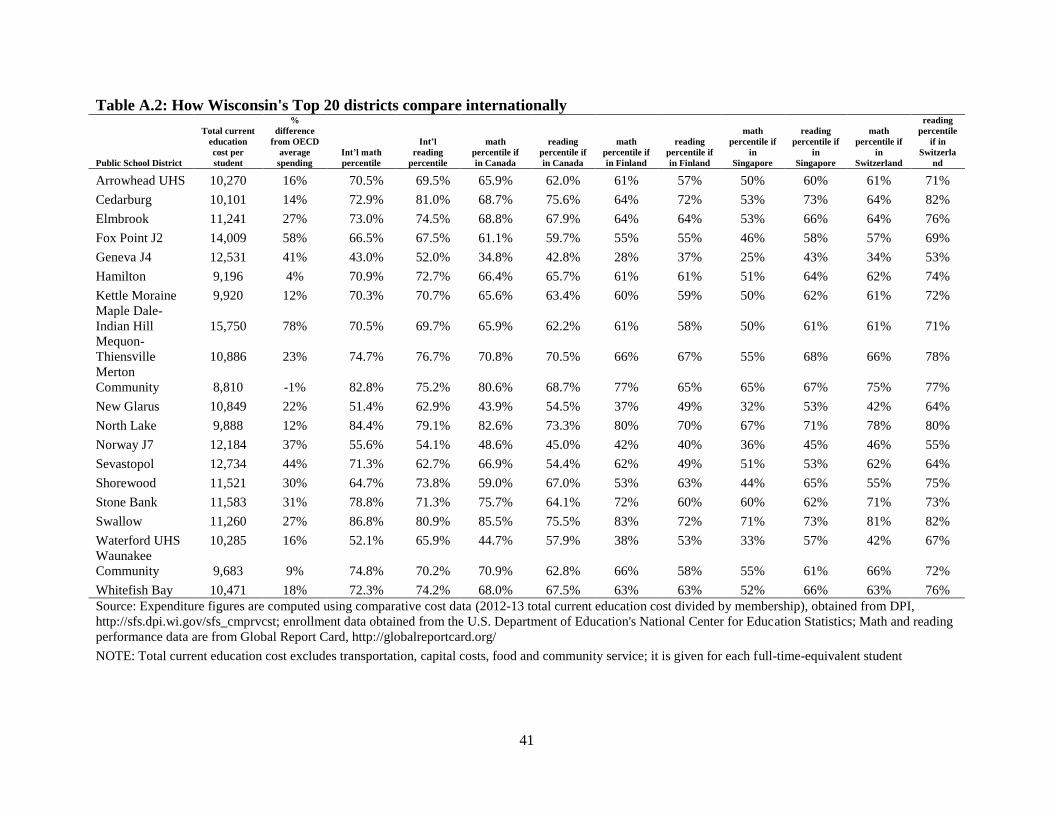
41
Table A.2: How Wisconsin's Top 20 districts compare internationally
Public School District
Total current
education
cost per
student
%
difference
from OECD
average
spending
Int’l math
percentile
Int’l
reading
percentile
math
percentile if
in Canada
reading
percentile if
in Canada
math
percentile if
in Finland
reading
percentile if
in Finland
math
percentile if
in
Singapore
reading
percentile if
in
Singapore
math
percentile if
in
Switzerland
reading
percentile
if in
Switzerla
nd
Arrowhead UHS 10,270 16% 70.5% 69.5% 65.9% 62.0% 61% 57% 50% 60% 61% 71%
Cedarburg 10,101 14% 72.9% 81.0% 68.7% 75.6% 64% 72% 53% 73% 64% 82%
Elmbrook 11,241 27% 73.0% 74.5% 68.8% 67.9% 64% 64% 53% 66% 64% 76%
Fox Point J2 14,009 58% 66.5% 67.5% 61.1% 59.7% 55% 55% 46% 58% 57% 69%
Geneva J4 12,531 41% 43.0% 52.0% 34.8% 42.8% 28% 37% 25% 43% 34% 53%
Hamilton 9,196 4% 70.9% 72.7% 66.4% 65.7% 61% 61% 51% 64% 62% 74%
Kettle Moraine 9,920 12% 70.3% 70.7% 65.6% 63.4% 60% 59% 50% 62% 61% 72%
Maple Dale-
Indian Hill 15,750 78% 70.5% 69.7% 65.9% 62.2% 61% 58% 50% 61% 61% 71%
Mequon-
Thiensville 10,886 23% 74.7% 76.7% 70.8% 70.5% 66% 67% 55% 68% 66% 78%
Merton
Community 8,810 -1% 82.8% 75.2% 80.6% 68.7% 77% 65% 65% 67% 75% 77%
New Glarus 10,849 22% 51.4% 62.9% 43.9% 54.5% 37% 49% 32% 53% 42% 64%
North Lake 9,888 12% 84.4% 79.1% 82.6% 73.3% 80% 70% 67% 71% 78% 80%
Norway J7 12,184 37% 55.6% 54.1% 48.6% 45.0% 42% 40% 36% 45% 46% 55%
Sevastopol 12,734 44% 71.3% 62.7% 66.9% 54.4% 62% 49% 51% 53% 62% 64%
Shorewood 11,521 30% 64.7% 73.8% 59.0% 67.0% 53% 63% 44% 65% 55% 75%
Stone Bank 11,583 31% 78.8% 71.3% 75.7% 64.1% 72% 60% 60% 62% 71% 73%
Swallow 11,260 27% 86.8% 80.9% 85.5% 75.5% 83% 72% 71% 73% 81% 82%
Waterford UHS 10,285 16% 52.1% 65.9% 44.7% 57.9% 38% 53% 33% 57% 42% 67%
Waunakee
Community 9,683 9% 74.8% 70.2% 70.9% 62.8% 66% 58% 55% 61% 66% 72%
Whitefish Bay 10,471 18% 72.3% 74.2% 68.0% 67.5% 63% 63% 52% 66% 63% 76%
Source: Expenditure figures are computed using comparative cost data (2012-13 total current education cost divided by membership), obtained from DPI,
http://sfs.dpi.wi.gov/sfs_cmprvcst; enrollment data obtained from the U.S. Department of Education's National Center for Education Statistics; Math and reading
performance data are from Global Report Card, http://globalreportcard.org/
NOTE: Total current education cost excludes transportation, capital costs, food and community service; it is given for each full-time-equivalent student
42
Appendix B
Robustness checks: The makeup of a district’s student body is likely endogenous with spending –
for instance, districts receive additional revenue for educating economically disadvantaged
students or special education students and, therefore, will likely have higher levels of
expenditures. Therefore, we also estimated alternative specifications of equation (1) above, such
as models that exclude district fixed effects and demographic variables. Results do not change
our conclusion. When we run an OLS model without fixed effects but with demographic
controls, we find estimates that are positive and statistically significant. This model, however, is
essentially asking a different question. Rather than looking at how changes in spending within
each district affect student outcomes, it looks at districts pooled together. Thus, it conveys how
districts that spend more perform relative to districts that spend less. But even if one somehow
believes this is evident of positive effects, this does not lend itself to conclusive evidence of a
systematic impact by spending. Grouped with other evidence we present in this paper, these
findings do not constitute reliable and consistent statistical evidence that points to systematic
relationship.
We also subset districts by urbanicity (districts located in cities, suburbs, towns, and rural
communities). Again, the results from these analyses do not reveal conclusive evidence that
indicate marginal changes in spending have a significant impact on student outcomes.
We also estimated models that account for variation in district expenditures by including per-
pupil expenditures dedicated to different functions. These categorical expenditures include:58
- Current expenditures for instruction, including teacher salaries and benefits and
instructional supplies and purchased services and excluding tuition payments to other
school districts;
- General Administration expenditures for board of education and executive administration
services, and other LEA administrative functions;
- Instructional staff support expenditures including supervision of instruction service
improvements, curriculum development, instructional staff training, and media, library,
audiovisual, television, and computer-assisted instruction services;
- School Administration expenditures for the office of the principal services; and
- Pupil support expenditures for guidance, health, and logistical support that enhance
instruction; these expenditures include attendance, social work, student accounting,
counseling, student appraisal, information, record maintenance, and placement services;
Results are reported in Table B.1 in the appendix. While we observe a few positive estimates for
each categorical spending variable, most estimates are negative, and none are statistically
significant at the 95% confidence level. Thus, we cannot conclude that additional spending had
any significant impact on student outcomes.
58 These data were obtained from the NCES and were available up to 2011.

43
We also estimated models with outcome and demographic data reported at the school level.
These models account for intra-district variation in outcomes and clustered standard errors at the
district level. Again, we cannot conclude that additional spending had a significant impact on
student outcomes.
Because federal and state funds are allocated to districts, and districts disburse dollars to
individual schools, we cannot rule out the possibility that school-level expenditure data might
produce different results. Unfortunately, longitudinal data for school-level spending are not
available. However, under the American Recovery and Reinvestment Act of 2009 (ARRA),
states were required to report school-level expenditures for the 2008-09 school year for all
districts that received Title I Part A funds. As a final robust check, we obtained these data and
estimated the following model for Wisconsin:
(2) Yj2010 = α +ψYj2009 + β1ln(PPE_school)j2009 + β1ln(PPE_teacher_sal)j2009 +
β1ln(PPE_staff_sal)j2009 + δXj2009 + εjt
where notation is the same as above, except that 2009 refers to the 2008-09 school year,
PPE_school gives per-pupil school expenditures minus all personnel salaries, PPE_teacher_sal
denotes teacher salaries, and PPE_staff_sal represents teacher support staff salaries. Once again,
the results are similar (Table B.2). Most estimates on each expenditure variable are not
statistically significant. This time, we observe a positive impact by non-personnel expenditures
on WKCE reading and college readiness in science, but a negative impact on WKCE math.
Estimates imply that a 10% increase in non-personnel spending by schools was associated with
0.3 percent fewer students proficient on the WKCE math exam and 0.25 percent more students
proficient on the WKCE reading exam, holding other variables constant. Keep in mind that these
school-level data provide only a snapshot. Nevertheless, these observations add support to our
previous findings. We are unable to find any conclusive evidence of a systematic relationship.
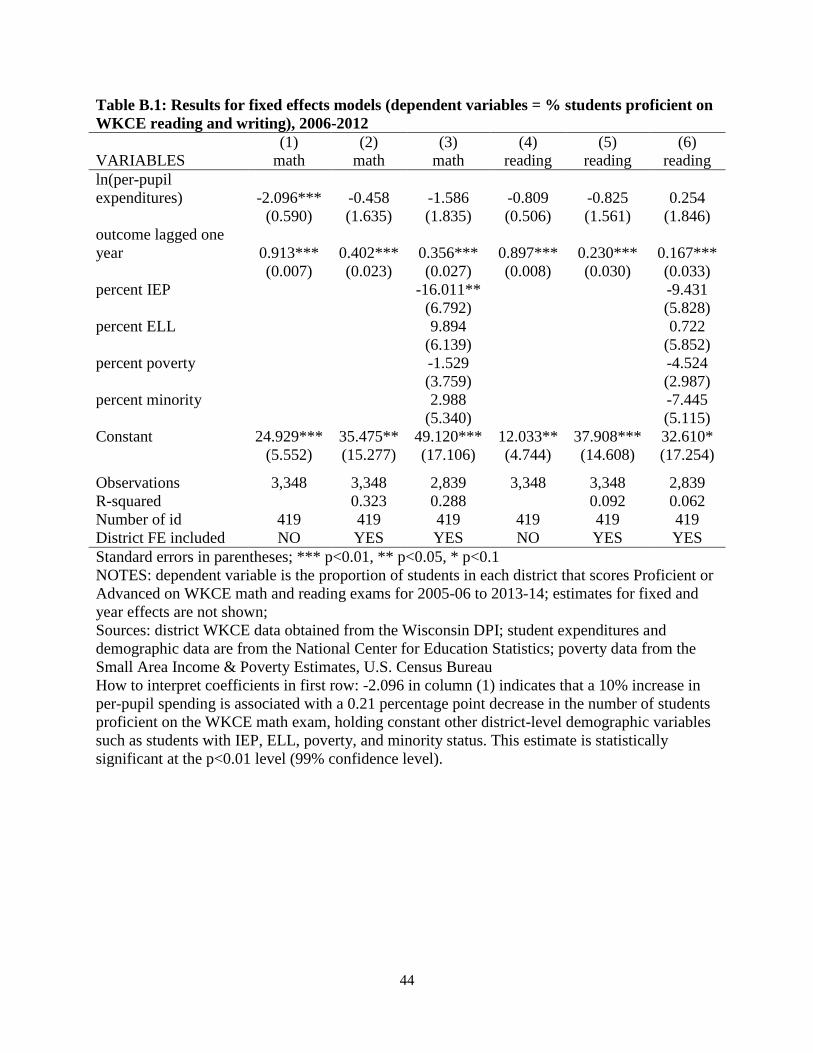
44
Table B.1: Results for fixed effects models (dependent variables = % students proficient on
WKCE reading and writing), 2006-2012
(1) (2) (3) (4) (5) (6)
VARIABLES math math math reading reading reading
ln(per-pupil
expenditures) -2.096*** -0.458 -1.586 -0.809 -0.825 0.254
(0.590) (1.635) (1.835) (0.506) (1.561) (1.846)
outcome lagged one
year 0.913*** 0.402*** 0.356*** 0.897*** 0.230*** 0.167***
(0.007) (0.023) (0.027) (0.008) (0.030) (0.033)
percent IEP
-16.011**
-9.431
(6.792)
(5.828)
percent ELL
9.894
0.722
(6.139)
(5.852)
percent poverty
-1.529
-4.524
(3.759)
(2.987)
percent minority
2.988
-7.445
(5.340)
(5.115)
Constant 24.929*** 35.475** 49.120*** 12.033** 37.908*** 32.610*
(5.552) (15.277) (17.106) (4.744) (14.608) (17.254)
Observations 3,348 3,348 2,839 3,348 3,348 2,839
R-squared
0.323 0.288
0.092 0.062
Number of id 419 419 419 419 419 419
District FE included NO YES YES NO YES YES
Standard errors in parentheses; *** p<0.01, ** p<0.05, * p<0.1
NOTES: dependent variable is the proportion of students in each district that scores Proficient or
Advanced on WKCE math and reading exams for 2005-06 to 2013-14; estimates for fixed and
year effects are not shown;
Sources: district WKCE data obtained from the Wisconsin DPI; student expenditures and
demographic data are from the National Center for Education Statistics; poverty data from the
Small Area Income & Poverty Estimates, U.S. Census Bureau
How to interpret coefficients in first row: -2.096 in column (1) indicates that a 10% increase in
per-pupil spending is associated with a 0.21 percentage point decrease in the number of students
proficient on the WKCE math exam, holding constant other district-level demographic variables
such as students with IEP, ELL, poverty, and minority status. This estimate is statistically
significant at the p<0.01 level (99% confidence level).
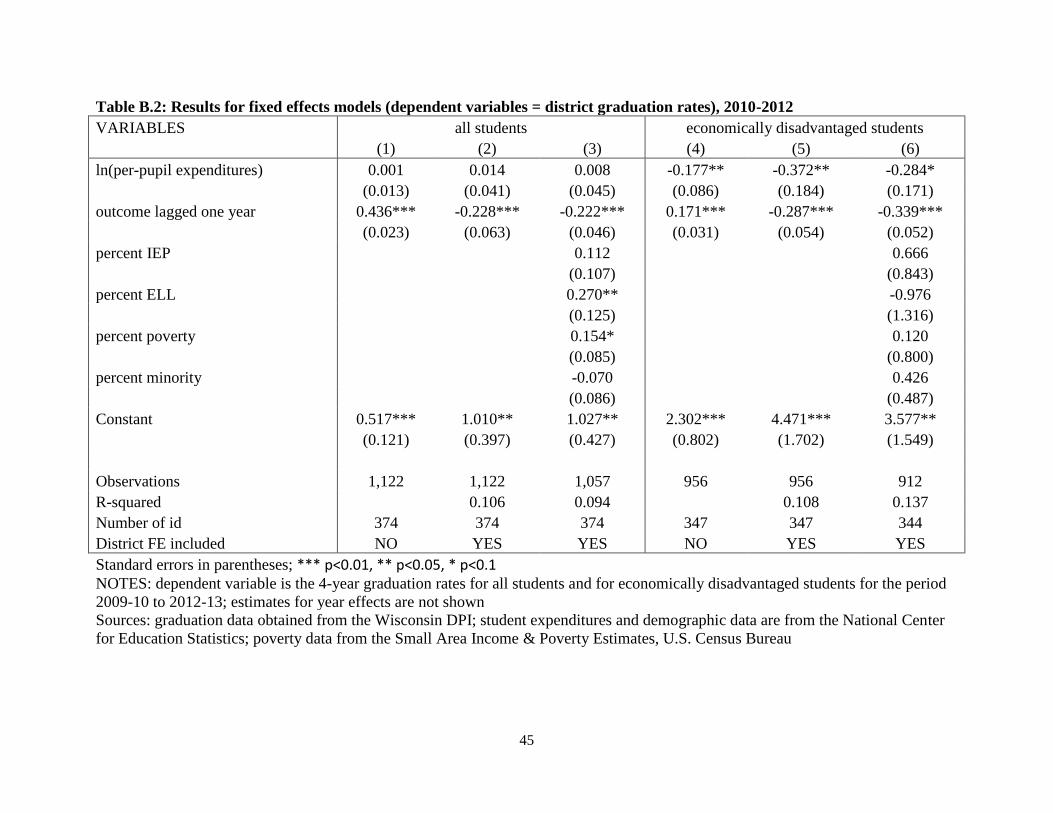
45
Table B.2: Results for fixed effects models (dependent variables = district graduation rates), 2010-2012
VARIABLES all students economically disadvantaged students
(1) (2) (3) (4) (5) (6)
ln(per-pupil expenditures) 0.001 0.014 0.008 -0.177** -0.372** -0.284*
(0.013) (0.041) (0.045) (0.086) (0.184) (0.171)
outcome lagged one year 0.436*** -0.228*** -0.222*** 0.171*** -0.287*** -0.339***
(0.023) (0.063) (0.046) (0.031) (0.054) (0.052)
percent IEP
0.112
0.666
(0.107)
(0.843)
percent ELL
0.270**
-0.976
(0.125)
(1.316)
percent poverty
0.154*
0.120
(0.085)
(0.800)
percent minority
-0.070
0.426
(0.086)
(0.487)
Constant 0.517*** 1.010** 1.027** 2.302*** 4.471*** 3.577**
(0.121) (0.397) (0.427) (0.802) (1.702) (1.549)
Observations 1,122 1,122 1,057 956 956 912
R-squared 0.106 0.094 0.108 0.137
Number of id 374 374 374 347 347 344
District FE included NO YES YES NO YES YES
Standard errors in parentheses; *** p<0.01, ** p<0.05, * p<0.1
NOTES: dependent variable is the 4-year graduation rates for all students and for economically disadvantaged students for the period
2009-10 to 2012-13; estimates for year effects are not shown
Sources: graduation data obtained from the Wisconsin DPI; student expenditures and demographic data are from the National Center
for Education Statistics; poverty data from the Small Area Income & Poverty Estimates, U.S. Census Bureau

46
Table B.3: regression results (dependent variable = per-pupil expenditures by function)
(1) (2) (3) (4) (5) (6) (7) (8) (9)
VARIABLES
percent
proficient
WKCE
math
percent
proficient
WKCE
math
graduation
rate, all
students
graduation
rate, econ
disadv
students
ACT
composite
College
readiness
reading
College
readiness
math
College
readiness
English
College
readiness
science
ln(ppe, instructional) 2.523 0.681 -0.021 -0.204 -0.107 0.041 -0.015 -0.039 0.057
(2.374) (2.511) (0.067) (0.363) (0.343) (0.097) (0.096) (0.097) (0.089)
ln(ppe, general administration) 0.575 -0.656 0.019 0.156 -0.056 -0.009 -0.048* 0.038 -0.039*
(0.912) (0.737) (0.025) (0.123) (0.127) (0.028) (0.028) (0.027) (0.024)
ln(ppe, instructional staff support) -0.505 -0.183 -0.013 -0.151 0.045 0.002 -0.001 -0.007 0.030*
(0.773) (0.566) (0.017) (0.122) (0.096) (0.018) (0.023) (0.020) (0.018)
ln(ppe, school administration) -0.508 -0.216 -0.009 -0.028 0.120 -0.006 0.040 -0.008 0.034
(0.430) (0.475) (0.007) (0.244) (0.086) (0.042) (0.035) (0.049) (0.042)
ln(ppe, student support services) -0.681 -0.592 0.011 0.056 -0.102 0.011 0.011 0.015 -0.004
(0.887) (0.506) (0.011) (0.097) (0.102) (0.024) (0.023) (0.022) (0.020)
outcome lagged one year 0.313*** 0.114*** -0.286*** -0.481*** 0.027 -0.231*** -0.221*** -0.269*** -0.259***
(0.030) (0.038) (0.085) (0.078) (0.023) (0.032) (0.037) (0.038) (0.034)
Constant 17.208 36.675* 1.335** 2.785 22.425*** 0.390 0.768 1.099 -0.184
(21.791) (22.156) (0.651) (2.866) (3.058) (0.812) (0.873) (0.851) (0.733)
Observations 2,409 2,409 739 632 3,990 1,458 1,458 1,458 1,447
R-squared 0.258 0.032 0.189 0.259 0.041 0.062 0.098 0.071 0.096
Number of id 404 404 370 330 370 368 368 368 367
Robust standard errors in parentheses; *** p<0.01, ** p<0.05, * p<0.1
Sources: expenditure data are from the National Center for Education Statistics (U.S. Department of Education); district WKCE data, graduation data, and ACT
data obtained from the Wisconsin Department of Public Instruction
How to interpret coefficients in first row: 2.5 in column (1) indicates that a 10% increase in per-pupil spending is associated with a 0.25 percentage point
decrease in the in the number of students proficient on the WKCE math exam.
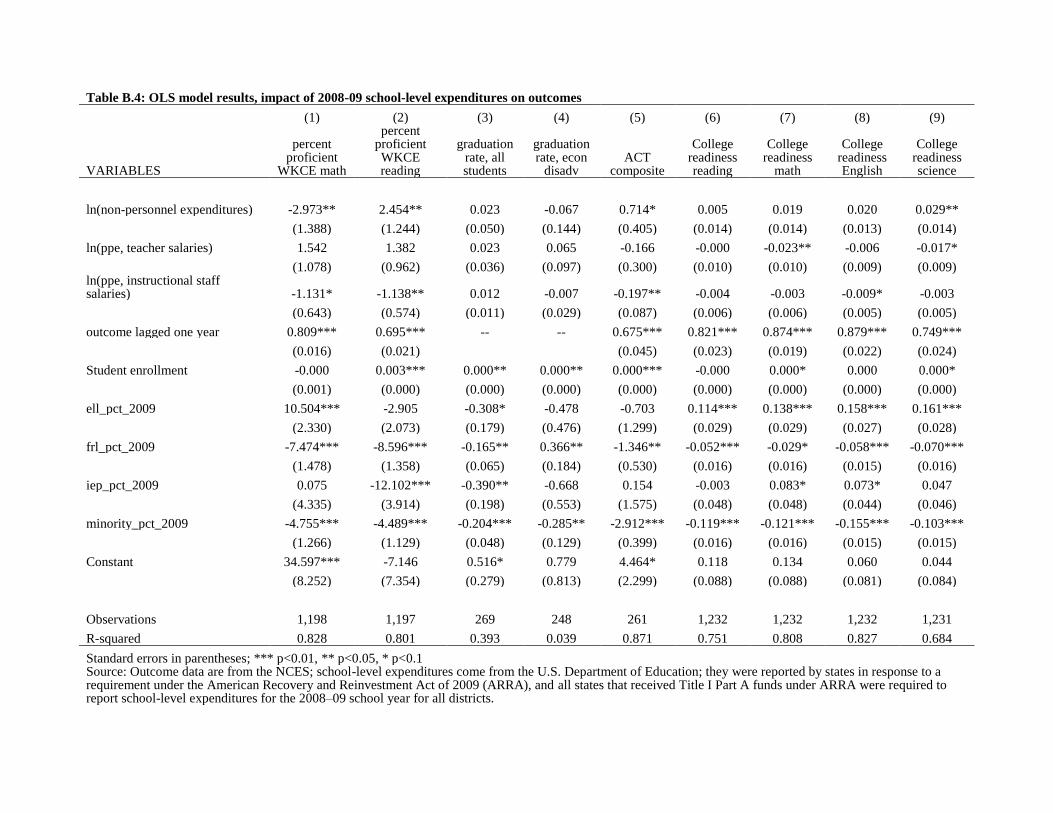
Table B.4: OLS model results, impact of 2008-09 school-level expenditures on outcomes
(1) (2) (3) (4) (5) (6) (7) (8) (9)
VARIABLES
percent proficient
WKCE math
percent proficient WKCE reading
graduation rate, all students
graduation rate, econ
disadv ACT
composite
College readiness reading
College readiness
math
College readiness English
College readiness science
ln(non-personnel expenditures) -2.973** 2.454** 0.023 -0.067 0.714* 0.005 0.019 0.020 0.029**
(1.388) (1.244) (0.050) (0.144) (0.405) (0.014) (0.014) (0.013) (0.014)
ln(ppe, teacher salaries) 1.542 1.382 0.023 0.065 -0.166 -0.000 -0.023** -0.006 -0.017*
(1.078) (0.962) (0.036) (0.097) (0.300) (0.010) (0.010) (0.009) (0.009)
ln(ppe, instructional staff salaries) -1.131* -1.138** 0.012 -0.007 -0.197** -0.004 -0.003 -0.009* -0.003
(0.643) (0.574) (0.011) (0.029) (0.087) (0.006) (0.006) (0.005) (0.005)
outcome lagged one year 0.809*** 0.695*** -- -- 0.675*** 0.821*** 0.874*** 0.879*** 0.749***
(0.016) (0.021)
(0.045) (0.023) (0.019) (0.022) (0.024)
Student enrollment -0.000 0.003*** 0.000** 0.000** 0.000*** -0.000 0.000* 0.000 0.000*
(0.001) (0.000) (0.000) (0.000) (0.000) (0.000) (0.000) (0.000) (0.000)
ell_pct_2009 10.504*** -2.905 -0.308* -0.478 -0.703 0.114*** 0.138*** 0.158*** 0.161***
(2.330) (2.073) (0.179) (0.476) (1.299) (0.029) (0.029) (0.027) (0.028)
frl_pct_2009 -7.474*** -8.596*** -0.165** 0.366** -1.346** -0.052*** -0.029* -0.058*** -0.070***
(1.478) (1.358) (0.065) (0.184) (0.530) (0.016) (0.016) (0.015) (0.016)
iep_pct_2009 0.075 -12.102*** -0.390** -0.668 0.154 -0.003 0.083* 0.073* 0.047
(4.335) (3.914) (0.198) (0.553) (1.575) (0.048) (0.048) (0.044) (0.046)
minority_pct_2009 -4.755*** -4.489*** -0.204*** -0.285** -2.912*** -0.119*** -0.121*** -0.155*** -0.103***
(1.266) (1.129) (0.048) (0.129) (0.399) (0.016) (0.016) (0.015) (0.015)
Constant 34.597*** -7.146 0.516* 0.779 4.464* 0.118 0.134 0.060 0.044
(8.252) (7.354) (0.279) (0.813) (2.299) (0.088) (0.088) (0.081) (0.084)
Observations 1,198 1,197 269 248 261 1,232 1,232 1,232 1,231
R-squared 0.828 0.801 0.393 0.039 0.871 0.751 0.808 0.827 0.684
Standard errors in parentheses; *** p<0.01, ** p<0.05, * p<0.1 Source: Outcome data are from the NCES; school-level expenditures come from the U.S. Department of Education; they were reported by states in response to a requirement under the American Recovery and Reinvestment Act of 2009 (ARRA), and all states that received Title I Part A funds under ARRA were required to report school-level expenditures for the 2008–09 school year for all districts.
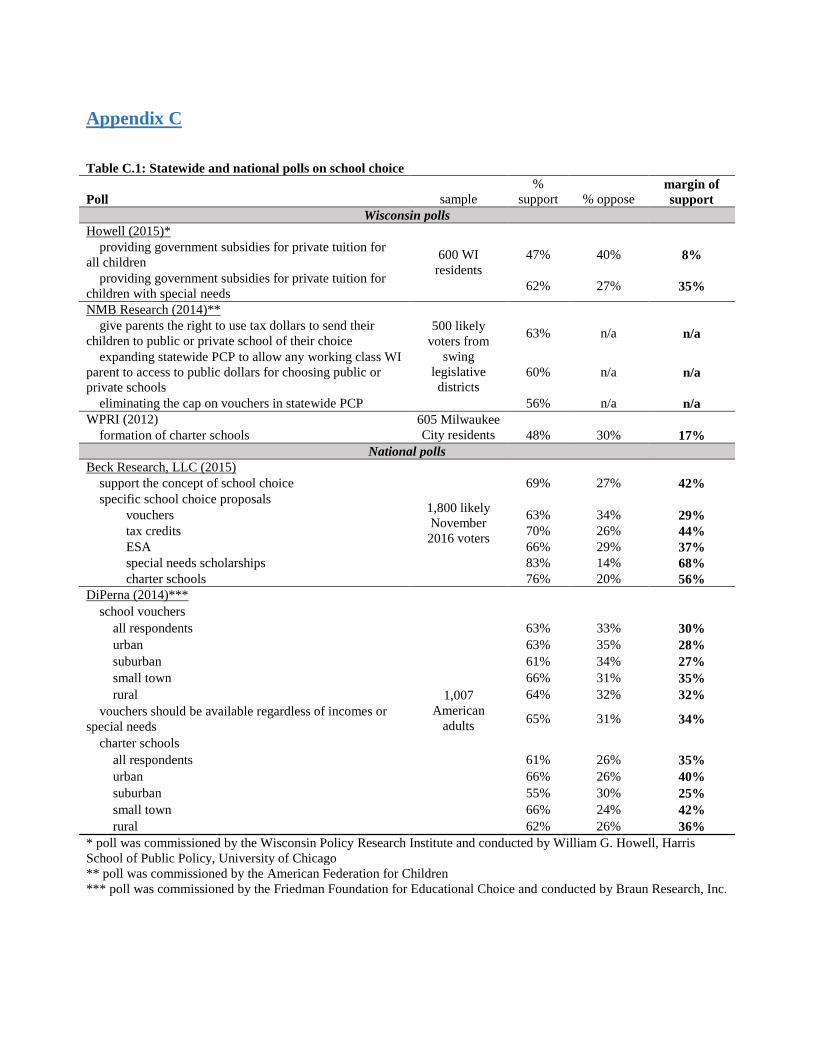
Appendix C
Table C.1: Statewide and national polls on school choice
Poll sample
%
support % oppose margin of
support
Wisconsin polls
Howell (2015)*
600 WI
residents
providing government subsidies for private tuition for
all children 47% 40% 8%
providing government subsidies for private tuition for
children with special needs 62% 27% 35%
NMB Research (2014)**
500 likely
voters from
swing
legislative
districts
give parents the right to use tax dollars to send their
children to public or private school of their choice 63% n/a n/a
expanding statewide PCP to allow any working class WI
parent to access to public dollars for choosing public or
private schools
60% n/a n/a
eliminating the cap on vouchers in statewide PCP 56% n/a n/a
WPRI (2012) 605 Milwaukee
City residents
formation of charter schools 48% 30% 17%
National polls
Beck Research, LLC (2015)
1,800 likely
November
2016 voters
support the concept of school choice 69% 27% 42%
specific school choice proposals
vouchers 63% 34% 29%
tax credits 70% 26% 44%
ESA 66% 29% 37%
special needs scholarships 83% 14% 68%
charter schools 76% 20% 56%
DiPerna (2014)***
1,007
American
adults
school vouchers
all respondents 63% 33% 30%
urban 63% 35% 28%
suburban 61% 34% 27%
small town 66% 31% 35%
rural 64% 32% 32%
vouchers should be available regardless of incomes or
special needs 65% 31% 34%
charter schools
all respondents 61% 26% 35%
urban 66% 26% 40%
suburban 55% 30% 25%
small town 66% 24% 42%
rural 62% 26% 36%
* poll was commissioned by the Wisconsin Policy Research Institute and conducted by William G. Howell, Harris
School of Public Policy, University of Chicago
** poll was commissioned by the American Federation for Children
*** poll was commissioned by the Friedman Foundation for Educational Choice and conducted by Braun Research, Inc.