Embed Size (px)
Citation preview

DINER (Data Into Nutrients for Epidemiological Research) ±a new data-entry program for nutritional analysis in theEPIC±Norfolk cohort and the 7-day diary method
AA Welch1,*, A McTaggart1, AA Mulligan1, R Luben1, N Walker2, KT Khaw1, NE Day1
and SA Bingham3
1University of Cambridge, Institute of Public Health, Strangeways Research Laboratory, Wort's Causeway,Cambridge CB1 8RN, UK: 2JDRF/WT Diabetes and Inflammation Laboratory, University of Cambridge, CambridgeCS2 2XY, UK: 3Dunn MRC Human Nutrition Unit, Cambridge, CB2 2XY, UK
Submitted 30 March 2001: Accepted 22 May 2001
AbstractBackground and objective: A new data-entry system (DINER ± Data Into Nutrientsfor Epidemiological Research) for food record methods has been devised for theEuropean Prospective Investigation into Cancer (EPIC) cohort study of 25 000 menand women in Norfolk. DINER has been developed to address the problems ofefficiency and consistency of data entry, comparability of data, maximisinginformation and future flexibility in large long-term population studies of diet anddisease that use record methods to assess dietary intakes. DINER captures moredetail than traditional systems and enables provision of new variables for specificfood types or groups. The system has been designed to be fully flexible and easy toupdate. Analysis of consistency of data entry was tested in a group of 3525participants entered by 25 coders.Results: A food list of 9000 food items and values for 24 000 portion sizes have beenincorporated into the database, using information from the 5979 diaries coded since1995. Analysis of consistency of entry indicated that this has largely been achieved.The effect of coders in a multivariate regression model was significant only if thethree coders involved in early use of the program were included �P , 0:013�:Conclusions: The development of DINER has facilitated the use of more accuraterecord methods in large-scale epidemiological studies of diet and disease.Furthermore, the retention of original information as an extensive food list allowsgreater flexibility in later analyses of data of multiple dietary hypotheses.
KeywordsDiet diary
FoodsCancer
Computerised entryNutrient
Diet coding
Accurate estimation of nutritional intake is fundamental to
nutritional epidemiology. There are various methods for
the assessment of dietary intake in free-living individuals.
The two main approaches are food-frequency question-
naires (FFQs), which have pre-assigned lists of foods and
frequencies of consumption, and diet records, which
allow open-ended listing of food intake. All methods are
associated with errors of differing magnitude. The
introduction of biomarkers has allowed these errors to
be assessed. Recent studies have shown that food record
methods have closer associations with biomarkers and
reduced measurement error ± both random and, more
importantly, systematic errors ± when compared with
other dietary instruments1±4. Because food records are
open-ended, they are more flexible and able to
capture a much wider variety of foods and nutrients,
increasing potential accuracy. However, practical and
methodological difficulties have limited the use of record
methods in large-scale studies, most notably the
difficulty in coding and data entry of food intake for
nutrient analyses. The accuracy of nutrient intake from
record methods is dependent on the precision and
completeness of the data collection, the accuracy and
representativeness of the food composition database
used, and the consistency and precision when translating
records during entry.
The European Prospective Investigation into Cancer
(EPIC) is a prospective study of diet and cancer in
400 000 men and women aged 30±75 in nine European
countries5. The Norfolk component of this collaboration,
EPIC±Norfolk, comprising 25 000 men and women aged
40±75 years first surveyed in 1993±1997, has been
extended to enable study of other chronic diseases
including cardiovascular disease, diabetes and
osteoporosis6.
This paper describes the rationale behind the
Public Health Nutrition: 4(6), 1253±1265 DOI: 10.1079/PHN2001196
*Corresponding author: Email [email protected] q The Authors 2001Downloaded from https://www.cambridge.org/core. 26 Oct 2021 at 17:08:56, subject to the Cambridge Core terms of use.

development of the DINER (Data Into Nutrients for
Epidemiological Research) program used for entry of 7-
day diaries (7D diaries) in the EPIC±Norfolk cohort and
gives details of the diary method. DINER can also be used
for entry of 24-hour recalls (24H) and weighed records.
Whilst developed for use within the United Kingdom for
a large-scale study, the principles have wider application
in the field of nutritional epidemiology and surveillance.
Methods
Rationale
The identification and classification of reported foods and
the association with the amount consumed are central to
the data-entry process. The DINER program aids the
translation from reported free text to structured data,
which are then converted into food and nutrient data for
analysis.
Although entry systems are important tools under-
pinning nutritional epidemiology, the systems available in
1993 were similar and had not been developed to support
the needs of a large-scale prospective cohort study with
an extended period of data collection and entry. A system
was needed that would be sufficiently robust to deal with
the anticipated changes that would occur to foods and
satisfy the multiple hypotheses to be studied.
Processing of food records for large-scale studies
introduces problems of scale, access to information and
comparability of data not apparent for smaller studies. As
food record data require interpretation during entry, they
are more sensitive to the influence of and method of use
of the entry system than other more structured methods
such as FFQs. Treatment of many thousands of diaries
over several years by numerous staff could have created
sources of bias unless attention was paid to consistency.
Study-specific bias had to be avoided as data were to be
entered for a variety of different disease endpoints. Rapid
and efficient entry was also essential.
Record methods provide detailed information on
consumption of food type and amount, but this advantage
is lost unless captured electronically. DINER has been
developed to record in a form as close as possible to the
original by incorporating a detailed classification system.
Systems in 1993 were unable to capture sufficient detail as
they were based on the limited number of food types
available within food composition databases. The range
of published portion sizes was also limited. Detailed entry
enables creation of new variables for specific food types
or groups in response to the burgeoning number of
hypotheses relating diet to disease. Detail makes the
system flexible and easy to update, an important
consideration as entry costs are high and would become
prohibitive if the original data required re-entering for
updating purposes. In addition, EPIC±Norfolk incorpo-
rates follow-up investigations of the cohort participants,
whereas the data management characteristics of the
systems available in 1993 were inadequate for a large-
scale study with repeated dietary measurements.
Dietary methods
All EPIC±Norfolk participants completed an initial self-
reported 24H, a 7D diary and an FFQ. For follow-up,
repeats of the 24H and 7D diary were obtained at 18
months and 4 years. The FFQ and self-reported 24H were
completed by participants before attending a clinic where
they were instructed by nurses on how to complete the
7D diary. As part of this instruction, a 24H formed the first
day of the first 7D diary and recorded the period from
waking to sleeping on the previous day. This demon-
strated the process of recording intake and indicated the
level of detail required. Recording in detail is important as
this improves precision of the method and reduces
problems of interpretation and ambiguity during data
entry. A carbon copy of this interview was retained in the
event that the diary was not completed and returned to
the EPIC centre.
All interviewers were trained to a standardised techni-
que, using a formal documented protocol. The intention
was to reduce the potential for the impact of the interview
on the reporting process. Specific advice was given so
that the expression of criticism, surprise, disapproval or
praise was avoided. Interviewers were requested not to
ask `leading questions' or give dietary advice. Neutral
probing questions were used to elicit detail of foods
consumed. At the end of the interview, interviewers
probed for foods that might have been omitted by using a
checklist of foods and snacks. Participants completed the
remaining 6 days and returned the diary by post.
The diary was based on that developed for the MRC
Study of Health and Development7. It consisted of
instructions to guide the detail and type of information
to be reported and suggested methods for estimating the
amount of food consumed, such as household measures,
recognisable standard units or the series of 17 colour
photographs representing small, medium or large
portions. Consumption was reported in a series of seven
meal slots with space for additional snacks and other
information.
At the end of the week's record additional questions
were completed on important contributors to nutrient
intake such as milk, bread and fat consumption to clarify
the information already supplied. Consumption of vita-
min and mineral supplements was recorded and entered
separately for later analysis.
Overview of the DINER system
Figure 1 shows an example of information obtained from
the 7D diary. The purpose of the DINER program was to
convert reported data into structured data files (DINER
files) and final nutritional analysis. A schematic overview
1254 AA Welch et al.
Downloaded from https://www.cambridge.org/core. 26 Oct 2021 at 17:08:56, subject to the Cambridge Core terms of use.

of the complete DINER system, including definitions
used, is illustrated in Fig. 2 (stages A to H).
The DINER program is written in the window-based
programming language TCL/TK for multi-user access on
UNIX operating systems (Fig. 2, stage B). It is hoped to
make the entry module more widely available for use on
LINEX systems and, providing funding can be obtained,
to make the complete system available to others.
As the program is used, lists of food items, portion sizes
and associated information for fat type, brand name and
cooking factors appear within a series of windows.
The main program was designed as a separate module
from the set of menu files on which it operates. The menu
files hold the food and portion lists and associated
information. They are automatically generated from a set
of relational databases using food group as a central link.
Menu generation is version-controlled. Old menus are
archived at each menu update. The database design is an
important feature and individual menu combinations are
generated for each food item, so that specific sets of
windows appear during entry.
The individual structured DINER files (Fig. 2, stage C
and Fig. 9) are combined into the DINER database
(Fig. 2, stage E). The nutrient calculation program
(NCP) is separate from the entry program (Fig. 2, stage
F). The NCP calculates quantities from portion
descriptions and then nutrients that are incorporated
into the DINER database (Fig. 2, stage E). Final
calculation of individual intake of foods and nutrients
occurs (Fig. 2, stage G). Check programs operate on
stages C, E and G (Fig. 2).
Description of the software
The entry process
A food list item, portion size and number of portions are
entered for all reported foods. The entry process entails
making choices from a series of windows to produce the
final data window as illustrated in Figs 3±9.
An identification number (with check sum digit), the
diary version and the date of record are entered for
everyone. The software and menu versions, coder identi-
fication code and date of entry are automatically assigned
within the data structure (Fig. 9a, columns A, B and E).
Copy and paste
A `copy and paste' function allows items already entered
to be copied to another meal slot or day, and is used
extensively for beverages and other routinely consumed
items.
Factors affecting intake
Food diaries are entered according to meal slot. Reasons
for missing meals are documented and factors affecting
Fig. 1 Example of reported 7D food diary data
1255DINER data-entry program
Downloaded from https://www.cambridge.org/core. 26 Oct 2021 at 17:08:56, subject to the Cambridge Core terms of use.

usual intake such as illness or special diet are recorded and
may help to explain differences in energy intakes (Fig. 3).
Food list
Around 150 000 food items exist within the UK food
supply, but only 3000 are listed within the UK food
composition database (UKFCD)8±17. The food list had to
take into account the existing requirements for the study
and predictions of future hypotheses, and was con-
structed by review of each major food group. The level of
Fig. 2 Schematic representation of the DINER system with associated processes and definitions
1256 AA Welch et al.
Downloaded from https://www.cambridge.org/core. 26 Oct 2021 at 17:08:56, subject to the Cambridge Core terms of use.

classification of the foods was decided in advance so that
when new food items appeared they could be included in
the list without change to the existing items. Home-made
and commercial versions of food items were included
where the composition varies systematically. The list
distinguishes between foods containing phyto-nutrients
such as carotenoids and phyto-oestrogens and non-
nutrients such as the heterocyclic amines formed during
the cooking of meat.
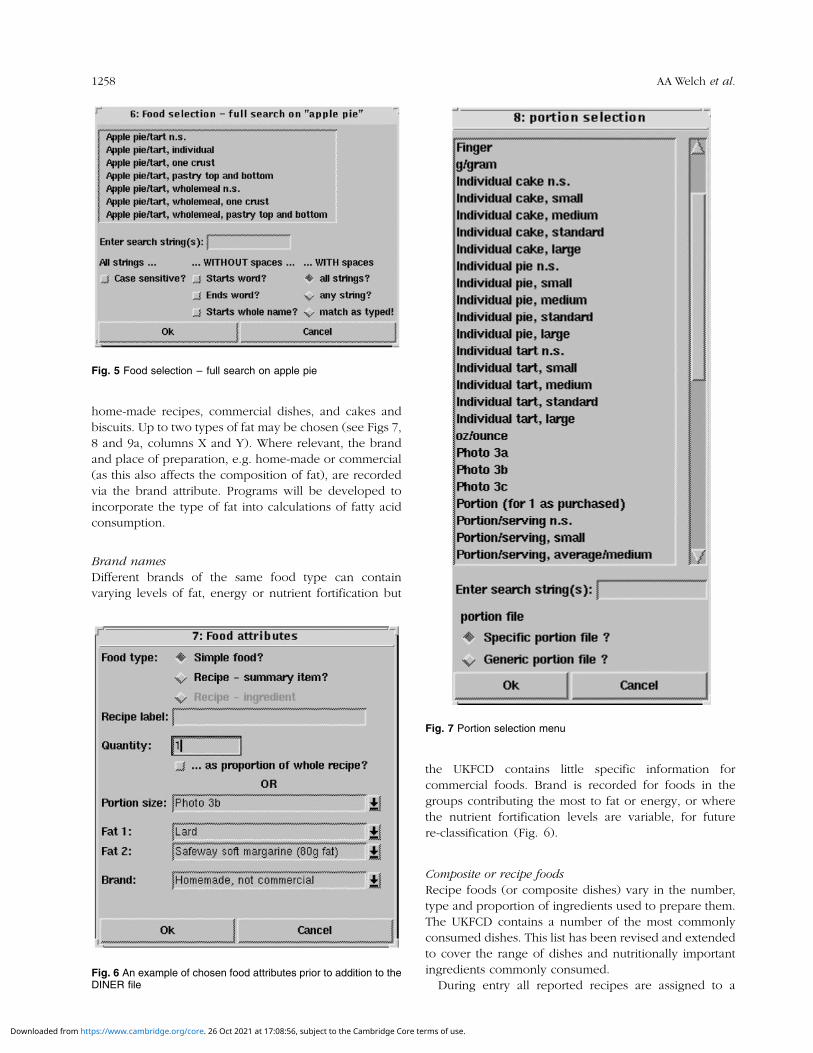
Items classified at different levels of specificity are
included in the list to aid consistency of choice and entry
at the level of reported detail (see Fig. 5). Apple pie may
be entered using one of the choices illustrated in Fig. 5,
but if no information on the type and proportion of pastry
is given, the item apple pie n.s. (non-specific) is chosen.
Items consisting of mixed single components such as
salads or sandwich fillings are included in the list to avoid
arbitrary estimation of quantities.
Food selection
Foods are selected by using the food-group-based set
of hierarchical menus or the search string mechanism
(Figs 4 and 5). The software and food name structure
have been designed for rapid and efficient use of
search mechanisms.
The string search utilises strings (identified as a series of
letters) that may be part or the whole of a food name to
select all food items containing a particular string.
Searches can retrieve items from the overall level or at
any point below this at group or sub-group level.
Sequential nested searches can be made. The search
options available are shown in Fig. 5. Combinations of
two or more strings are the most rapid method of locating
specific items. The search mechanism operates on all
menus for portion size, fat type and brand name.
Food name structure
The food name structure was devised so that names are
clear, consistent and understandable for accurate and
rapid location and clear differentiation during entry. The
name length of 100 characters allows adequate detail
including synonyms, brand information and equivalent
food types to be included. The structure consists of a main
name, e.g. apple pie, followed by a first additional name
and further descriptions as necessary, e.g. wholemeal and
individual/one crust.
Consistency of naming ensures that the results of
searches appear in meaningful order. For instance, in a
search on the strings `apple pie', versions prepared with
wholemeal pastry appear at the end of the list (see Fig. 5).
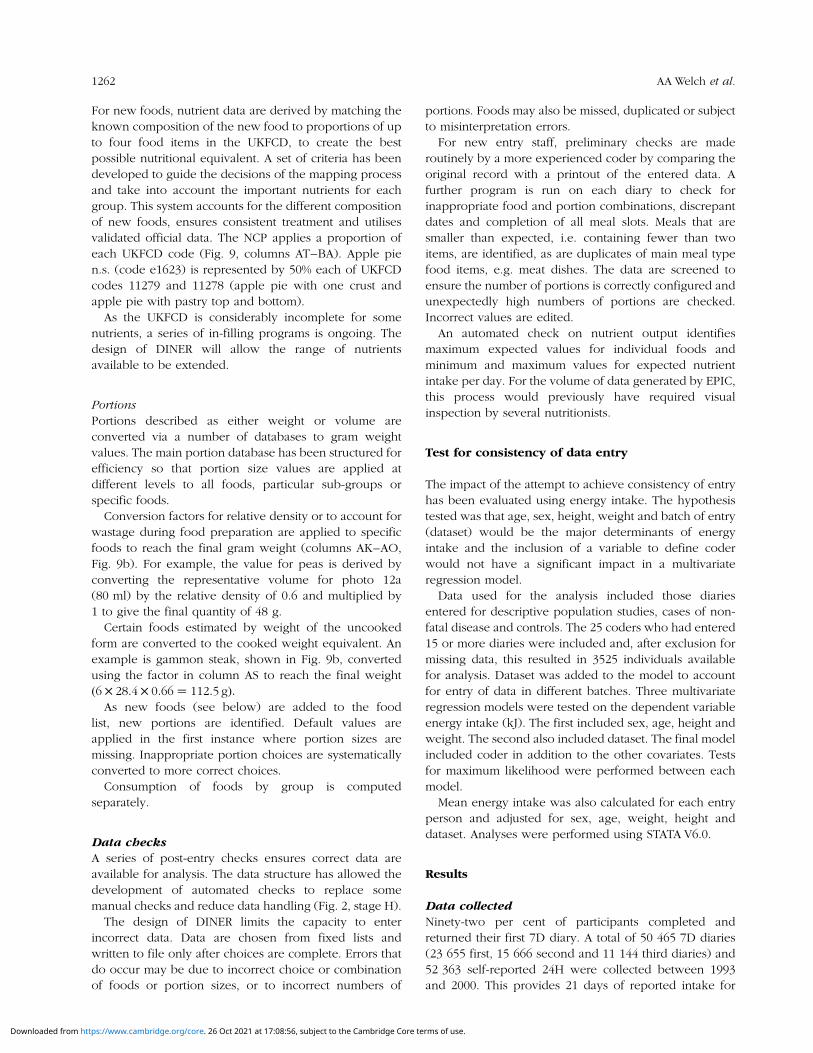
Food portion estimates
Once a food item is chosen, a group-specific list of
portion sizes appears (Fig. 7). A complete `generic' list
of portions is also accessible. The number of portions
is entered. In Fig. 6, one portion of photo 3b was
chosen.
For foods consumed in the cooked form but sometimes
reported as the uncooked weight, such as meat and rice,
an additional window appears so that the portion can be
described as uncooked.
Fat in food preparation
Information on fat type, brand and description of recipes
is recorded for certain foods. A menu requesting a choice
of fat appears for foods in the groups that contribute to
the majority of fat in the UK diet, namely fried foods,
Fig. 3 Date and time selection
Fig. 4 Selection of apple pie via the menus
1257DINER data-entry program
Downloaded from https://www.cambridge.org/core. 26 Oct 2021 at 17:08:56, subject to the Cambridge Core terms of use.
home-made recipes, commercial dishes, and cakes and
biscuits. Up to two types of fat may be chosen (see Figs 7,
8 and 9a, columns X and Y). Where relevant, the brand
and place of preparation, e.g. home-made or commercial
(as this also affects the composition of fat), are recorded
via the brand attribute. Programs will be developed to
incorporate the type of fat into calculations of fatty acid
consumption.
Brand names
Different brands of the same food type can contain
varying levels of fat, energy or nutrient fortification but
the UKFCD contains little specific information for
commercial foods. Brand is recorded for foods in the
groups contributing the most to fat or energy, or where
the nutrient fortification levels are variable, for future
re-classification (Fig. 6).
Composite or recipe foods
Recipe foods (or composite dishes) vary in the number,
type and proportion of ingredients used to prepare them.
The UKFCD contains a number of the most commonly
consumed dishes. This list has been revised and extended
to cover the range of dishes and nutritionally important
ingredients commonly consumed.
During entry all reported recipes are assigned to aFig. 6 An example of chosen food attributes prior to addition to theDINER file
Fig. 7 Portion selection menu
Fig. 5 Food selection ± full search on apple pie
1258 AA Welch et al.
Downloaded from https://www.cambridge.org/core. 26 Oct 2021 at 17:08:56, subject to the Cambridge Core terms of use.

standard recipe. Where individuals have reported details
of ingredients for recipes, these are summarised, in text
form, in the recipe label field. This stores the information
for future use and allows review of recipe items.
Data structure
Data are written to the DINER file once all decisions have
been completed. Each food is represented by one line of
data in the final structure, see Fig. 9. A simplified view of
this data structure is used during entry.
Staff training, issues of consistency and problem
solving
It is important that consistency should be achieved
between coders and coding on different occasions.
Data are entered for specific sub-studies and coders are
unaware of the purpose. The same coders enter data for
cases and controls to ensure consistency.
New entry staff undergo a two-day training programme
with a qualified nutritionist (AMcT). Intensive support,
checking and feedback are given until the level of
knowledge of, and familiarity with, the program and
entry protocol is considered adequate.
Decisions and issues of interpretation that have been
made during the development and use of DINER have
been documented in a 177-page reference manual, to
ensure a consistent approach to entry. This includes the
priorities to be used in the decision process where the
reported data are incomplete. New decisions are updated
within the manual. On a day-to-day basis one person is
responsible for decisions regarding entry.
Trained coders identify problems and use the reference
manual for backup. Issues not readily solved are referred
to a nutritionist for solution. Food items requiring further
investigation are entered as the next best match on the
food list and identified as difficult to categorise (DCI) for
later checking. On average a nutritionist deals with two
queries per diary, one of which can usually be resolved
immediately.
A reference bank of information for commercial food
products was instigated at the start of the study and is kept
up-to-date for consultation.
New foods
After completion of a batch of diaries, the DCI are
identified and the nutritional composition evaluated. This
requires review of the available information and possible
contact with food manufacturers and retailers. Where
possible, DCI are entered using existing food list items.
Items that are sufficiently different are added to the food
list as new foods. The existing DINER data are then edited.
Foods considered to be new fit one or more of the
following criteria: a new food type; nutritionally different
from other items within a food group; or a mixed dish
prepared by an established cooking method. This same
approach is used to evaluate food portion descriptions, fat
types and brand names.
Conversion into nutrients and food groups
Individually created files are amalgamated into the DINER
database (stages D and E in Fig. 2). A separate nutrient
calculation program (NCP) calculates firstly portion sizes
and secondly nutrients. These values and a number of
intermediate calculations and factors are read back into
the DINER database (columns AJ±AS and BB±BD, Fig. 9b).
The nutrient database used for calculations is based on
2200 foods in the UKFCD8±17; mainly the supplements to
McCance and Widdowson's The Composition of Foods.
Fig. 8 Fat selection via menu
1259DINER data-entry program
Downloaded from https://www.cambridge.org/core. 26 Oct 2021 at 17:08:56, subject to the Cambridge Core terms of use.

1260 AA Welch et al.
Downloaded from https://www.cambridge.org/core. 26 Oct 2021 at 17:08:56, subject to the Cambridge Core terms of use.

Fig
.9
(a)
Fin
ald
ata
win
dow
show
ing
the
str
uctu
reofth
eente
red
data
;(b
)ill
ust
ratio
nofsele
cte
dpart
softh
efin
ald
ata
str
uctu
rein
clu
din
gre
sults
ofth
enutr
ientcalc
ula
tion
pro
gra
mand
inte
rmedia
tefa
cto
rsand
calc
ula
tions
1261DINER data-entry program
Downloaded from https://www.cambridge.org/core. 26 Oct 2021 at 17:08:56, subject to the Cambridge Core terms of use.
For new foods, nutrient data are derived by matching the
known composition of the new food to proportions of up
to four food items in the UKFCD, to create the best
possible nutritional equivalent. A set of criteria has been
developed to guide the decisions of the mapping process
and take into account the important nutrients for each
group. This system accounts for the different composition
of new foods, ensures consistent treatment and utilises
validated official data. The NCP applies a proportion of
each UKFCD code (Fig. 9, columns AT±BA). Apple pie
n.s. (code e1623) is represented by 50% each of UKFCD
codes 11279 and 11278 (apple pie with one crust and
apple pie with pastry top and bottom).
As the UKFCD is considerably incomplete for some
nutrients, a series of in-filling programs is ongoing. The
design of DINER will allow the range of nutrients
available to be extended.
Portions
Portions described as either weight or volume are
converted via a number of databases to gram weight
values. The main portion database has been structured for
efficiency so that portion size values are applied at
different levels to all foods, particular sub-groups or
specific foods.
Conversion factors for relative density or to account for
wastage during food preparation are applied to specific
foods to reach the final gram weight (columns AK±AO,
Fig. 9b). For example, the value for peas is derived by
converting the representative volume for photo 12a
(80 ml) by the relative density of 0.6 and multiplied by
1 to give the final quantity of 48 g.
Certain foods estimated by weight of the uncooked
form are converted to the cooked weight equivalent. An
example is gammon steak, shown in Fig. 9b, converted
using the factor in column AS to reach the final weight
�6 � 28:4 � 0:66 � 112:5 g�:As new foods (see below) are added to the food
list, new portions are identified. Default values are
applied in the first instance where portion sizes are
missing. Inappropriate portion choices are systematically
converted to more correct choices.
Consumption of foods by group is computed
separately.
Data checks
A series of post-entry checks ensures correct data are
available for analysis. The data structure has allowed the
development of automated checks to replace some
manual checks and reduce data handling (Fig. 2, stage H).
The design of DINER limits the capacity to enter
incorrect data. Data are chosen from fixed lists and
written to file only after choices are complete. Errors that
do occur may be due to incorrect choice or combination
of foods or portion sizes, or to incorrect numbers of
portions. Foods may also be missed, duplicated or subject
to misinterpretation errors.
For new entry staff, preliminary checks are made
routinely by a more experienced coder by comparing the
original record with a printout of the entered data. A
further program is run on each diary to check for
inappropriate food and portion combinations, discrepant
dates and completion of all meal slots. Meals that are
smaller than expected, i.e. containing fewer than two
items, are identified, as are duplicates of main meal type
food items, e.g. meat dishes. The data are screened to
ensure the number of portions is correctly configured and
unexpectedly high numbers of portions are checked.
Incorrect values are edited.
An automated check on nutrient output identifies
maximum expected values for individual foods and
minimum and maximum values for expected nutrient
intake per day. For the volume of data generated by EPIC,
this process would previously have required visual
inspection by several nutritionists.
Test for consistency of data entry
The impact of the attempt to achieve consistency of entry
has been evaluated using energy intake. The hypothesis
tested was that age, sex, height, weight and batch of entry
(dataset) would be the major determinants of energy
intake and the inclusion of a variable to define coder
would not have a significant impact in a multivariate
regression model.
Data used for the analysis included those diaries
entered for descriptive population studies, cases of non-
fatal disease and controls. The 25 coders who had entered
15 or more diaries were included and, after exclusion for
missing data, this resulted in 3525 individuals available
for analysis. Dataset was added to the model to account
for entry of data in different batches. Three multivariate
regression models were tested on the dependent variable
energy intake (kJ). The first included sex, age, height and
weight. The second also included dataset. The final model
included coder in addition to the other covariates. Tests
for maximum likelihood were performed between each
model.
Mean energy intake was also calculated for each entry
person and adjusted for sex, age, weight, height and
dataset. Analyses were performed using STATA V6.0.
Results
Data collected
Ninety-two per cent of participants completed and
returned their first 7D diary. A total of 50 465 7D diaries
(23 655 first, 15 666 second and 11 144 third diaries) and
52 363 self-reported 24H were collected between 1993
and 2000. This provides 21 days of reported intake for
1262 AA Welch et al.
Downloaded from https://www.cambridge.org/core. 26 Oct 2021 at 17:08:56, subject to the Cambridge Core terms of use.

47% of the population who completed three diaries for
later analysis of repeatability and seasonal variation.
Five thousand nine hundred and seventy-nine diaries
and 824 24H recalls have been entered using DINER since
1995, a total of 1 251 000 lines of data. Thirty-four staff
have been trained. Each diary averages 210 lines of data.
Mean entry time was 75 min per diary (range 0.75±3.5 h).
After the initial training stages, support of entry was
around 5 min per diary. Further processing, checking and
data management took around 1 h per diary.
Food list
The compiled food list presently consists of 9000 items,
30% of which are directly equivalent to the UKFCD. The
remainder are new food items that have been included to
guide entry, provide specific classifications for data
analysis and to account for the composition of foods
not available within the UKFCD. The food list includes
more specific detail for foods of particular nutritional
importance in the UK such as breads, breakfast cereals
and fat spreads. So far, 337 specific types and brands of
breakfast cereals have been identified and mapped to the
32 items within the UKFCD.
Food portions
The database contains 24 000 values compiled from
official publications (26%)18,19, obtained from food
manufacturers or retailers (35%), or imputed from
established sources. There are 3200 density, edible part
and cooking loss factors stored in the databases used by
the NCP. Values for these factors were derived from in-
house measurements or published sources8±14,16,17.
Brand names
The brand name database contains 900 brands and brand
types.
Food groups
Two hundred and forty-two food groups have been
developed for classification of the food list, menu
generation program and data entry.
Nutrient and food intake
Mean intake of nutrients and food groups produced by
the DINER system have been presented elsewhere20.
Consistency of entry
For the analysis of consistency of entry, the number of
diaries entered by each coder is shown in Table 1. For
model 1 all of the covariates were significantly related to
energy intake: sex, b � 1478 �P , 0:001�; weight, b �215=kg �P , 0:001�; height, b � 61=cm �P , 0:001�; and
age, b � 230=year �P , 0:001�; r2 � 0:308: The addition
of dataset to model 2 increased r2 to 0.317. The addition
of coder to model 3 increased r2 to 0.325. A maximum
likelihood ratio test confirmed that the effect of adding
coder to the model was significant �P , 0:013�: Three
coders showed the greatest impact on entry: numbers 14,
b � 21293 �P , 0:015�; 19, b � 21253 �P , 0:026�; and
5, b � 21223 �P , 0:015�: When these were dropped
from the analysis and the model re-run and tested for
maximum likelihood, the effect of coder was no longer
significant �P , 0:122�; indicating that consistency had
been achieved for the remaining 22 coders.
Means of energy intake were adjusted for age, height
and dataset for each coder. The deviation from the group
mean is illustrated in Fig. 10 for women. The X-axis
indicates the number of diaries entered by each coder.
Deviation from the mean is generally lower in those
entering more diaries. It is greatest in those entering data
at the start of the study.
Discussion
Around 150 000 food items exist within the UK food
supply and individuals may report and describe any of
them with varying levels of adequacy and precision.
Furthermore, the vast changes that have affected food
supply in recent years are set to continue. Around 10 000
foods are modified, appear or are discontinued each year.
Ranges of pre-prepared meals have increased and new
and functional foods have appeared in the market place.
Ordinary foods have been fortified with additional
nutrients and existing foods reduced in macronutrient
density; mainly sugar and fat. Such diversity and change
represents an almost overwhelming problem in nutri-
tional epidemiology. However, DINER is capable of
tracking changes in the food supply by accommodating
Table 1 Number of diaries entered by individual coders
Coder Number Percentage
1 88 2.52 81 2.33 39 1.14 37 1.15 118 3.46 22 0.67 249 7.18 528 15.09 32 0.9
10 145 4.111 39 1.112 307 8.713 499 14.214 205 5.815 164 4.716 84 2.417 36 1.018 79 2.219 112 3.220 164 4.721 124 3.522 114 3.023 84 2.424 97 2.825 78 2.2
3525 100
1263DINER data-entry program
Downloaded from https://www.cambridge.org/core. 26 Oct 2021 at 17:08:56, subject to the Cambridge Core terms of use.

those that affect nutrient composition. The detailed
classification structure for food items allows new foods
to be incorporated without the need to change existing
items. New portions, fat types and brand names can also
be added. The information garnered from monitoring
change to the food supply over six years has been
incorporated.
Some nutritional knowledge to distinguish the relevant
characteristics when interpreting and matching reported
foods with those in DINER is needed. The features of a
detailed, systematic food classification and name structure
reduce reliance on pre-existing nutritional knowledge.
The detailed food and portion lists speed up and increase
the accuracy of entry and the ability to locate items, and
reduce ambiguity and the onus for decision making by
individual coders. The food list acts as the interface to
avoid misclassification. This is particularly important in
groups such as breakfast cereals, in which non-starch
polysaccharides, fat, minerals, vitamins and sugar vary
widely. The use of consistent defaults for inadequately
reported foods, portions, mixed component foods and
new food items also reduces the burden of interpretation
and potential for bias between coders.
The detailed, extended food names reduce the
requirement for external documentation and look-up
lists for equivalent foods. In contrast, traditional entry
systems require coders to memorise equivalent items with
the associated potential for incorrect choice and bias.
The level of detail incorporated in DINER eliminates
much of the possible bias between coders, and the results
of the analysis for consistency indicate that this has been
achieved for the majority (Fig. 10). The least consistent
coders were involved early in the use of the program,
prior to the development of the extensive entry guidelines.
It is possible that we have not completely accounted for
all of the factors that influence consistency of entry in the
analytical model.
The development of automated checks using the data
structure allows more checks than other systems. How-
ever, this advantage means an almost infinite amount of
time can be spent on data correction. Hence, the relative
impact of proposed modifications or corrections is
evaluated.
Familiarity with the software soon leads to knowl-
edge of the most useful combination of menu level and
search string for rapid selection of food items. Entry
and use of the extensive check programs takes 2 h per
diary and results in clean data ready to use for analysis
without further handling. The introduction of immediate
post-entry checks should reduce this time further.
It was anticipated that nutritional assessment would be
more accurate if reported recipes were calculated from
individual ingredients rather than using the existing
standards and the original DINER specification included
a method for this. However, a review of entered diaries
revealed that only 4% of items were individual recipes
and many were incomplete. Hence a recipe module was
not included. Further development will involve partition-
ing the contribution of individual foods, such as onions or
tomatoes, to estimate foods found within recipes.
Separation of the main program from menu generation
means that change can be implemented without the high
cost of developing new entry programs. Entry of data as
close to the original description, non-hard coding of
actual values for foods and portion sizes, and separation
of the NCP, ensure flexibility and potential for updating.
The NCP acts on modifiable databases, making it possible
to change any database value and re-run the program
Fig. 10 Plot of difference from mean energy (kJ) in women (adjusted for age, height, weight, sex and dataset) by individual coders. Orderedby number of diaries entered (X-axis)
1264 AA Welch et al.
Downloaded from https://www.cambridge.org/core. 26 Oct 2021 at 17:08:56, subject to the Cambridge Core terms of use.

without recourse to editing the DINER files. New versions
of the UKFCD will be incorporated.
Measures have been taken to improve the accuracy of
the data collection of the 7D diary by ensuring it was as
complete as possible and not subject to interviewer bias.
The method of matching the composition of new foods to
UKFCD items addresses the shortfall in information in the
food composition tables. The rationale for the develop-
ment of DINER has balanced the known limitations of
food record methods, e.g. the limited accuracy of portion
estimates21, and the requirements of flexibility and
accuracy of the final data. The need to satisfy the multiple
hypotheses generated by a multiple-disease cohort study
was anticipated and the detailed food classification
structure allows specific variables to be created for
analysis. For instance, the intake of brassica vegetables
acts as a surrogate for glucosinolate consumption.
In conclusion, accurate methods for measuring dietary
intake are needed in large cohort studies to minimise
random and systematic measurement errors that may
reduce power or bias results. Data-entry methods that can
cope with the rapidly changing food supply and extensive
variety of foods consumed are required. The develop-
ment of DINER has addressed a number of the problem-
atic issues that can impede the use of 7D diaries for large
prospective cohort studies and has made the use of such
data feasible within EPIC±Norfolk. DINER is a flexible
system, capable of being updated and of accommodating
change for use in prospective dietary surveys and, to our
knowledge, is the first in the UK to adopt this type of
approach.
Acknowledgements
We thank the participants and general practitioners who
took part in the study and the staff of EPIC±Norfolk.
EPIC±Norfolk is supported by research programme grant
funding from the Cancer Research Campaign and the
Medical Research Council, with additional support from
Stroke Association, British Heart Foundation, Department
of Health, Europe Against Cancer Programme Commis-
sion of the European Union, the Food Standards Agency
and the Wellcome Trust.
References
1 Bingham SA, Gill C, Welch A, et al. Validation of dietaryassessment methods in the UK arm of EPIC using weighedrecords, and 24-hour urinary nitrogen and potassium andserum vitamin C and carotenoids as biomarkers. Int. J.Epidemiol. 1997; 26(Suppl. 1): 137±51.
2 Day NE, McKeown N, Wong MY, Welch AA, Bingham SAB.Epidemiological assessment of diet: a comparison of a 7-day diary with a food frequency questionnaire using urinarybiomarkers of nitrogen, potassium and sodium. Int. J.Epidemiol. 2001; 30: 309±17.
3 McKeown NM, Welch AA, Runswick SA, et al. The use ofbiological markers to validate self-reported dietary intake ina random sample of the European Prospective Investigationinto Cancer (EPIC) UK, Norfolk cohort. Am. J. Clin. Nutr.2001 [in press].
4 Kipnis V, Midthune D, Freedman LS, Bingham SA, SchatzkinA, Subar A, Carroll RJ. Empirical evidence of correlatedbiases in dietary assessment instruments and its implica-tions. Am. J. Epidemiol. 2001; 153(4): 394±403.
5 Riboli E. Nutrition and cancer: background and rationale ofthe European Prospective Investigation into Cancer andNutrition (EPIC). Ann. Oncol. 1992; 3(10): 783±91.
6 Day NE, Oakes S, Luben R, et al. EPIC±Norfolk: studydesign and characteristics of the cohort. Br. J. Cancer 1999;80(Suppl. 1): 95±103.
7 Braddon FE, Wadsworth ME, Davies JM, Cripps HA. Socialand regional differences in food and alcohol consumptionand their measurement in a national birth cohort. J.Epidemiol. Community Health 1988; 42(4): 341±9.
8 Holland B, Welch AA, Unwin ID, Buss DH, Paul AA,Southgate DAT. McCance and Widdowson's The Composi-tion of Foods, 5th ed. Cambridge: Royal Society ofChemistry, 1991.
9 Holland B, Unwin ID, Buss DH. Cereals and CerealProducts. Third Supplement to McCance and Widdowson'sThe Composition of Foods, 4th ed. Cambridge: Royal Societyof Chemistry, 1988.
10 Holland B, Unwin ID, Buss DH. Milk Products and Eggs.Fourth Supplement to McCance and Widdowson's TheComposition of Foods, 4th ed. Cambridge: Royal Society ofChemistry, 1989.
11 Holland B, Unwin ID, Buss DH. Vegetables, Herbs andSpices. Fifth Supplement to McCance and Widdowson's TheComposition of Foods, 4th ed. Cambridge: Royal Society ofChemistry, 1992.
12 Holland B, Unwin ID, Buss DH. Fruit and Nuts. FirstSupplement to McCance and Widdowson's The Compositionof Foods, 5th ed. Cambridge: Royal Society of Chemistry,1992.
13 Holland B, Welch AA, Buss DH. Vegetable Dishes. SecondSupplement to McCance and Widdowson's The Compositionof Foods, 5th ed. Cambridge: Royal Society of Chemistry,1992.
14 Holland B, Brown JB, Buss DH. Fish and Fish Products.Third Supplement to McCance and Widdowson's TheComposition of Foods, 5th ed. Cambridge: Royal Society ofChemistry, 1993.
15 Chan W, Brown JB, Buss DH. Miscellaneous Foods. FourthSupplement to McCance and Widdowson's The Compositionof Foods, 5th ed. Cambridge: Royal Society of Chemistry,1994.
16 Chan W, Brown J, Lee SM, Buss DH. Meat, Poultry andGame. Fifth Supplement to McCance and Widdowson's TheComposition of Foods, 5th ed. Cambridge: Royal Society ofChemistry, 1995.
17 Chan W, Brown J, Church SM, Buss DH. Meat Products andDishes. Sixth Supplement to McCance and Widdowson's TheComposition of Foods, 5th ed. Cambridge: Royal Society ofChemistry, 1996.
18 Ministry of Agriculture, Fisheries and Food (MAFF). FoodPortion Sizes, 2nd ed. London: HMSO, 1988.
19 Nelson M, Atkinson M, Meyer J. A Photographic Atlas ofFood Portion Sizes. London: HMSO, 1998.
20 Bingham SA, Welch AA, McTaggart A, et al. Nutritionalmethods in the European Prospective Investigation ofCancer in Norfolk. Public Health Nutr. 2001; 4(3): 847±58.
21 Nelson M, Atkinson M, Darbyshire S. Food photography. I:The perception of food portion size from photographs. Br.J. Nutr. 1994; 72(5): 649±63.
1265DINER data-entry program
Downloaded from https://www.cambridge.org/core. 26 Oct 2021 at 17:08:56, subject to the Cambridge Core terms of use.