Embed Size (px)
Citation preview
1Q16
www.fitchratings.com 21 July 2016
AUSTRALIA
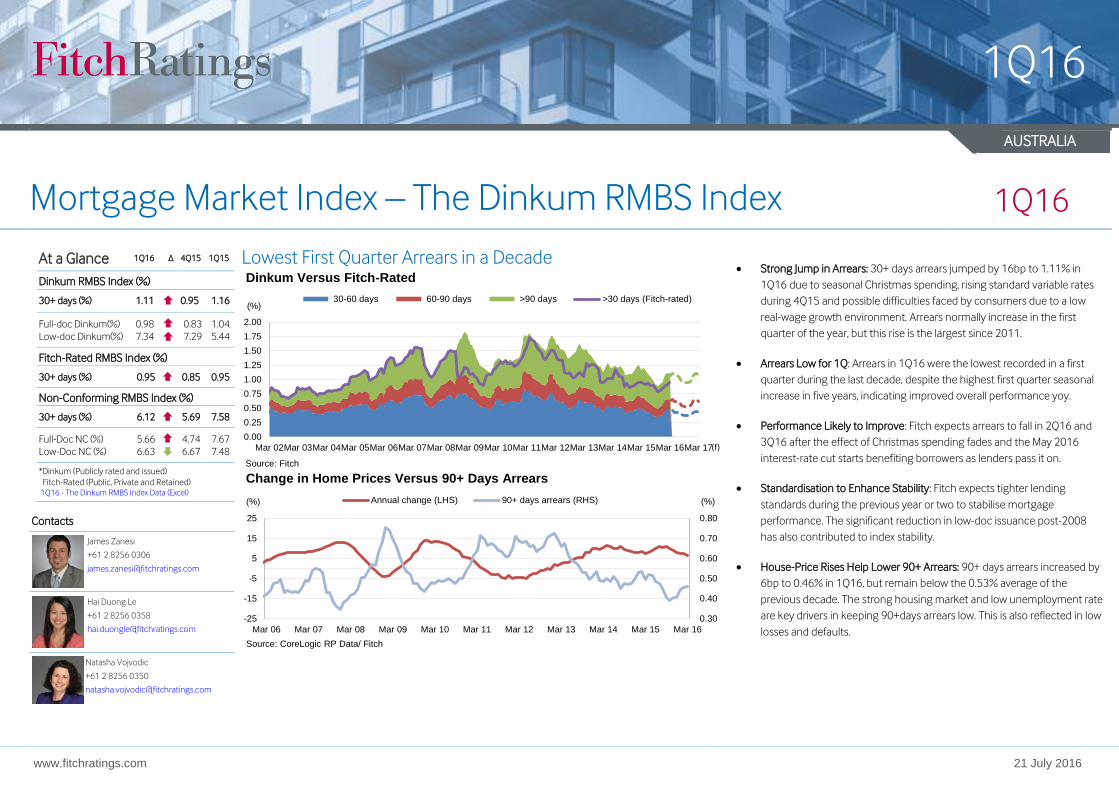
Mortgage Market Index – The Dinkum RMBS Index 1Q16
At a Glance 1Q16 ∆ 4Q15 1Q15
Dinkum RMBS Index (%)
30+ days (%) 1.11 0.95 1.16
Full-doc Dinkum(%)
Low-doc Dinkum(%)
0.98
7.34
0.83
7.29
1.04
5.44
Fitch-Rated RMBS Index (%)
30+ days (%) 0.95 0.85 0.95
Non-Conforming RMBS Index (%)
30+ days (%) 6.12 5.69 7.58
Full-Doc NC (%)
Low-Doc NC (%)
5.66
6.63
4.74
6.67
7.67
7.48
*Dinkum (Publicly rated and issued)
Fitch-Rated (Public, Private and Retained) 1Q16 - The Dinkum RMBS Index Data (Excel)
Contacts
James Zanesi
+61 2 8256 0306
Hai Duong Le
+61 2 8256 0358
Natasha Vojvodic
+61 2 8256 0350
Lowest First Quarter Arrears in a Decade
0.00
0.25
0.50
0.75
1.00
1.25
1.50
1.75
2.00
Mar 02Mar 03Mar 04Mar 05Mar 06Mar 07Mar 08Mar 09Mar 10Mar 11Mar 12Mar 13Mar 14Mar 15Mar 16Mar 17
(%)
Dinkum Versus Fitch-Rated
30-60 days 60-90 days >90 days >30 days (Fitch-rated)
Source: Fitch
(f)
Strong Jump in Arrears: 30+ days arrears jumped by 16bp to 1.11% in
1Q16 due to seasonal Christmas spending, rising standard variable rates
during 4Q15 and possible difficulties faced by consumers due to a low
real-wage growth environment. Arrears normally increase in the first
quarter of the year, but this rise is the largest since 2011.
Arrears Low for 1Q: Arrears in 1Q16 were the lowest recorded in a first
quarter during the last decade, despite the highest first quarter seasonal
increase in five years, indicating improved overall performance yoy.
Performance Likely to Improve: Fitch expects arrears to fall in 2Q16 and
3Q16 after the effect of Christmas spending fades and the May 2016
interest-rate cut starts benefiting borrowers as lenders pass it on.
Standardisation to Enhance Stability: Fitch expects tighter lending
standards during the previous year or two to stabilise mortgage
performance. The significant reduction in low-doc issuance post-2008
has also contributed to index stability.
House-Price Rises Help Lower 90+ Arrears: 90+ days arrears increased by
6bp to 0.46% in 1Q16, but remain below the 0.53% average of the
previous decade. The strong housing market and low unemployment rate
are key drivers in keeping 90+days arrears low. This is also reflected in low
losses and defaults.
0.30
0.40
0.50
0.60
0.70
0.80
-25
-15
-5
5
15
25
Mar 06 Mar 07 Mar 08 Mar 09 Mar 10 Mar 11 Mar 12 Mar 13 Mar 14 Mar 15 Mar 16
(%) (%)
Change in Home Prices Versus 90+ Days Arrears
Annual change (LHS) 90+ days arrears (RHS)
Source: CoreLogic RP Data/ Fitch
1Q16
Mortgage Market Index – The Dinkum RMBS Index – 1Q16 2
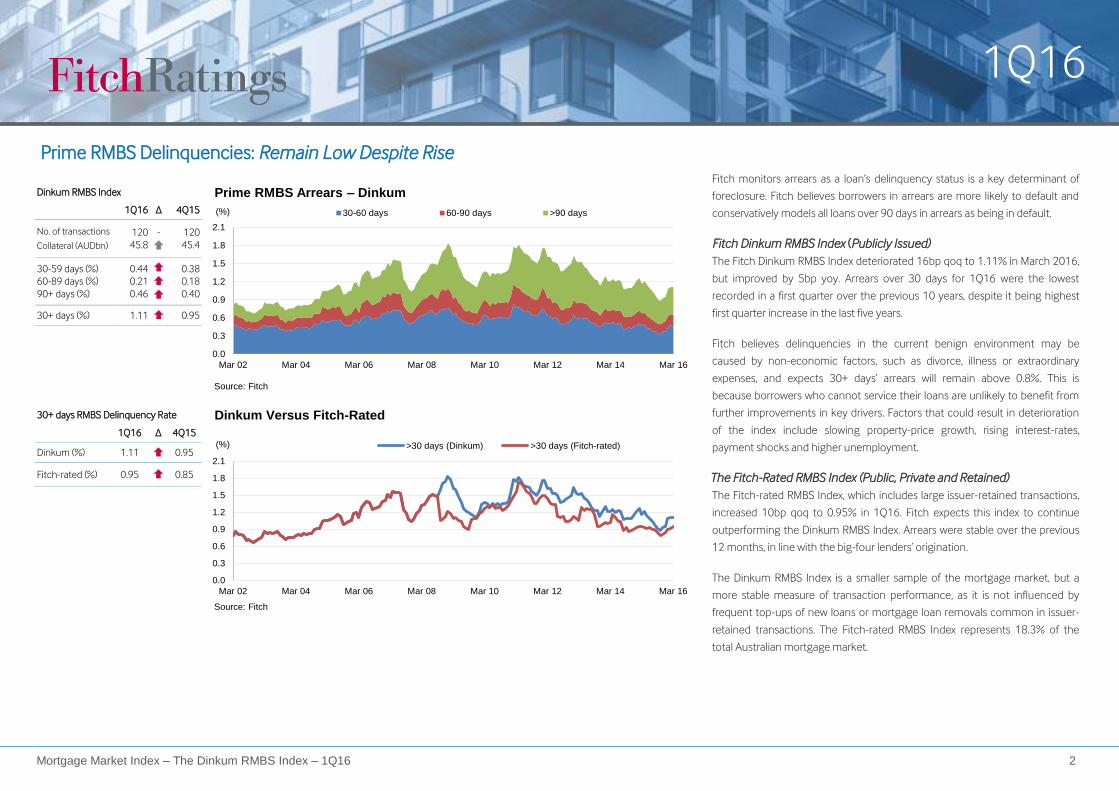
Prime RMBS Delinquencies: Remain Low Despite Rise
Dinkum RMBS Index
1Q16 ∆ 4Q15
No. of transactions
Collateral (AUDbn)
120
45.8
-
120
45.4
30-59 days (%)
60-89 days (%)
90+ days (%)
0.44
0.21
0.46
0.38
0.18
0.40
30+ days (%) 1.11 0.95
0.0
0.3
0.6
0.9
1.2
1.5
1.8
2.1
Mar 02 Mar 04 Mar 06 Mar 08 Mar 10 Mar 12 Mar 14 Mar 16
(%)
Prime RMBS Arrears – Dinkum
30-60 days 60-90 days >90 days
Source: Fitch
Fitch monitors arrears as a loan’s delinquency status is a key determinant of
foreclosure. Fitch believes borrowers in arrears are more likely to default and
conservatively models all loans over 90 days in arrears as being in default.
Fitch Dinkum RMBS Index (Publicly Issued)
The Fitch Dinkum RMBS Index deteriorated 16bp qoq to 1.11% in March 2016,
but improved by 5bp yoy. Arrears over 30 days for 1Q16 were the lowest
recorded in a first quarter over the previous 10 years, despite it being highest
first quarter increase in the last five years.
Fitch believes delinquencies in the current benign environment may be
caused by non-economic factors, such as divorce, illness or extraordinary
expenses, and expects 30+ days’ arrears will remain above 0.8%. This is
because borrowers who cannot service their loans are unlikely to benefit from
further improvements in key drivers. Factors that could result in deterioration
of the index include slowing property-price growth, rising interest-rates,
payment shocks and higher unemployment.
The Fitch-Rated RMBS Index (Public, Private and Retained)
The Fitch-rated RMBS Index, which includes large issuer-retained transactions,
increased 10bp qoq to 0.95% in 1Q16. Fitch expects this index to continue
outperforming the Dinkum RMBS Index. Arrears were stable over the previous
12 months, in line with the big-four lenders’ origination.
The Dinkum RMBS Index is a smaller sample of the mortgage market, but a
more stable measure of transaction performance, as it is not influenced by
frequent top-ups of new loans or mortgage loan removals common in issuer-
retained transactions. The Fitch-rated RMBS Index represents 18.3% of the
total Australian mortgage market.
30+ days RMBS Delinquency Rate
1Q16 ∆ 4Q15
Dinkum (%) 1.11 0.95
Fitch-rated (%) 0.95 0.85
0.0
0.3
0.6
0.9
1.2
1.5
1.8
2.1
Mar 02 Mar 04 Mar 06 Mar 08 Mar 10 Mar 12 Mar 14 Mar 16
(%)
Dinkum Versus Fitch-Rated
>30 days (Dinkum) >30 days (Fitch-rated)
Source: Fitch
1Q16
Mortgage Market Index – The Dinkum RMBS Index – 1Q16 3
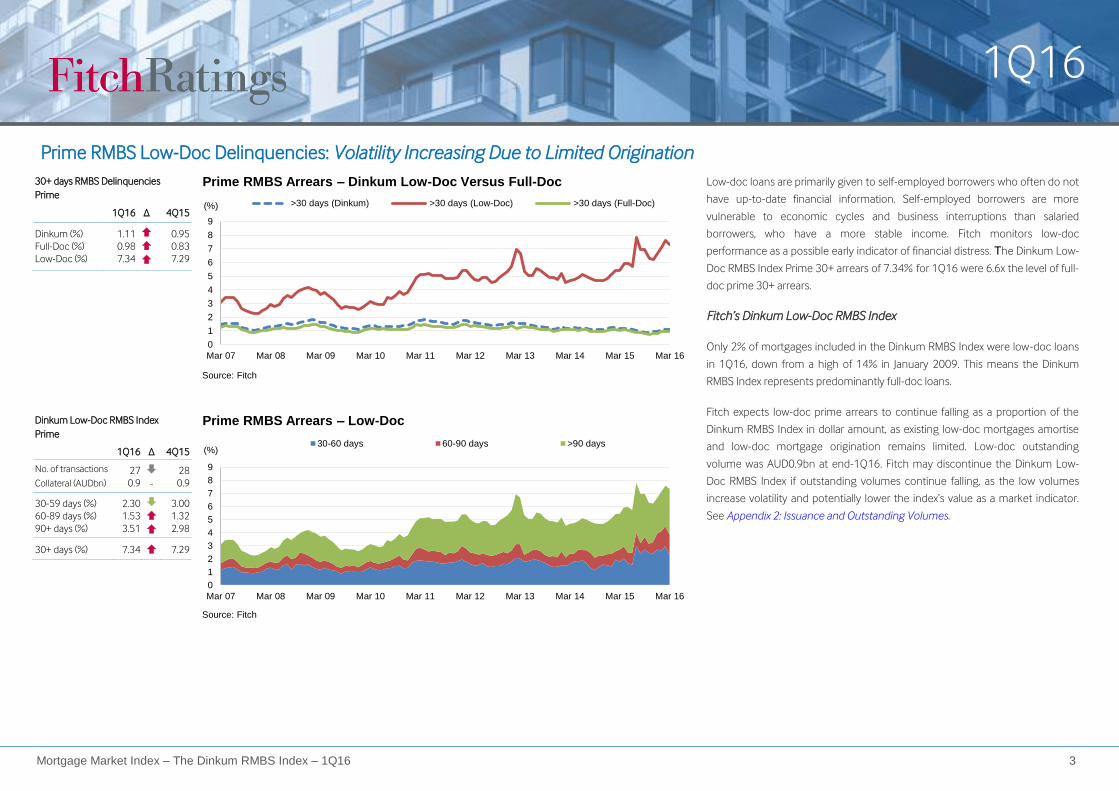
Prime RMBS Low-Doc Delinquencies: Volatility Increasing Due to Limited Origination
30+ days RMBS Delinquencies
Prime
1Q16 ∆ 4Q15
Dinkum (%)
Full-Doc (%)
Low-Doc (%)
1.11
0.98
7.34
0.95
0.83
7.29
0
1
2
3
4
5
6
7
8
9
Mar 07 Mar 08 Mar 09 Mar 10 Mar 11 Mar 12 Mar 13 Mar 14 Mar 15 Mar 16
(%)
Prime RMBS Arrears – Dinkum Low-Doc Versus Full-Doc
>30 days (Dinkum) >30 days (Low-Doc) >30 days (Full-Doc)
Source: Fitch
Low-doc loans are primarily given to self-employed borrowers who often do not
have up-to-date financial information. Self-employed borrowers are more
vulnerable to economic cycles and business interruptions than salaried
borrowers, who have a more stable income. Fitch monitors low-doc
performance as a possible early indicator of financial distress. The Dinkum Low-
Doc RMBS Index Prime 30+ arrears of 7.34% for 1Q16 were 6.6x the level of full-
doc prime 30+ arrears.
Fitch’s Dinkum Low-Doc RMBS Index
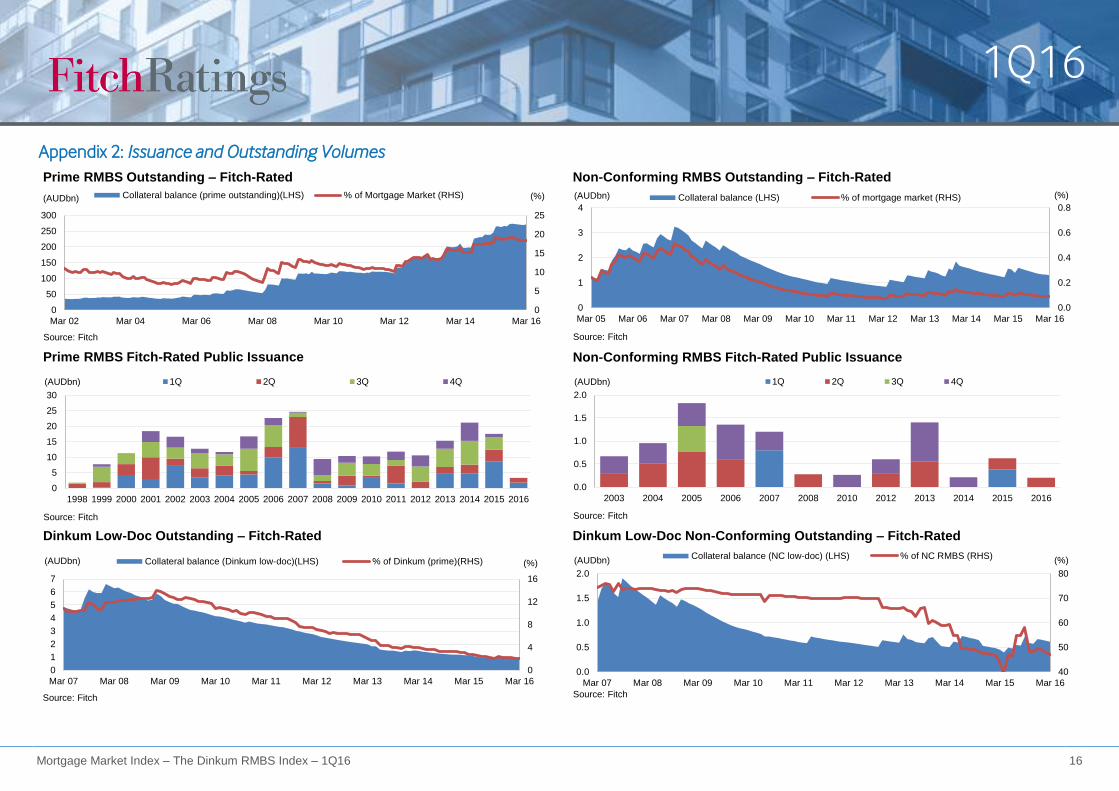
Only 2% of mortgages included in the Dinkum RMBS Index were low-doc loans
in 1Q16, down from a high of 14% in January 2009. This means the Dinkum
RMBS Index represents predominantly full-doc loans.
Fitch expects low-doc prime arrears to continue falling as a proportion of the
Dinkum RMBS Index in dollar amount, as existing low-doc mortgages amortise
and low-doc mortgage origination remains limited. Low-doc outstanding
volume was AUD0.9bn at end-1Q16. Fitch may discontinue the Dinkum Low-
Doc RMBS Index if outstanding volumes continue falling, as the low volumes
increase volatility and potentially lower the index’s value as a market indicator.
See Appendix 2: Issuance and Outstanding Volumes.
Dinkum Low-Doc RMBS Index
Prime
1Q16 ∆ 4Q15
No. of transactions
Collateral (AUDbn)
27
0.9
-
28
0.9
30-59 days (%)
60-89 days (%)
90+ days (%)
2.30
1.53
3.51
3.00
1.32
2.98
30+ days (%) 7.34 7.29
0
1
2
3
4
5
6
7
8
9
Mar 07 Mar 08 Mar 09 Mar 10 Mar 11 Mar 12 Mar 13 Mar 14 Mar 15 Mar 16
(%)
Prime RMBS Arrears – Low-Doc
30-60 days 60-90 days >90 days
Source: Fitch
1Q16
Mortgage Market Index – The Dinkum RMBS Index – 1Q16 4
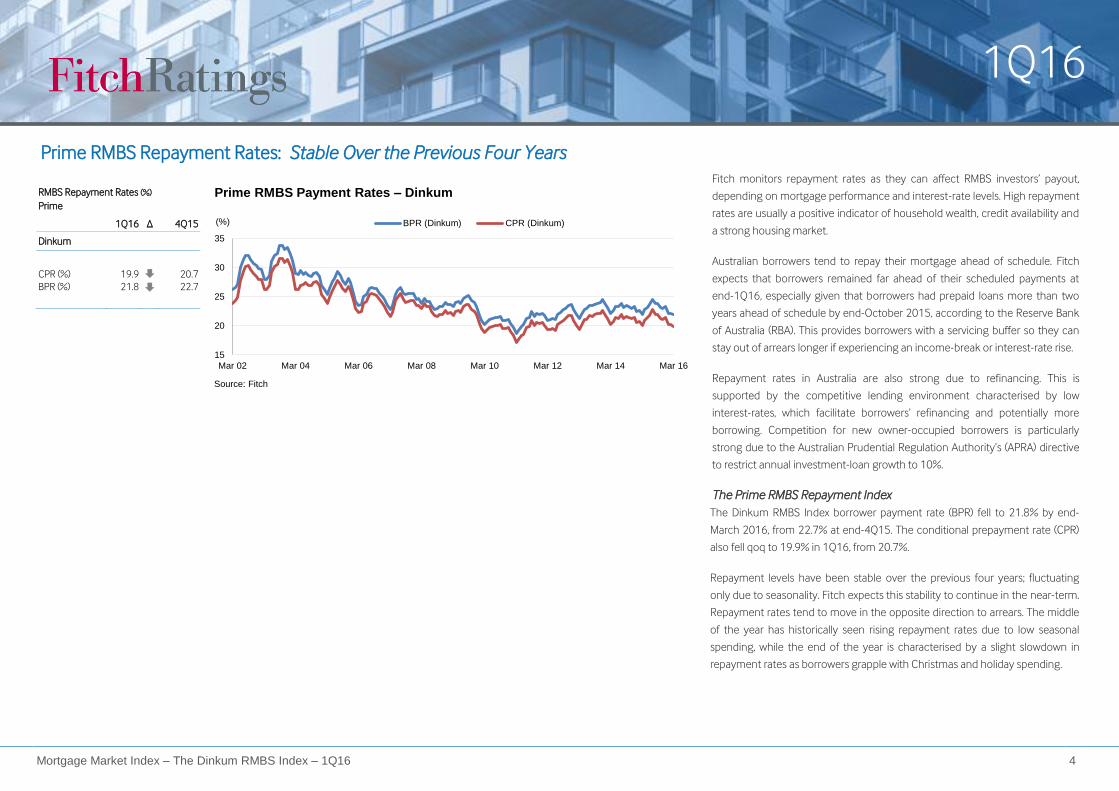
Prime RMBS Repayment Rates: Stable Over the Previous Four Years Fitch monitors repayment rates as they can affect RMBS investors’ payout,
depending on mortgage performance and interest-rate levels. High repayment
rates are usually a positive indicator of household wealth, credit availability and
a strong housing market.
Australian borrowers tend to repay their mortgage ahead of schedule. Fitch
expects that borrowers remained far ahead of their scheduled payments at
end-1Q16, especially given that borrowers had prepaid loans more than two
years ahead of schedule by end-October 2015, according to the Reserve Bank
of Australia (RBA). This provides borrowers with a servicing buffer so they can
stay out of arrears longer if experiencing an income-break or interest-rate rise.
Repayment rates in Australia are also strong due to refinancing. This is
supported by the competitive lending environment characterised by low
interest-rates, which facilitate borrowers’ refinancing and potentially more
borrowing. Competition for new owner-occupied borrowers is particularly
strong due to the Australian Prudential Regulation Authority’s (APRA) directive
to restrict annual investment-loan growth to 10%.
The Prime RMBS Repayment Index
The Dinkum RMBS Index borrower payment rate (BPR) fell to 21.8% by end-
March 2016, from 22.7% at end-4Q15. The conditional prepayment rate (CPR)
also fell qoq to 19.9% in 1Q16, from 20.7%.
Repayment levels have been stable over the previous four years; fluctuating
only due to seasonality. Fitch expects this stability to continue in the near-term.
Repayment rates tend to move in the opposite direction to arrears. The middle
of the year has historically seen rising repayment rates due to low seasonal
spending, while the end of the year is characterised by a slight slowdown in
repayment rates as borrowers grapple with Christmas and holiday spending.
RMBS Repayment Rates (%)
Prime
1Q16 ∆ 4Q15
Dinkum
CPR (%)
BPR (%)
19.9
21.8
20.7
22.7
15
20
25
30
35
Mar 02 Mar 04 Mar 06 Mar 08 Mar 10 Mar 12 Mar 14 Mar 16
(%)
Prime RMBS Payment Rates – Dinkum
BPR (Dinkum) CPR (Dinkum)
Source: Fitch
1Q16
Mortgage Market Index – The Dinkum RMBS Index – 1Q16 5
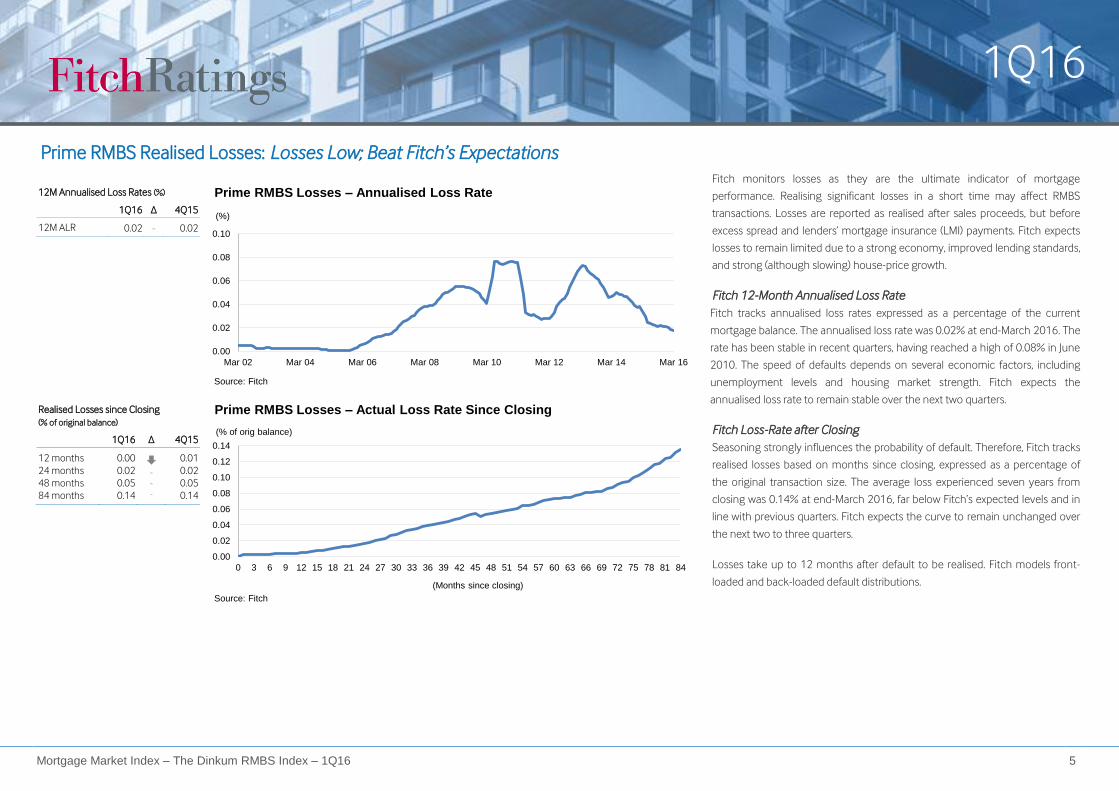
Prime RMBS Realised Losses: Losses Low; Beat Fitch’s Expectations Fitch monitors losses as they are the ultimate indicator of mortgage
performance. Realising significant losses in a short time may affect RMBS
transactions. Losses are reported as realised after sales proceeds, but before
excess spread and lenders’ mortgage insurance (LMI) payments. Fitch expects
losses to remain limited due to a strong economy, improved lending standards,
and strong (although slowing) house-price growth.
Fitch 12-Month Annualised Loss Rate
Fitch tracks annualised loss rates expressed as a percentage of the current
mortgage balance. The annualised loss rate was 0.02% at end-March 2016. The
rate has been stable in recent quarters, having reached a high of 0.08% in June
2010. The speed of defaults depends on several economic factors, including
unemployment levels and housing market strength. Fitch expects the
annualised loss rate to remain stable over the next two quarters.
Fitch Loss-Rate after Closing
Seasoning strongly influences the probability of default. Therefore, Fitch tracks
realised losses based on months since closing, expressed as a percentage of
the original transaction size. The average loss experienced seven years from
closing was 0.14% at end-March 2016, far below Fitch’s expected levels and in
line with previous quarters. Fitch expects the curve to remain unchanged over
the next two to three quarters.
Losses take up to 12 months after default to be realised. Fitch models front-
loaded and back-loaded default distributions.
12M Annualised Loss Rates (%)
1Q16 ∆ 4Q15
12M ALR 0.02 - 0.02
0.00
0.02
0.04
0.06
0.08
0.10
Mar 02 Mar 04 Mar 06 Mar 08 Mar 10 Mar 12 Mar 14 Mar 16
(%)
Prime RMBS Losses – Annualised Loss Rate
Source: Fitch
Realised Losses since Closing
(% of original balance)
1Q16 ∆ 4Q15
12 months
24 months
48 months
84 months
0.00
0.02
0.05
0.14
- -
-
0.01
0.02
0.05
0.14
0.00
0.02
0.04
0.06
0.08
0.10
0.12
0.14
0 3 6 9 12 15 18 21 24 27 30 33 36 39 42 45 48 51 54 57 60 63 66 69 72 75 78 81 84
(% of orig balance)
Prime RMBS Losses – Actual Loss Rate Since Closing
Source: Fitch
(Months since closing)
1Q16
Mortgage Market Index – The Dinkum RMBS Index – 1Q16
6
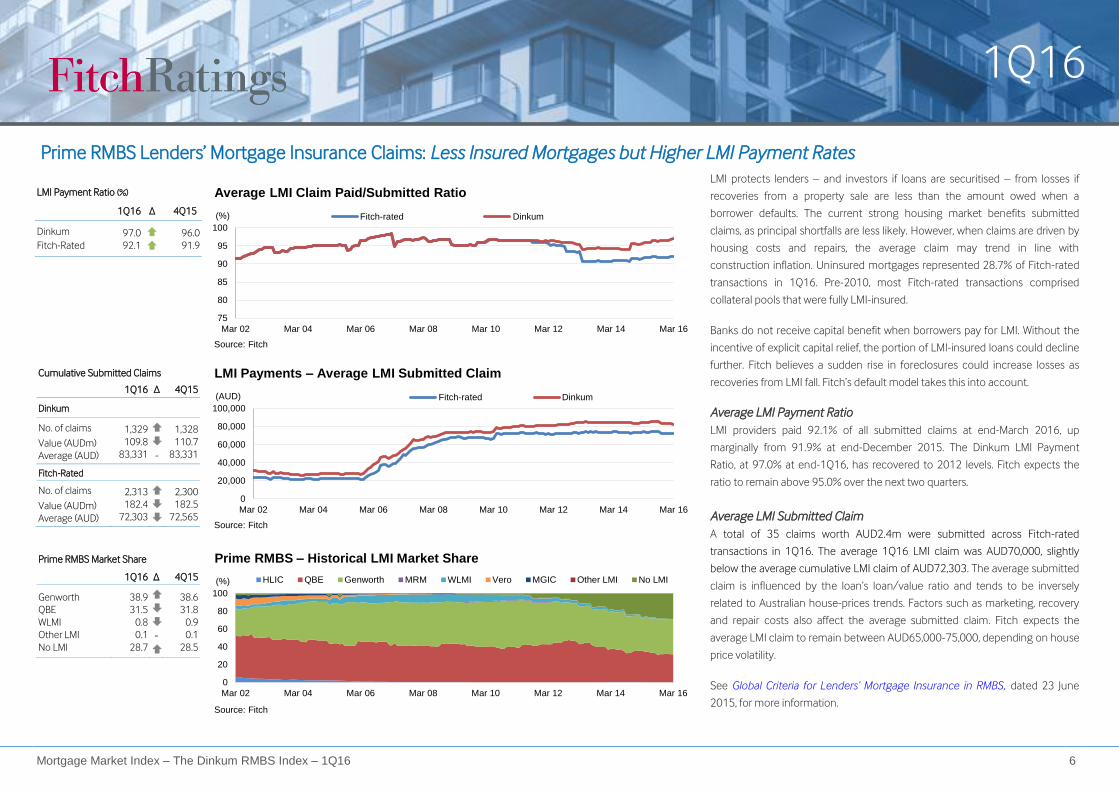
Prime RMBS Lenders’ Mortgage Insurance Claims: Less Insured Mortgages but Higher LMI Payment Rates LMI protects lenders – and investors if loans are securitised – from losses if
recoveries from a property sale are less than the amount owed when a
borrower defaults. The current strong housing market benefits submitted
claims, as principal shortfalls are less likely. However, when claims are driven by
housing costs and repairs, the average claim may trend in line with
construction inflation. Uninsured mortgages represented 28.7% of Fitch-rated
transactions in 1Q16. Pre-2010, most Fitch-rated transactions comprised
collateral pools that were fully LMI-insured.
Banks do not receive capital benefit when borrowers pay for LMI. Without the
incentive of explicit capital relief, the portion of LMI-insured loans could decline
further. Fitch believes a sudden rise in foreclosures could increase losses as
recoveries from LMI fall. Fitch’s default model takes this into account.
Average LMI Payment Ratio
LMI providers paid 92.1% of all submitted claims at end-March 2016, up
marginally from 91.9% at end-December 2015. The Dinkum LMI Payment
Ratio, at 97.0% at end-1Q16, has recovered to 2012 levels. Fitch expects the
ratio to remain above 95.0% over the next two quarters.
Average LMI Submitted Claim
A total of 35 claims worth AUD2.4m were submitted across Fitch-rated
transactions in 1Q16. The average 1Q16 LMI claim was AUD70,000, slightly
below the average cumulative LMI claim of AUD72,303. The average submitted
claim is influenced by the loan’s loan/value ratio and tends to be inversely
related to Australian house-prices trends. Factors such as marketing, recovery
and repair costs also affect the average submitted claim. Fitch expects the
average LMI claim to remain between AUD65,000-75,000, depending on house
price volatility.
See Global Criteria for Lenders’ Mortgage Insurance in RMBS, dated 23 June
2015, for more information.
LMI Payment Ratio (%)
1Q16 ∆ 4Q15
Dinkum
Fitch-Rated
97.0
92.1
96.0
91.9
75
80
85
90
95
100
Mar 02 Mar 04 Mar 06 Mar 08 Mar 10 Mar 12 Mar 14 Mar 16
(%)
Average LMI Claim Paid/Submitted Ratio
Fitch-rated Dinkum
Source: Fitch
Cumulative Submitted Claims
1Q16 ∆ 4Q15
Dinkum
No. of claims
Value (AUDm)
Average (AUD)
1,329
109.8
83,331
-
1,328
110.7
83,331
Fitch-Rated
No. of claims
Value (AUDm)
Average (AUD)
2,313
182.4
72,303
2,300
182.5
72,565
0
20,000
40,000
60,000
80,000
100,000
Mar 02 Mar 04 Mar 06 Mar 08 Mar 10 Mar 12 Mar 14 Mar 16
(AUD)
LMI Payments – Average LMI Submitted Claim
Fitch-rated Dinkum
Source: Fitch
Prime RMBS Market Share
1Q16 ∆ 4Q15
Genworth
QBE
WLMI
Other LMI
No LMI
38.9
31.5
0.8
0.1
28.7
-
38.6
31.8
0.9
0.1
28.5
0
20
40
60
80
100
Mar 02 Mar 04 Mar 06 Mar 08 Mar 10 Mar 12 Mar 14 Mar 16
(%)
Prime RMBS – Historical LMI Market Share
HLIC QBE Genworth MRM WLMI Vero MGIC Other LMI No LMI
Source: Fitch
1Q16
Mortgage Market Index – The Dinkum RMBS Index – 1Q16 7
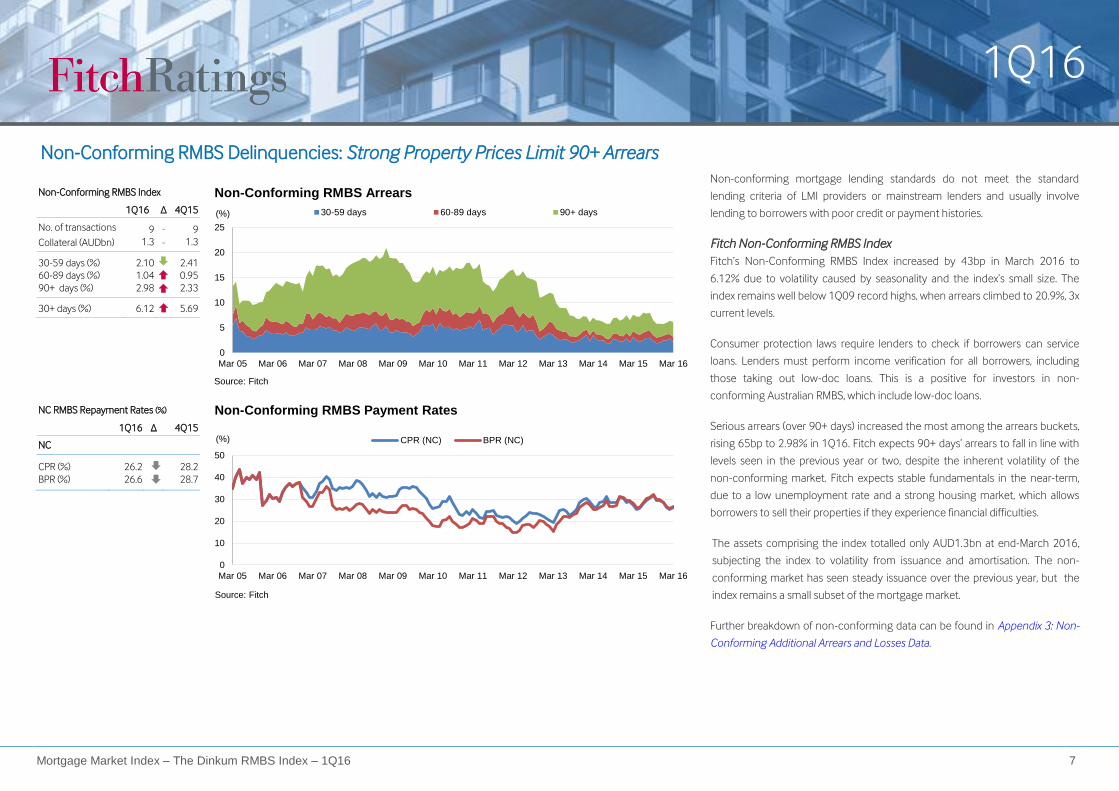
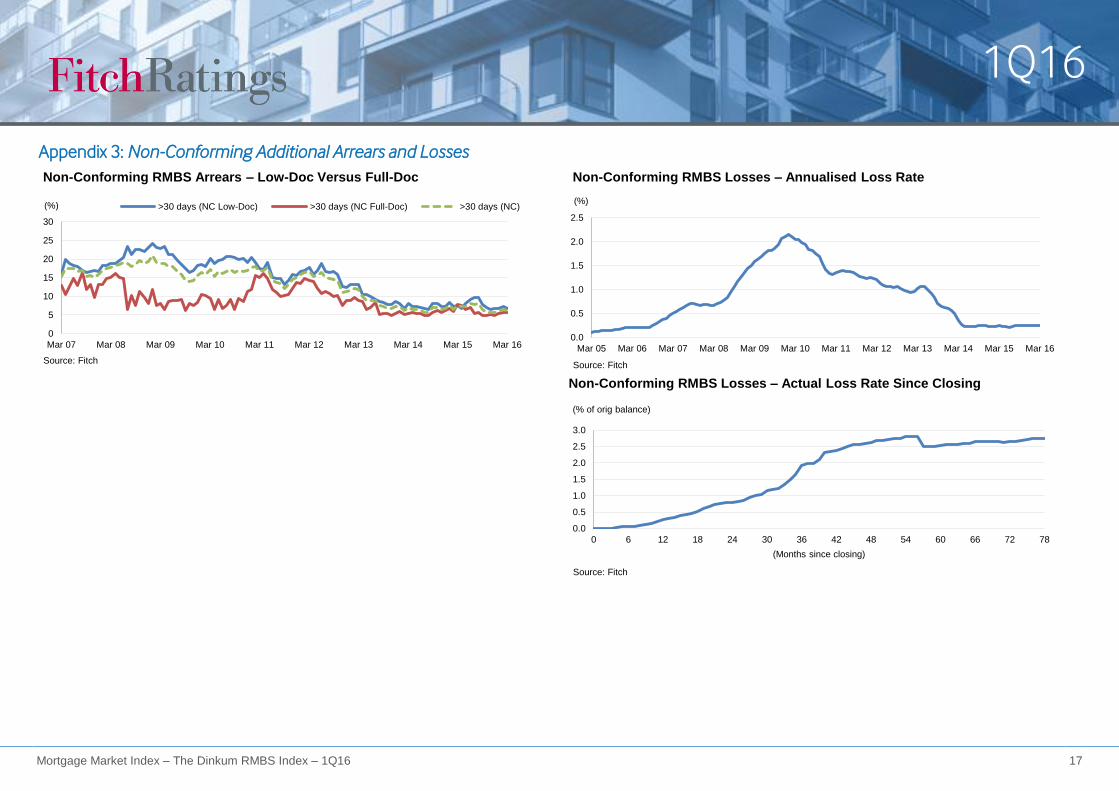
Non-Conforming RMBS Delinquencies: Strong Property Prices Limit 90+ Arrears
Non-conforming mortgage lending standards do not meet the standard
lending criteria of LMI providers or mainstream lenders and usually involve
lending to borrowers with poor credit or payment histories.
Fitch Non-Conforming RMBS Index
Fitch’s Non-Conforming RMBS Index increased by 43bp in March 2016 to
6.12% due to volatility caused by seasonality and the index’s small size. The
index remains well below 1Q09 record highs, when arrears climbed to 20.9%, 3x
current levels.
Consumer protection laws require lenders to check if borrowers can service
loans. Lenders must perform income verification for all borrowers, including
those taking out low-doc loans. This is a positive for investors in non-
conforming Australian RMBS, which include low-doc loans.
Serious arrears (over 90+ days) increased the most among the arrears buckets,
rising 65bp to 2.98% in 1Q16. Fitch expects 90+ days’ arrears to fall in line with
levels seen in the previous year or two, despite the inherent volatility of the
non-conforming market. Fitch expects stable fundamentals in the near-term,
due to a low unemployment rate and a strong housing market, which allows
borrowers to sell their properties if they experience financial difficulties.
The assets comprising the index totalled only AUD1.3bn at end-March 2016,
subjecting the index to volatility from issuance and amortisation. The non-
conforming market has seen steady issuance over the previous year, but the
index remains a small subset of the mortgage market.
Further breakdown of non-conforming data can be found in Appendix 3: Non-
Conforming Additional Arrears and Losses Data.
Non-Conforming RMBS Index
1Q16 ∆ 4Q15
No. of transactions
Collateral (AUDbn)
9
1.3 - -
9
1.3
30-59 days (%)
60-89 days (%)
90+ days (%)
2.10
1.04
2.98
2.41
0.95
2.33
30+ days (%) 6.12 5.69
0
5
10
15
20
25
Mar 05 Mar 06 Mar 07 Mar 08 Mar 09 Mar 10 Mar 11 Mar 12 Mar 13 Mar 14 Mar 15 Mar 16
(%)
Non-Conforming RMBS Arrears
30-59 days 60-89 days 90+ days
Source: Fitch
NC RMBS Repayment Rates (%)
1Q16 ∆ 4Q15
NC
CPR (%)
BPR (%)
26.2
26.6
28.2
28.7
0
10
20
30
40
50
Mar 05 Mar 06 Mar 07 Mar 08 Mar 09 Mar 10 Mar 11 Mar 12 Mar 13 Mar 14 Mar 15 Mar 16
(%)
Non-Conforming RMBS Payment Rates
CPR (NC) BPR (NC)
Source: Fitch
1Q16
Mortgage Market Index – The Dinkum RMBS Index – 1Q16 8
Key Drivers Stable Recent Developments
House-Price Growth Moderating: Six out of eight Australian capital cities
recorded increasing house price growth in the quarter to end-March 2016.
However, house price growth for the year to March 2016 was 6.4%, down from
the double-digit growth experienced through much of 2H15. The current
environment of rising house prices, low real-wage growth and tighter lending
standards makes it harder for first home buyers to enter the market. However, a
slowdown in house-price growth could see increased 90+ days arrears, as high
house prices allow borrowers to sell properties to clear arrears.
Stable SVR: The standard variable rate (SVR) was stable in 1Q16, but the 4Q15
rise to 5.65% from 5.45% may have contributed to the higher 30+ day’s
delinquency rate in 1Q16. The SVR decreased in May 2016 following the RBA’s
decision to lower the target cash rate and Fitch expects this to positively
contribute to mortgage performance over the next two quarters. Fitch expects
delinquency rates to remain above 0.8%, as arrears are close to their natural
floor.
CoreLogic RP Data
Home Value Index
% Change
1Q16
from
4Q15
1Q16
from
1Q15
Weighted-average of
eight capital cities 1.62 6.39
Sydney 2.00 7.44
Melbourne 2.20 9.82
Brisbane -0.08 4.50
Adelaide 2.38 3.17
Perth -0.92 -1.95
Hobart 6.51 4.82
Darwin 2.36 -1.78
Canberra 1.79 1.74
Source: CoreLogic / RP Data
200
400
600
800
1,000
Mar 02 Mar 03 Mar 04 Mar 05 Mar 06 Mar 07 Mar 08 Mar 09 Mar 10 Mar 11 Mar 12 Mar 13 Mar 14 Mar 15 Mar 16
CoreLogic RP Data Home Value IndexSydney Melbourne Brisbane
Adelaide Perth Hobart
Darwin Canberra 8 Capital city aggregate
Source: CoreLogic RP Data
-10
-5
0
5
10
15
20
25
Mar 02 Mar 04 Mar 06 Mar 08 Mar 10 Mar 12 Mar 14 Mar 16
(%)
Change in Home Prices
Quarterly change Annual change
Source: CoreLogic RP Data
Interest-Rates
Quarter SVR
(%)
Cash
Rate (%)
31 Mar 2016 5.65 2.00
31 Dec 2015 5.65 2.00
30 Sep 2015 5.45 2.00
30 Jun 2015 5.45 2.00
31 Mar 2015 5.65 2.25
Source: Reserve Bank of Australia
0
2
4
6
8
10
12
Mar 02 Mar 04 Mar 06 Mar 08 Mar 10 Mar 12 Mar 14 Mar 16
(%)
RBA Rates
Standard variable rate RBA cash rate
Source: Reserve Bank of Australia
1Q16
Mortgage Market Index – The Dinkum RMBS Index – 1Q16 9
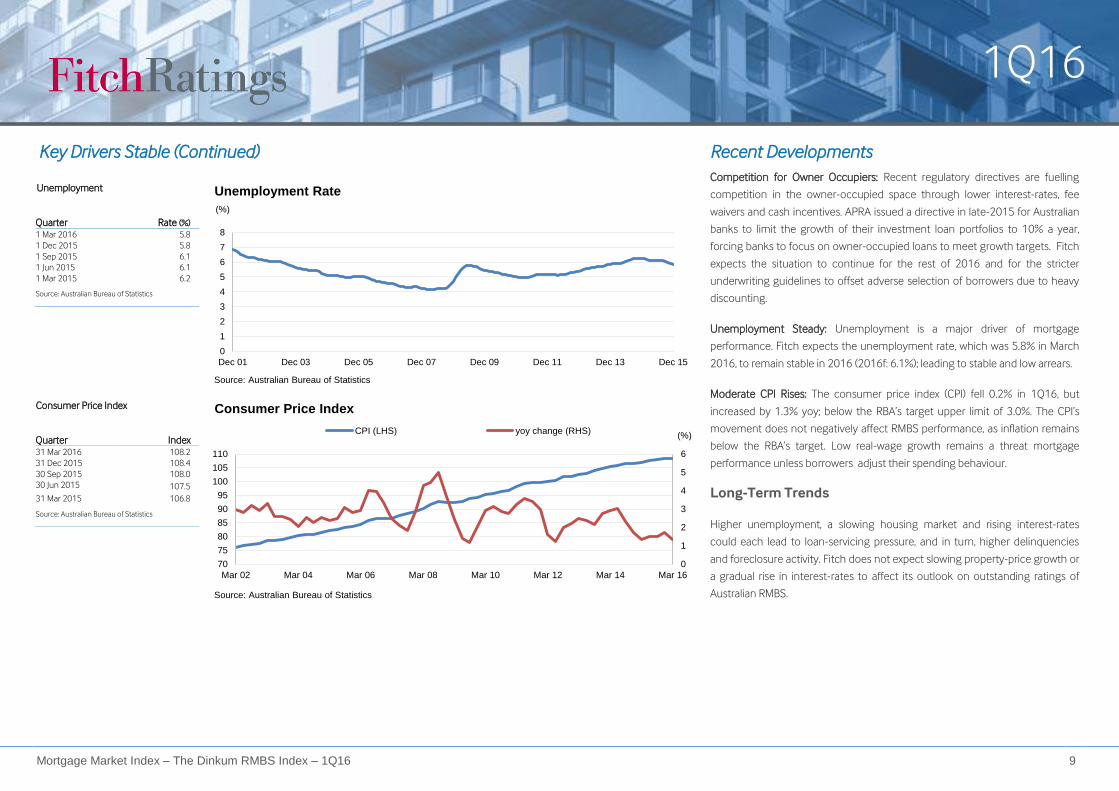
Key Drivers Stable (Continued) Recent Developments Competition for Owner Occupiers: Recent regulatory directives are fuelling
competition in the owner-occupied space through lower interest-rates, fee
waivers and cash incentives. APRA issued a directive in late-2015 for Australian
banks to limit the growth of their investment loan portfolios to 10% a year,
forcing banks to focus on owner-occupied loans to meet growth targets. Fitch
expects the situation to continue for the rest of 2016 and for the stricter
underwriting guidelines to offset adverse selection of borrowers due to heavy
discounting.
Unemployment Steady: Unemployment is a major driver of mortgage
performance. Fitch expects the unemployment rate, which was 5.8% in March
2016, to remain stable in 2016 (2016f: 6.1%); leading to stable and low arrears.
Moderate CPI Rises: The consumer price index (CPI) fell 0.2% in 1Q16, but
increased by 1.3% yoy; below the RBA’s target upper limit of 3.0%. The CPI’s
movement does not negatively affect RMBS performance, as inflation remains
below the RBA’s target. Low real-wage growth remains a threat mortgage
performance unless borrowers adjust their spending behaviour.
Long-Term Trends
Higher unemployment, a slowing housing market and rising interest-rates
could each lead to loan-servicing pressure, and in turn, higher delinquencies
and foreclosure activity. Fitch does not expect slowing property-price growth or
a gradual rise in interest-rates to affect its outlook on outstanding ratings of
Australian RMBS.
Unemployment
Quarter Rate (%)
1 Mar 2016 5.8
1 Dec 2015 5.8
1 Sep 2015 6.1
1 Jun 2015 6.1
1 Mar 2015 6.2
Source: Australian Bureau of Statistics
0
1
2
3
4
5
6
7
8
Dec 01 Dec 03 Dec 05 Dec 07 Dec 09 Dec 11 Dec 13 Dec 15
(%)
Unemployment Rate
Source: Australian Bureau of Statistics
Consumer Price Index
Quarter Index
31 Mar 2016 108.2
31 Dec 2015 108.4
30 Sep 2015 108.0
30 Jun 2015 107.5
31 Mar 2015 106.8
Source: Australian Bureau of Statistics
0
1
2
3
4
5
6
70
75
80
85
90
95
100
105
110
Mar 02 Mar 04 Mar 06 Mar 08 Mar 10 Mar 12 Mar 14 Mar 16
Consumer Price Index
CPI (LHS) yoy change (RHS)
Source: Australian Bureau of Statistics
(%)
1Q16
Mortgage Market Index – The Dinkum RMBS Index – 1Q16 10
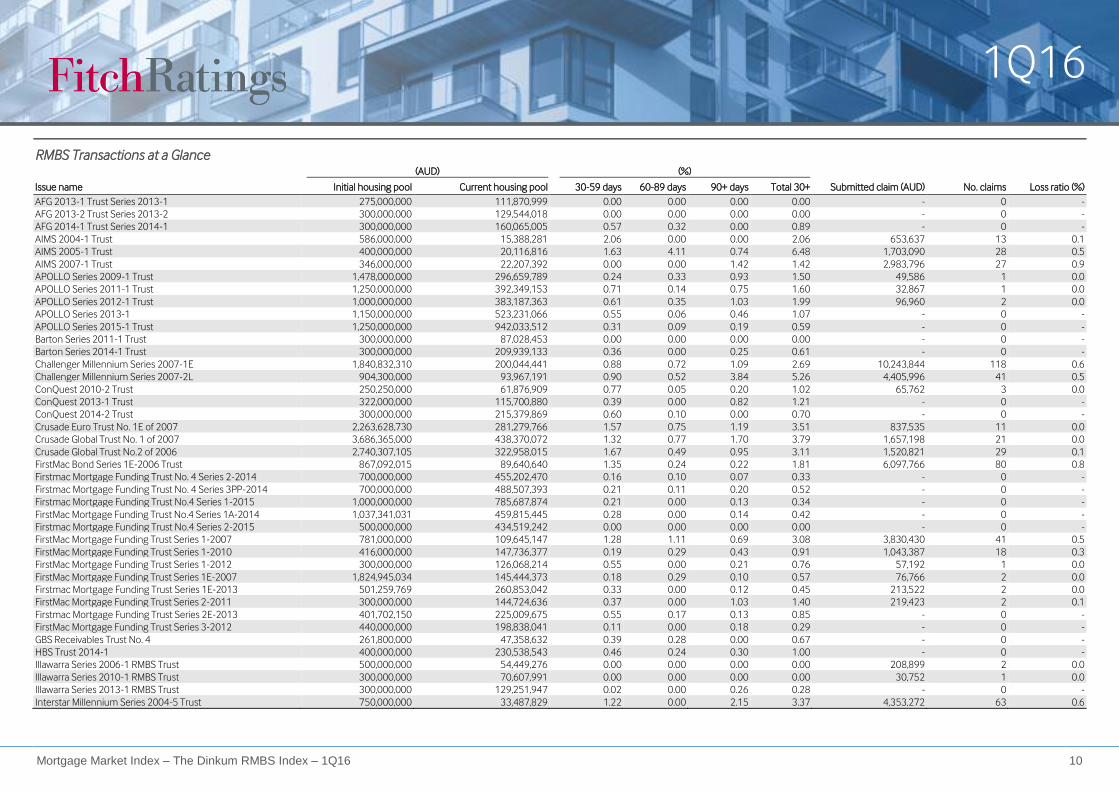
RMBS Transactions at a Glance (AUD) (%)
Issue name Initial housing pool Current housing pool 30-59 days 60-89 days 90+ days Total 30+ Submitted claim (AUD) No. claims Loss ratio (%)
AFG 2013-1 Trust Series 2013-1 275,000,000 111,870,999 0.00 0.00 0.00 0.00 - 0 -
AFG 2013-2 Trust Series 2013-2 300,000,000 129,544,018 0.00 0.00 0.00 0.00 - 0 -
AFG 2014-1 Trust Series 2014-1 300,000,000 160,065,005 0.57 0.32 0.00 0.89 - 0 -
AIMS 2004-1 Trust 586,000,000 15,388,281 2.06 0.00 0.00 2.06 653,637 13 0.1
AIMS 2005-1 Trust 400,000,000 20,116,816 1.63 4.11 0.74 6.48 1,703,090 28 0.5
AIMS 2007-1 Trust 346,000,000 22,207,392 0.00 0.00 1.42 1.42 2,983,796 27 0.9
APOLLO Series 2009-1 Trust 1,478,000,000 296,659,789 0.24 0.33 0.93 1.50 49,586 1 0.0
APOLLO Series 2011-1 Trust 1,250,000,000 392,349,153 0.71 0.14 0.75 1.60 32,867 1 0.0
APOLLO Series 2012-1 Trust 1,000,000,000 383,187,363 0.61 0.35 1.03 1.99 96,960 2 0.0
APOLLO Series 2013-1 1,150,000,000 523,231,066 0.55 0.06 0.46 1.07 - 0 -
APOLLO Series 2015-1 Trust 1,250,000,000 942,033,512 0.31 0.09 0.19 0.59 - 0 -
Barton Series 2011-1 Trust 300,000,000 87,028,453 0.00 0.00 0.00 0.00 - 0 -
Barton Series 2014-1 Trust 300,000,000 209,939,133 0.36 0.00 0.25 0.61 - 0 -
Challenger Millennium Series 2007-1E 1,840,832,310 200,044,441 0.88 0.72 1.09 2.69 10,243,844 118 0.6
Challenger Millennium Series 2007-2L 904,300,000 93,967,191 0.90 0.52 3.84 5.26 4,405,996 41 0.5
ConQuest 2010-2 Trust 250,250,000 61,876,909 0.77 0.05 0.20 1.02 65,762 3 0.0
ConQuest 2013-1 Trust 322,000,000 115,700,880 0.39 0.00 0.82 1.21 - 0 -
ConQuest 2014-2 Trust 300,000,000 215,379,869 0.60 0.10 0.00 0.70 - 0 -
Crusade Euro Trust No. 1E of 2007 2,263,628,730 281,279,766 1.57 0.75 1.19 3.51 837,535 11 0.0
Crusade Global Trust No. 1 of 2007 3,686,365,000 438,370,072 1.32 0.77 1.70 3.79 1,657,198 21 0.0
Crusade Global Trust No.2 of 2006 2,740,307,105 322,958,015 1.67 0.49 0.95 3.11 1,520,821 29 0.1
FirstMac Bond Series 1E-2006 Trust 867,092,015 89,640,640 1.35 0.24 0.22 1.81 6,097,766 80 0.8
Firstmac Mortgage Funding Trust No. 4 Series 2-2014 700,000,000 455,202,470 0.16 0.10 0.07 0.33 - 0 -
Firstmac Mortgage Funding Trust No. 4 Series 3PP-2014 700,000,000 488,507,393 0.21 0.11 0.20 0.52 - 0 -
Firstmac Mortgage Funding Trust No.4 Series 1-2015 1,000,000,000 785,687,874 0.21 0.00 0.13 0.34 - 0 -
FirstMac Mortgage Funding Trust No.4 Series 1A-2014 1,037,341,031 459,815,445 0.28 0.00 0.14 0.42 - 0 -
Firstmac Mortgage Funding Trust No.4 Series 2-2015 500,000,000 434,519,242 0.00 0.00 0.00 0.00 - 0 -
FirstMac Mortgage Funding Trust Series 1-2007 781,000,000 109,645,147 1.28 1.11 0.69 3.08 3,830,430 41 0.5
FirstMac Mortgage Funding Trust Series 1-2010 416,000,000 147,736,377 0.19 0.29 0.43 0.91 1,043,387 18 0.3
FirstMac Mortgage Funding Trust Series 1-2012 300,000,000 126,068,214 0.55 0.00 0.21 0.76 57,192 1 0.0
FirstMac Mortgage Funding Trust Series 1E-2007 1,824,945,034 145,444,373 0.18 0.29 0.10 0.57 76,766 2 0.0
Firstmac Mortgage Funding Trust Series 1E-2013 501,259,769 260,853,042 0.33 0.00 0.12 0.45 213,522 2 0.0
FirstMac Mortgage Funding Trust Series 2-2011 300,000,000 144,724,636 0.37 0.00 1.03 1.40 219,423 2 0.1
Firstmac Mortgage Funding Trust Series 2E-2013 401,702,150 225,009,675 0.55 0.17 0.13 0.85 - 0 -
FirstMac Mortgage Funding Trust Series 3-2012 440,000,000 198,838,041 0.11 0.00 0.18 0.29 - 0 -
GBS Receivables Trust No. 4 261,800,000 47,358,632 0.39 0.28 0.00 0.67 - 0 -
HBS Trust 2014-1 400,000,000 230,538,543 0.46 0.24 0.30 1.00 - 0 -
Illawarra Series 2006-1 RMBS Trust 500,000,000 54,449,276 0.00 0.00 0.00 0.00 208,899 2 0.0
Illawarra Series 2010-1 RMBS Trust 300,000,000 70,607,991 0.00 0.00 0.00 0.00 30,752 1 0.0
Illawarra Series 2013-1 RMBS Trust 300,000,000 129,251,947 0.02 0.00 0.26 0.28 - 0 -
Interstar Millennium Series 2004-5 Trust 750,000,000 33,487,829 1.22 0.00 2.15 3.37 4,353,272 63 0.6
1Q16
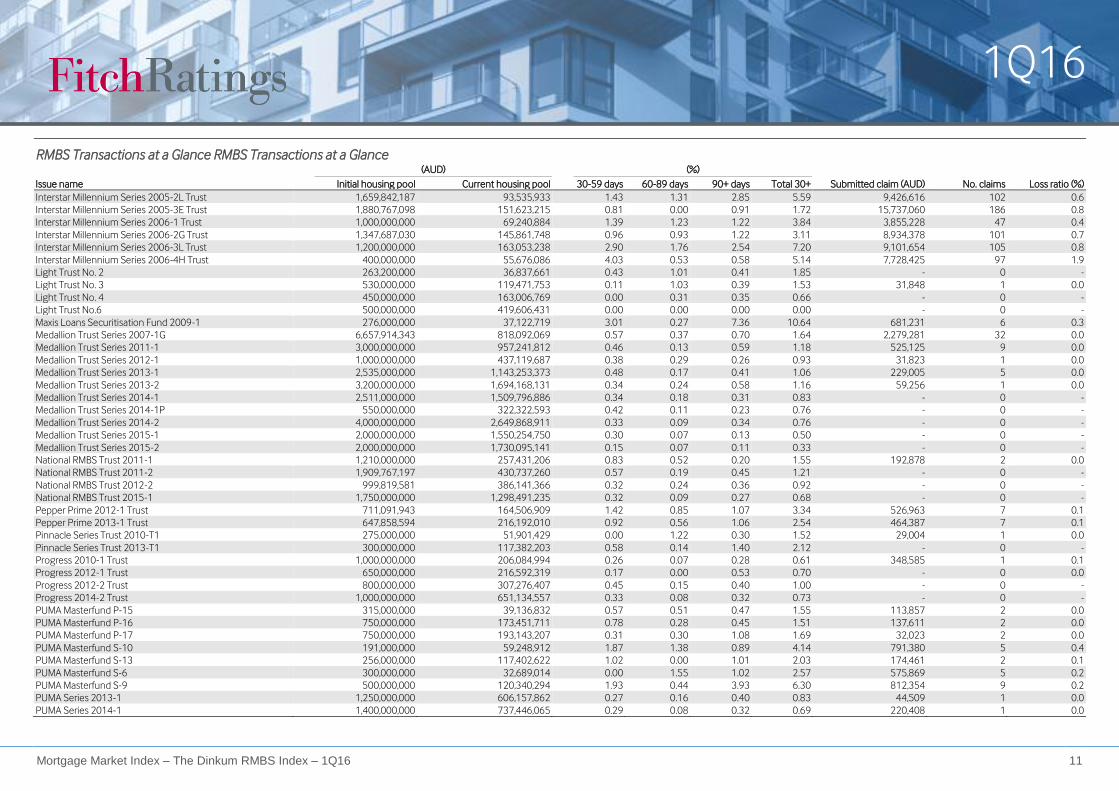
Mortgage Market Index – The Dinkum RMBS Index – 1Q16 11
RMBS Transactions at a Glance RMBS Transactions at a Glance
(AUD) (%)
Issue name Initial housing pool Current housing pool 30-59 days 60-89 days 90+ days Total 30+ Submitted claim (AUD) No. claims Loss ratio (%)
Interstar Millennium Series 2005-2L Trust 1,659,842,187 93,535,933 1.43 1.31 2.85 5.59 9,426,616 102 0.6
Interstar Millennium Series 2005-3E Trust 1,880,767,098 151,623,215 0.81 0.00 0.91 1.72 15,737,060 186 0.8
Interstar Millennium Series 2006-1 Trust 1,000,000,000 69,240,884 1.39 1.23 1.22 3.84 3,855,228 47 0.4
Interstar Millennium Series 2006-2G Trust 1,347,687,030 145,861,748 0.96 0.93 1.22 3.11 8,934,378 101 0.7
Interstar Millennium Series 2006-3L Trust 1,200,000,000 163,053,238 2.90 1.76 2.54 7.20 9,101,654 105 0.8
Interstar Millennium Series 2006-4H Trust 400,000,000 55,676,086 4.03 0.53 0.58 5.14 7,728,425 97 1.9
Light Trust No. 2 263,200,000 36,837,661 0.43 1.01 0.41 1.85 - 0 -
Light Trust No. 3 530,000,000 119,471,753 0.11 1.03 0.39 1.53 31,848 1 0.0
Light Trust No. 4 450,000,000 163,006,769 0.00 0.31 0.35 0.66 - 0 -
Light Trust No.6 500,000,000 419,606,431 0.00 0.00 0.00 0.00 - 0 -
Maxis Loans Securitisation Fund 2009-1 276,000,000 37,122,719 3.01 0.27 7.36 10.64 681,231 6 0.3
Medallion Trust Series 2007-1G 6,657,914,343 818,092,069 0.57 0.37 0.70 1.64 2,279,281 32 0.0
Medallion Trust Series 2011-1 3,000,000,000 957,241,812 0.46 0.13 0.59 1.18 525,125 9 0.0
Medallion Trust Series 2012-1 1,000,000,000 437,119,687 0.38 0.29 0.26 0.93 31,823 1 0.0
Medallion Trust Series 2013-1 2,535,000,000 1,143,253,373 0.48 0.17 0.41 1.06 229,005 5 0.0
Medallion Trust Series 2013-2 3,200,000,000 1,694,168,131 0.34 0.24 0.58 1.16 59,256 1 0.0
Medallion Trust Series 2014-1 2,511,000,000 1,509,796,886 0.34 0.18 0.31 0.83 - 0 -
Medallion Trust Series 2014-1P 550,000,000 322,322,593 0.42 0.11 0.23 0.76 - 0 -
Medallion Trust Series 2014-2 4,000,000,000 2,649,868,911 0.33 0.09 0.34 0.76 - 0 -
Medallion Trust Series 2015-1 2,000,000,000 1,550,254,750 0.30 0.07 0.13 0.50 - 0 -
Medallion Trust Series 2015-2 2,000,000,000 1,730,095,141 0.15 0.07 0.11 0.33 - 0 -
National RMBS Trust 2011-1 1,210,000,000 257,431,206 0.83 0.52 0.20 1.55 192,878 2 0.0
National RMBS Trust 2011-2 1,909,767,197 430,737,260 0.57 0.19 0.45 1.21 - 0 -
National RMBS Trust 2012-2 999,819,581 386,141,366 0.32 0.24 0.36 0.92 - 0 -
National RMBS Trust 2015-1 1,750,000,000 1,298,491,235 0.32 0.09 0.27 0.68 - 0 -
Pepper Prime 2012-1 Trust 711,091,943 164,506,909 1.42 0.85 1.07 3.34 526,963 7 0.1
Pepper Prime 2013-1 Trust 647,858,594 216,192,010 0.92 0.56 1.06 2.54 464,387 7 0.1
Pinnacle Series Trust 2010-T1 275,000,000 51,901,429 0.00 1.22 0.30 1.52 29,004 1 0.0
Pinnacle Series Trust 2013-T1 300,000,000 117,382,203 0.58 0.14 1.40 2.12 - 0 -
Progress 2010-1 Trust 1,000,000,000 206,084,994 0.26 0.07 0.28 0.61 348,585 1 0.1
Progress 2012-1 Trust 650,000,000 216,592,319 0.17 0.00 0.53 0.70 - 0 0.0
Progress 2012-2 Trust 800,000,000 307,276,407 0.45 0.15 0.40 1.00 - 0 -
Progress 2014-2 Trust 1,000,000,000 651,134,557 0.33 0.08 0.32 0.73 - 0 -
PUMA Masterfund P-15 315,000,000 39,136,832 0.57 0.51 0.47 1.55 113,857 2 0.0
PUMA Masterfund P-16 750,000,000 173,451,711 0.78 0.28 0.45 1.51 137,611 2 0.0
PUMA Masterfund P-17 750,000,000 193,143,207 0.31 0.30 1.08 1.69 32,023 2 0.0
PUMA Masterfund S-10 191,000,000 59,248,912 1.87 1.38 0.89 4.14 791,380 5 0.4
PUMA Masterfund S-13 256,000,000 117,402,622 1.02 0.00 1.01 2.03 174,461 2 0.1
PUMA Masterfund S-6 300,000,000 32,689,014 0.00 1.55 1.02 2.57 575,869 5 0.2
PUMA Masterfund S-9 500,000,000 120,340,294 1.93 0.44 3.93 6.30 812,354 9 0.2
PUMA Series 2013-1 1,250,000,000 606,157,862 0.27 0.16 0.40 0.83 44,509 1 0.0
PUMA Series 2014-1 1,400,000,000 737,446,065 0.29 0.08 0.32 0.69 220,408 1 0.0
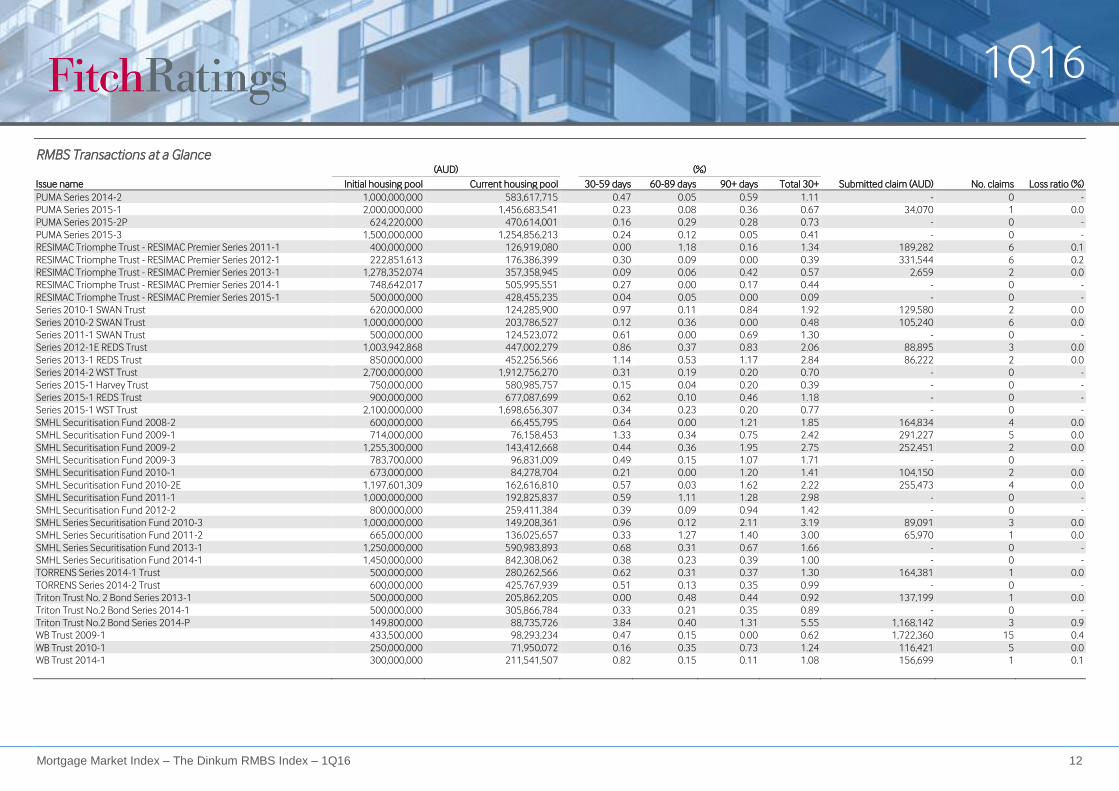
1Q16
Mortgage Market Index – The Dinkum RMBS Index – 1Q16 12
RMBS Transactions at a Glance
(AUD) (%)
Issue name Initial housing pool Current housing pool 30-59 days 60-89 days 90+ days Total 30+ Submitted claim (AUD) No. claims Loss ratio (%)
PUMA Series 2014-2 1,000,000,000 583,617,715 0.47 0.05 0.59 1.11 - 0 -
PUMA Series 2015-1 2,000,000,000 1,456,683,541 0.23 0.08 0.36 0.67 34,070 1 0.0
PUMA Series 2015-2P 624,220,000 470,614,001 0.16 0.29 0.28 0.73 - 0 -
PUMA Series 2015-3 1,500,000,000 1,254,856,213 0.24 0.12 0.05 0.41 - 0 -
RESIMAC Triomphe Trust - RESIMAC Premier Series 2011-1 400,000,000 126,919,080 0.00 1.18 0.16 1.34 189,282 6 0.1
RESIMAC Triomphe Trust - RESIMAC Premier Series 2012-1 222,851,613 176,386,399 0.30 0.09 0.00 0.39 331,544 6 0.2
RESIMAC Triomphe Trust - RESIMAC Premier Series 2013-1 1,278,352,074 357,358,945 0.09 0.06 0.42 0.57 2,659 2 0.0
RESIMAC Triomphe Trust - RESIMAC Premier Series 2014-1 748,642,017 505,995,551 0.27 0.00 0.17 0.44 - 0 -
RESIMAC Triomphe Trust - RESIMAC Premier Series 2015-1 500,000,000 428,455,235 0.04 0.05 0.00 0.09 - 0 -
Series 2010-1 SWAN Trust 620,000,000 124,285,900 0.97 0.11 0.84 1.92 129,580 2 0.0
Series 2010-2 SWAN Trust 1,000,000,000 203,786,527 0.12 0.36 0.00 0.48 105,240 6 0.0
Series 2011-1 SWAN Trust 500,000,000 124,523,072 0.61 0.00 0.69 1.30 - 0 -
Series 2012-1E REDS Trust 1,003,942,868 447,002,279 0.86 0.37 0.83 2.06 88,895 3 0.0
Series 2013-1 REDS Trust 850,000,000 452,256,566 1.14 0.53 1.17 2.84 86,222 2 0.0
Series 2014-2 WST Trust 2,700,000,000 1,912,756,270 0.31 0.19 0.20 0.70 - 0 -
Series 2015-1 Harvey Trust 750,000,000 580,985,757 0.15 0.04 0.20 0.39 - 0 -
Series 2015-1 REDS Trust 900,000,000 677,087,699 0.62 0.10 0.46 1.18 - 0 -
Series 2015-1 WST Trust 2,100,000,000 1,698,656,307 0.34 0.23 0.20 0.77 - 0 -
SMHL Securitisation Fund 2008-2 600,000,000 66,455,795 0.64 0.00 1.21 1.85 164,834 4 0.0
SMHL Securitisation Fund 2009-1 714,000,000 76,158,453 1.33 0.34 0.75 2.42 291,227 5 0.0
SMHL Securitisation Fund 2009-2 1,255,300,000 143,412,668 0.44 0.36 1.95 2.75 252,451 2 0.0
SMHL Securitisation Fund 2009-3 783,700,000 96,831,009 0.49 0.15 1.07 1.71 - 0 -
SMHL Securitisation Fund 2010-1 673,000,000 84,278,704 0.21 0.00 1.20 1.41 104,150 2 0.0
SMHL Securitisation Fund 2010-2E 1,197,601,309 162,616,810 0.57 0.03 1.62 2.22 255,473 4 0.0
SMHL Securitisation Fund 2011-1 1,000,000,000 192,825,837 0.59 1.11 1.28 2.98 - 0 -
SMHL Securitisation Fund 2012-2 800,000,000 259,411,384 0.39 0.09 0.94 1.42 - 0 -
SMHL Series Securitisation Fund 2010-3 1,000,000,000 149,208,361 0.96 0.12 2.11 3.19 89,091 3 0.0
SMHL Series Securitisation Fund 2011-2 665,000,000 136,025,657 0.33 1.27 1.40 3.00 65,970 1 0.0
SMHL Series Securitisation Fund 2013-1 1,250,000,000 590,983,893 0.68 0.31 0.67 1.66 - 0 -
SMHL Series Securitisation Fund 2014-1 1,450,000,000 842,308,062 0.38 0.23 0.39 1.00 - 0 -
TORRENS Series 2014-1 Trust 500,000,000 280,262,566 0.62 0.31 0.37 1.30 164,381 1 0.0
TORRENS Series 2014-2 Trust 600,000,000 425,767,939 0.51 0.13 0.35 0.99 - 0 -
Triton Trust No. 2 Bond Series 2013-1 500,000,000 205,862,205 0.00 0.48 0.44 0.92 137,199 1 0.0
Triton Trust No.2 Bond Series 2014-1 500,000,000 305,866,784 0.33 0.21 0.35 0.89 - 0 -
Triton Trust No.2 Bond Series 2014-P 149,800,000 88,735,726 3.84 0.40 1.31 5.55 1,168,142 3 0.9
WB Trust 2009-1 433,500,000 98,293,234 0.47 0.15 0.00 0.62 1,722,360 15 0.4
WB Trust 2010-1 250,000,000 71,950,072 0.16 0.35 0.73 1.24 116,421 5 0.0
WB Trust 2014-1 300,000,000 211,541,507 0.82 0.15 0.11 1.08 156,699 1 0.1
1Q16
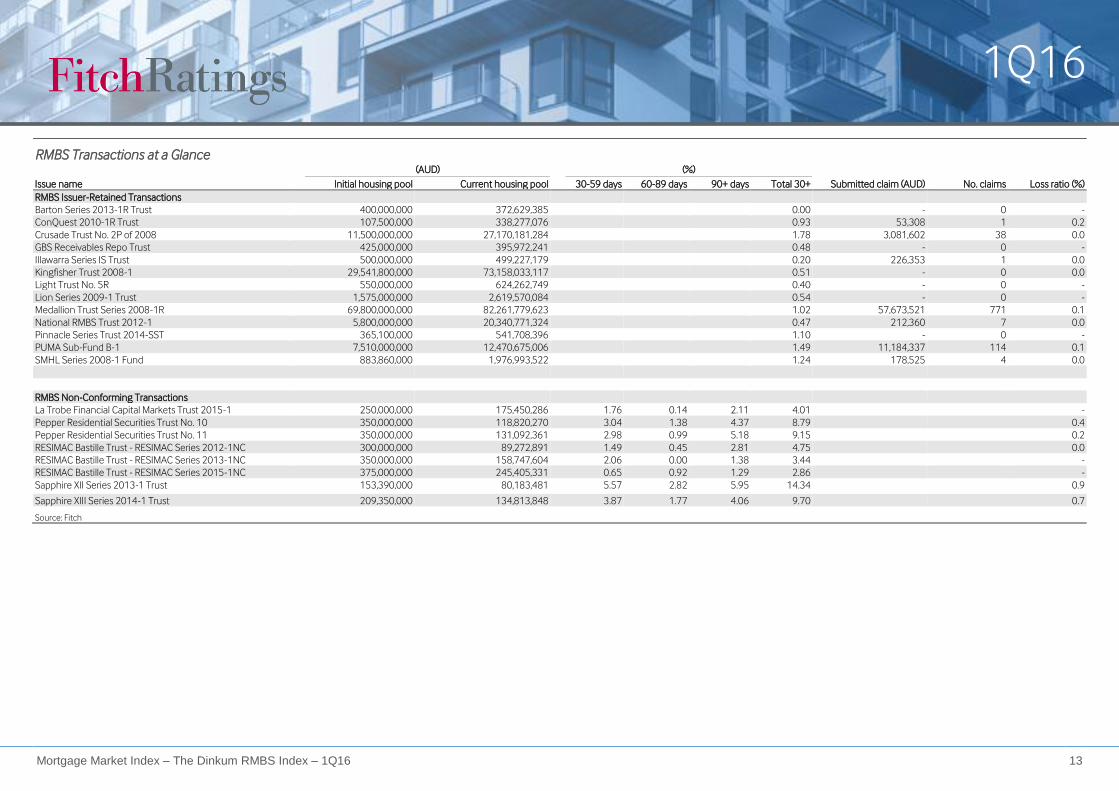
Mortgage Market Index – The Dinkum RMBS Index – 1Q16 13
RMBS Transactions at a Glance
(AUD) (%)
Issue name Initial housing pool Current housing pool 30-59 days 60-89 days 90+ days Total 30+ Submitted claim (AUD) No. claims Loss ratio (%)
RMBS Issuer-Retained Transactions
Barton Series 2013-1R Trust 400,000,000 372,629,385 0.00 - 0 -
ConQuest 2010-1R Trust 107,500,000 338,277,076 0.93 53,308 1 0.2
Crusade Trust No. 2P of 2008 11,500,000,000 27,170,181,284 1.78 3,081,602 38 0.0
GBS Receivables Repo Trust 425,000,000 395,972,241 0.48 - 0 -
Illawarra Series IS Trust 500,000,000 499,227,179 0.20 226,353 1 0.0
Kingfisher Trust 2008-1 29,541,800,000 73,158,033,117 0.51 - 0 0.0
Light Trust No. 5R 550,000,000 624,262,749 0.40 - 0 -
Lion Series 2009-1 Trust 1,575,000,000 2,619,570,084 0.54 - 0 -
Medallion Trust Series 2008-1R 69,800,000,000 82,261,779,623 1.02 57,673,521 771 0.1
National RMBS Trust 2012-1 5,800,000,000 20,340,771,324 0.47 212,360 7 0.0
Pinnacle Series Trust 2014-SST 365,100,000 541,708,396 1.10 - 0 -
PUMA Sub-Fund B-1 7,510,000,000 12,470,675,006 1.49 11,184,337 114 0.1
SMHL Series 2008-1 Fund 883,860,000 1,976,993,522 1.24 178,525 4 0.0
RMBS Non-Conforming Transactions
La Trobe Financial Capital Markets Trust 2015-1 250,000,000 175,450,286 1.76 0.14 2.11 4.01 -
Pepper Residential Securities Trust No. 10 350,000,000 118,820,270 3.04 1.38 4.37 8.79 0.4
Pepper Residential Securities Trust No. 11 350,000,000 131,092,361 2.98 0.99 5.18 9.15 0.2
RESIMAC Bastille Trust - RESIMAC Series 2012-1NC 300,000,000 89,272,891 1.49 0.45 2.81 4.75 0.0
RESIMAC Bastille Trust - RESIMAC Series 2013-1NC 350,000,000 158,747,604 2.06 0.00 1.38 3.44 -
RESIMAC Bastille Trust - RESIMAC Series 2015-1NC 375,000,000 245,405,331 0.65 0.92 1.29 2.86 -
Sapphire XII Series 2013-1 Trust 153,390,000 80,183,481 5.57 2.82 5.95 14.34 0.9
Sapphire XIII Series 2014-1 Trust 209,350,000 134,813,848 3.87 1.77 4.06 9.70 0.7
Source: Fitch
1Q16
Mortgage Market Index – The Dinkum RMBS Index – 1Q16 14
The Dinkum RMBS Index and Methodology Fitch compiles indices based on Fitch-rated Australian RMBS
transactions, using a weighted-average based on mortgage balance.
Fitch-Rated RMBS Index: includes all Australia prime RMBS transactions.
This includes private and issuer-retained transactions. The Fitch-rated
RMBS index represents 18.3% of the total Australian mortgage market.
The Dinkum RMBS Index: includes all public static Australian prime RMBS
transactions; excludes issuer-retained transactions. Fitch does not
include issuer-retained transactions in the Dinkum RMBS Index, as the
size and frequent top-ups would suppress arrears levels and skew
comparisons between periods. Any index based on the performance of
Dinkum RMBS Index transactions exhibits low volatility because the
collateral pools are static and the mortgage balance does not change
significantly over time. Though the Dinkum Index is relatively small, it is a
stable measure of all Fitch-rate transactions. The Dinkum RMBS Index
represents 18.3% of the total Australian mortgage market.
Issuer-Retained Transactions: authorised deposit-taking institutions
(ADIs) create and hold securities that are repo eligible with the Reserve
Bank of Australia. These transactions can be large and have long
revolving periods, where principal collections can be used to purchase
additional non-delinquent loans, rather than repay notes.
The Non-Conforming RMBS Index: consists of mortgages that do not
meet the standard lending criteria of LMI providers and mainstream
lenders, and includes lending to borrowers who have poor credit or
payment histories. Non-conforming transactions tend to have higher
levels of delinquencies and defaults.
The Dinkum Prime Low-Doc RMBS Index: about 2% of mortgages
included in the Dinkum Prime RMBS Index are low-doc loans. Fitch
compiles a separate Dinkum Prime Low-Doc RMBS Index for low-doc
loans. Borrowers with a low-doc loan self-certify their income, as they
often do not have up-to-date financial information. Self-employed
borrowers and others, such as contractors, usually fall into this category.
Seasoning: transactions are added to the indices about six months after
issue to allow some seasoning to occur. The Dinkum Low-Doc RMBS
Index is an exception; here, transactions are included immediately after
closing. Transactions are removed once fully redeemed.
Repayment Rates: Fitch monitors repayment rates to track the
amortisation profile of Australia prime RMBS transactions.
Borrower Payment Rate (BPR) tracks all the principal cash flows driven by
borrowers. It excludes cash flows directly influenced by lenders’ activity
(eg substitutions, further advances, repurchases, or new loan purchases).
Conditional Prepayment Rate (CPR) excludes scheduled payments and,
therefore, focuses on principal prepayment rather than the original
scheduled amortisation.
Losses: net (or realised) losses are reported according to the servicer’s
methodology and when the losses have occurred in the trust. Losses are
reported as the realised losses after sales proceeds, but before excess
spread. The 12M ALR (Annualised Loss Rate) is a 12-month rolling
average of the annualised losses pre-lenders’ mortgage insurance as a
percentage of the current transaction size.
As seasoning is a key driver of losses, Fitch also monitors realised losses
from months since closing, and are expressed as a percentage of the
original transaction size.
LMI Payments: the Average LMI Claim Index shows the average dollar
amount of claims submitted for all Fitch-rated transactions.
For a claim to materialise, the loan must first default and upon
foreclosure, property sale proceeds be insufficient to repay the loan. LMI
claims are the amounts claimed by servicers submitted to LMI providers
on realised losses. This index does not therefore give a loss-given-default
metric, as not all defaults result in claims on LMI.
The Average LMI Paid/Submitted Ratio looks at the portion of submitted
claims that have been paid by the LMI providers. This does not include
LMI claims.
Changes to Index Composition: In 1Q16, the prime index portfolio
included AUD45.8bn of mortgages, stable compared to 4Q15.
Three transactions were redeemed and removed from the Dinkum RMBS
Index in 1Q16: Crusade Euro Trust No. 1E of 2006, RESIMAC Triomphe
Trust - RESIMAC Premier Series 2010-2 and SMHL Securitisation Fund
2008-1.
Three new transactions were added to the Dinkum in 1Q16: Medallion
Trust Series 2015-2, PUMA Series 2015-3 and RESIMAC Triomphe Trust -
RESIMAC Premier Series 2015-1.
1Q16
Mortgage Market Index – The Dinkum RMBS Index – 1Q16 15
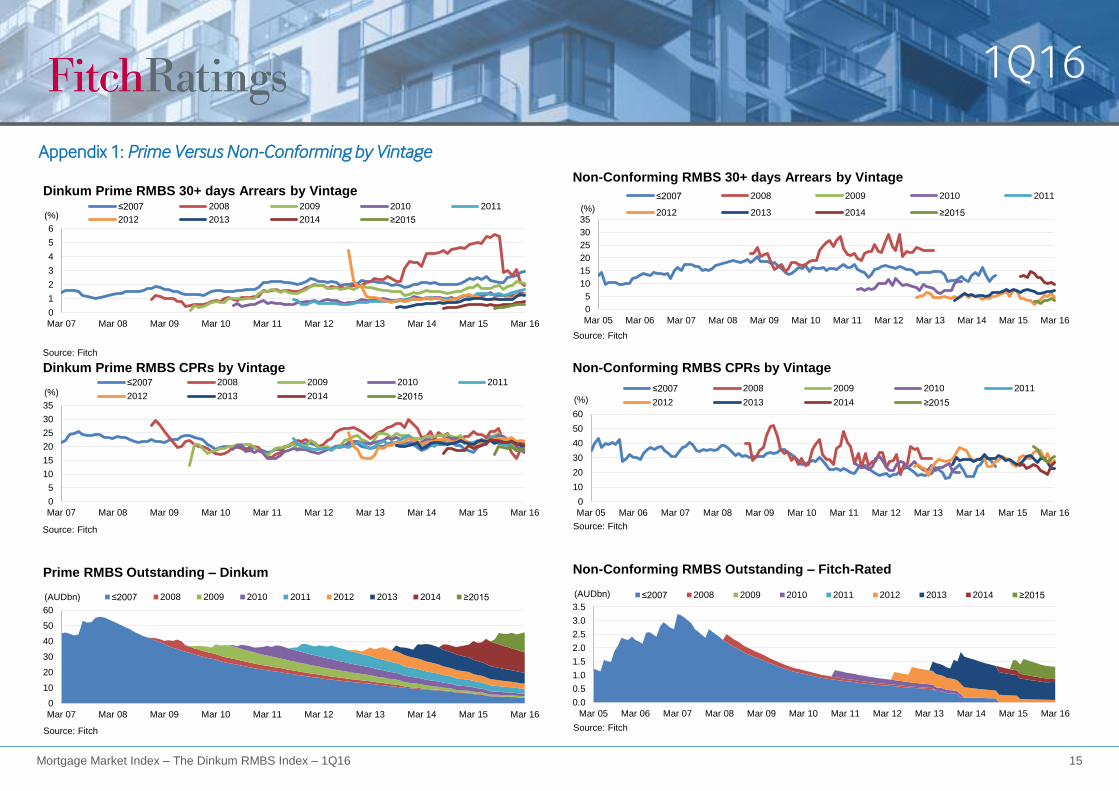
Appendix 1: Prime Versus Non-Conforming by Vintage
0
1
2
3
4
5
6
Mar 07 Mar 08 Mar 09 Mar 10 Mar 11 Mar 12 Mar 13 Mar 14 Mar 15 Mar 16
(%)
Dinkum Prime RMBS 30+ days Arrears by Vintage≤2007 2008 2009 2010 2011
2012 2013 2014 ≥2015
Source: Fitch
0
5
10
15
20
25
30
35
Mar 05 Mar 06 Mar 07 Mar 08 Mar 09 Mar 10 Mar 11 Mar 12 Mar 13 Mar 14 Mar 15 Mar 16
(%)
Non-Conforming RMBS 30+ days Arrears by Vintage
≤2007 2008 2009 2010 2011
2012 2013 2014 ≥2015
Source: Fitch
0
5
10
15
20
25
30
35
Mar 07 Mar 08 Mar 09 Mar 10 Mar 11 Mar 12 Mar 13 Mar 14 Mar 15 Mar 16
(%)
Dinkum Prime RMBS CPRs by Vintage≤2007 2008 2009 2010 2011
2012 2013 2014 ≥2015
Source: Fitch
0
10
20
30
40
50
60
Mar 05 Mar 06 Mar 07 Mar 08 Mar 09 Mar 10 Mar 11 Mar 12 Mar 13 Mar 14 Mar 15 Mar 16
(%)
Non-Conforming RMBS CPRs by Vintage
≤2007 2008 2009 2010 2011
2012 2013 2014 ≥2015
Source: Fitch
0
10
20
30
40
50
60
Mar 07 Mar 08 Mar 09 Mar 10 Mar 11 Mar 12 Mar 13 Mar 14 Mar 15 Mar 16
(AUDbn)
Prime RMBS Outstanding – Dinkum
≤2007 2008 2009 2010 2011 2012 2013 2014 ≥2015
Source: Fitch
0.0
0.5
1.0
1.5
2.0
2.5
3.0
3.5
Mar 05 Mar 06 Mar 07 Mar 08 Mar 09 Mar 10 Mar 11 Mar 12 Mar 13 Mar 14 Mar 15 Mar 16
(AUDbn)
Non-Conforming RMBS Outstanding – Fitch-Rated
≤2007 2008 2009 2010 2011 2012 2013 2014 ≥2015
Source: Fitch
1Q16
Mortgage Market Index – The Dinkum RMBS Index – 1Q16 16
Appendix 2: Issuance and Outstanding Volumes
0
5
10
15
20
25
0
50
100
150
200
250
300
Mar 02 Mar 04 Mar 06 Mar 08 Mar 10 Mar 12 Mar 14 Mar 16
(%)(AUDbn)
Prime RMBS Outstanding – Fitch-Rated
Collateral balance (prime outstanding)(LHS) % of Mortgage Market (RHS)
Source: Fitch
0.0
0.2
0.4
0.6
0.8
0
1
2
3
4
Mar 05 Mar 06 Mar 07 Mar 08 Mar 09 Mar 10 Mar 11 Mar 12 Mar 13 Mar 14 Mar 15 Mar 16
(%)(AUDbn)
Non-Conforming RMBS Outstanding – Fitch-Rated
Collateral balance (LHS) % of mortgage market (RHS)
Source: Fitch
0
5
10
15
20
25
30
1998 1999 2000 2001 2002 2003 2004 2005 2006 2007 2008 2009 2010 2011 2012 2013 2014 2015 2016
(AUDbn)
Prime RMBS Fitch-Rated Public Issuance
1Q 2Q 3Q 4Q
Source: Fitch
0.0
0.5
1.0
1.5
2.0
2003 2004 2005 2006 2007 2008 2010 2012 2013 2014 2015 2016
(AUDbn)
Non-Conforming RMBS Fitch-Rated Public Issuance
1Q 2Q 3Q 4Q
Source: Fitch
0
4
8
12
16
0
1
2
3
4
5
6
7
Mar 07 Mar 08 Mar 09 Mar 10 Mar 11 Mar 12 Mar 13 Mar 14 Mar 15 Mar 16
(%)(AUDbn)
Dinkum Low-Doc Outstanding – Fitch-Rated
Collateral balance (Dinkum low-doc)(LHS) % of Dinkum (prime)(RHS)
Source: Fitch
40
50
60
70
80
0.0
0.5
1.0
1.5
2.0
Mar 07 Mar 08 Mar 09 Mar 10 Mar 11 Mar 12 Mar 13 Mar 14 Mar 15 Mar 16
(%)(AUDbn)
Dinkum Low-Doc Non-Conforming Outstanding – Fitch-Rated
Collateral balance (NC low-doc) (LHS) % of NC RMBS (RHS)
Source: Fitch
1Q16
Mortgage Market Index – The Dinkum RMBS Index – 1Q16 17
Appendix 3: Non-Conforming Additional Arrears and Losses
0
5
10
15
20
25
30
Mar 07 Mar 08 Mar 09 Mar 10 Mar 11 Mar 12 Mar 13 Mar 14 Mar 15 Mar 16
(%)
Non-Conforming RMBS Arrears – Low-Doc Versus Full-Doc
>30 days (NC Low-Doc) >30 days (NC Full-Doc) >30 days (NC)
Source: Fitch
0.0
0.5
1.0
1.5
2.0
2.5
Mar 05 Mar 06 Mar 07 Mar 08 Mar 09 Mar 10 Mar 11 Mar 12 Mar 13 Mar 14 Mar 15 Mar 16
(%)
Non-Conforming RMBS Losses – Annualised Loss Rate
Source: Fitch
0.0
0.5
1.0
1.5
2.0
2.5
3.0
0 6 12 18 24 30 36 42 48 54 60 66 72 78
(% of orig balance)
(Months since closing)
Source: Fitch
Non-Conforming RMBS Losses – Actual Loss Rate Since Closing
1Q16
Mortgage Market Index – The Dinkum RMBS Index – 1Q16 18
ALL FITCH CREDIT RATINGS ARE SUBJECT TO CERTAIN LIMITATIONS AND DISCLAIMERS. PLEASE READ THESE LIMITATIONS AND DISCLAIMERS BY FOLLOWING THIS LINK: HTTPS://FITCHRATINGS.COM/UNDERSTANDINGCREDITRATINGS. IN ADDITION, RATING DEFINITIONS AND THE TERMS OF USE OF SUCH RATINGS ARE AVAILABLE ON THE AGENCY'S PUBLIC WEB SITE AT WWW.FITCHRATINGS.COM. PUBLISHED RATINGS, CRITERIA, AND METHODOLOGIES ARE AVAILABLE FROM THIS SITE AT ALL TIMES. FITCH'S CODE OF CONDUCT, CONFIDENTIALITY, CONFLICTS OF INTEREST, AFFILIATE FIREWALL, COMPLIANCE, AND OTHER RELEVANT POLICIES AND PROCEDURES ARE ALSO AVAILABLE FROM THE CODE OF CONDUCT SECTION OF THIS SITE. FITCH MAY HAVE PROVIDED ANOTHER PERMISSIBLE SERVICE TO THE RATED ENTITY OR ITS RELATED THIRD PARTIES. DETAILS OF THIS SERVICE FOR RATINGS FOR WHICH THE LEAD ANALYST IS BASED IN AN EU-REGISTERED ENTITY CAN BE FOUND ON THE ENTITY SUMMARY PAGE FOR THIS ISSUER ON THE FITCH WEBSITE.
Copyright © 2016 by Fitch Ratings, Inc., Fitch Ratings Ltd. and its subsidiaries. 33 Whitehall Street, NY, NY 10004. Telephone: 1-800-753-4824, (212) 908-0500. Fax: (212) 480-4435. Reproduction or retransmission in whole or in part is prohibited except by permission. All rights reserved. In issuing and maintaining its ratings and in making other reports (including forecast information), Fitch relies on factual information it receives from issuers and underwriters and from other sources Fitch believes to be credible. Fitch conducts a reasonable investigation of the factual information relied upon by it in accordance with its ratings methodology, and obtains reasonable verification of that information from independent sources, to the extent such sources are available for a given security or in a given jurisdiction. The manner of Fitch’s factual investigation and the scope of the third-party verification it obtains will vary depending on the nature of the rated security and its issuer, the requirements and practices in the jurisdiction in which the rated security is offered and sold and/or the issuer is located, the availability and nature of relevant public information, access to the management of the issuer and its advisers, the availability of pre-existing third-party verifications such as audit reports, agreed-upon procedures letters, appraisals, actuarial reports, engineering reports, legal opinions and other reports provided by thi rd parties, the availability of independent and competent third-party verification sources with respect to the particular security or in the particular jurisdiction of the issuer, and a variety of other factors. Users of Fitch’s ratings and reports should understand that neither an enhanced factual investigation nor any third-party verification can ensure that all of the information Fitch relies on in connection with a rating or a report will be accurate and complete. Ultimately, the issuer and its advisers are responsible for the accuracy of the information they provide to Fitch and to the market in offering documents and other reports. In issuing its ratings and its reports, Fitch must rely on the work of experts, including independent auditors with respect to financial statements and attorneys with respect to legal and tax matters. Further, ratings and forecasts of financial and other information are inherently forward-looking and embody assumptions and predictions about future events that by their nature cannot be verified as facts. As a result, despite any verification of current facts, ratings and forecasts can be affected by future events or conditions that were not anticipated at the time a rating or forecast was issued or affirmed.
The information in this report is provided “as is” without any representation or warranty of any kind, and Fitch does not represent or warrant that the report or any of its contents will meet any of the requirements of a recipient of the report. A Fitch rating is an opinion as to the creditworthiness of a security. This opinion and reports made by Fitch are based on established criteria and methodologies that Fitch is continuously evaluating and updating. Therefore, ratings and reports are the collective work product of Fitch and no individual, or group of individuals, is solely responsible for a rating or a report. The rating does not address the risk of loss due to risks other than credit risk, unless such risk is specifically mentioned. Fitch is not engaged in the offer or sale of any security. All Fitch reports have shared authorship. Individuals identified in a Fitch report were involved in, but are not solely responsible for, the opinions stated therein. The individuals are named for contact purposes only. A report providing a Fitch rating is neither a prospectus nor a substitute for the information assembled, verified and presented to investors by the issuer and its agents in connection with the sale of the securities. Ratings may be changed or withdrawn at any time for any reason in the sole discretion of Fitch. Fitch does not provide investment advice of any sort. Ratings are not a recommendation to buy, sell, or hold any security. Ratings do not comment on the adequacy of market price, the suitability of any security for a particular investor, or the tax-exempt nature or taxability of payments made in respect to any security. Fitch receives fees from issuers, insurers, guarantors, other obligors, and underwriters for rating securities. Such fees generally vary from US$1,000 to US$750,000 (or the applicable currency equivalent) per issue. In certain cases, Fitch will rate all or a number of issues issued by a particular issuer, or insured or guaranteed by a particular insurer or guarantor, for a single annual fee. Such fees are expected to vary from US$10,000 to US$1,500,000 (or the applicable currency equivalent). The assignment, publication, or dissemination of a rating by Fitch shall not constitute a consent by Fitch to use its name as an expert in connection with any registration statement filed under the United States securities laws, the Financial Services and Markets Act of 2000 of the United Kingdom, or the securities laws of any particular jurisdiction. Due to the relative efficiency of electronic publishing and distribution, Fitch research may be available to electronic subscribers up to three days earlier than to print subscribers.
For Australia, New Zealand, Taiwan and South Korea only: Fitch Australia Pty Ltd holds an Australian financial services license (AFS license no. 337123) which authorizes it to provide credit ratings to wholesale clients only. Credit ratings information published by Fitch is not intended to be used by persons who are retail clients within the meaning of the Corporations Act 2001.