Embed Size (px)
Citation preview

I N T RO D U C T I O N
Dinoflagellate blooms are common phenomena inmarine and freshwater systems. Blooms eventually declinewhen loss rates, mostly by grazing, decomposition or sedi-mentation, exceed growth rates. The fate of algal bloomsis crucial for the understanding of food web interactions,energy transformation and nutrient cycling. In stratifiedlakes losses of the bloom biomass in epilimnetic waterthrough grazing and decomposition lead to regenerationof nutrients in a temporally short cycle. In contrast, sedi-mentation of algal biomass removes nutrients from thetrophogenic layer, at least until holomixis.
Lake Kinneret, (170 km2) in northern Israel(32°45–53�N and 35°30–38�E) is a warm monomicticfreshwater lake. The lake level fluctuates between 208.9and 214 m below sea level, the mean and maximumdepths when the lake is full are 24 m and 43 m, respec-
tively. The lake typically stratifies from May to December,during which the epilimnion becomes increasinglydepleted of nutrients, while the hypolimnion turns anaer-obic, with increasing concentrations of sulfide andammonia (Berman et al., 1992; Hadas and Pinkas, 1992).Lake Kinneret is characterized by a winter–spring bloomof the large (48–66 µm diameter) armored dinoflagellatePeridinium gatunense NYGAARD (Hickel and Pollingher,1988). Peridinium gatunense (hereon: Peridinium) is accom-panied by several smaller (~20–30 µm diameter) dino-flagellate species of the genus Peridiniopsis (Peridiniopsis
elpatiewskyi, Ps. cunningtonii, Ps. borgei, Ps. penardiforme and Ps.polonicum), which usually reach their maximum abun-dance when the Peridinium bloom declines in early summer(Pollingher and Hickel, 1991).
Like many other dinoflagellates Peridinium and Peridin-
iopsis are motile and are able to perform diel verticalmigration. In Lake Kinneret the dinoflagellates exhibit
Journal of Plankton Research 25(6), © Oxford University Press; all rights reserved
Dinoflagellate bloom development andcollapse in Lake Kinneret: a sedimenttrap studyYEHUDIT VINER-MOZZINI*, TAMAR ZOHARY AND AVITAL GASITH1
ISRAEL OCEANOGRAPHIC AND LIMNOLOGICAL RESEARCH, Y. ALLON KINNERET LIMNOLOGICAL LABORATORY, PO BOX , MIGDAL , ISRAEL AND1INSTITUTE OF NATURE CONSERVATION RESEARCH, GEORGE S. WISE FACULTY OF LIFE SCIENCES, TEL AVIV UNIVERSITY, RAMAT AVIV , ISRAEL
*CORRESPONDING AUTHOR: [email protected]
Warm monomictic Lake Kinneret, Israel, is characterized by a winter–spring water bloom of the
large (~50 µm diameter) dinoflagellate Peridinium gatunense NYGAARD. Usually the P. gatunense
bloom declines in May–June and a less prominent bloom of smaller dinoflagellates (mostly Peridin-
iopsis spp. of ~20–30 µm diameter) develops. Water column abundances and sedimentation losses
to those dinoflagellates were followed throughout 1994 and 1995. The objective was to quantify the
variables that describe population dynamics, that in turn will shed more light on the seasonal patterns
of bloom dynamics. Sedimentation losses were measured by means of sediment traps with and without
a preservative (formaldehyde) that were exposed for 24 h once every 2–3 weeks. Annual sedimen-
tation losses of Peridinium (hypolimnetic trap catches) were 209 g wet wt m–2 year–1 in 1994 and
187 g wet wt m–2 year–1 in 1995, which constituted 16 and 23% of Peridinium production in
those years, respectively. This study revealed that increased death rates preceded a mass sedimentation
flux of Peridinium and caused the decline of the bloom in Lake Kinneret. Annual sedimentation losses
of Peridiniopsis were 55 g wet wt m–2 year–1 in 1994 and 34 g wet wt m–2 year–1 in 1995. In
contrast to live Peridinium cells, Peridiniopsis cells continued to swim to the lower trap after the onset
of thermal stratification, possibly taking advantage of the higher nutrient concentrations below the
thermocline, at a time when the lake is already stratified and the epilimnion is nutrient depleted. This
could be an important factor allowing Peridiniopsis spp. to peak after the decline of Peridinium.
JOURNAL OF PLANKTON RESEARCH VOLUME NUMBER PAGES ‒
02 viner-mozzini (fbg039)(ds) 5/14/03 12:01 PM Page 591

characteristic diel depth dispersion (Berman and Rodhe,1971; Pollingher and Hickel, 1991). Generally, the dino-flagellates are dispersed fairly uniformly throughout thewater column at night. Towards the morning they tend torise, and a population peak is often found close to thewater surface (2–4 m) during the early morning hours.The cells migrate to deeper water by later afternoon andagain disperse throughout the water column at night.
During the bloom period, Peridinium standing stocktypically exceeds 180 g wet wt m–2, but by early to midsummer it falls below 30 g wet wt m–2 (Pollingher, 1986;Pollingher and Hickel, 1991). Causes for the bloom crashwere proposed to be N and P limitation, high solarradiation (Häder et al., 1990), elevated temperature(Berman and Dubinsky, 1985), high turbulence(Pollingher and Zemel, 1981) and CO2 limitation(Berman-Frank et al., 1994). A 5-year study of dinoflagel-late bloom dynamics and sedimentation (Zohary et al.,1998) suggested that sedimentation was not a major causefor the bloom decline but rather a secondary process thatenhances the elimination from the water column of apopulation handicapped by a combination of otherfactors. The objective of this study was to carry theinvestigation one step further and measure the in situ vari-ables of dinoflagellate dynamics in population parametersfor Lake Kinneret. Here we present the results of a 2-yearstudy that was based on analysis of short-term (24 h)sediment trap data. Short-term deployment of sedimenttraps minimized within-trap decomposition losses andenabled us to follow the temporal dynamics of growthand death rates of the dinoflagellate populations.
M E T H O D
Field work was conducted throughout 1994 and 1995 ata central station (A) that is situated at the deepest part ofLake Kinneret (~43 m). Sampling was conducted alwaysbetween 08:00 and 11:00. Depth profiles of watertemperature and dissolved oxygen concentration wererecorded biweekly with a profiling thermistor (ModelSTD-12; Applied Microsystems Ltd, Sidney, Canada) anda YSI model 58 dissolved oxygen meter. Thermoclinedepth was defined as the depth >10 m at which thetemperature over 1 m gradient exceeds 0.3°C (Hambrightet al., 1994). The water column abundance of Peridinium
and of Peridiniopsis spp. (treated as one group) wererecorded weekly from depth integrated (0–7 m) watersamples collected with an integrating water sampler (typeHy 72; Zullig Ltd, Rheineck, Swizerland) and preservedwith formaldehyde (2% final concentration). From depthdistribution studies (Pollingher and Hickel, 1991) weknow that during the daytime most dinoflagellate cells arecontained within these upper 7 m. Live cells, dead cells,
cysts (resting forms), thecae and naked protoplasts(Figure 1) of all dinoflagellates in the sample were countedusing the inverted microscope technique (Utermöhl,1958). Dead cells are distinguished from live cells by thecontracted protoplast (it does not fully occupy the theca)(Figure 1). Cell counts were converted to wet weightbiomass by measuring the linear dimensions, applyingappropriate geometric shapes and assuming a specificdensity of 1 g cm–3 (Hillebrand et al., 1999). The watercolumn biomass (in g wet wt m–2) for the upper 7 m wasobtained by multiplying the volumetric concentration (ing wet wt m–3) values by 7 m.
Sedimentation rates were estimated from algalaccumulation in sediment traps with and withoutformaldehyde, which were deployed for 24 ± 2 h at2–3-week intervals throughout 1994 and 1995. Two setsof positively buoyant traps, each consisting of fouropaque PVC cylinders (5.3 cm internal diameter; openingsurface area 2206 mm2; 60 cm length; aspect ratio of11.3) adapted with replaceable 300 ml screw-cap jars attheir bottom end, were deployed one above the other ona tight cable at station A (Viner et al., 1998). The lowertrap was placed at 35 m (hypolimnion), the upper trap wasplaced near the base of the epilimnion at a depth varyingfrom 15 to 25 m, depending on the depth of the thermo-cline. A dialysis bag containing 10 ml of concentratedformaldehyde and a glass-bead weight was placed in twoof the four jars in each trap. The traps were retrieved after24 h exposure, during the morning hours. At that time ofthe day dinoflagellates have already migrated up to thesurface layers thus we reduced the probability of catchingcells that reached the traps by active migration and not bypassive sinking. The material collected in the replaceablejars was fixed with 2% formaldehyde (final concen-tration). Cell count and biomass estimates were made asdetailed for the water column samples. Sedimentationrates (g wet wt m –2 day–1) were obtained by division of theaccumulated biomass (g wet wt m–3) by the duration oftrap deployment.
Preliminary experiments were conducted to assesswhether there is an overestimation of Peridinium sedimen-tation into traps filled with ambient water at the time oftrap deployment. Prior to deployment, half of the jarsand cylinders in each trap were filled with ambient lakewater, the rest with prefiltered (GF/C) Kinneret water.After 24 h incubation the traps were retrieved and thewater in the jars was used to determine the chlorophyllcontent of the whole water and of water passing througha 20 µm mesh [after (Holm-Hansen et al., 1965)]. Thechlorophyll attributed to Peridinium was calculated bysubtraction of the chlorophyll value of the <20 µmfraction from that of the whole sample chlorophyll. Apaired t-test showed no significant differences between the
JOURNAL OF PLANKTON RESEARCH VOLUME NUMBER PAGES ‒
02 viner-mozzini (fbg039)(ds) 5/14/03 12:01 PM Page 592

Y. VINER-MOZZINI ET AL. PERIDINIUM BLOOM DEVELOPMENT IN LAKE KINNERET
Fig. 1. Microscope photos of P. gatunense NYGAARD (A–G; I–K) and Peridiniopsis spp. (A) Live cells. (B) Live (upper) and dead (lower) cells.(C) A live cell (left) and an empty theca (right). (D) Cell division, showing how prior to the formation of two daughter cells the theca breaks openand constriction develops in the middle of the protoplast. (E) Dead cell, with protoplast bursting out of the theca. (F, G) Cell shedding its thecaduring cyst formation. (H) Peridiniopsis cysts (50 µm size bar applies to A–I). (I) Decomposed P. gatunense cells. (J, K) P. gatunense cells grazed by theciliate Bursaria truncatella (100 µm size bar applies to J and K).
02 viner-mozzini (fbg039)(ds) 5/14/03 12:01 PM Page 593
two treatments (P > 0.05, n = 9, t = 0.4). Our explanationis that during the 24-h exposure live dinoflagellates in theambient water that were trapped during the trap fillingprocedure migrated upwards to a depth of optimalconditions. Therefore, the error introduced by filling ofthe traps with lake water is insignificant.
In an earlier study (Viner et al., 1998) we showed thatsedimentation rates of vertically migrating dinoflagellatesmeasured by means of sediment traps containing apreservative were subject to severe overestimation of thevertical flux for live cells. The number of Peridinium andPeridiniopsis live cells trapped over a 24-h period informaldehyde-containing (F+) traps was often 5–10-foldgreater than in traps without formaldehyde (F–) traps.Such differences between catches in F+ and F– traps werenot observed for dead matter (e.g. thecae) of both dino-flagellate genera (catch ratios of F+ to F– being close to1) in both upper and lower traps. The high catches of livecells in F+ traps was explained by the daily vertical migra-tion behaviour of these dinoflagellates (Zohary et al.,1998). The similarity between F+ and F– traps in catchesof dead material implies that during the 24 h exposureperiod within-trap decomposition and grazing of Peri-
dinium and Peridiniopsis were minor. In view of thesefindings calculations of sedimentation rates of live cells ofPeridinium and Peridiniopsis were made using the cell countsfrom the F– traps, while sedimentation rates of dead cells,thecae and protoplasts were computed using cell countsfrom the F+ traps. These values are reported in theFigures, with the exception of an unusual event in thesummer when live cells were caught in large numbers inF+ traps, at a time when they appeared to be absent inthe water column.
Sinking velocities (m day–1) of Peridinium and Peridiniopsis
were computed by dividing the sedimentation rates (g wetwt m–2 day–1) by the average water column biomassconcentration (g wet wt m–3) as described previously(Hargrave and Burns, 1979). Population dynamics vari-ables, in day–1 units, were calculated from the water columnand upper sediment trap cell counts, assuming that thepotential growth rate, µ, is equal to the sum of the apparentgrowth rate, k, plus the losses, according to the equation:
� = k + � + � + �. (1)
where � is the death rate, � is the sedimentation rate and� is the grazing rate (Sommer, 1984a,b). The equationwas further simplified assuming that grazing losses of Peri-
dinium were negligible (Serruya et al., 1980), i.e. � = 0.Apparent growth rates (k), were calculated as:
ln lnk
t tN N
2 1
2 1=
--
(2)
where N1 and N2 are the 5-week running averages of Peri-
dinium cell numbers per m2 of the upper 0–7 m watercolumn at times t1 and t2. Running averages were used toreduce the effect of horizontal patchiness (Berman andRhode, 1971). Population dynamics variables were calcu-lated separately for the growth and decline phases of thebloom.
N e
N k
1�
( )k t t
s
12 1
#=
--` j(3)
where Ns is the number of live Peridinium cells per m2
accumulated in the sediment traps without formaldehydebetween t1 and t2.
The death rate was calculated as:
N e
N k
1�
( )k t t
d
12 1
#=
--` j(4)
where Nd is the number of dead cells and protoplasts perm2, based on the numbers accumulated in the formalde-hyde-containing traps. The maximum potential standingcrop of Peridinium, which would have been developed inthe water column during the bloom ( January–July) if lossprocesses were not taking place, was calculated by replac-ing k with µ in equation (2) and solving for N2 to give:
N N e ( )t t2 1
2 1= -n (5)
Finally, we converted N2 from cells ml–1 to biomass (g wetwt m–2), and added the biomass of thecae that were shedduring cell division [1 theca per division, thecal biomass~30% of live cell biomass; (Zohary et al., 1998)]. The sumwas assumed to represent the annual Peridinium produc-tion.
The total biomass of Peridinium and Peridiniopsis lost bysedimentation was computed as the sum of empty thecae+ dead cells + naked protoplasts. The flux of live cells intothe traps was considered mostly as an artefact and notincluded in the calculation of the total biomass lost bysedimentation (see Discussion). Daily sedimentationfluxes were time-integrated to give annual sedimentationrates (g wet wt m–2 year–1). The fraction of Peridinium
production lost annually via sedimentation was estimatedas the ratio between the annual sedimentation and annualPeridinium production.
The parameters of population dynamics of Peridiniop-
sis could not be calculated because the group Peridiniop-
sis consisted of a number of species, each one with itsown rate of increase and decline. Moreover, asmentioned earlier the basic assumption underlying thecalculation of µ is that grazing losses are negligible, andthis is not true for Peridiniopsis spp. in Lake Kinneret(Zohary et al., 1994).
JOURNAL OF PLANKTON RESEARCH VOLUME NUMBER PAGES ‒
02 viner-mozzini (fbg039)(ds) 5/14/03 12:01 PM Page 594

R E S U LT S
The physical chemical environment
In 1994, mixing was completed by the end of January andholomixis was maintained for ~2.5 months until mid-April. Water temperature ranged from 14°C duringmixing to 29°C at the surface in September (Figure 2). In1995 holomixis started a month earlier than in 1994,already in late-December, and was maintained for~2.5 months, until mid-March. The temperature rangedfrom 16°C during mixing to 28°C at the water surfaceduring August–September (Figure 2). Following the onsetof the stratification oxygen was rapidly depleted in thehypolimnion and by May the entire hypolimnion becameanoxic (Figure 2).
Water column biomass and sedimentation
Peridinium gatunense
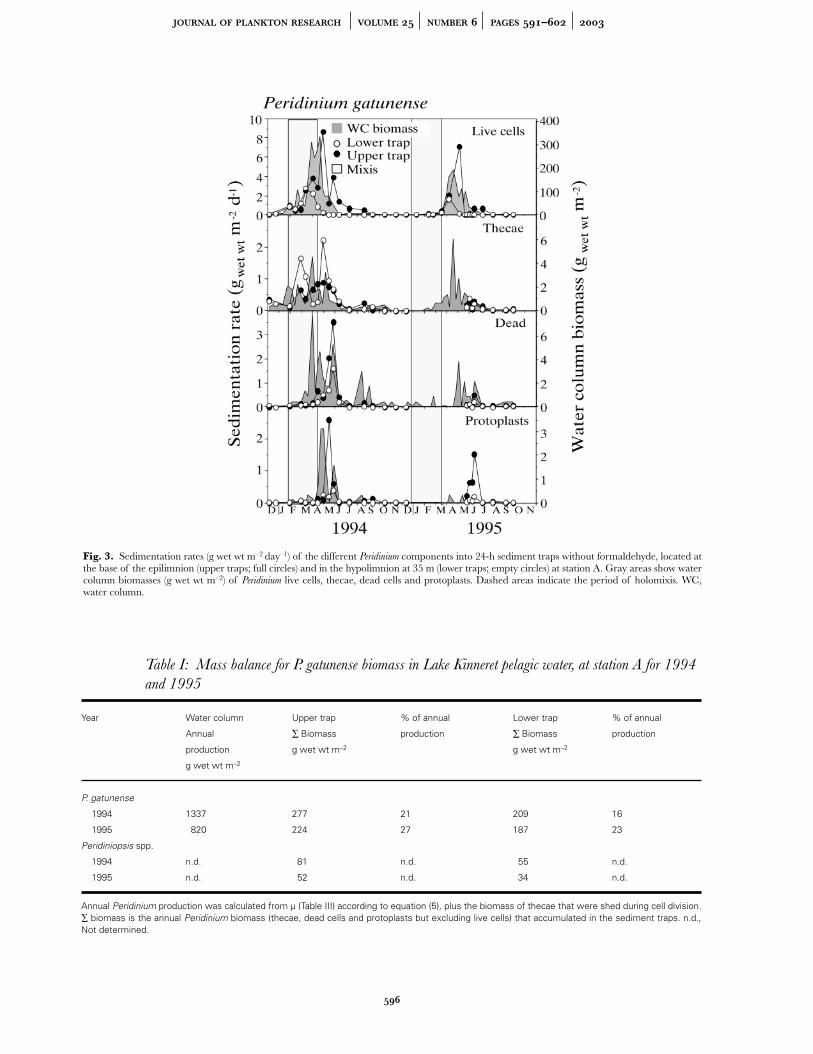
In 1994, Peridinium appeared in the water column in rela-tively high biomass already in January (24 g wet wt m–2),peaked in late April after stratification had started (333 gwet wt m–2), and sharply declined in mid-May (Figure 3).
In 1995 the bloom started to develop relatively late in theyear (March), peaked in late April at the onset of thermalstratification (190 g wet wt m–2) and then graduallydeclined (Figure 3). Empty thecae appeared in the watercolumn throughout the bloom, while dead cells andprotoplasts appeared in the water column in relativelyhigh biomass only in March–May during the bloom peakand decline phases (Figure 3). The biomass of the non-living parts of Peridinium in the water column was lowerthan that of the live cells by about two orders of magni-tude (Figure 3).
Catches of Peridinium live cells and dead matter in thesediment traps tracked the bloom development in thewater column in both years (Figure 3). Trap catches in1994 were generally higher than in 1995, in accordancewith the higher water column biomass in 1994. Theannual sedimentation losses of Peridinium (dead matteronly) in the upper traps was 277 g wet wt m–2 in 1994 and224 g wet wt m–2 in 1995. The values for the lower trapswere 209 g wet wt m–2 in 1994 and 187 g wet wt m–2 in1995 (Table I).
In the upper traps, sedimentation rates of Peridinium livecells (F– treatments) increased in March, peaked in Apriland declined in May, coinciding with the disappearanceof Peridinium live cells from the water column. Thecae (inthe F+ treatments) were trapped throughout the bloomand in 1994 reached a peak during the time of the bloomdecline. Sedimentation rates of dead cells and protoplastswere low to negligible during the phase of increase of thebloom and then sharply peaked after the bloom ended inMay–June of both years (Figure 3). In the lower(hypolimnic) traps the sedimentation rate of Peridinium livecells was generally lower (approximately four times) thanin the upper (epilimnetic) traps (Figure 3). Sedimentationrates of Peridinium thecae, dead cells and protoplasts weresimilar in pattern to those observed in the upper traps.
Peridinium biomass trapped within the epilimnion wascomposed mainly of live cells (53–65%). In contrast, thebiomass trapped in the hypolimnion was mainly(58–80%) dead matter (thecae, protoplasts and deadcells).
Peridiniopsis spp.
In the water column, Peridiniopsis biomass was generallylower by an order of magnitude than Peridinium biomassbecause of smaller cell size and lower cell numbers. Peri-
diniopsis biomass in the water column peaked in May–Juneafter the peak of the Peridinium bloom, and declined inJune of both years (Figure 4).
Sedimentation rates of Peridiniopsis were also muchlower than those of Peridinium (Figure 4). The highest sedi-mentation rate for live Peridiniopsis cells in the epilimnion(~35 g wet wt m–2 day–1) was observed in August 1994
Y. VINER-MOZZINI ET AL. PERIDINIUM BLOOM DEVELOPMENT IN LAKE KINNERET
Fig. 2. Changes with time and depth in temperature (°C; left) anddissolved oxygen (mg l–1; right) at station A, 1994–1995.
02 viner-mozzini (fbg039)(ds) 5/14/03 12:01 PM Page 595
JOURNAL OF PLANKTON RESEARCH VOLUME NUMBER PAGES ‒
Fig. 3. Sedimentation rates (g wet wt m–2 day–1) of the different Peridinium components into 24-h sediment traps without formaldehyde, located atthe base of the epilimnion (upper traps; full circles) and in the hypolimnion at 35 m (lower traps; empty circles) at station A. Gray areas show watercolumn biomasses (g wet wt m–2) of Peridinium live cells, thecae, dead cells and protoplasts. Dashed areas indicate the period of holomixis. WC,water column.
Table I: Mass balance for P. gatunense biomass in Lake Kinneret pelagic water, at station A for 1994
and 1995
Year Water column Upper trap % of annual Lower trap % of annual
Annual ∑ Biomass production ∑ Biomass production
production g wet wt m–2 g wet wt m–2
g wet wt m–2
P. gatunense
1994 1337 277 21 209 16
1995 820 224 27 187 23
Peridiniopsis spp.
1994 n.d. 81 n.d. 55 n.d.
1995 n.d. 52 n.d. 34 n.d.
Annual Peridinium production was calculated from µ (Table III) according to equation (5), plus the biomass of thecae that were shed during cell division.∑ biomass is the annual Peridinium biomass (thecae, dead cells and protoplasts but excluding live cells) that accumulated in the sediment traps. n.d.,Not determined.
02 viner-mozzini (fbg039)(ds) 5/14/03 12:01 PM Page 596

and in July 1995. The sedimentation rates of Peridiniopsis
thecae and dead cells peaked in August–September ofboth years, whereas the sedimentation rates of the proto-plasts peaked in May (Figure 4). The sedimentation ratesin the hypolimnion were comparable with or higher thanthose recorded in the epilimnion and peaked in May ofboth years (Figure 4).
The annual sedimentation losses of Peridiniopsis (deadmatter only) in the upper traps was 81 g wet wt m–2 in1994 and 52 g wet wt m–2 in 1995. The values for thelower traps were 55 g wet wt m–2 in 1994 and 34 g wet wtm–2 in 1995.
Sinking velocities
The annual mean sinking velocities (m day–1) for the dino-flagellates at each depth and year are summarized inTable II. Relatively high sinking velocities were observedfor Peridinium thecae (1.2–8.3 m day–1), protoplasts(1.6–9.1 m day–1, not shown) and dead cells (0.5–4.4 mday–1). The sinking velocities calculated for Peridinium livecells were consistently lower (0.03–0.2 m day–1) and
practically no different from zero, as expected for motileorganisms that can regulate their position in the watercolumn.
For Peridiniopsis, a similar picture emerged: high sinkingvelocities were calculated for the thecae (1.7–4.8 m day–1)and dead cells (0.1–4.3 m day–1), whereas the sinkingvelocities for live cells were close to zero (0.04–0.1 mday–1) (Table II).
Population dynamics of Peridinium
The calculated net growth rate (k) of Peridinium during thebloom development phase was 0.04 day–1 in 1994 and0.08 day–1 in 1995. During the decline phase of bothyears this value was negative, –0.04 day–1 (Table III). Thepotential maximum growth rate (µ) of Peridinium was0.06–0.1 day–1 during the bloom development phase anddeclined to 0.02 day–1 during the decline phase. Thedeath rate (�) was negligible (0.001 day–1) during thebloom development phase but was 20-fold higher (0.02day–1) during the decline phase.
Y. VINER-MOZZINI ET AL. PERIDINIUM BLOOM DEVELOPMENT IN LAKE KINNERET
Fig. 4. Same as Figure 3 for Peridiniopsis spp.
02 viner-mozzini (fbg039)(ds) 5/14/03 12:01 PM Page 597

Biomass balance for Peridinium
Only 20–30% of the total Peridinium biomass produced inthe water column at the deepest part of the lake (stationA) reached the epilimnic trap as recognizable Peridinium
matter (Table I). The proportion reaching the hypolimnictraps was somewhat lower (15–25%).
D I S C U S S I O N
Shortening the collection periods of sediment traps (to24 h in our case) without preservative reduces the magni-tude of some of the problems associated with use ofsediment traps, like decomposition inside the traps or over-estimation of sedimentation rates of motile plankton. Thepercentage of Peridinium production lost via sedimentation
JOURNAL OF PLANKTON RESEARCH VOLUME NUMBER PAGES ‒
Table II: Annual mean sinking velocities ±SD and number of observations of P. gatunense and
Peridiniopsis spp. components at station A in Lake Kinneret, 1994 and 1995
Year Trap Annual mean sinking velocities (m day–1)
Dead cells Thecae Live cells
P. gatunense
1994 Upper 4.4 ± 3.73 5.02 ± 4.1 0.24 ± 0.24
(9) (13) (9)
1994 Lower 2.74 ± 3.37 8.3 ± 8.57 0.1 ± 0.15
(10) (11) (10)
1995 Upper 1.08 ± 1.62 1.69 ± 1.17 0.12 ± 0.12
(5) (7) (13)
1995 Lower 0.45 ± 0.6 1.16 ± 0.71 0.03 ± 0.06
(5) (7) (10)
Peridiniopsis spp.
1994 Upper 4.25 ± 3.64 3.63 ± 1.9 0.054 ± 0.062
(3) (14) (13)
1994 Lower 3.4 ± 5.36 4.8 ± 5.78 0.07 ± 0.08
(7) (14) (11)
1995 Upper 3.3 ± 3.26 0.07 ± 0.08
(8) (12)
1995 Lower 0.1 ± 0.05 1.7 ± 0.85 0.04 ± 0.06
(3) (8) (9)
Calculations for live cells were based on cell counts in traps without preservative and for dead matter on cell counts in traps containing a preservative.
Table III: Population dynamics parameters (growth and loss rate coefficients; units: day–1) for
P. gatunense
Year Bloom phase k � � �
1994 Growth 0.04 0.02 0.0009 0.06
Decline –0.04 0.04 0.02 0.02
1995 Growth 0.08 0.02 0.001 0.1
Decline –0.04 0.04 0.02 0.02
Data from Lake Kinneret at station A, computed from the water column and upper sediment trap cell counts data, using equations used by Sommer(Sommer, 1984a) k = � – � – δ and assuming that grazing losses are negligible.
02 viner-mozzini (fbg039)(ds) 5/14/03 12:01 PM Page 598

in 1994, calculated from 24 h trap data (this study) wastwice as high as that calculated from 2-week trap data forthe same year (Zohary et al., 1998). This difference isattributed to the relatively high within-trap decompositionrates (~55% per day) reported by Zohary et al. to occurinside their 2-week traps.
The sinking velocity of live Peridinium and Peridiniopsis
cells was not more than a few cm per day (Table II), notsurprising for motile organisms. In a 40 m water column,this is practically a negligible rate, which implies thatpassive sinking cannot explain the presence of live cells intraps located at 15 and 35 m depth after 24 h exposure.This led us to conclude that the sedimentation rates of livecells we observed (Figures 3 and 4) were overestimated.Healthy motile cells are able to compensate for gravi-tational sinking, moreover, dinoflagellates migrate up anddown the water column and thus passive sedimentationmay be masked by migration in and out of the trapswithout fixative. Furthermore the migration behaviour ofthe cells may be disturbed when caught in the traps andinterfere with the estimation of the net downwardsbiomass flux. For that reason in our mass balance for Peri-
dinium (Table I) we considered sedimentation rates of livedinoflagellate cells to be zero, although we know it is anunderestimation that does not take into account sedi-mentation of senescent cells or cells that lost their flagella.
In contrast to reports by others (Sommer, 1984a;Heiskanen and Konnonen, 1994; Heiskanen, 1995a,b),our findings in Lake Kinneret show that the sedimen-
tation rates of Peridinium and its remains, except for theca,are generally higher in the epilimnion than in thehypolimnion (Figure 3). This might be related to the exist-ence of a sharp thermocline and to the development ofan oxycline towards the peak of the bloom. The highestsedimentation rate for live Peridinium cells in the deepertraps was observed before the lake stratified, in March1994. After the onset of thermal stratification the biomassof live Peridinium cells that reached the hypolimnion waslow (0.9 g wet wt m–2 day–1) although the bloom in thewater column was at its peak (Figure 3). On the otherhand, in the epilimnion the highest sedimentation rate oflive cells was recorded after the onset of thermal stratifi-cation, and coinciding with the peak of the bloom in thewater column. Our conclusion is that after the onset ofthe thermal stratification live Peridinium cells are mostlycontained in the epilimnion and do not swim below thethermocline, avoiding anoxic conditions. This behaviouris also typical of the dinoflagellate Ceratium hirundinella thatusually does not penetrate the anoxic hypolimnion (Harriset al., 1979).
We support the findings of Pollingher and Berman(Pollingher and Berman, 1975) that stratification of dino-flagellates starts before the onset of thermal and chemicalstratification in the lake. Contrary to the statement bySerruya et al. (Serruya et al., 1980) we suggest that the thermocline per se is not a physical barrier for activelyswimming Peridinium cells, it is the lack of oxygen thatconstitutes a barrier. Other dinoflagellate species havebeen shown to cross temperature gradients of more than7°C (Kamykowski, 1981), and the dinoflagellate Gonyaulax
tamarensis can cross a pycnocline (Rasmussen andRichardson, 1989). The absence of a physical barrier issupported also by the penetration of Peridinium thecae,dead cells and protoplasts into the hypolimnion after theonset of thermal stratification (Figure 3). The somewhatlower sedimentation rates and sinking velocities of Peri-
dinium dead cells and protoplasts in the hypolimnioncompared with that in the epilimnion may be attributedto decomposition and grazing in the water column, whichreduces the amount of material reaching the lower traps.
Grazing losses to Peridinium by mesozooplankton andfish are reported to be low (Serruya et al., 1980; Zoharyet al., 1994). These studies did not quantify grazingpressure by micrograzers (protozoans). In the hundreds ofmicroscope samples examined during our 2 year study werarely witnessed grazing by micrograzers on Peridinium.An exception occurred during the bloom decline phasewhen the ciliate Bursaria truncatella, which prior to thisperiod was absent, appeared in the water column. Thisciliate is known to feed on Peridinium cells (Pollingher,1987), and indeed was observed actively grazing on Peri-
dinium (Figure 1). We do not know whether this ciliate
Y. VINER-MOZZINI ET AL. PERIDINIUM BLOOM DEVELOPMENT IN LAKE KINNERET
Fig. 5. The mean (± SD) F+/F– ratio for trap catches of Peridinium livecells and thecae and of Peridiniopsis thecae. Data shown are based oncases when at least 50 cells or thecae were counted in both F+ and F–traps. Upper traps (up) were placed at 15 m (epilimnion), lower traps(low) were placed at 35 m (hypolimnion) at the deep station. The hori-zontal dashed line at F+/F– = 1 indicates no difference betweenformaldehyde-containing and formaldehyde-free traps.
02 viner-mozzini (fbg039)(ds) 5/14/03 12:01 PM Page 599

consumes live cells or dead cells or both, but our obser-vations suggest that the effect of this grazing pressure islimited temporally and to the removal of cells alreadydestined to die.
The potential growth rate for Peridinium during thedecline phase is three to five times lower than during thephase of population increase. Nevertheless, µ is positiveduring the decline phase, indicating that cell division stilloccurs despite the intensive loss processes. We calculatedµ using � values that are higher than zero although weknow they result in overestimation. This is justifiedconsidering that when � is nullified the annual Peridinium
production that is calculated from µ is underestimatedand the proportion of Peridinium production sedimentinginto the traps is more than 100%. The death rate (�)during the decline phase is higher than during the growthphase by more than one order of magnitude. Thisincrease in death rate shifts the balance from a netincrease to a net decline of the population and leads us toconclude that increased death rate, possibly prepro-grammed (Vardi et al., 1999), is a major cause for thebloom crash. The cellular processes which lead to therapid death of Peridinium at the end of the bloom in LakeKinneret are still unknown, but they are apparently acti-vated by the changes in environmental conditions in thelake, especially CO2 depletion (Berman-Frank et al., 1994;Vardi et al., 1999).
Serruya et al. (Serruya et al., 1980) suggested that anearly onset of the Peridinium bloom and a long mixingperiod would increase the percentage of total Peridinium
biomass that sinks to the hypolimnion. According to thishypothesis, we would have expected that a greater propor-tion of the bloom biomass would reach the hypolimnionin 1994 than in 1995, because in 1994 the bloom startedto develop during holomixis, while in 1995 the bloomstarted to develop only after the lake stratified. Instead, wefound the opposite: a greater proportion of the bloombiomass reached the lower traps in 1995 than in 1994(Table I). We conclude that other factors must have had agreater influence on the amount of Peridinium biomassreaching the bottom traps.
Based on the C, N and P content of Peridinium remains(Zohary et al., 1998), and wet weight to dry weightconversion factor of 2.5 (Berman, 1978), we roughly esti-mated the annual sedimentation rates of C, N and P (gm–2 year–1) to the upper and lower traps at station A (livecells were excluded). The sedimentation rates for C, Nand P into the upper traps were 43–53, 3.2–4.4 and0.17–0.24 g m–2 year–1and to the lower traps 36–38,2.6–4.9 and 0.14–0.25 g m–2 year–1, respectively. Based onoverall yearly sedimentation rates for total particulatematter of ~1400 g m–2 and for organic matter of ~300 gm–2 (Klein and Koren, 1998; Koren and Klein, 2000), we
estimated that during the study period Peridinium
contributed annually ~5–10% of the total sedimentationand 20–35% of the organic matter sedimentation to bothepilimnion and hypolimnion. It should, however, be notedthat Klein and Koren used traps without a preservativefor 2–3-week exposure periods and their sedimentationrates are likely to be underestimated due to within-trapdecomposition. The implication is that our estimates ofthe % of total sedimentation are overestimated.
Our results demonstrated that 15–25% of Peridinium
production sedimented in 1994 and 1995 as microscopi-cally recognizable matter of Peridinium origin. Those esti-mates are higher than those obtained for 1994 by Zoharyet al. (Zohary et al., 1998) using sediment traps with 2-weekcollection periods, but they still show that only a smallpercentage of the bloom biomass is lost from the watercolumn via sedimentation. With grazing being only aminor loss process for Peridinium, it is likely that the mainfate of the bloom is decomposition. Experimental workby Zohary et al. (Zohary et al., 2000a,b) suggested thatdead Peridinium cells decompose rapidly, such that within1–3 days 50% of the biomass is lost. Decomposition rateswere similar under aerobic and anaerobic conditions. Inparticular the thecae, which are C-rich and N and Pdepleted, disappeared first but their decomposition couldnot proceed under nutrient limitation. Our sediment trapresults, based on microscope counts of recognizable Peri-
dinium cells, do not rule out the possibility that much ofthe dinoflagellate biomass settles slowly as amorphousphytodetrital matter that can no longer be recognized asPeridinium or Peridiniopsis. A similar fate was proposed byHeiskanen (Heiskanen, 1995b) to be dominant for dino-flagellate blooms in the Baltic Sea.
While the knowledge base regarding P. gatunense in LakeKinneret is intensive, much less is known to date about thefour or five species of the genus Peridiniopsis that are alsoa prominent component of the Kinneret phytoplankton(Pollingher and Hickel, 1991). Since the completion ofthis study, the abundance and relative importance of Peri-
diniopsis spp. in Lake Kinneret has increased especially inthe years 1996, 1997, 2000 and 2001, when Peridinium
failed to bloom (T. Zohary, unpublished data).In this study we learnt that, in contrast to live Peridinium
cells, Peridiniopsis cells continued to swim to the lower trapafter the onset of thermal stratification, possibly takingadvantage of the higher nutrient concentrations belowthe thermocline, at a time when the lake is already strat-ified and the epilimnion is nutrient depleted (Bermanet al., 1992). This could be an important factor allowingPeridiniopsis spp. to peak after the decline of Peridinium.
However, Peridiniopsis spp. never reached cell concen-trations as high as those obtained by Peridinium [Figures 3and 4 (Pollingher and Hickel, 1991)], implying that either
JOURNAL OF PLANKTON RESEARCH VOLUME NUMBER PAGES ‒
02 viner-mozzini (fbg039)(ds) 5/14/03 12:01 PM Page 600
the growth rates of Peridiniopsis are low, or that its lossprocesses are relatively high, or both. We also know fromthis study that sedimentation losses of Peridiniopsis normal-ized per unit biomass of the standing stock (or in fact, thesinking velocities) are low (Table II). Thus, sedimentationis not a major factor removing Peridiniopsis biomass fromthe epilimnion. We conclude that Peridiniopsis spp. areprobably subjected to higher grazing pressure relative toPeridinium. Zohary et al. (Zohary et al., 1994) also stronglysuggested that during the Peridinium bloom decline phasein Lake Kinneret the smaller dinoflagellates are animportant food source for zooplankton. Although Peridin-
iopsis spp. never reached cell concentrations as high asthose obtained by Peridinium the number of Peridiniopsis
resting cysts was higher than for Peridinium (data notshown). These observations highlight different ecologicalroles in the same lake of two taxonomically close genera.
AC K N OW L E D G E M E N T S
This project was carried out as part of Y.V.-M.’s M.Scthesis. We thank U. Pollingher for supervision of the dino-flagellate counts, M. Hatab, N. Koren, J. Graham, A.Mindel and B. Avraham for assistance with the field work,K. D. Hambright and P. Wassmann for constructive criti-cism of an early draft. This project was funded by theGerman Federal Ministry of Education, Science,Research, and Technology (BMBF) and the IsraeliMinistry of Science (MOS) under the aegis of KFA-BEO-Forschungszentrum Jülich GmbH grant 01310. A scholar-ship to Y. V.-M. was provided by Tel Aviv University.
R E F E R E N C E SBerman, T. (1978) General biochemical features. In Serruya, C. (ed.),
Lake Kinneret Monographiae Biologicae. Dr W. Junk Publishers, TheHague, pp. 269–270.
Berman, T. and Rodhe, W. (1971) Distribution and migration of Peri-
dinium in Lake Kinneret. Mitt. Int. Ver. Limnol., 19, 266–276.
Berman, T. and Dubinsky, Z. (1985) The autecology of Peridinium cinctum
fa. westii from Lake Kinneret. Verh. Int. Ver. Limnol., 22, 2850–2854.
Berman, T., Yacobi, Y. Z. and Pollingher, U. (1992) Lake Kinneretphytoplankton: stability and variability during twenty years(1970–1989). Aquatic Sci., 54, 104–127.
Berman-Frank, I., Zohary, T., Erez, J. and Dubinsky, Z. (1994) CO2
availability, carbonic anhydrase, and the annual dinoflagellate bloomin Lake Kinneret. Limnol. Oceanogr., 39, 1822–1834.
Häder, D. P., Shi-Mei, L., Häder, M. and Ullrich, W. (1990) Photo-orien-tation, motility and pigmentation in a freshwater Peridinium affectedby ultraviolet radiation. Gen. Physiol. Biophys., 9, 361–371.
Hadas, O. and Pinkas, R. (1992) Sulfate-reduction process in sedimentsof Lake Kinneret, Israel. Hydrobiologia, 235, 295–301.
Hambright, K. D., Gophen, M. and Serruya, S. (1994) Influence oflong-term climatic changes on the thermal dynamics of a subtropi-cal, warm monomictic lake. Limnol. Oceanogr., 39, 1234–1243.
Hargrave, B. T. and Burns, N. M. (1979) Assessment of sediment trapcollection efficiency. Limnol. Oceanogr., 24, 1124–1136.
Harris, G. P., Heany, S. I. and Talling, J. F. (1979) Physiological andenvironmental constraints in the ecology of the planktonic dino-flagellate Ceratium hirundinella. Freshwater Biol., 6, 531–542.
Heiskanen, A. S. (1995a) Contamination of sediment trap fluxes byvertically migrating phototrophic micro-organisms in the coastalBaltic Sea. Mar. Ecol. Prog. Ser., 122, 45–58.
Heiskanen, A. S. (1995b) Impact of dinoflagellates on the flux of organicmatter collected by sediment traps in the gulf of Finland (Baltic Sea).In Floderus, S., Heiskanen, A. S., Olesen, M. and Wassmann, P. (eds),Sediment Trap Studies in the Nordic Countries. Yliopistopaino, Helsinki,pp. 153–167.
Heiskanen, A. S. and Konnonen, K. (1994) Sedimentation of vernal andlate summer phytoplankton communities in the coastal Baltic Sea.Arch. Hydrobiol., 131, 175–198.
Hickel, B. and Pollingher, U. (1988) Identification of the bloom-formingPeridinium from Lake Kinneret (Israel) as P. gatunense (Dinophyceae). Br.
Phycol. J., 23, 115–119.
Hillebrand, H., Dürselen, C. D., Kirschtel, D., Pollingher, U. andZohary, T. (1999) The calculation of biovolume of pelagic andbenthic microalgae. J. Phycol., 35, 403–424.
Holm-Hansen, O., Lorenzen, C. J., Holmes, R. W. and Strickland, D.H. (1965) Fluorometric determination of chlorophyll. J. Cons. Int.
Explor. Mer., 30, 3–15.
Kamykowski, D. (1981) Laboratory experiments on the diurnal verticalmigration of marine dinoflagellates through temperature gradients.Mar. Biol., 62, 57–64.
Klein, M. and Koren, N. (1998) The influence of the thermocline onsedimentation the deeper part of Lake Kinneret, Israel. Limnologica,28, 293–299.
Koren, N. and Klein, M. (2000) Rate of sedimentation in LakeKinneret, Israel: spatial and temporal variations. Earth Surf. Proc. Land-
forms, 25, 895–904.
Pollingher, U. (1986) Phytoplankton periodicity in a subtropical lake(Lake Kinneret, Israel). Hydrobiologia, 138, 127–138.
Pollingher, U. (1987) Freshwater ecosystems. In Taylor, F. J. R. (ed.), The
Biology of Dinoflagellates. Botanical monograph. 21, Blackwell Scientific,Oxford, pp. 502–529.
Pollingher, U. and Berman T. (1975) Temporal and spatial patterns ofdinoflagellate blooms in Lake Kinneret, Israel (1969–1974). Verh. Int.
Ver. Limnol., 19, 1370–1382.
Pollingher, U. and Zemel, E. (1981) In situ and experimental evidence ofthe influence of turbulence on cell division processes of Peridinium
cinctum forma westii (Lemm) Lefevre. Br. Phycol. J., 16, 281–287.
Pollingher, U. and Hickel, B. (1991) Dinoflagellate associations in asubtropical lake (Lake Kinneret, Israel). Arch. Hydrobiol., 120,267–285.
Rasmussen, J. and Richardson, K. (1989) Response of Gonyaulax tamaren-
sis to the presence of pycnocline in an artificial water column. J.
Plankton Res., 11, 747–762.
Serruya, C., Gophen, M. and Pollingher, U. (1980) Lake Kinneret:carbon flow patterns and ecosystem management. Arch. Hydrobiol., 88,265–302.
Sommer, U. (1984a) Sedimentation of principal phytoplankton speciesin Lake Constance. J. Plankton. Res., 6, 1–14.
Sommer, U. (1984b) Population dynamics of three planktonic diatomsin lake Constance. Holarct. Ecol., 7, 257–261.
Y. VINER-MOZZINI ET AL. PERIDINIUM BLOOM DEVELOPMENT IN LAKE KINNERET
02 viner-mozzini (fbg039)(ds) 5/14/03 12:01 PM Page 601

Utermöhl, H. (1958) Zur Vervollkommnung der quantitativen Phyto-planktonmethodik. Mitt. Int. Ver. Limnol., 9, 1–38.
Vardi, A., Berman-Frank, I., Rozenberg, T., Hadas, O., Kaplan, A. andLevine, A. (1999) Programmed cell death of the dinoflagellate Peri-
dinium gatunense is mediated by CO2 limitation and oxidative stress.Curr. Biol., 9, 1061–1064.
Viner, Y., Zohary, T. and Gasith, A. (1998) Dinoflagellate sedimentationfollowed by sediment traps with short (24 h) collection periods: shoulda preservative be used? In Heiskanen, A. S., Lundsgaard, C.,Reigstadt, M., Floderus, S. and Olli, K. (eds), Sedimentation and Recy-
cling in Aquatic Ecosystems – the Impact of Pelagic Processes and Planktonic
Food Web Structure. Proceedings of the NOSTRA symposium,Tartu, Estonia, January 1997. The Finnish Environment Institute,Helsinki.
Zohary, T., Erez, J., Gophen, M., Berman-Frank, I. and Stiller, M. (1994)Seasonality of stable carbon isotopes within the pelagic food web ofLake Kinneret. Limnol. Oceanogr., 39, 1030–1043.
Zohary, T., Pollingher, U., Hadas, O. and Hambright, K. D. (1998)Bloom dynamics and sedimentation of Peridinium gatunense in LakeKinneret. Limnol. Oceanogr., 43, 175–186.
Zohary, T., Güde, H., Pollingher, U., Kaplan, B., Pinkas, R. and Hadas,O. (2000a) The effect of nutrients (N, P) on the decomposition of Peri-
dinium gatunense cells and thecae. Limnol. Oceanogr., 45, 123–130.
Zohary, T., Güde, H., Kaplan, B., Pollingher, U. and Hadas, O. (2000b)Decomposition of the dinoflagellate Peridinium gatunense under oxic vs.anoxic conditions. Verh. Int. Ver. Limnol., 27, 879–883.
Received on August 24, 2001; accepted on February 17, 2003
JOURNAL OF PLANKTON RESEARCH VOLUME NUMBER PAGES ‒
02 viner-mozzini (fbg039)(ds) 5/14/03 12:01 PM Page 602


![Bourrelly 1968_292 [notes eau douce Peridinium Peridiniopsis Glenodinium].pdf](https://img.pdfslide.net/doc/110x75/55cf94ad550346f57ba3aae6/bourrelly-1968292-notes-eau-douce-peridinium-peridiniopsis-glenodiniumpdf.jpg)