Embed Size (px)
Citation preview
Sede Amministrativa: Università degli Studi di Padova
Dipartimento Territorio e Sistemi Agro Forestali
Scuola di Dottorato Di Ricerca in Territorio, Ambiente, Risorse E Salute
Ciclo XXVI
METHODOLOGICAL ISSUES IN IMPLEMENTING A SUSTAINABLE FOREST
MANAGEMENT PLAN IN REMOTE MOUNTAIN AREAS
The Karakorum (Pakistan)
Direttore della Scuola: Ch.mo Prof. Mario Aristide Lenzi
Supervisore: Ch.mo Prof. Tommaso Anfodillo
Dottorando: Efrem Ferrari

I
SUMMARY
Based on a practical case-study, the Central Karakorum National Park - Gilgit-Baltistan -
Pakistan, the aim of the thesis is to present a methodological framework for promoting the
sustainable forest management in mountain areas characterized by remoteness, difficulties of access
and where few data are available.
Forest resources of Karakorum Mountains assume an essential role for the livelihoods of local
communities, heavily dependent on wood for heating, cooking and construction purposes. However,
uncontrolled and long lasting anthropogenic pressures (as grazing, high firewood necessities,
increase in population) have slowly but continuously degraded forest resources, posing threats to
their conservation. Paradoxically, this has been exacerbated by mismanagement, lack of forest
inventories and lack of community involvement, consequence of a strong top-down and centralized
governance of natural resources.
The development of a sustainable and participatory forest management plan based on sound
scientific data can be therefore considered both a priority and an innovative approach. Even if the
whole work was completed in a single protected area, the issues under investigation, the problems
encountered and the methodologies applied to solve them are similar in many other mountains of
developing countries.
To reach this objective, the research has been divided into three main areas of investigation.
The first relates to the spatial quantification of resources availability and involved the
development of a land cover map of the Park area and an assessment of Park’s forests in terms of
above ground biomass and current annual increment. This was achieved using satellite images and
field plots.
The second investigation included activities aimed at assessing local communities’ livelihood
options and their use of forest resources. We organized focus groups in 24 villages of 9 valleys with
the double objective of collecting information and stimulate discussion about management plan
issues.

II
Finally, to increase locals’ capacity in forest management related activities, two reforestation
initiatives, which included all steps from seeds collection to seeding and seedlings protection from
browsing, were organized.
In the last chapter of the thesis the preliminary Central Karakorum National Park management
indications are summarized.
.
III
خلاصہ
پر مبنی پاکستان ، گلگت بلتستان ، ایک عملی مطالعہ کی بنیاد پر، مرکزی قراقرم نیشنل پارک
پہاڑی علاقوں ، رسائی کی مشکلات اور جہاں چند معلومات دستیاب ہیں،مقالہ کا مقصد دور دراز
نا ہے ۔میں جنگلات کے پائیدار انتظام کو فروغ دینے کیلئے ایک با ضابطہ فریم ورک پیش کر
مقاصد ی تعمیر ،کھانا پکانے ، ہیٹنگ کیلئے جنگل کے وسائل مقامی کمیونٹیز کےقراقرم پہاڑوں
تاہم بے لگام اور دیر پا انسانی دباو .ادا کرتےہیںلئے ایک لازمی کردار مقاصد کےروزگار کے اور
نے آہستہ آہستہ ( چرنے کے طور پر ، جلانے کیلئے لکڑی کی زیادہ ضررویات، آبادی میں اضافہ)
لیکن مسلسل جنگل کےوسائل اور ان کے تحفظ کیلئے خطرات پیدا کر دئیے ہیں۔ اس کے علاوہ یہ
فہرست کا نہ ہونا اور مقامی لوگوں کی جنگل کے /بد انتظامی ، جنگل کے وسائل کے ریکارڈ
انتظام میں بہت کم شمولیت کی وجہ سے مزید متاثر ہو گیا ہے۔
معلومات کی بنیاد پر جنگلات کے پائیدار اور اشتراکی منصوبہ بندی پلان کی تیاری اعلیٰ سائنسی
کو ترجیحی اور جدید نقطہ نظر پر لیا جا سکتا ہے۔ اگرچہ منصوبہ ایک مخصوص علاقے کیلئے
تیار کیا جاتا ہے تو اس تحقیق کے مطابق، درپیش مسائل اور ان کے حل کیلئے دیئے گئے طریقہ کار
بہت سے ترقی پذیر ممالک کے پہاڑی علاقوں سے ملتے جلتے ہیں اور اسی لیے یہ منصوبہ جو کہ
عالمی تناظر میں بھی مفید ہو سکتا ہے۔
اس مقصد تک پہنچنے کیلئے تحقیق کو تین اہم حصوں میں تقسیم کیا گیا ہے۔
ے لئے زمینی ستیابی کے فضائی تعین سے متعلق ہے جو پارک ایریا ک پہلا حصہ وسائل کی د
موجودہ سالانہ افزائش کی جانکاری ی تیاری اور پارک کےسطحی جنگلی حیات کے طور پر نقشہ ک
پر مبنی ہے۔ یہ سیٹیلائٹ تصاویر اور فیلڈ پلاٹس کو استعال کرتے ہوئےحاصل کیا گیا تھا۔
IV
اور ان مقامی سماجی گروہوں کے معیار زندگی دوسری تحقیق میں شامل سرگرمیوں کا مقصد
دیہاتوں میں توجہ 42وادیوں کے 9ہے۔ ہم نے سائل کے استعمال کا تعین کرنا کے جنگل کے و
نصوبہ بندی کے پلان ؛ معلومات کا اکٹھا کرنا اور ممرکوز گروپ بحثوں سے دو مقاصد
پر بحث کی حوصلہ افزائی کا اہتمام کیا گیا ۔ بارےمعاملات
تظام اور اس سے متعلقہ سرگرمیوں میں صلاحیت بڑھانے میں مقامی لوگوں کی جنگل کے انآخر
کیلئے جنگل کی بحالی کےدو اقدامات اٹُھائے گئے جن میں بیج جمع کرنے سے پودوں کی نرسری
تک ،اور پودوں کی مال مویشیوں سے تحفظ شامل ہیں۔
ندہی کا خلاصہ مقالے کے آخری باب میں مرکزی قراقرم نیشنل پارک کے انتظام کی ابتدائی نشا
کیا گیا ہے۔
V
SOMMARIO
Questa tesi, partendo da un caso studio focalizzato sul Parco Nazionale del Karakorum Centrale –
Provincia del Gilgit Baltistan – Pakistan, è finalizzata all’individuazione di un quadro metodologico
per promuovere la gestione forestale sostenibile in aree montane remote, caratterizzate da un estremo
isolamento imputabile a difficoltà di accesso e comunicazione, e da mancanza di informazioni su
stato e disponibilità delle risorse forestali.
Le foreste montane del Karakorum rivestono un ruolo essenziale nel garantire la sopravvivenza
delle comunità locali, fortemente dipendenti dal legname sia per fini energetici (riscaldamento,
cucina) che strutturali (ponti, edifici). Inoltre, la persistente ed incontrollata pressione antropica,
esacerbata dall’aumento demografico, il pascolo indiscriminato ed alti consumi pro-capite, hanno
provocato una forte degradazione degli ecosistemi forestali, fino a renderne la conservazione
precaria.
Paradossalmente, questi processi sono stati ulteriormente aggravati dalla mancanza di una
gestione selvicolturale razionale, dalla mancanza di inventari quantitativi e qualitativi e da un
generale scarso coinvolgimento delle comunità locali nella gestione. Il quadro normativo forestale,
infatti, prevede tutt’ora un forte controllo, centralizzato, dell’amministrazione pubblica, con ridotta
partecipazione delle comunità sia a livello di pianificazione che di gestione.
In un contesto siffatto, quindi, lo sviluppo di una gestione forestale sostenibile e partecipativa,
basata su concreti dati scientifici, rappresenta sia una priorità che un approccio innovativo. E, pur
consapevoli che questo studio è riferito esclusivamente ad una ben specifica area protetta, le
tematiche affrontate, le problematiche riscontrate e le soluzioni metodologiche prospettate possono
costituire argomento di interesse e di riflessione per molte altre realtà montane di paesi in via di
sviluppo.
Per evidenziare l’aspetto metodologico del progetto, lo svolgimento della ricerca è stato ripartito
in tre distinti filoni tematici di investigazione.
Il primo riguarda le attività mirate ad ottenere una stima quantitativa e spaziale della disponibilità
di risorse forestali: a tal fine, è stata tratta da immagini satellitari una cartografia di uso del suolo con

VI
particolare attenzione alla componente forestale. Inoltre, sempre utilizzando tecniche di
telerilevamento, si è stimata la biomassa epigea e l’incremento corrente.
Il secondo tema di indagine è focalizzato sulle comunità locali, con particolare attenzione
all’utilizzo da parte loro delle risorse forestali e naturali. Tramite l’organizzazione di focus groups in
24 villaggi di 9 valli, sono state analizzate le pratiche di gestione ed i consumi di legna pro-capite.
Infine in due valli campione sono state realizzate due riforestazioni, per esemplificare in concreto
una prassi di buona gestione forestale. In entrambe le occasioni tutti i passaggi necessari al loro
corretto svolgimento, dalla raccolta del seme alla protezione dei semenzali tramite recinzioni
elettrificate, sono stati svolti con la determinante collaborazione delle comunità locali. Occasione
preziosa e significativa per stimolare il coinvolgimento dei locali anche in merito a tematiche
riguardanti la pianificazione gestionale.
L’ultimo capitolo della tesi contiene un riassunto delle prime linee di gestione forestale
individuate per il Parco Nazionale del Karakorum Centrale. Indicazioni queste che possono essere
considerate le conclusioni dello studio.
VII
INDEX
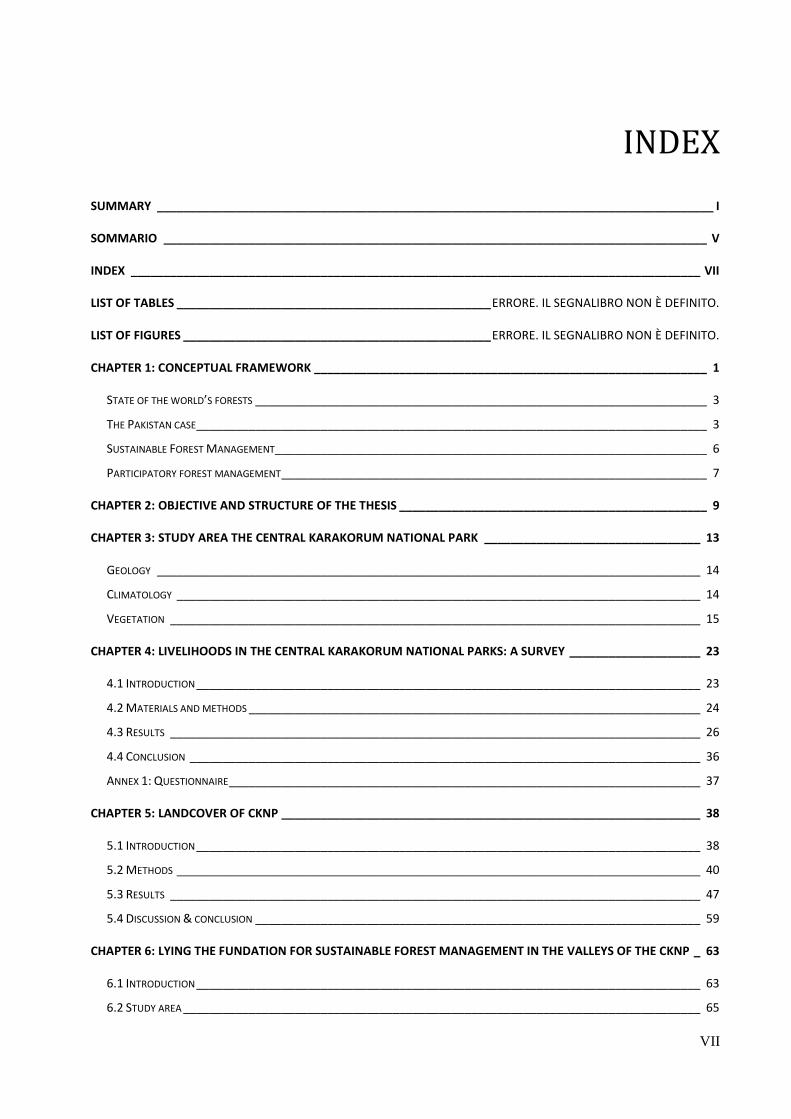
SUMMARY _____________________________________________________________________________________ I
SOMMARIO ___________________________________________________________________________________ V
INDEX _______________________________________________________________________________________ VII
LIST OF TABLES ________________________________________________ ERRORE. IL SEGNALIBRO NON È DEFINITO.
LIST OF FIGURES _______________________________________________ ERRORE. IL SEGNALIBRO NON È DEFINITO.
CHAPTER 1: CONCEPTUAL FRAMEWORK ____________________________________________________________ 1
STATE OF THE WORLD’S FORESTS _____________________________________________________________________ 3
THE PAKISTAN CASE ______________________________________________________________________________ 3
SUSTAINABLE FOREST MANAGEMENT __________________________________________________________________ 6
PARTICIPATORY FOREST MANAGEMENT _________________________________________________________________ 7
CHAPTER 2: OBJECTIVE AND STRUCTURE OF THE THESIS _______________________________________________ 9
CHAPTER 3: STUDY AREA THE CENTRAL KARAKORUM NATIONAL PARK _________________________________ 13
GEOLOGY ___________________________________________________________________________________ 14
CLIMATOLOGY ________________________________________________________________________________ 14
VEGETATION _________________________________________________________________________________ 15
CHAPTER 4: LIVELIHOODS IN THE CENTRAL KARAKORUM NATIONAL PARKS: A SURVEY ____________________ 23
4.1 INTRODUCTION _____________________________________________________________________________ 23
4.2 MATERIALS AND METHODS _____________________________________________________________________ 24
4.3 RESULTS _________________________________________________________________________________ 26
4.4 CONCLUSION ______________________________________________________________________________ 36
ANNEX 1: QUESTIONNAIRE ________________________________________________________________________ 37
CHAPTER 5: LANDCOVER OF CKNP ________________________________________________________________ 38
5.1 INTRODUCTION _____________________________________________________________________________ 38
5.2 METHODS ________________________________________________________________________________ 40
5.3 RESULTS _________________________________________________________________________________ 47
5.4 DISCUSSION & CONCLUSION ____________________________________________________________________ 59
CHAPTER 6: LYING THE FUNDATION FOR SUSTAINABLE FOREST MANAGEMENT IN THE VALLEYS OF THE CKNP _ 63
6.1 INTRODUCTION _____________________________________________________________________________ 63
6.2 STUDY AREA _______________________________________________________________________________ 65
VIII
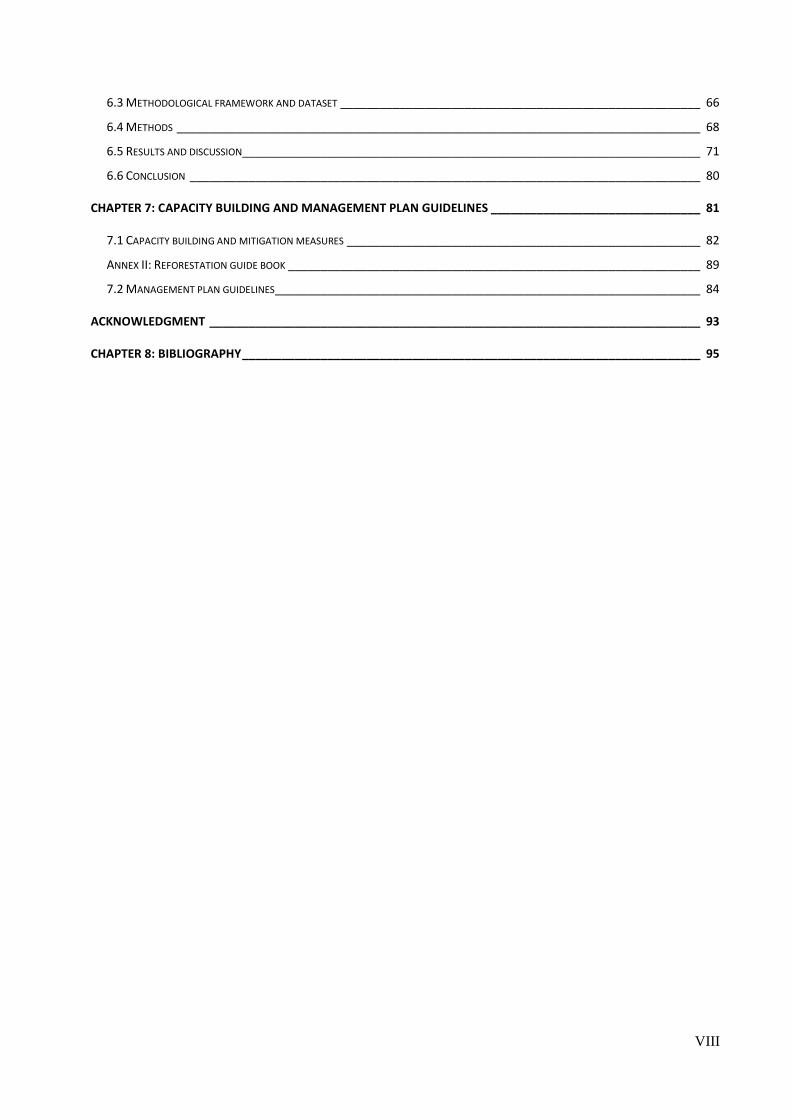
6.3 METHODOLOGICAL FRAMEWORK AND DATASET _______________________________________________________ 66
6.4 METHODS ________________________________________________________________________________ 68
6.5 RESULTS AND DISCUSSION ______________________________________________________________________ 71
6.6 CONCLUSION ______________________________________________________________________________ 80
CHAPTER 7: CAPACITY BUILDING AND MANAGEMENT PLAN GUIDELINES ________________________________ 81
7.1 CAPACITY BUILDING AND MITIGATION MEASURES ______________________________________________________ 82
ANNEX II: REFORESTATION GUIDE BOOK _______________________________________________________________ 89
7.2 MANAGEMENT PLAN GUIDELINES _________________________________________________________________ 84
ACKNOWLEDGMENT ___________________________________________________________________________ 93
CHAPTER 8: BIBLIOGRAPHY ______________________________________________________________________ 95

IX
LIST OF TABLES
Table 1: Forest area per Province: in bold northern mountain regions. ............................................................................... 4 Table 2: Summary of CKNP Vegetation types ..................................................................................................................... 20 Table 3: Broad distribution of Vegetation types according to the two “ecological zones” of CKNP. Based on field observations........................................................................................................................................................................ 21 Table 4: Livelihood strategies in the 24 villages surveyed. n°HH: Number of Household, Alt: Altitude (m a.s.l.), Agricolture: double/single cropping zone, Orchards: only fruits sold to market have been highlighted (Apr: Apricot, Wal: walnut, App: apple, Cher: Cherry, Pear), Livestock: n° of animals per HH (G: goat, S: sheep, C: cow and crossbreed, Y: yak); Livestock product: only products sold to market are highlighted; Pasture organization: how is, at village level, organized the grazing of livestock; NWFP: only products sold to market are highlighted. ................................................ 35 Table 5: The Landsat images, and their property, used for this study. ............................................................................... 42 Table 6: Land cover classes identified for the Central Karakorum National Park, their definition and the main species present. ............................................................................................................................................................................... 48 Table 7: Overall accuracy and Kappa statistic for: a) Supervised classification with LC dataset (MD: Minimum Distance, ML: Maximum Likelihood, SVM: Support Vector Machine) b) Decision Tree with species dataset (MD: Minimum Distance, ML: Maximum Likelihood, SVM: Support Vector Machine) ................................................................................................ 54 Table 8: Land cover (in % of total valley area) for the different valley and total valley surface (in ha). (AG: agriculture, GR: grassland, SV: scattered vegetation, SP: sparse vegetation, OF: Open forest, CF: Close forest, SN: Snow and Ice, BR: bare rock). ........................................................................................................................................................................... 55 Table 9: Species composition (in percentage of total open and close forest class) in the different CKNP valleys. ............. 58 Table 10: Allometric equations used for estimating single tree biomass. .......................................................................... 68 Table 11: Regression between DBH and CAI to estimate CAI of each tree sampled and fraction of the total variance explained by the regression (R2) per species. ..................................................................................................................... 69 Table 12: Maximum (Max) and average (Avg) DBH and maximum height (Max) for study areas species. ....................... 72 Table 13: Regression model tested for the AGB-Landsat spectral values/indices relation. ................................................ 73 Table 14: AGB (Mg) values and CAI (Mgyr-1) in the CKNP valleys. ..................................................................................... 74 Table 15: Village’s population (N° of Household), average firewood needs per Household (Avg HH firewood, MgHH-1yr-1), percentage of firewood collected from natural forest (% forest), total average timber (Avg Timber, Mgyr-1) and firewood (Avg firewood Mgyr-1) needs per village and grand total wood needs (Tot, Mgyr-1), village’s forest current annual increment (CAI, MGyr-1) and difference between total CAI and needs (Difference, Mgyr-1, negative values when needs are higher than CAI). Note that Chirah, Farfoo and Hopey villages jointly manage their forest resources. ............ 78 Table 16: Best timing for Pinus and Picea cones harvesting. .............................................................................................. 89
X
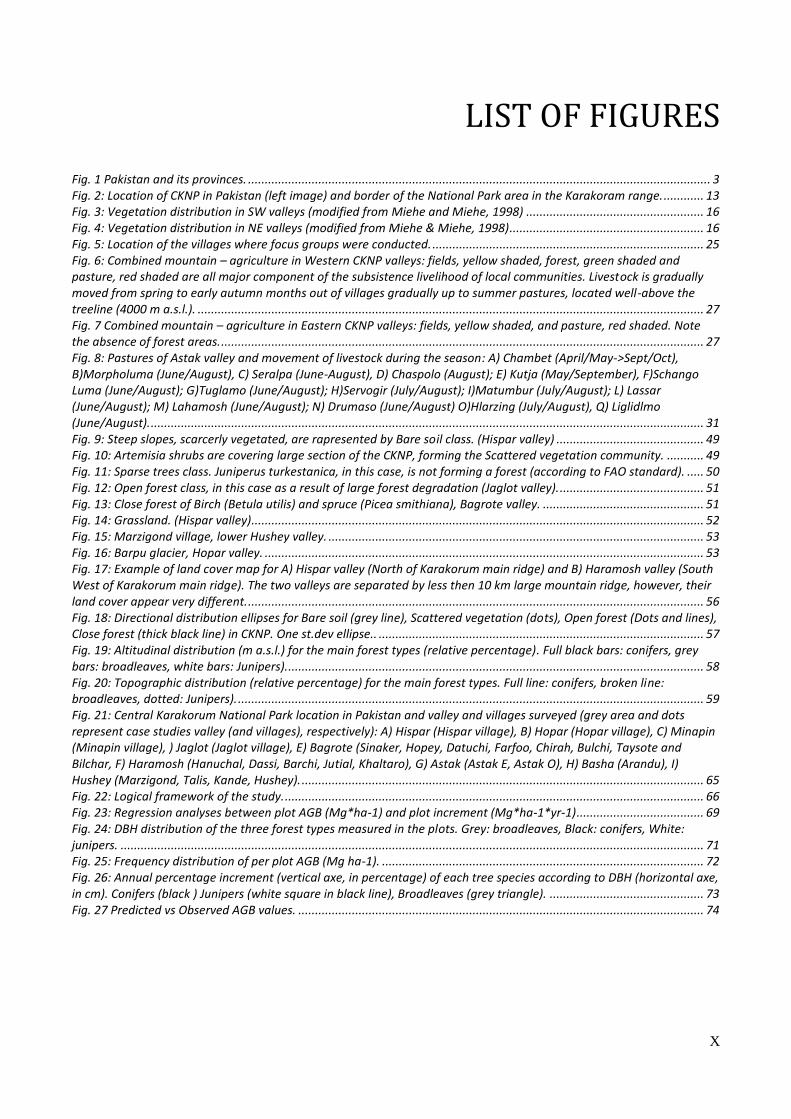
LIST OF FIGURES
Fig. 1 Pakistan and its provinces. .......................................................................................................................................... 3 Fig. 2: Location of CKNP in Pakistan (left image) and border of the National Park area in the Karakoram range. ............ 13 Fig. 3: Vegetation distribution in SW valleys (modified from Miehe and Miehe, 1998) ..................................................... 16 Fig. 4: Vegetation distribution in NE valleys (modified from Miehe & Miehe, 1998) .......................................................... 16 Fig. 5: Location of the villages where focus groups were conducted. ................................................................................. 25 Fig. 6: Combined mountain – agriculture in Western CKNP valleys: fields, yellow shaded, forest, green shaded and pasture, red shaded are all major component of the subsistence livelihood of local communities. Livestock is gradually moved from spring to early autumn months out of villages gradually up to summer pastures, located well-above the treeline (4000 m a.s.l.). ....................................................................................................................................................... 27 Fig. 7 Combined mountain – agriculture in Eastern CKNP valleys: fields, yellow shaded, and pasture, red shaded. Note the absence of forest areas. ................................................................................................................................................ 27 Fig. 8: Pastures of Astak valley and movement of livestock during the season: A) Chambet (April/May->Sept/Oct), B)Morpholuma (June/August), C) Seralpa (June-August), D) Chaspolo (August); E) Kutja (May/September), F)Schango Luma (June/August); G)Tuglamo (June/August); H)Servogir (July/August); I)Matumbur (July/August); L) Lassar (June/August); M) Lahamosh (June/August); N) Drumaso (June/August) O)Hlarzing (July/August), Q) Liglidlmo (June/August). ..................................................................................................................................................................... 31 Fig. 9: Steep slopes, scarcerly vegetated, are rapresented by Bare soil class. (Hispar valley) ............................................ 49 Fig. 10: Artemisia shrubs are covering large section of the CKNP, forming the Scattered vegetation community. ........... 49 Fig. 11: Sparse trees class. Juniperus turkestanica, in this case, is not forming a forest (according to FAO standard). ..... 50 Fig. 12: Open forest class, in this case as a result of large forest degradation (Jaglot valley). ........................................... 51 Fig. 13: Close forest of Birch (Betula utilis) and spruce (Picea smithiana), Bagrote valley. ................................................ 51 Fig. 14: Grassland. (Hispar valley) ....................................................................................................................................... 52 Fig. 15: Marzigond village, lower Hushey valley. ................................................................................................................ 53 Fig. 16: Barpu glacier, Hopar valley. ................................................................................................................................... 53 Fig. 17: Example of land cover map for A) Hispar valley (North of Karakorum main ridge) and B) Haramosh valley (South West of Karakorum main ridge). The two valleys are separated by less then 10 km large mountain ridge, however, their land cover appear very different. ........................................................................................................................................ 56 Fig. 18: Directional distribution ellipses for Bare soil (grey line), Scattered vegetation (dots), Open forest (Dots and lines), Close forest (thick black line) in CKNP. One st.dev ellipse.. ................................................................................................. 57 Fig. 19: Altitudinal distribution (m a.s.l.) for the main forest types (relative percentage). Full black bars: conifers, grey bars: broadleaves, white bars: Junipers)............................................................................................................................. 58 Fig. 20: Topographic distribution (relative percentage) for the main forest types. Full line: conifers, broken line: broadleaves, dotted: Junipers). ........................................................................................................................................... 59 Fig. 21: Central Karakorum National Park location in Pakistan and valley and villages surveyed (grey area and dots represent case studies valley (and villages), respectively): A) Hispar (Hispar village), B) Hopar (Hopar village), C) Minapin (Minapin village), ) Jaglot (Jaglot village), E) Bagrote (Sinaker, Hopey, Datuchi, Farfoo, Chirah, Bulchi, Taysote and Bilchar, F) Haramosh (Hanuchal, Dassi, Barchi, Jutial, Khaltaro), G) Astak (Astak E, Astak O), H) Basha (Arandu), I) Hushey (Marzigond, Talis, Kande, Hushey). ........................................................................................................................ 65 Fig. 22: Logical framework of the study. ............................................................................................................................. 66 Fig. 23: Regression analyses between plot AGB (Mg*ha-1) and plot increment (Mg*ha-1*yr-1) ...................................... 69 Fig. 24: DBH distribution of the three forest types measured in the plots. Grey: broadleaves, Black: conifers, White: junipers. .............................................................................................................................................................................. 71 Fig. 25: Frequency distribution of per plot AGB (Mg ha-1). ................................................................................................ 72 Fig. 26: Annual percentage increment (vertical axe, in percentage) of each tree species according to DBH (horizontal axe, in cm). Conifers (black ) Junipers (white square in black line), Broadleaves (grey triangle). .............................................. 73 Fig. 27 Predicted vs Observed AGB values. ......................................................................................................................... 74
1
CHAPTER 1
CONCEPTUAL FRAMEWORK
Conservation of forest resources and sustainable development are ambitious objectives arisen
from numerous global environmental debates since more than 20 years (UN, 1992a; UN, 1992b;
UNCED, 1992; UNDP, 2000). It was at the United Nation Conference on Environment and
Development held in Rio de Janeiro, in 1992, that a process towards definition of best management
practices and protection of biodiversity rich-areas was prioritized to achieve an ecologically sound
sustainable development.
During this meeting two important documents related to forest conservation and good
management were ratified: one specifically focused on the forest sector, the “Principles for a global
consensus on the management, conservation and sustainable development of all types of forests” the
second, which includes different issues and thematic is the Agenda 211. In both documents, reducing
deforestation is a core aspect to guarantee a sustainable future to biodiversity, society and to ensure
future’s human well-being (McShane et al., 2011).
Few years later, in 1997, during the UNFCCC Conference of Parties held in Kyoto, forests
resources gained even more attention for their potential role in combating climate change. On the one
side photosynthesis (i.e. plant Co2 uptake) is seen as a relatively low-cost measure to reduce total
global GHG emissions, on the other deforestation alone accounts for as much as 17% of all annual
anthropogenic greenhouse gas emissions (DeFries et al., 2006; van der Werf et al., 2009). Policies
aimed at reducing deforestation are nowadays a central points of a strategy to decrease carbon
emissions, reflected in pending international discussions.
1 Both documents are available respectively at: http://www.un.org/documents/ga/conf151/aconf15126-3annex3.htm and
http://www.un.org/esa/dsd/agenda21/res_agenda21_11.shtml. Agenda 21, Section II, Chapter 11 specifically deal with deforestation by
identifying measures and techniques to combat it.
2
Finally, in the last decade, the objective of combating poverty and improving living conditions of
local communities in remote areas, clearly stated in the Millennium Development Goals (MDG2)
ratified by 191 governments at the Millennium Summit in early 2000, has been increasingly linked
with forests and forest management issues. Consequently, the importance of sustainable harvesting
rate of wood and non-wood forest products as a base-line to guarantee sufficient living standards, the
preservation of traditional knowledge, the crucial importance of involving local communities in
community-based forest management (CBM) programs have been deeply explored (Sam and
Shepherd, 2011).
More recently, the United Nation Conference on Sustainable Development, Rio +20, held in Rio
de Janeiro, Brazil, in June 2012, confirmed further the strong link between sustainable development
and conservation of forest resources3.
As a result, it has been internationally recognized that sustainable forest management can promote
local communities living conditions while conserving forest resources. This is especially true if the
management of forests is done by or with the involvement of local communities (Ostrom, 1990).
Since 2005, almost 75% of the world forest resources were covered by a national forest program (i.e.
participatory forest management schemes) (FAO, 2011a).
Contextually, to actively protect and conserve highly valuable and representative biomes, species
and natural ecosystems worldwide, an increasing number of protected areas have been established
throughout the world (Margules and Pressey, 2000). Especially in developing countries where those
areas have often been inhabited since long time, they have the additional role to improve local
communities welfare and to become examples of sustainability (Adam, 2006; Naughton-Treves et
al., 2005). However, the most recent estimates on the state of the world’s forests still deliver a
different picture, as deforestation and forest degradation are still threatening biodiversity, livelihoods
of communities and, in general, ecosystem functioning. Additionally, protected areas are in many
cases ineffective despite international funds and strong commitment from donors countries
(Leverington et al., 2010).
2 Available at: http://www.un.org/millenniumgoals/bkgd.shtml.
3 This is clearly stated in principles n° 193, 194, 195 on forests, and 210, 211 and 212 on mountains.
3
State of the world’s forests
According to FAO “State of the World’s Forests 2011” (2011b), “the overall rate of deforestation
in the world remained alarmingly high, although the rate was slowing”. Globally, deforestation rate
decreased from 16 million hectares per year during the 1990s to around 13 million hectares per year
during the last decades. During the same time span, afforestation with fast growing plantation and
natural expansion of forest areas (concentrated mainly in developed countries) reduced the overall
loss of forest area at global level from -8.3 million hectares per year to -5.2 million hectares/year
(FAO, 2011b).
However, large discrepancies have been recorded across the globe with highest deforestation rate
in South America and the Caribbean and net-reforestation in Europe.
Asia showed a particular behavior during the last 20 years: from being an area with high forest
losses (during the ‘90s estimated to be 0.7 million hectares per year), in the last decade the trend
reversed mainly thanks to large scale plantations resulting in a net increase of 1.4 million hectares
per year. On a regional perspective, South Asia reversed the annual change trend from a negative
growth until 2000 (-7000 hectares per year in the period 1990-2000) to a gain in the last 10 years
(221000 hectares per year during 2000-2010, or +0.19%) (FAO, 2012).
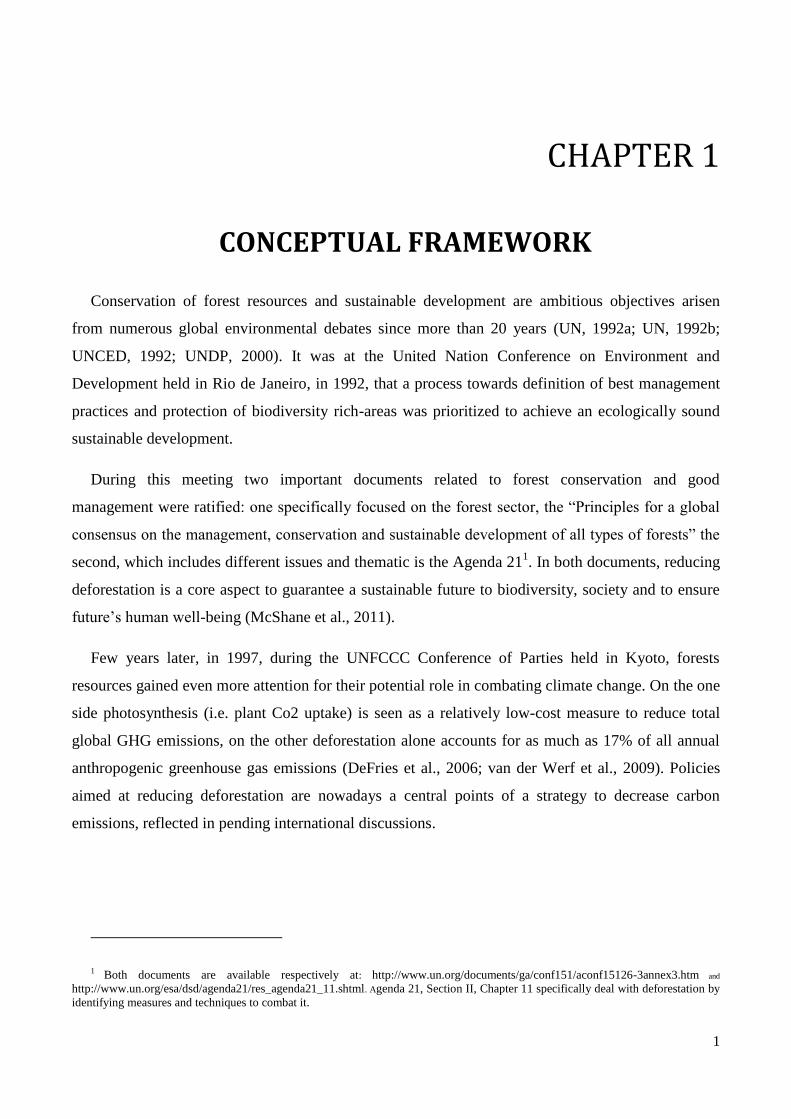
The Pakistan case
Pakistan (Fig. 1) spreads over more than 800,000
km2 between latitudes 24 and 37°N and longitudes
61 and 77°E. Encompassing an exceptionally broad
geo-morphological variability, from the arid shores
of the Arabian sea to the 8000 meters high peaks of
the Karakorum mountains, it inherits very high
levels of biodiversity and endemic species. With a
population of more than 180 million people, and a
total forest area of less than 1.7 million hectares
(FAO, 2010), Pakistan is one of the country with the Fig. 1 Pakistan and its provinces.
4
lowest forest area per inhabitants in the world (below 0.1 square km every 1000 inhabitants), one of
the highest population growth rate in the region, currently at 1.59% per year (2011 Census4) and the
highest deforestation rate in Asia region. This shows no sign of reduction: according to the FAO
Global Forest Resources Assessment (2011), forest area shrunk from 2.527 million hectares in 1990
to 1.687 million hectares in 2010. Deforestation rate passed in the same time span from -1.76% per
year to -2.37% in 2010. Also the growing stock of living forests is decreasing at an alarmingly high
rate and it’s already much lower compared to similar country like Nepal or Bhutan. Interestingly, in
opposition to global and regional tendency, forest plantations trend in the last 20 years is showing no
clear increasing trend (currently set at +4000 hectares/year from >6000 hectares/year 10 years
before).
Accordingly to FAO and other studies, much of the current pressure on Pakistan forest resources
is consequence of the high woodfuel necessities rather than on industrial roundwood consumptions
(Ali et al., 2005; FAO, 2010; Gohar, 2002; IUCN, 2003a; IUCN, 2003c; Qasim et al., 2011;
Schickhoff, 1998; Shahbaz et al., 2011; Shahbaz et al., 2007; World Bank, 2010). In the last 20 years
in example, due to a constantly high population growth, woodfuel removals increased from an
estimated 24.7 million m3year
-1 to more than 31.6 million m
3year
-1 while timber consumptions
remained stable around 2.3/2.4 million m3year
-1.
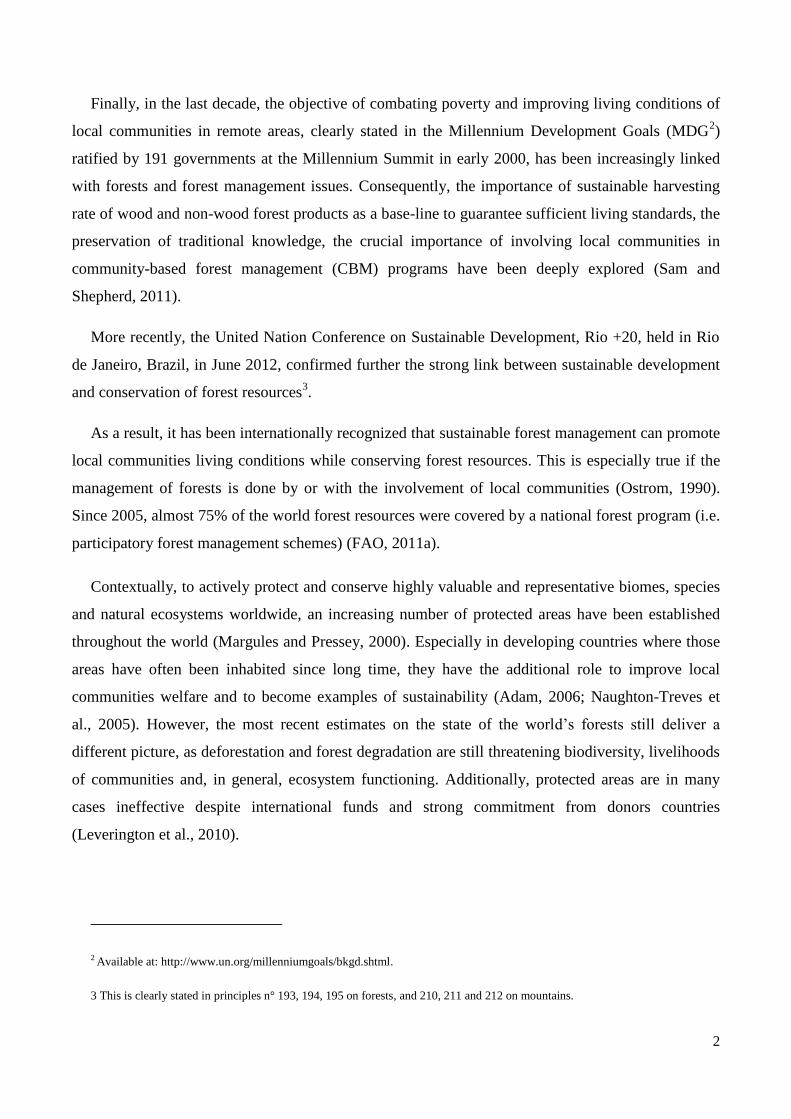
Forest resources, in addition, are not evenly distributed in the whole country: aridity in the
southern and westernmost regions (Sindh and Balochistan) and intensive agriculture in the irrigated
flat areas of Punjab, result in a jeopardized forest presence (Tab. 1)5 mainly located along the
mountain regions of Himalaya, Karakorum and Hindu-Kush, in the north and north west portion of
the country (Government of Pakistan, 2001).
Table 1: Forest area per Province: in bold northern mountain regions.
Province Total Area (‘000 ha) Forest Area (‘000 ha) Percentage
Northern Areas 1330 360 27.0
Azad Kashmir 7040 770 11
Khyber Pakthunkhwa 10170 1410 13.9
Balochistan 34720 720 2.1
Sindh 14090 680 4.8
Punjab 20630 630 3.1
Total 87980 4570 5.2
4 http://www.census.gov.pk/
5: official national statistics do not include the whole portion of Gilgit-Baltistan province as this area is still disputed with India.
5
The strong human pressure which the country’s forest resources are facing, therefore, calls for
immediate international efforts.
This study focuses on the Central Karakorum National Park, Pakistan. This is a highly remote
mountainous area entirely included in its northernmost province, Gilgit – Baltistan. Its mountain
forests, as other types of forests, are essential to guarantee a large amount of ecosystem services
important for local wellbeing. However, their importance is not limited for people residing in
mountain areas: even those living in the flat portion of the country are heavily affected by their
presence, diffusion and management. In example, Karakorum-Hindu Kush mountain forests protects
watersheds which are supplying freshwater, food through irrigation and energy security to more than
215 million people residing in Punjab and nearby areas (Karki et al., 2011). Additionally to timber
and firewood, those forests are often an essential source of food, fodder and medicines especially for
poor households (ICIMOD, 2011). For those people, heavily dependent on the entire forest
ecosystem, specific mountain forest policies and management practices acknowledging first the
needs of local communities are essential. As was previously revealed in other investigations,
however, local forest policies (as the Northern Areas Forest Rules, 19836) still rely on a strictly top-
down governance, with poor consideration of local uses needs (Ali and Nyborg, 2010; Geiser and
Steimann, 2004; Knudsen, 2011; Shahbaz et al., 2011; Shahbaz et al., 2007).
Many R&D centers have been founded and financed internationally in the last decades to
encourage the development of guidelines and tools to help local policy makers in taking into
consideration local communities necessities and, at the same time, reduce deforestation rate.
However, the sharing of know-how, scientific findings and practical management techniques alone is
not sufficient in such areas characterized by complex environment, culture and society (Rasul and
Karki, 2007).
The aim of this thesis work is to develop a sustainable and participatory forest management plan
for the Central Karakoram National Park. The terms sustainable and participatory are closely
connected one to each other, however they refers to different area of interest. If sustainability is often
measured in ecological, economical and, social terms, participatory processes refer directly to the
governance system, in which a participatory approach can be seen as the first step to develop “social
sustainability”.
6 https://cmsdata.iucn.org/downloads/northern_areas_forest_rules_1983.pdf

6
Sustainable Forest Management
Countless definition of sustainable management has been proposed, not only for the forest sector
in the last decades (Adam, 2006; Irland, 2010). However, this concept had in forestry a long and
precious tradition. The following description, which has been extracted by the 2008 United Nation
resolution 62/98 “Non-legally binding instrument on all types of forests” defines “Sustainable forest
management as a dynamic and evolving concept aiming at maintain and enhance the economic,
social and environmental value of all types of forests, for the benefit of present and future
generations.”7
Seven themes are considered fundamentals:
Extent of forest resources: extent and amount of forest shall be preserved.
Forest biological diversity: The conservation and preservation of biological diversity at the
landscape, species and genetic levels.
Forest health and vitality: Management of forest resources aimed at reducing the impact on
the ecosystems and its functioning.
Productive functions of forest resources: Sustainable forest management shall concentrate
on the maintenance of a continuous flow of timber and also other non-wood forest products
essential.
Protective functions of forest resources: The protective role of forests shall be maintained
and where possible enhanced to moderate soil, hydrological and aquatic systems in both
quality and quantity.
Socio-economic functions of forests: Sustainable forest management shall address the
contribution of forest resources to the overall economy as well as to tradition, spiritual and
recreational values.
Legal, policy and institutional framework: This framework shall support the above six
themes including participation in decision making and governance of local communities.
As can be appreciated in the seven themes considered, social aspects are marginally mentioned.
While working in a rural and remote area it’s fundamental, if not mandatory, to involve and work in
tight relationships with the local communities. In this cases, indeed, to develop and apply concrete
7 The resolution is available at: http://daccess-dds-ny.un.org/doc/UNDOC/GEN/N07/469/65/PDF/N0746965.pdf
7
participatory initiatives to raise awareness and involve local communities is a necessity, rather than
an option (Tambe et al., 2011).
Participatory forest management
Defined “as the management of forest lands and forest resources by or with local people, whether
for commercial or non-commercial purposes”(Sam and Shepherd, 2011), PFM is not either a single
guideline or a set of principles, it’s more a concept aiming at increasing awareness and participation
of local communities in the decision making process (Dhakal et al., 2012). Essential component of
the PFM are:
use of forest by local people on individual or group basis and
the community management of forest: a collaborative organization led by local people with
or without the support of external organization who manage the forest for the provision of
goods and services (Rasul and Karki, 2007).
PFM is seen as a consequence of two main global policy trends: one side forest devolution, the
process for which forest control goes in the hand of local communities rather than at government
level, on the other side government decentralization, for which the planning start at local level
instead of being imposed from central authorities (Dellasala et al., 2012; Hammi et al., 2010). Both
those policies are the result of three decades of experience in combating deforestation and promoting
local and rural livelihoods. Until the ‘70s, indeed, Government and/or large scale private companies
were setting the regulation of forest management and local communities were addressed as one of
the main cause of deforestation (Nagendra et al., 2005). Continuously increasing rate of deforestation
and lack of applicable regulation, however, enhanced the idea for which environmental conservation
and rural development where not contradictory and that local communities must be involved at all
levels to allow a sustainable forest management (Angelstam et al., 2004). During the ‘80s the firsts
examples of PFM in South Asia (Nepal, 1978) and Brazil (1980s in the Amazon) gave promising
results and the concept was finally ratify at the 1992 Rio de Janeiro conference in the “Principle for a
global consensus on the management, conservation and sustainable development of all types of
forest”(Sam and Shepherd, 2011).
The complexity of the Karakorum area, both in ecological and social terms, has shaped the
following research: “global” results, covering the whole park, have been reached for what concern
the development of the National Park landcover, the assessment of forest area and its productivity.

8
The estimate of forest products uses by local communities was performed in 24 villages from 8
valleys covering almost half of the Park area (10000 km2) while capacity building activities for local
communities were implemented in 2 selected case studies (Bagrote valley – in the western part of the
Park and Astak valley in its eastern portion).
9
CHAPTER 2
OBJECTIVE AND STRUCTURE OF THE THESIS
Conservation of natural ecosystems and sustainable development are ambitious objectives arisen
from numerous global environmental debates in the last two decades. Among the themes under
discussion, specific attention was dedicated to forest resources and a process towards the definition
of best management practices for the conservation of biodiversity, reduction of deforestation and
forest degradation and improvement of local communities living conditions has been prioritized.
Forests role, indeed, is not limited to the production of timber and firewood. They are host of
biodiversity, sink for carbon sequestration and essential to guarantee a large amount of ecosystem
services important for human wellbeing. This is especially true for the 28 percent of world’s forests
located in mountain areas. Directly or indirectly, indeed, their presence is fundamental also for
people living outside mountain regions. However, unregulated firewood extraction and timber
logging, a constant population growth, mismanagement and unregulated/illegal felling, are leading to
widespread and unprecedented degradation of those ecosystems, posing threats to their ability to
fulfill needs and secure wellbeing of human population. Urgent measures are needed to secure
sustainability in the management of those precious resources, worldwide. A sustainability as
respectful of nature and its components as of local communities and their needs.
Based on a practical case-study, the aim of the thesis is to present a methodological framework for
the promotion of sustainable forest management in mountain areas characterized by remoteness,
difficulties of access and where little to none former information are available. Even if the whole
work was completed in a single protected area, the issues under investigation, the problems
encountered and the methodologies applied to solve them are similar in many other mountains of
developing countries.
The Central Karakoram National Park (CKNP), Gilgit-Baltistan, Pakistan, is a recently
established protected area, where little information on forests resources are available and where local
community are still heavily dependent on them. Lack of information on forests distribution and
quantity, lack of effective management guidelines and little consideration of local communities

10
needs are the ingredients that have exacerbated forest degradation to an alarmingly high rate. Forests
here are essential not only for securing livelihoods of local communities, but also to prevent soil
erosion and landslides. This is particular important in an area characterized by frequent natural
disasters as debris-flow, earthquakes, floods and where a large rural population is depending on the
water coming from those mountains to sustain their agricultural production.
To partially alleviate those negative effects, the Park decided to initiate the process for the
adoption of a sustainable forest management plan as a first step towards sustainable development.
This represents the final objective of the thesis work.
The gathering of information for the development of a rational and concrete management plan
represent the pillars on which the thesis has been shaped. Following a brief introduction to the study
area and a qualitative description of its vegetation (Chapter 3), three issues, different for thematic,
approaches and methodologies involved will be considered, all of them equally necessary to fund a
management plan.
The assessment of forest resources in terms of types and quantity.
The assessment of dependents local communities’ wood needs.
The involvement of those communities (capacity building activities) and the development
of the firsts management guidelines.
First pillar: Inventory of forest resources (Chapter 4 and 5)
The inventory of forest resources, in terms of types, spatial extent, location, biomass and
increment is a major step to define sustainable harvesting rates. According to the size of the study
area (more than 10.000 km2), the remoteness of its valleys, the difficulties of access and the limited
economical and temporal resources available, we applied remote sensing techniques to spread over
the entire study area the results from local field surveys.
The methodological approach implemented involves firstly the construction of a database on
land cover (with particular emphasis on forest cover) and land use (Chapter 5). This, was necessary
to create a knowledge system useful at different stages of management of the Park: in the
programming phase, when this is the basis for knowledge of the environment dynamics and of the
distribution of resources and during subsequent monitoring activities.
Secondly, we estimated the Central Karakorum National Park’s Above Ground Biomass (AGB)
and Current Annual Increment (CAI), (Chapter 6). We examine the distribution of those two
11
parameters in the Park area and, with a particular detail, in 24 case study villages. These data forms
the base on which forest management plan prescriptions are based and represent the first large-scale
forest inventory for the Gilgit-Baltistan region.
Second pillar: Assessment of local communities wood needs
Limited information were formerly available on needs of forest products by local communities
in terms of timber, firewood and Non Wood Forest Products (NWFP). Additionally, the in between
village land-ownership and the livelihood options in the Park area were not clear. It was therefore
important to assess and evaluate which are the important assets for local communities, which and
how much are their uses of forests, and how the harvesting is traditionally organized. For this reason,
and to increase locals acknowledgment of our researches, we conducted focus groups interviews in
24 villages of 9 valleys (Chapter 4 and Chapter 6). While in Chapter 4 the main general results
relatives to livelihood options in the study area will be presented, in chapter 6, the focus will be
specifically on the quantification of timber and firewood needs in the selected villages. From the
survey, it emerged that local households are dependent on forest resources and, realized that most of
them are under pressure, have tried with different degrees of success to limit their exploitation
through the creation of specific forest committee. The average per household harvesting rates and per
valley forest resources availability, have been used to assess the per village and per valley wood
needs.
Third pillar: Development of management plan guidelines and mitigation measures to increase local
communities capacity building.
The information obtained from the inventory of forest resources and the local communities
amounts of yearly wood needs allowed us to assess, at valley level, which are the communities
depleting most their forests and to prioritize the mitigation interventions (Chapter 6). As economic
and technical constraints are limiting the capabilities of CKNP to directly intervene in all the Park
area, this result is of uttermost importance. The management plan guidelines developed are,
therefore, spatially prioritized accordingly (Chapter 7). In this thesis’s last chapter, additionally, the
results from experimental mitigation measures carried out in the last three years are presented. In
particular, two forest tree species seeds harvesting have been organized and three sites have been
reforested in two valleys. All those works were organized with the collaboration of local
communities and CKNP officer to increase awareness and develop capacity building.

12
13
CHAPTER 3
STUDY AREA: CENTRAL KARAKORUM
NATIONAL PARK
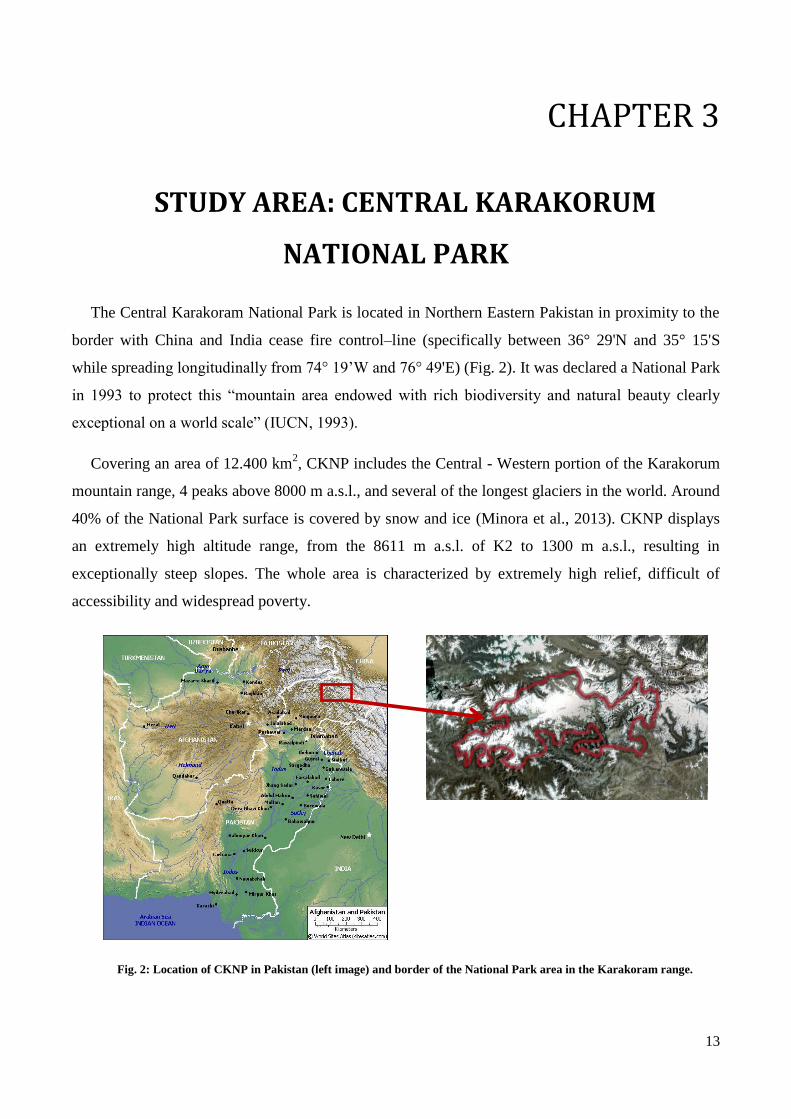
The Central Karakoram National Park is located in Northern Eastern Pakistan in proximity to the
border with China and India cease fire control–line (specifically between 36° 29'N and 35° 15'S
while spreading longitudinally from 74° 19’W and 76° 49'E) (Fig. 2). It was declared a National Park
in 1993 to protect this “mountain area endowed with rich biodiversity and natural beauty clearly
exceptional on a world scale” (IUCN, 1993).
Covering an area of 12.400 km2, CKNP includes the Central - Western portion of the Karakorum
mountain range, 4 peaks above 8000 m a.s.l., and several of the longest glaciers in the world. Around
40% of the National Park surface is covered by snow and ice (Minora et al., 2013). CKNP displays
an extremely high altitude range, from the 8611 m a.s.l. of K2 to 1300 m a.s.l., resulting in
exceptionally steep slopes. The whole area is characterized by extremely high relief, difficult of
accessibility and widespread poverty.
Fig. 2: Location of CKNP in Pakistan (left image) and border of the National Park area in the Karakoram range.
14
Geology
The Karakoram mountain range is built on Peri – Godwanian continental crust rifted away from
Gondwana during Late Paleozoic and accreted to the Southern Eurasian margin during the Upper
Mesozoic (Desio, 1974). It is bounded to the South by the Shyok suture whereas to the North, the
limit lies along the Tas Kupruk zone. To the east its limit may represent the Paleo-Tethyan suture
separating Karakoram from Hindu Kush – Pamir ranges (CKNP, 2012). Following the classification
proposed by Gansser, the Karakoram unit is usually divided into three main parallel sub-units from
north to south (Gansser, 1964):
1) The northern sedimentary belt, made up of a pile of thrust sheets
2) The Karakoram batholiths, or central plutonic belt, which covers around 30% of the range
3) The southern metamorphic belt, composed by sedimentary series where the metamorphism
reaches the amphibolites facies (Desio, 1974; Rolland et al., 2001).
Most of the study areas fells inside the southern metamorphic belt, whereas the Karakoram
batholiths is present in few valleys of the North-Eastern park sector (Hushey valley in particular).
Climatology
The Central Karakoram National Park area is falling in the transitional zone between the arid and
continental Central Asia climate and the semi-humid subtropics climate of South Asia (CKNP,
2012). In general local climate is characterized by dry condition especially at the lowest elevation:
precipitation usually falls during winter and spring while summer is relatively arid until the onsets of
cold weather in early autumn. As a general rule, a decreasing humidity and an increasing
significance of continental elements can be observed from south to north and from west to east. In
addition, a strong rain shadow effect is evident, with dry conditions at lower elevation and
precipitation mostly occurring during winter and spring.
Precipitation is strongly affected by the extreme topography, resulting in evident “rain-shadow”
effects: it increases considerably with altitude (a precondition for the large glacial masses present
above 5500 meters) where it occurs mainly as snowfall while in the lower valleys bottom,
surrounded by high peaks, aridity prevails with an average annual precipitation between 100 and 300
mm mostly felling during winter and early spring months (Archer and Fowler, 2004).
15
Vegetation
Ecological setting
The vegetation of Central Karakoram National Park grows only in a small percentage of the park
area. This is a consequence of different abiotic factors which constraints plants growth: the high
average elevation which reduces temperature and the length of the growing season, the rough relief
and large glacial masses which restrict the area suitable for plants establishment, the continental
climate and rain-shadow caused by the mountain massifs and their impact on precipitation
distribution along altitudinal gradient. In particular, temperature is a limiting factor at higher
elevations (above 4500 m) while insufficient water availability during the growing season is
impeding plants growth at lower altitudes (below 2000 m, where natural vegetation is mainly found
around water bodies as streams or lakes). Additionally, natural floristic composition has been
affected by the millennium-old human presence that impacted and modified the vegetation
components both directly (i.e. clearings of forest for pastureland and cultivated areas) and indirectly
(i.e. prolonged grazing by livestock). Nevertheless, different vegetation types grow in the CKNP and
they are of major importance both for ecological reasons (e.g. as habitat for wildlife, biodiversity
conservation, etc) and for the sustainment of local communities (e.g. for the provision of grazing
ground, firewood, timber, etc). Additionally environmental services like protection from soil erosion,
regulation of water quantity and quality, nutrient recycling are being provided.
The plant communities present in Central Karakoram National Park are of particularly interest
since the park location in the transition zone between sub-tropical humid condition to the south and
continental dry climate of northern areas. Indeed, inside the CKNP borders, this transition is evident
moving from southwest towards northeast. CKNP can therefore ideally be divided into two main
ecological zones: a southwest part, around Gilgit district, which is relatively warmer and partially
influenced by the summer monsoon and the northeast part, felling mostly in Skardu district which is
characterized by a more continental climate (Treydte et al., 2006). This climate patterns have a major
influence on vegetation characteristics and distribution: it is of particularly interest to deeply evaluate
the effect of climate transition on the CKNP forest resources, especially for their importance in the
livelihoods of local communities. Overall, the South-Western sector is characterized by a forest
composition and structure which is richer both in area, biomass and species. Most of the largest
forests of CKNP are located in the Southern lateral valleys of the main Gilgit river valley (with few
exceptions on the southern border of CKNP along Indus River). Good examples of those rich forest
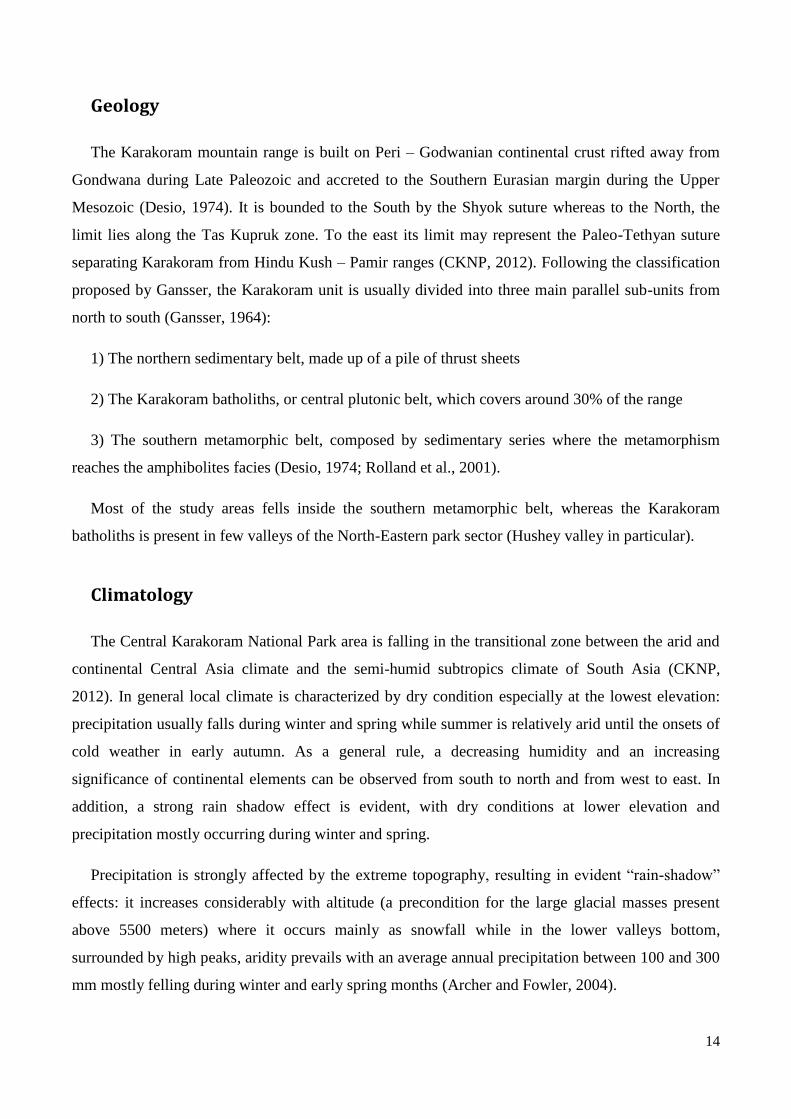
16
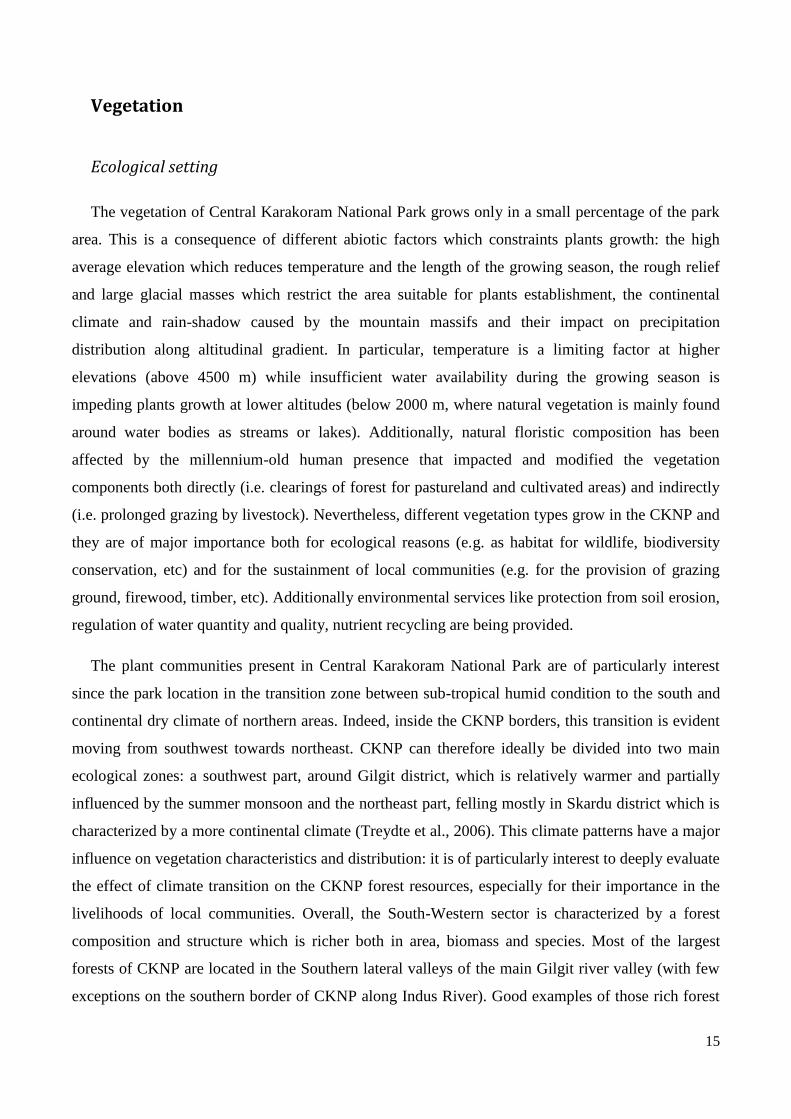
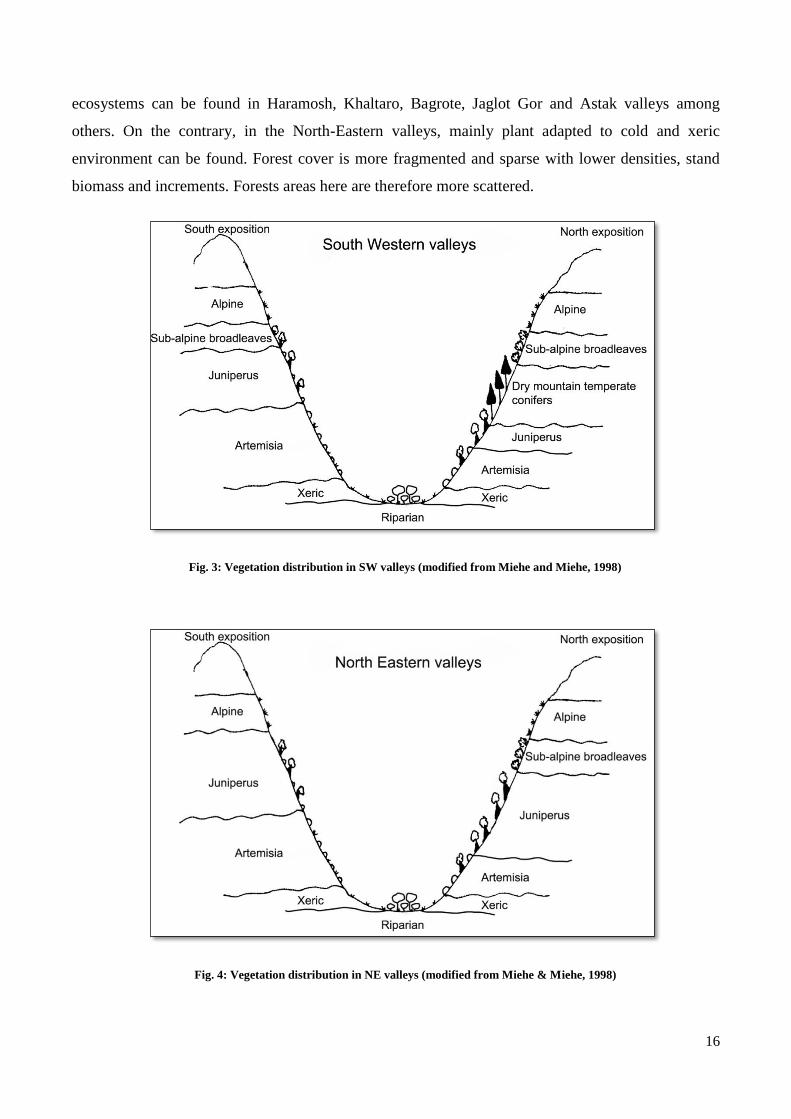
ecosystems can be found in Haramosh, Khaltaro, Bagrote, Jaglot Gor and Astak valleys among
others. On the contrary, in the North-Eastern valleys, mainly plant adapted to cold and xeric
environment can be found. Forest cover is more fragmented and sparse with lower densities, stand
biomass and increments. Forests areas here are therefore more scattered.
Fig. 3: Vegetation distribution in SW valleys (modified from Miehe and Miehe, 1998)
Fig. 4: Vegetation distribution in NE valleys (modified from Miehe & Miehe, 1998)
17
Vegetation types
Vegetation types, which partially follow the classification proposed by Champion et al. (1965),
have been formulated according to the species composition and, therefore, as a consequence of the
most prominent ecological processes shaping their geographic distribution (Ahmed et al., 2006;
Akbar et al., 2010; Akbar et al., 2011; Champion et al., 1965; Du, 1998; Eberhardt et al., 2007).
Overall, inside the CKNP limits 4 forests and 3 shrub-lands types can be recognized.
Climate (especially temperature and water availability) is the main driver which influence species
distribution in the park area (Miehe and Miehe, 1998). At valley level, instead, aspect and
morphology leads to a series of common distribution patterns although with differences from valley
to valley (Fig.3 and Fig 4).
To describe CKNP vegetation we will follow an ideal transect, starting from the valley bottom
and gradually increasing altitude until we will reach the snowline.
In close proximity to river/streams, in all CKNP valleys, a plant community adapted to this
seasonally humid but disturbed environment, characterized by frequent floods, draughts, and
landslides is common: riparian vegetation. Broadleaved species as willows (Salix spp.), poplars
(Populus spp.), sea-buckthorns (Hippophae rhamnoides ssp. Turkestanica) and Tamarisk (Tamarix
ramosissima) are the prominent species. Unlike the other vegetation belts, the distribution of this
community is not altitude driven (it can be found from 1800 up to 3000 m) but its limited by air and
soil moisture derived from water bodies. For this reason it can be described as an “azonal” vegetation
which usually has a linear shape, few tens of meters large. The closeness to villages and fields has an
effect on riparian vegetation, which is often managed by local communities. Poplar is mainly
managed for timber production, while sea-buckthorns and willows for firewood. Fruit trees are also
diffuse.
Where the river moisture effect ends, as the humidity derived by the presence of stream decreases
exponentially with distance, the dry environment is hampering the growth to most plants. Only the
most drought resistant species with particular physiological adaptation to couple with this harsh
environment, like Capparis himalayensis, Ephedra spp and Cardus spp can develop, but their cover
is sparse and fragmented. Xeric vegetation is frequent in all valleys, starting from 1600 m. At lower
elevation those communities develop mainly in shaded, north-exposed areas, while at higher
elevation they are mainly confined in the most dry and sunny locations (2000/2200 m a.s.l.).
18
Moving at higher elevations (above 2200 m), precipitation and water availability gradually
increase, allowing the development of a steppe-like community of perennial shrubs adapted to xeric
environment. Among the most representative species, Artemisia (Artemisia brevifolia, Artemisia
wellby, Artemisia fragrans, Artemisia brevifolia) is common all over the CKNP boundaries and
characterizes this vegetation belt (Artemisia shrub-land). Other species include Agrostis spp,
Astragalus spp. few tree species, adapted to grow in xeric locations as Junipers can be found in
protected location. Artemisia shrub-land is often grazed during autumn and winter months by
livestock. In the coldest and driest valleys of CKNP (like Braldu) the stems and roots of those bushes
are collected and used as firewood (Flury, 2012). Additionally, Artemisia shrub-land can be the
result of a persistent and long-lasting degradation of more fertile vegetation belt (as Juniperus shrub-
land/forest).
As altitude increase, from approximately 2600 m, stands of Junipers (Juniperus spp.) are frequent
(Juniperus shrub/forest). The ecological plasticity of those species is remarkable: often isolated trees
are found in inaccessible locations on very steep mountain sides where just a small pocket of soil
might be available. The stands biomass and increment is correlated to water availability: at higher
altitude, or where water availability is more abundant, Juniperus become denser and taller (>5 m in
height). In those areas, Juniperus can be classified as forests according to FAO definition (UN-ECE
and FAO, 2000). At lower elevation or in the drier sites instead, sparse individuals are growing in
between Artemisia shrubs (Juniperus shrub-land). Three species of Juniperus have been recorded by
far in the CKNP (Juniperus excelsa ssp polycarpos, Juniperus semiglobosa and Juniperus
pseudosabina). Other shrub species are usually available: Berberis spp., Caragana gerardiana, Rosa
webbiana among others. Juniperus trees are the preferred species for firewood thanks to their dry and
fragrant wood. Consequently a long lasting harvesting resulted in degradation of stands located in
proximity to villages and a reduction of their spatial diffusion. Nevertheless, inside CKNP borders,
Juniperus are still very common and diffuse in most of the valleys: generally, in northern exposed
location, they can be found at lower elevation, compared to the drier and warmer southern exposed
sides. However, while in the North-Eastern sector of the park they are the only forest biomes to be
found up to the sub-alpine broadleaved forests, in the more humid sides of the South-Western part,
from around 3000 m, this community is substituted by the mountain dry temperate forests. Here
Junipers stands above 3000 m are confined in steep and dry southern exposed mountain sides.
The above mentioned differences in climate between SW and NE sector of CKNP, affect heavily
the diffusion of species inside the CKNP. This is particularly evident for the typical mountain dry
temperate forest vegetation belt of the Western Himalayan/Karakoram range (IUCN, 2003b),
19
characterized by tall conifer trees as Pinus wallichiana and Picea smithiana mixed or in purity. This
community, living in areas characterized by a strong relief, high precipitation (for CKNP standard)
mostly felling during the winter months and a strong continental climate, is naturally scarce,
occurring mainly at an altitude between 2800 and 3800 m a.s.l.. The most forest rich areas are
generally located on the shaded Northern and Eastern slopes (due to higher water availability) or on
the frontal and lateral glacier moraine (deeper soils). In general, trees growth is strongly favored in
areas where snow accumulation and melting can guarantee sufficient water availability during the
growing season. Those conditions are mainly met in the South-Western valleys. Few stands of those
species are present in the valleys north of the Rakaposhi-Diran-Spantik ridge and east of the Shigar
valley: Pinus wallichiana has been recorded in Shaghar Logma, Doko and Besil valleys (in Basha)
and Baumaharel (Shigar). Moreover, Picea smithiana mixed with Pinus wallichiana is still present in
some lateral valleys of Nagar like Nilt, Minapin and Sumayar among others. Traditionally, mountain
dry temperate forest has been managed for the production of timber. Initially, this activity was
limited to fulfill local household needs but, following roads constructions in the Indus-Gilgit river
lateral valleys8, timber has been and occasionally is felled for the market in Gilgit or Skardu. Illegal
harvesting, lack of proper management guidelines and lack of regeneration is often threatening those
forests, which today appear often degraded (low stand densities, lack of small diameters).
The last forest belt, diffuse in the entire CKNP, to be found before the alpine meadows and shrub-
land is sub-alpine broadleaved forests. This is composed mainly by stand of Betula utilis and Salix
spp., located at high elevation (above 3500 m) where snow accumulation and avalanche guarantee
water availability throughout the short growing season (June-September). As a direct consequence
most of the stands are located on shaded north or northeast exposed mountain side. The largest birch
forests are found in the more humid southwest valleys. Traditionally, birch trees are used by the
shepherds: the outer white portion of the stem is peeled to obtain “paper” mainly used to pack the
local butter. This vegetation is often in a good conservation status since timber or firewood is rarely
harvested.
Above 3800-4000 m, the short growing season and the low temperatures do not allow the growth
of trees. Here herbs and few shrubs are abundant, identifying the Alpine meadows and shrubs-land
belt. Thanks to the relatively high summer rainfall, alpine meadows have a good fertility and are a
key-asset for the sustainment of local communities which relies heavily on this belt for the grazing of
8 Most of the lateral valleys of Indus and Gilgit river where reached by roads at the end of the 1980s – beginning of the 1990s.
20
livestock (during summer) (Miehe and Miehe, 1998). Through the centuries, alpine meadows lower
altitudinal limit have often been increased in size by local communities through clearings of sub-
alpine broadleaved forest, mountain dry temperate forest and Juniperus shrub-land/forest. Poa and
Carex genus are the most common plant members (CKNP IMP, 2009), but many other species are
present such as Kobresia spp, Bistorta spp, Polygonum spp.
These areas provide ideal habitats for many important mammalian species like Marcopolo sheep,
Blue sheep, ibex and marmots (EV-K2-CNR, 2009).
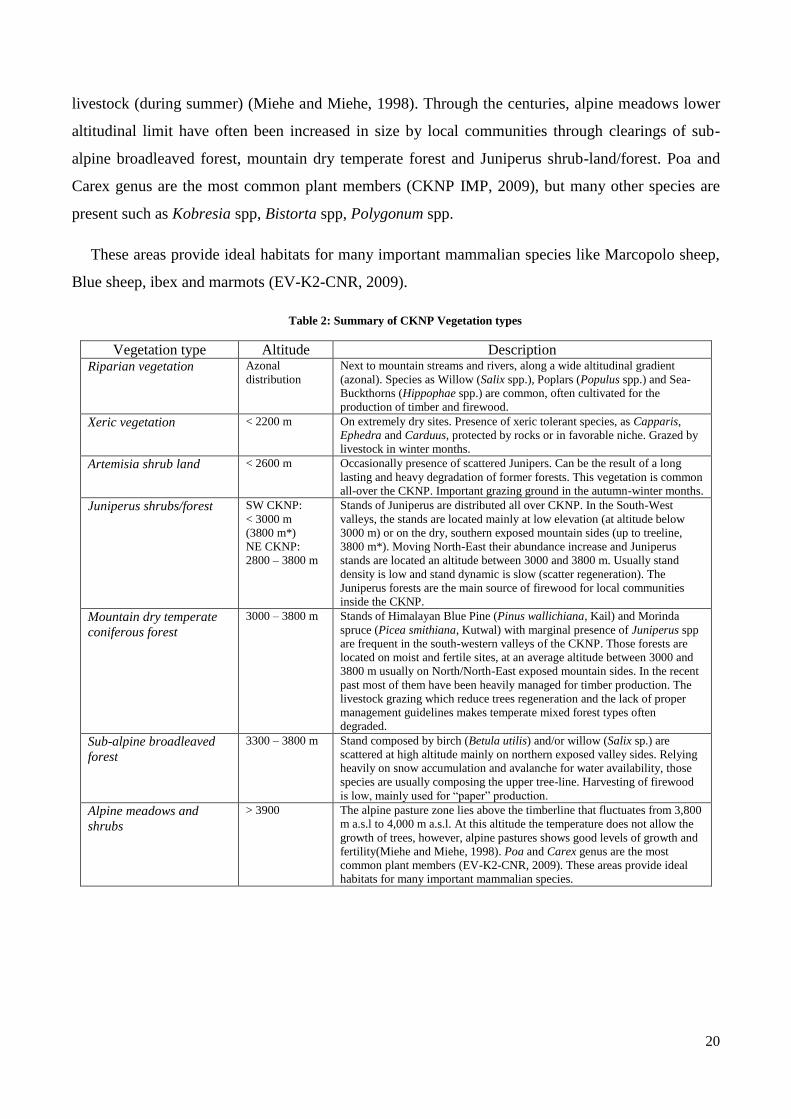
Table 2: Summary of CKNP Vegetation types
Vegetation type Altitude Description Riparian vegetation Azonal
distribution
Next to mountain streams and rivers, along a wide altitudinal gradient
(azonal). Species as Willow (Salix spp.), Poplars (Populus spp.) and Sea-
Buckthorns (Hippophae spp.) are common, often cultivated for the
production of timber and firewood.
Xeric vegetation < 2200 m On extremely dry sites. Presence of xeric tolerant species, as Capparis,
Ephedra and Carduus, protected by rocks or in favorable niche. Grazed by
livestock in winter months.
Artemisia shrub land < 2600 m Occasionally presence of scattered Junipers. Can be the result of a long
lasting and heavy degradation of former forests. This vegetation is common
all-over the CKNP. Important grazing ground in the autumn-winter months.
Juniperus shrubs/forest SW CKNP:
< 3000 m
(3800 m*)
NE CKNP:
2800 – 3800 m
Stands of Juniperus are distributed all over CKNP. In the South-West
valleys, the stands are located mainly at low elevation (at altitude below
3000 m) or on the dry, southern exposed mountain sides (up to treeline,
3800 m*). Moving North-East their abundance increase and Juniperus
stands are located an altitude between 3000 and 3800 m. Usually stand
density is low and stand dynamic is slow (scatter regeneration). The
Juniperus forests are the main source of firewood for local communities
inside the CKNP.
Mountain dry temperate
coniferous forest
3000 – 3800 m Stands of Himalayan Blue Pine (Pinus wallichiana, Kail) and Morinda
spruce (Picea smithiana, Kutwal) with marginal presence of Juniperus spp
are frequent in the south-western valleys of the CKNP. Those forests are
located on moist and fertile sites, at an average altitude between 3000 and
3800 m usually on North/North-East exposed mountain sides. In the recent
past most of them have been heavily managed for timber production. The
livestock grazing which reduce trees regeneration and the lack of proper
management guidelines makes temperate mixed forest types often
degraded.
Sub-alpine broadleaved
forest
3300 – 3800 m Stand composed by birch (Betula utilis) and/or willow (Salix sp.) are
scattered at high altitude mainly on northern exposed valley sides. Relying
heavily on snow accumulation and avalanche for water availability, those
species are usually composing the upper tree-line. Harvesting of firewood
is low, mainly used for “paper” production.
Alpine meadows and
shrubs
> 3900 The alpine pasture zone lies above the timberline that fluctuates from 3,800
m a.s.l to 4,000 m a.s.l. At this altitude the temperature does not allow the
growth of trees, however, alpine pastures shows good levels of growth and
fertility(Miehe and Miehe, 1998). Poa and Carex genus are the most
common plant members (EV-K2-CNR, 2009). These areas provide ideal
habitats for many important mammalian species.

21
Table 3: Broad distribution of Vegetation types according to the two “ecological zones” of CKNP. Based on field
observations.
Vegetation types SW valleys NE valleys
Riparian Frequent Present
Xeric vegetation Present Present
Artemisia shrub land Frequent Frequent
Juniperus shrub/forest Frequent Frequent
Mountain dry temperate coniferous Present Absent
Sub-alpine broadleaved Frequent Present
Alpine meadows and shrubs Frequent Frequent

23
CHAPTER 4
LIVELIHOODS IN THE CENTRAL KARAKORUM
NATIONAL PARK: A SURVEY
4.1 Introduction
Degradation of ecosystems and loss of biodiversity in mountain areas has lead to the creation of
numerous protected areas in developing countries and specific prescriptions aimed at the
conservation of their natural heritage were established (Leverington et al., 2010). Often, the
conventional management strategies applied involved top-down approaches, such as “fences and
fines” system, for which prohibition in access or use is a precondition for preservation of the natural
capital (Masozera et al., 2006). Those, however, led to widespread conflicts between authorities and
local communities, particularly evident where the latter are dependent on natural resources for their
subsistence (Maikhuri et al., 2000; Wells et al., 1992). A paradigm shift towards decentralization and
devolution has been promoted to counteract and mitigate those negative effects: the responsibility for
protection has been gradually held back to communities, paving the way for what today is commonly
called Community Based Management (CBM) (Fisher, 1999). In CBM, communities are the target
for assessing natural resource uses, problems, trends and opportunities. By incorporating them in the
management system, their experiences, values and capacity are preserved, resulting in higher level of
acceptance and sense of ownership both positively correlated with natural resource conservation
(Ellis and Porter-Bolland, 2008; Sam and Shepherd, 2011).
However, CBM can be achieved if communities gain the knowledge and abilities to manage
actively the resources, as unsuccessful stories are common, Pakistan included (Geiser and Steimann,
2004; Gohar, 2002; Hasan, 2007; Knudsen, 1999; Knudsen, 2011). The present study, conducted in 9
valleys, aims to set the basis for developing CBM in the Central Karakorum National Park.
24
According to the regulation applied in the Protected Areas of Pakistan Northern Areas province9,
indeed, the use of natural resources, forest included, is strictly controlled by government which holds
all the use rights in a classic “Top-down” system (Ali et al., 2006; Khan and Khan, 2009; Shahbaz et
al., 2007). Communities, on the contrary, are left with secondary usufruct (i.e. grazing right in forest,
firewood collection from dead or diseased trees) (IUCN, 2003b). Therefore, before proceeding
towards a relaxation of the existing regulations, we intended to deeply investigate how local
communities are actually managing natural resources with a specific focus on forests and grazing
land. We organized a set of focus groups in selected valleys to obtain a comprehensive overview of
CKNP livelihoods, to raise community involvement in forest related decisions and increase their
participation.
4.2 Materials and methods
4.2.1 Study area
The study area is located in the Central Karakorum National Park, Gilgit-Baltistan province,
Pakistan (75°43’ E 35°51' N). Approximately 100.000 inhabitants are living along the Park valleys.
Those are mostly self-sufficient farmers heavily relying on locally produced agriculture products and
sheep/goat breeding. They are dependent on wood for fire (cooking, heating) and construction
purposes. Three ethnics groups are living in the Park valleys: Baltì in the eastern valleys (Skardu
area), Shinaa in the south western (Gilgit area), Burushaski in the north western (Hunza area).
Access rights, rules and uses of natural resources, mainly forests and pastures, are typically
managed by the Tsarmas/Jirga at village-level. Those are the traditional council of elders (in
Baltistan and Gilgit area, respectively) which are also holding the knowledge of the area (borders,
property rights etc). Due to economic and time constraints the research on livelihoods was conducted
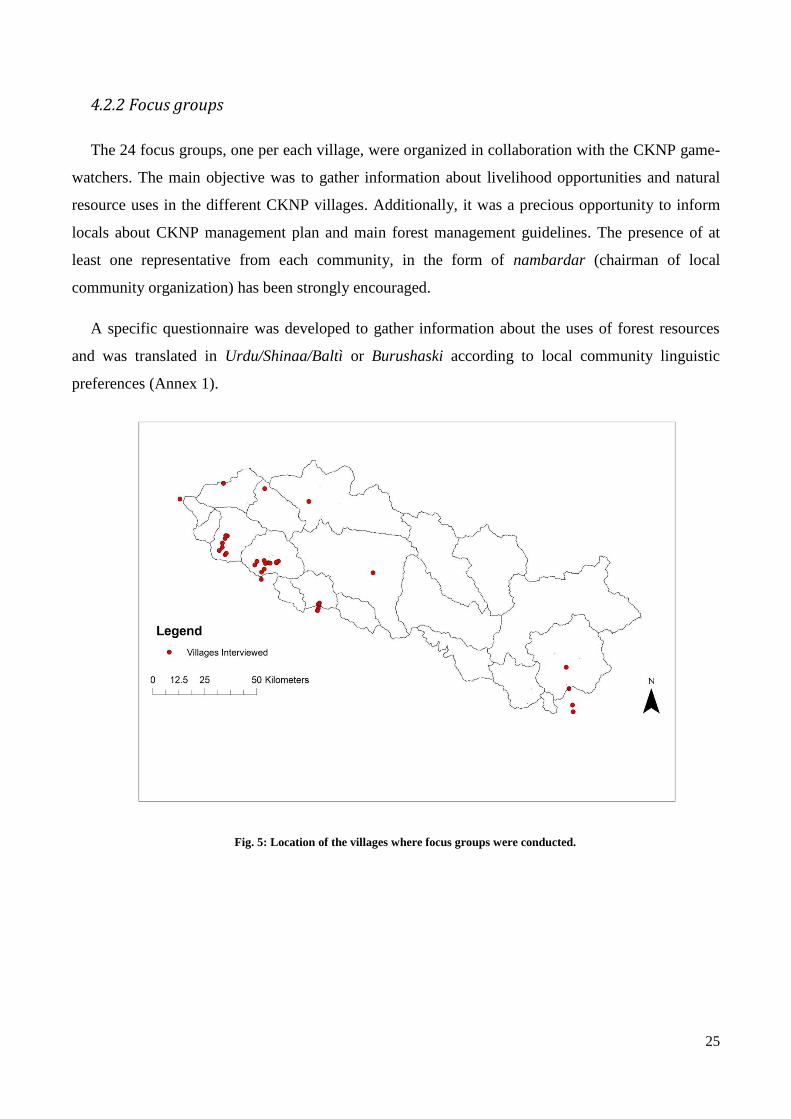
in 24 villages of 9 valleys (Fig. 5).
9 The Northern Areas Wildlife Preservation Act (1975) describe all the activities which are allowed within the boundary of a
Park. The fifth rule states that no person shall “Cause any bush or grass fire (except at designated places) or cut, destroy, injure or
damage in any way any tree or other vegetation in a National Park;
25
4.2.2 Focus groups
The 24 focus groups, one per each village, were organized in collaboration with the CKNP game-
watchers. The main objective was to gather information about livelihood opportunities and natural
resource uses in the different CKNP villages. Additionally, it was a precious opportunity to inform
locals about CKNP management plan and main forest management guidelines. The presence of at
least one representative from each community, in the form of nambardar (chairman of local
community organization) has been strongly encouraged.
A specific questionnaire was developed to gather information about the uses of forest resources
and was translated in Urdu/Shinaa/Baltì or Burushaski according to local community linguistic
preferences (Annex 1).
Fig. 5: Location of the villages where focus groups were conducted.
26
4.3 Results
4.3.1 Utilization of natural resources
The communities living around CKNP are heavily dependent on natural resources located inside
and around the park boundary. The livelihoods opportunities are strongly tied with the availability of
resources, the location of the villages (i.e. altitude), climate, availability of water and easiness of road
connections. Comprehensively, all community but one (Minapin Nagar) are mainly relying on goods
(output) produced from local activity (input): i.e. food (agriculture), fruits (orchards), dairy and meat
(livestock), timber (forest), non-wood forest products (forest). Mining, as tourism, are important
natural assets only for few villages and not all the household are usually involved in such activities.
Thus, benefit sharing is not equally distributed.
Generally the livelihood in the research area can be defined as “Combined-mountain-agriculture”
following Kreutzmann definition (Kreutzmann, 2004). This is a typically mountainous livelihood
scheme in which livestock, agriculture and horticulture, and forest harvesting and non-wood forest
products collection are fundamental activities performed at different times of the year in a cycle,
along altitudinal gradients. The timing of the cycle is decided by the climate of the area and might
vary from village to village and in between valleys. Here we will define the main steps, similar
through all the study area. During springs, the fields are ploughed and grains are sowed.
Consequently, household’s livestock is moved out of villages to the lower pastures, free of snow, to
protect cultivated areas from animal browsing. As the season advance, livestock is gradually moved
at higher elevation to the summer pasture (July-August) above the timberline (4500 m a.s.l.). In the
mean time, crops are grown and finally harvested. Therefore, livestock can gradually returns to lower
pastures and to stables at village levels (November). There, they will stay during all winter
(November – March) until successive spring, feeding on the crop residuals and hay collected during
summer stored and dried by the households. From summer to early autumn, orchards production is
collected and dried, eventually being sold to the nearest city market. In the villages where
productivity is higher (lower elevation), fruits is an important component of the households
economic portfolio.
During summer and autumn months, firewood and timber, where available, are harvested from
local forests and used for construction or as firewood reserve for the following winter. In few valley
timber and more rarely firewood is illegally sold to the market.
27
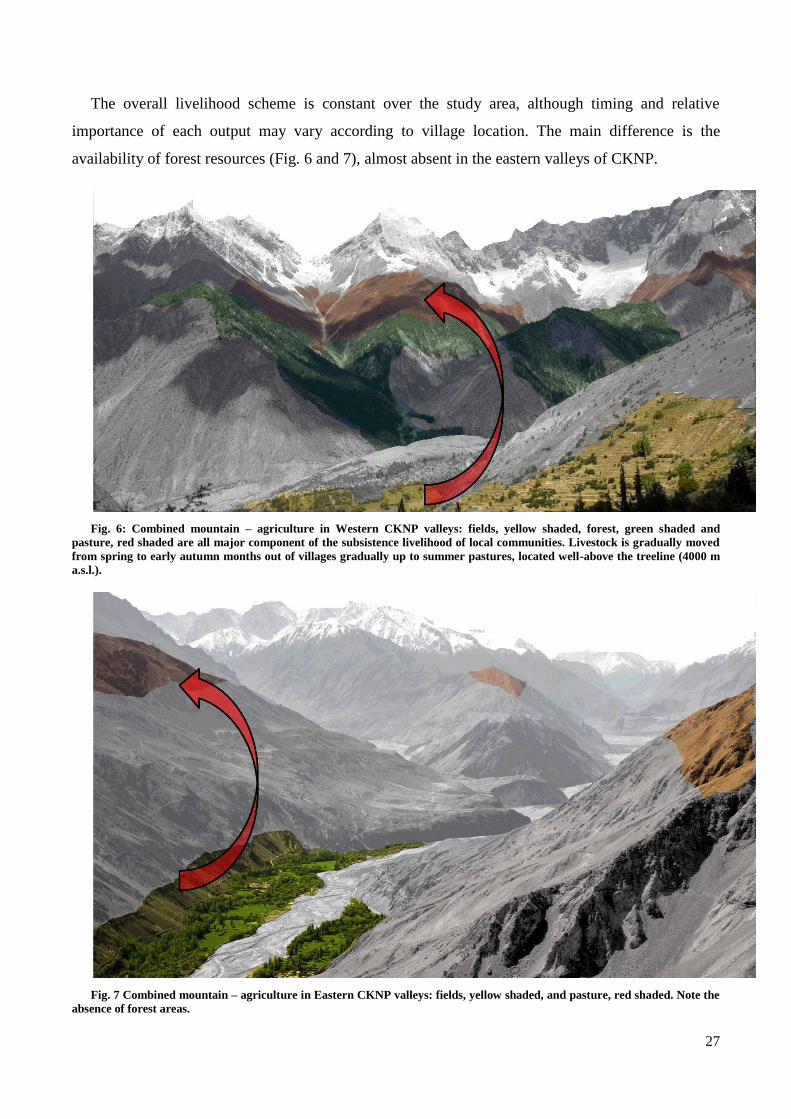
The overall livelihood scheme is constant over the study area, although timing and relative
importance of each output may vary according to village location. The main difference is the
availability of forest resources (Fig. 6 and 7), almost absent in the eastern valleys of CKNP.
Fig. 6: Combined mountain – agriculture in Western CKNP valleys: fields, yellow shaded, forest, green shaded and
pasture, red shaded are all major component of the subsistence livelihood of local communities. Livestock is gradually moved
from spring to early autumn months out of villages gradually up to summer pastures, located well-above the treeline (4000 m
a.s.l.).
Fig. 7 Combined mountain – agriculture in Eastern CKNP valleys: fields, yellow shaded, and pasture, red shaded. Note the
absence of forest areas.
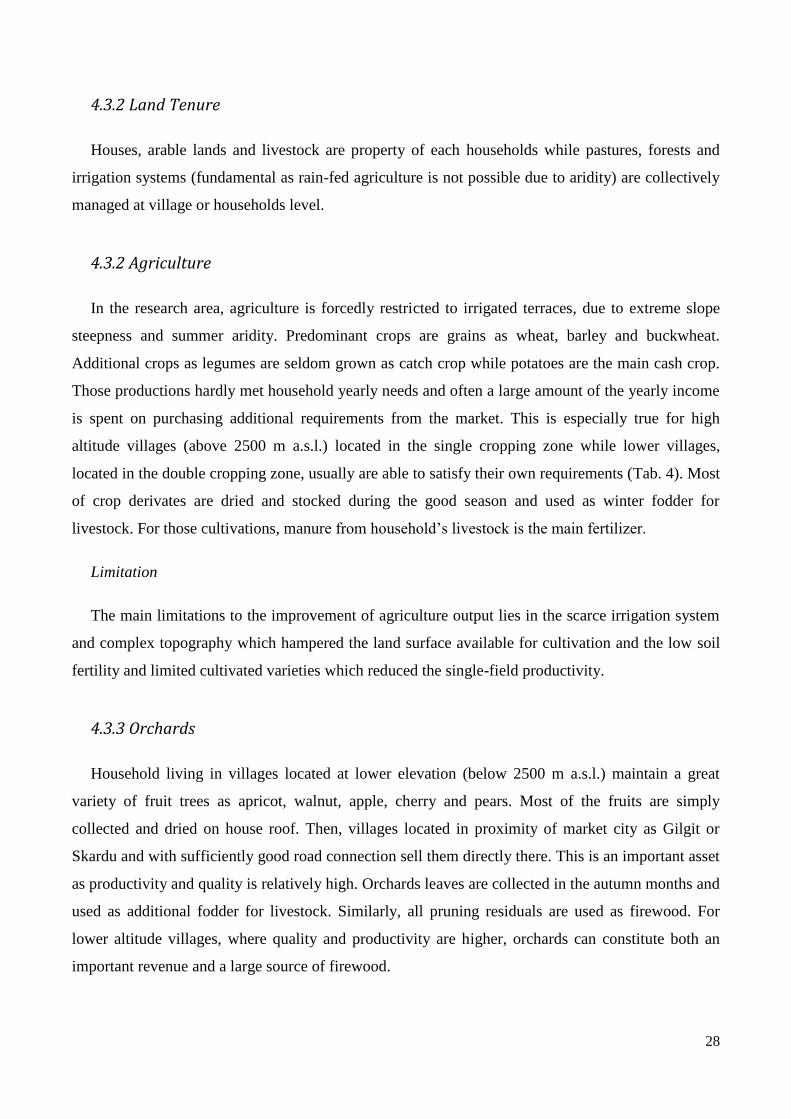
28
4.3.2 Land Tenure
Houses, arable lands and livestock are property of each households while pastures, forests and
irrigation systems (fundamental as rain-fed agriculture is not possible due to aridity) are collectively
managed at village or households level.
4.3.2 Agriculture
In the research area, agriculture is forcedly restricted to irrigated terraces, due to extreme slope
steepness and summer aridity. Predominant crops are grains as wheat, barley and buckwheat.
Additional crops as legumes are seldom grown as catch crop while potatoes are the main cash crop.
Those productions hardly met household yearly needs and often a large amount of the yearly income
is spent on purchasing additional requirements from the market. This is especially true for high
altitude villages (above 2500 m a.s.l.) located in the single cropping zone while lower villages,
located in the double cropping zone, usually are able to satisfy their own requirements (Tab. 4). Most
of crop derivates are dried and stocked during the good season and used as winter fodder for
livestock. For those cultivations, manure from household’s livestock is the main fertilizer.
Limitation
The main limitations to the improvement of agriculture output lies in the scarce irrigation system
and complex topography which hampered the land surface available for cultivation and the low soil
fertility and limited cultivated varieties which reduced the single-field productivity.
4.3.3 Orchards
Household living in villages located at lower elevation (below 2500 m a.s.l.) maintain a great
variety of fruit trees as apricot, walnut, apple, cherry and pears. Most of the fruits are simply
collected and dried on house roof. Then, villages located in proximity of market city as Gilgit or
Skardu and with sufficiently good road connection sell them directly there. This is an important asset
as productivity and quality is relatively high. Orchards leaves are collected in the autumn months and
used as additional fodder for livestock. Similarly, all pruning residuals are used as firewood. For
lower altitude villages, where quality and productivity are higher, orchards can constitute both an
important revenue and a large source of firewood.
29
Limitation
Orchards diffusion is limited by both environmental factors as land availability and water scarcity,
as well as limited productive capacity and infrastructure (fruit procession facility).
4.3.4 Agro-forestry
Poplars (Populus spp.) and willows (Salix spp.) are the predominant plantation grown around
fields and villages. Poplars can be successfully grown in villages up to 3000 m a.s.l. however, as
growing rate decrease sharply with elevation, they are more diffuse at lower elevation where they
assume an important role in timber production. Similarly to orchards, pruning residuals and leaves
are used as firewood and fodder respectively. Poplar became relatively abundant in the last 20 years
following large scale supporting campaign by NGOs. No coppice plantation system is used
specifically for firewood production. To protect fields from livestock browsing during early spring,
when animals are not yet moved to higher elevation pastures, linear hedge of Russian olives
(Seabuckthorn, Hippophae spp.) are common. Those are seldom used as firewood, especially in drier
areas.
Limitation
Main limitation in higher diffusion in agro-forestry is the lack of land and specific species.
4.3.5 Livestock
Goats, sheep, cattle, yak and crossbreed of cow and yak are common all over the study area. Goat
and sheep share in total household livestock are particularly large in lower altitude villages, whereas
cows, yaks, and crossbreed, tend to be more common in higher altitude villages, probably as a
consequence of larger and more fertile grasslands (Tab. 4). While goat, sheep and cows are grazing
in managed pastures, yaks are free roamers: during summer in high altitude pastures (> 4500 m a.s.l.)
as well as in winter (around forest or in intermediate pastures (3500 m a.s.l.)). The amount of
livestock is variable from village to village, according to pasture size and fertility, and among
household within a village (Tab. 4). However, through all the study area, livestock represent the most
valuable asset for households, thanks to relatively high prices of selling animals in the market and
the good value of the dairy products (mainly butter). Just to mention, one goat average price is
30
between 10 and 15.000 Rps (between 70 and 100 €10
). Moreover, animals can be readily sell in case
of economic shortages.
The alpine pastures, in the framework of combined-mountain-agriculture, constitute a key
resource for households, which organize the grazing mainly according to two schemes:
1) The household leave most of its animals to a shepherd, which will have the responsibility to
move the animals in the different pastures until autumn months (Nov).The shepherd keeps all
the dairy products as a payment or exchange the 50% for a certain amount of grains (usually
1 kg of butter equals to 5 kg of grains). In this case, few huts are usually available in the
largest pastures.
2) Each family moves his own livestock during the spring and summer months to the upper
pastures. In villages where amount of animals is not very large, several families might join
together their livestock, each keeping them for one/two weeks. Usually several huts are
located in pasture zones.
Rather than a single upward movement to summer pastures, the grazing is organized in a cycle
where each single intermediate pasture is used for several weeks both on the upward and downward
movement to/from summer higher pastures (Fig. 8). Regulation in the grazing-land uses are mainly
adopted at village level, through a specific commission. Those decides the timing at which livestock
should be moved out of the village and the use rights of all the village pastures.
Limitation
Key limiting factor for the livestock size is represented by scarcity of fodder during the winter
season, between November and March, when animals are kept and fed in households houses. At that
time, all the available fodder collected in summer is used and often additional reserves are purchased
from the market or from other households. Diseases and predations negatively affect household
livestock size even if usually to a lesser extent.
10 Considering January 2014 exchange rate (1 € = 144 Pakistan Rupees).
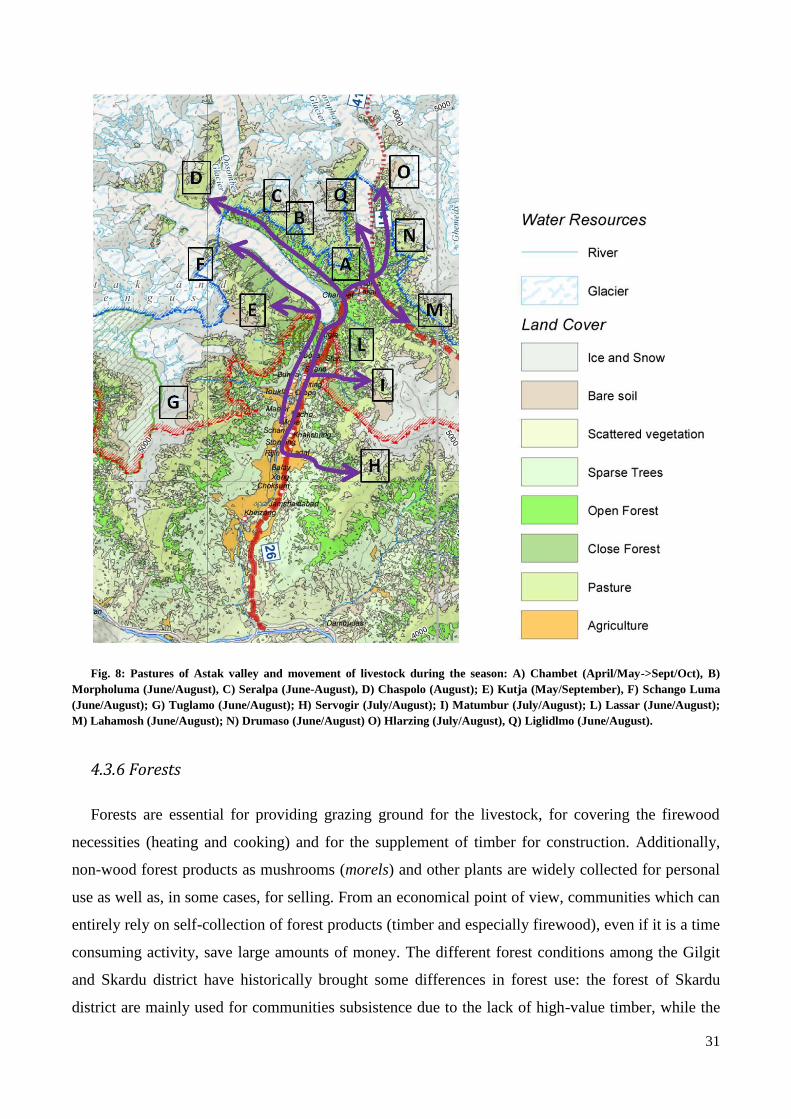
31
Fig. 8: Pastures of Astak valley and movement of livestock during the season: A) Chambet (April/May->Sept/Oct), B)
Morpholuma (June/August), C) Seralpa (June-August), D) Chaspolo (August); E) Kutja (May/September), F) Schango Luma
(June/August); G) Tuglamo (June/August); H) Servogir (July/August); I) Matumbur (July/August); L) Lassar (June/August);
M) Lahamosh (June/August); N) Drumaso (June/August) O) Hlarzing (July/August), Q) Liglidlmo (June/August).
4.3.6 Forests
Forests are essential for providing grazing ground for the livestock, for covering the firewood
necessities (heating and cooking) and for the supplement of timber for construction. Additionally,
non-wood forest products as mushrooms (morels) and other plants are widely collected for personal
use as well as, in some cases, for selling. From an economical point of view, communities which can
entirely rely on self-collection of forest products (timber and especially firewood), even if it is a time
consuming activity, save large amounts of money. The different forest conditions among the Gilgit
and Skardu district have historically brought some differences in forest use: the forest of Skardu
district are mainly used for communities subsistence due to the lack of high-value timber, while the
32
richest forest in the south-eastern sector of Gilgit district have been (and in some cases are still)
illegally felled for selling timber in the local markets (Ali et al., 2005; Ali et al., 2006).
A large majority of the communities, realized that most of forest are under pressure, have tried
with different degrees of success to limit their exploitation through the creation of specific forest
committees. Those in some areas have been successful in reducing the forest degradation (as in
Bagrote and Khaltaro) while in other areas like Haramosh and Jaglot Gor were unable to effectively
tackle deforestation and corruption which today are still very common.
Timber
Most of the high value timber (mainly Pine and Spruce) is located in the southern valleys of Gilgit
district. Consequently, villages with little access to high forests or located in forest scarce areas,
organized private/common poplar plantations for obtaining construction wood and firewood is the
only product harvested from natural forests. In those realities accessibility to the forest has not been
regulated or restricted yet and average annual timber wood needs per household, obtained from the
plantation, has been estimated to be 500 Mg per household per year.
On the contrary, in forest rich villages timber harvesting is usually regulated and represent an
important share in total household livelihood revenues. All the timber harvested in those valleys shall
be considered illegal, as local laws allow the cutting of trees only if previously marked and signed by
forest officials. However, in practice, this is hardly happening and locals decide by themselves where
and how much to cut. Usually a commission is setting a certain amount (in n° of logs) harvestable for
each household. It is important noting that use rights are maintained even by households now
residing in nearby villages/cities. Those are allowed to cut the same amount of local residents.
The usual amount harvestable is around 100/200 logs per household per year. From a large tree,
locals usually obtain around 50 logs. The value of a large tree harvested, divided into logs and
transported to the nearest city (Gilgit or Skardu), can vary between 100.000 Rps (Picea) and 125.000
(Pinus)11
. It is evident, therefore, the high importance that forest harvesting represent in the
livelihood of forest-rich communities.
11 In between 700 and 900 € considering January 2014 exchange rate. Transport from Barchi/Dassu forest (Haramosh)
to Gilgit city can be up to 200 € per tree.
33
Firewood
Firewood is by far the most important wood products harvested from CKNP forests, covering
more than 75% of the total forest utilization, as organic carbon is used for heating and cooking and
not feasible alternative are found at the moment. This is a consequence both of the cold climate and
the high cost of purchasing firewood from local markets (700 Rps per 40 kg in Skardu12
). The
preferred firewood is Juniperus, a very common but slow growing species, followed by shrubs,
Artemisia roots, dung and riparian vegetation (as Seabuckthorn) all important component of
household fuel portfolio. Additionally, fruit trees pruning residuals are often being used and their
relative importance increases in those villages where orchards, being an important income source,
are diffuse. Only Minapin Nagar, thanks to its location along Karakorum Highway and the higher
revenues related to other economic sources, shifted to gas/LPG cooking systems.
In most of the villages there is no restriction/indication on firewood harvestable amounts and
locations, but there are exceptions like Hushey village (where a ban has been imposed on some
degraded forests close to the village) or few location in Astak valley. What is usually put in practice
is a ban on selling of firewood to nearby villages or cities, at the moment heavily regulated in most
villages.
Considering wood consumptions, the amount of firewood yearly used obviously decreases from
the higher villages (apr. 4000 kg/household/year) to the lower one (2000 kg/household/year).
Similarly the share of firewood collected from natural forests decreases from 100% for the villages
in proximity of forested areas (higher altitude) to almost 0 of the ones far away from them or located
the valleys with scarce forest resources. These villages are mainly using dry livestock dung or
orchards residuals to overcome their firewood needs.
Non-wood Forest product
Few non-wood forest product assume an economical significance for local communities. In
particular, morels mushroom represent the most important one. Collected in spruce and pine forests
from late spring until early autumn, they are dried and sold in Skardu or Gilgit market city. The
average price for a kg of good quality dry mushroom can reach 11000/12000 Rps13. No large scale
12 Equals to 5€ per 40 kg transport included (Skardu). In Astak, firewood is sold locally at 2€ per 40 kg.
13 70-80€ per kg dry.

34
processing or drying facility is available and usually only few households (mainly shepherd or young
people) is actively searching for them during most of the season.
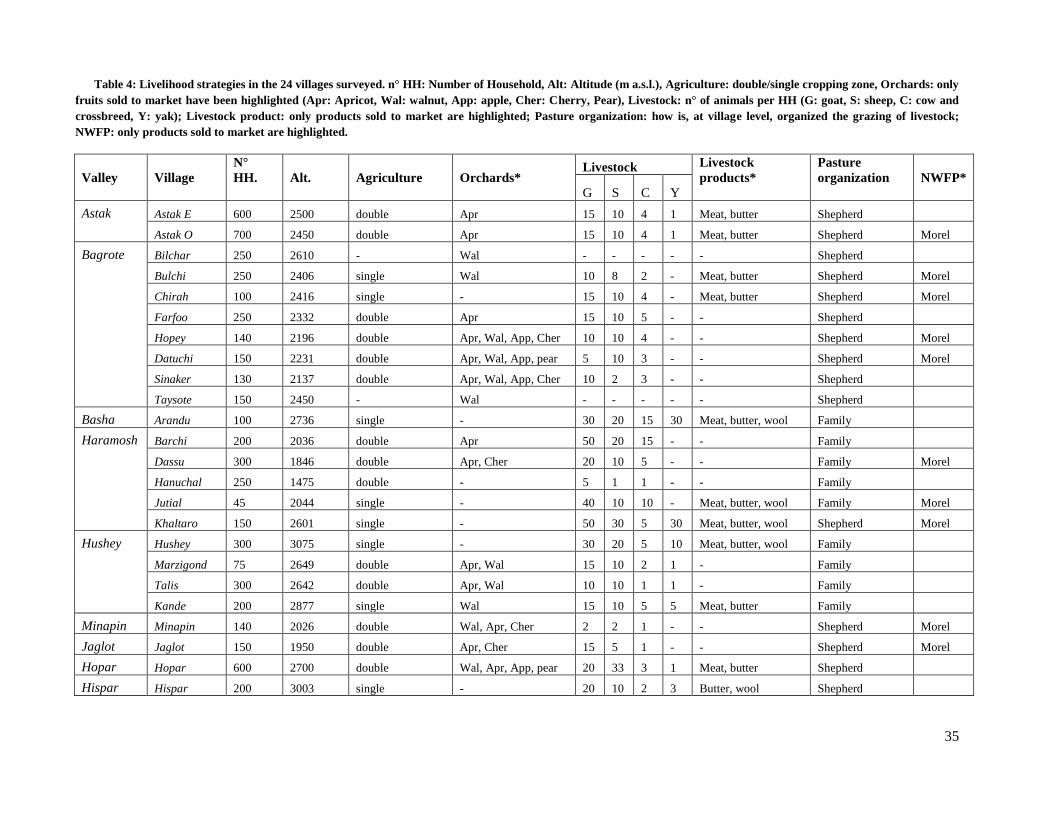
35
Table 4: Livelihood strategies in the 24 villages surveyed. n° HH: Number of Household, Alt: Altitude (m a.s.l.), Agriculture: double/single cropping zone, Orchards: only
fruits sold to market have been highlighted (Apr: Apricot, Wal: walnut, App: apple, Cher: Cherry, Pear), Livestock: n° of animals per HH (G: goat, S: sheep, C: cow and
crossbreed, Y: yak); Livestock product: only products sold to market are highlighted; Pasture organization: how is, at village level, organized the grazing of livestock;
NWFP: only products sold to market are highlighted.
Valley
Village
N°
HH.
Alt.
Agriculture
Orchards*
Livestock Livestock
products*
Pasture
organization
NWFP*
G S C Y
Astak Astak E 600 2500 double Apr 15 10 4 1 Meat, butter Shepherd
Astak O 700 2450 double Apr 15 10 4 1 Meat, butter Shepherd Morel
Bagrote Bilchar 250 2610 - Wal - - - - - Shepherd
Bulchi 250 2406 single Wal 10 8 2 - Meat, butter Shepherd Morel
Chirah 100 2416 single - 15 10 4 - Meat, butter Shepherd Morel
Farfoo 250 2332 double Apr 15 10 5 - - Shepherd
Hopey 140 2196 double Apr, Wal, App, Cher 10 10 4 - - Shepherd Morel
Datuchi 150 2231 double Apr, Wal, App, pear 5 10 3 - - Shepherd Morel
Sinaker 130 2137 double Apr, Wal, App, Cher 10 2 3 - - Shepherd
Taysote 150 2450 - Wal - - - - - Shepherd
Basha Arandu 100 2736 single - 30 20 15 30 Meat, butter, wool Family
Haramosh Barchi 200 2036 double Apr 50 20 15 - - Family
Dassu 300 1846 double Apr, Cher 20 10 5 - - Family Morel
Hanuchal 250 1475 double - 5 1 1 - - Family
Jutial 45 2044 single - 40 10 10 - Meat, butter, wool Family Morel
Khaltaro 150 2601 single - 50 30 5 30 Meat, butter, wool Shepherd Morel
Hushey Hushey 300 3075 single - 30 20 5 10 Meat, butter, wool Family
Marzigond 75 2649 double Apr, Wal 15 10 2 1 - Family
Talis 300 2642 double Apr, Wal 10 10 1 1 - Family
Kande 200 2877 single Wal 15 10 5 5 Meat, butter Family
Minapin Minapin 140 2026 double Wal, Apr, Cher 2 2 1 - - Shepherd Morel
Jaglot Jaglot 150 1950 double Apr, Cher 15 5 1 - - Shepherd Morel
Hopar Hopar 600 2700 double Wal, Apr, App, pear 20 33 3 1 Meat, butter Shepherd
Hispar Hispar 200 3003 single - 20 10 2 3 Butter, wool Shepherd
36
4.4 Conclusion
Local communities living in the Central Karakorum National Park valleys are heavily
dependent on natural resources and their livelihoods were traditionally shaped over a fragile
equilibrium with natural resources availability. Increase in population and change in
traditional living conditions, have recently modify this equilibrium which today seems to be
lost, as their use of natural resources have probably reached, in many areas, an unsustainable
rate. Specifically, the possibilities to control or limit their exploitation rate for forest products
and their use of grazing lands is limited if no alternative measures are being provided.
However, the diffuse mismanagement and the limited knowledge in restoring degraded
ecosystem leave space for mitigation measures which might partially counteract the
predominant trend. Working in collaboration with the community, acknowledging first their
problems and solving them with a capacity building perspective, are to be considered the only
feasible options for reducing the degradation processes.
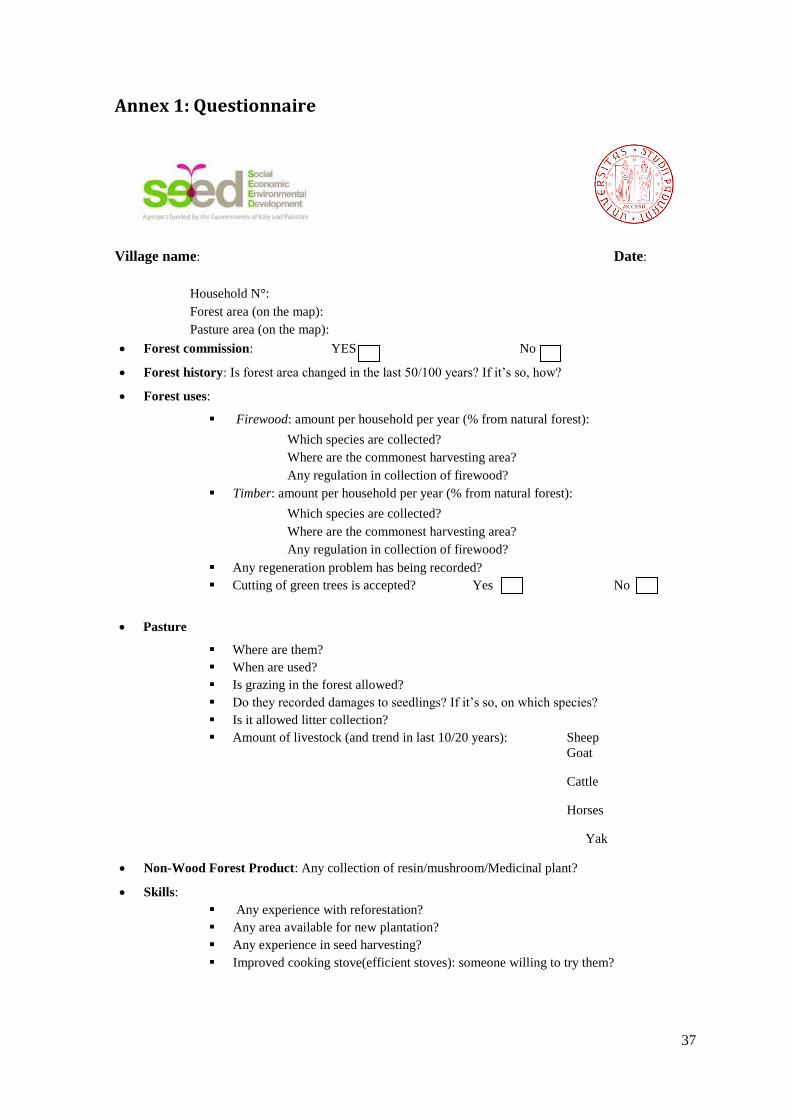
37
Annex 1: Questionnaire
Village name: Date:
Household N°:
Forest area (on the map):
Pasture area (on the map):
Forest commission: YES No
Forest history: Is forest area changed in the last 50/100 years? If it’s so, how?
Forest uses:
Firewood: amount per household per year (% from natural forest):
Which species are collected?
Where are the commonest harvesting area?
Any regulation in collection of firewood?
Timber: amount per household per year (% from natural forest):
Which species are collected?
Where are the commonest harvesting area?
Any regulation in collection of firewood?
Any regeneration problem has being recorded?
Cutting of green trees is accepted? Yes No
Pasture
Where are them?
When are used?
Is grazing in the forest allowed?
Do they recorded damages to seedlings? If it’s so, on which species?
Is it allowed litter collection?
Amount of livestock (and trend in last 10/20 years): Sheep
Goat
Cattle
Horses
Yak
Non-Wood Forest Product: Any collection of resin/mushroom/Medicinal plant?
Skills:
Any experience with reforestation?
Any area available for new plantation?
Any experience in seed harvesting?
Improved cooking stove(efficient stoves): someone willing to try them?
38
CHAPTER 5
LAND-COVER OF CKNP
The methodological approach implemented involves the construction of a database on the
land cover (with particular emphasis on forest cover) and land use. Successively, the results
obtained will be used to assess the forest Above Ground Biomass (AGB) and increment. This
objective can be achieved by processing data from the analysis of remotely sensed images
and field-acquired data. The data from different sources contribute to create a knowledge
system that can be used in the different stages of management of the Park: in the
programming phase when they are the basis for knowledge of the environment dynamics and
of the distribution of resources and during subsequent monitoring activities. In this way, it
becomes mandatory to follow a replicable methodology in time and in space based on data
calibrated to the ground.
The classification schema utilized in land use mapping includes the main components of
the landscape:
Vegetation features: forest, herbaceous cover, crops
Mineral features: water, rock and soil
Human component: villages, roads and other artifacts.
In this project it was decided to work in an integrated way in the GIS environment,
acquiring information from different sources populating the geographical database.
5.1 Introduction
Land cover is defined as the layer of soil and biomass, including natural vegetation, crops
and human structures that cover the land surface. Land use refers to the purposes for which
humans exploit the land cover (Veldkamp and Fresco, 1996). Land cover change is the
complete replacement of one cover type by another, while land use changes also include the
modification of land cover types, e.g., intensification of agricultural use, without changing its
39
overall classification. A better understanding of land cover and land use change are essential
to assess and predict its effects on ecosystem and society.
Land use and land cover are the result of many interacting processes. Each of these
processes operates over a range of scales in time and in space. With the term of scale we refer
to the spatial, temporal, quantitative, or analytic dimensions used by specialists to measure
and study objects and processes (Gibson et al., 2000).
Scales that we use in the cartographic processes have extent and resolution. Extent refers
to the magnitude of a dimension used in measuring (e.g., area covered on a map), whereas
resolution refers to the precision used in this measurement (e.g., grain size). For each process
important to land use and land cover mapping a range of scales may be defined over which it
has significant influence on the land use pattern.
In this project the implementation of a land cover/ land use classification is focused on
these goals:
distribution of forest resources and human activities
evaluation of the resources in quantitative terms (extent)
These objectives meet the general focus of the management of the natural resource in the
park. In particular, the distribution and extent of forests inside Central Karakoram National
Park is of uttermost importance since no data about forest typology, forest extent and biomass
were previously available.
Remote sensing techniques have long been successfully adopted in developing land cover
and vegetation maps at a local (Bayarsaikhan et al., 2009) as well as regional (Avitabile et al.,
2012; Brown de Colstoun et al., 2003; Kozak et al., 2008) and global scale (Friedl et al.,
2002). The ability to cover a broad spatial extent and the possibility to gather a long time
series of data are two of the key features related to their success and diffusion. Since the
1970s, a wide array of sensors became available with different spatial resolutions, frequency
of flight and costs of image purchasing. Similarly, many classification techniques have been
developed, from vegetation indices, as NDVI (Ali et al., 2013), to classic parametric and non
parametric classifiers as Maximum Likelihood or Support Vector Machines (Aguirre-
Gutiérrez et al., 2012; Kahya et al., 2010; Lu, 2006; Paneque-Gálvez et al., 2013;
Vanonckelen et al., 2013).
40
A comprehensive and synoptic overview of the Park vegetation distribution, has been
considered a priority for the management and future monitoring of the Park. This study aims
at: i) define vegetation landcover classes, meaningful for the Park management, ii) evaluate
best methodology to obtain a spatial reliable vegetation map of the entire CKNP, iii) describe
the essential land cover characteristics of the park area. Moreover, the map will serve as a
basis for the development of above ground biomass and increment assessment, two key
parameters to achieve sustainable forest management. Essential characteristic of the output
were: i) clarity and easiness of the defined classes (i.e. to be understood and used by local
communities and meaningful for managing the Park), ii) simple and robust methodology (i.e.
to be easily replicable in future monitoring of vegetation cover change), iii) to form the basis
for above ground biomass and increment assessment and, above all, iv) economically and
temporally cost-effective.
Following this rational, and considering the difficulties related to vegetation mapping in
steep mountain areas (Dorren et al., 2003; Gartzia et al., 2013; Hantson and Chuvieco, 2011;
Vanonckelen et al., 2013), we evaluated which methodology performed better between a
classic per-pixel classification involving the use of supervised classification algorithms
(Mahalanobis Distance, Minimum Distance, Maximum Likelihood, Support Vector
Machines) and a combined approach of vegetation index (NDVI), ancillary data (Dem) and
supervised classification implemented through a Decision Tree. Both classifications were
based on Landsat images due to their large and long lasting dataset, freely available and on
field collected training datasets.
5.2 Methods
5.2.1 Vegetation classes
The land cover classes, presented in the next sub-chapter, were delineated through a
consultative process with CKNP directorate and are shaped on natural vegetation belts, uses
by local communities and management necessities. We opted for a classification of forest
stands by density rather than by composition of species, to increase easiness of use and
significance for management and to facilitate the future assessment of Park’s forest above
ground biomass.
41
5.2.2 Digital Elevation Model and its derivatives
The unavailability of topographic maps in appropriate scale has led to the use of a DEM as
a source for the extraction of the necessary morphological parameters. A DEM derived from
the high-spatial-resolution multispectral images of ASTER was used. The Advanced
Spaceborne Thermal Emission and Reflection Radiometer (ASTER) on NASA’s Terra
spacecraft collects in-track stereo using nadir- and aft looking near infrared cameras. Since
2000, these stereo pairs have been used to produce single-scene (60 x 60 km) digital elevation
models having vertical (root-mean-squared-error) accuracies generally between 10 m and 25
m. The GDEM2 used in this research was acquired from http://reverb.echo.nasa.gov/reverb.
This grid presents some artefacts visible as a regular grid which, in the derived maps, appear
as irregular data. The minimization of this noise was resolved with the application of a
neighbourhood operation, for which the final cell value is function of the values of all the
cells that are in a specified neighbourhood around that cell. A kernel of 5x5 was chosen and
the mean was calculated for the output pixel (Calligaris et al., 2013). These data were used to
delineate the watersheds of the park on the basis of the drainage network extracted from
DEM. Two kinds of pour points were used to calculate the contributing area: the confluence
of rivers classified with the Strahler order and the position of the villages on the bottom of the
valleys. Main and secondary valleys were defined and discussed with the local communities
for the sharing of their right definition.
Moreover, the GDEM was used in order to improve the land cover classification and
evaluate if additional orthorectification was needed. After a visual inspection of the mosaic
image we concluded that no additional transformation was needed to match the adjacent
paths. From the DEM, values of slope and aspect were derived.
5.2.3 Satellite Dataset
To cover the entire CKNP area, three Landsat 5 Thematic Mapper (TM) images with
30x30 m spatial resolution were used (Tab. 5). The images, acquired at product level 1T
(radiometrically and geometrically terrain corrected) from the GLOVIS web-portal
(http://glovis.usgs.gov/), were chosen specifically from the month of August to capture full
vegetation development along all possible altitudes. The most cloud free images were
selected (cloud cover < 6% with the only exception of image 148/35, only marginally
used).Throughout the paper, all the analyses were performed on the 6 non-thermal bands of
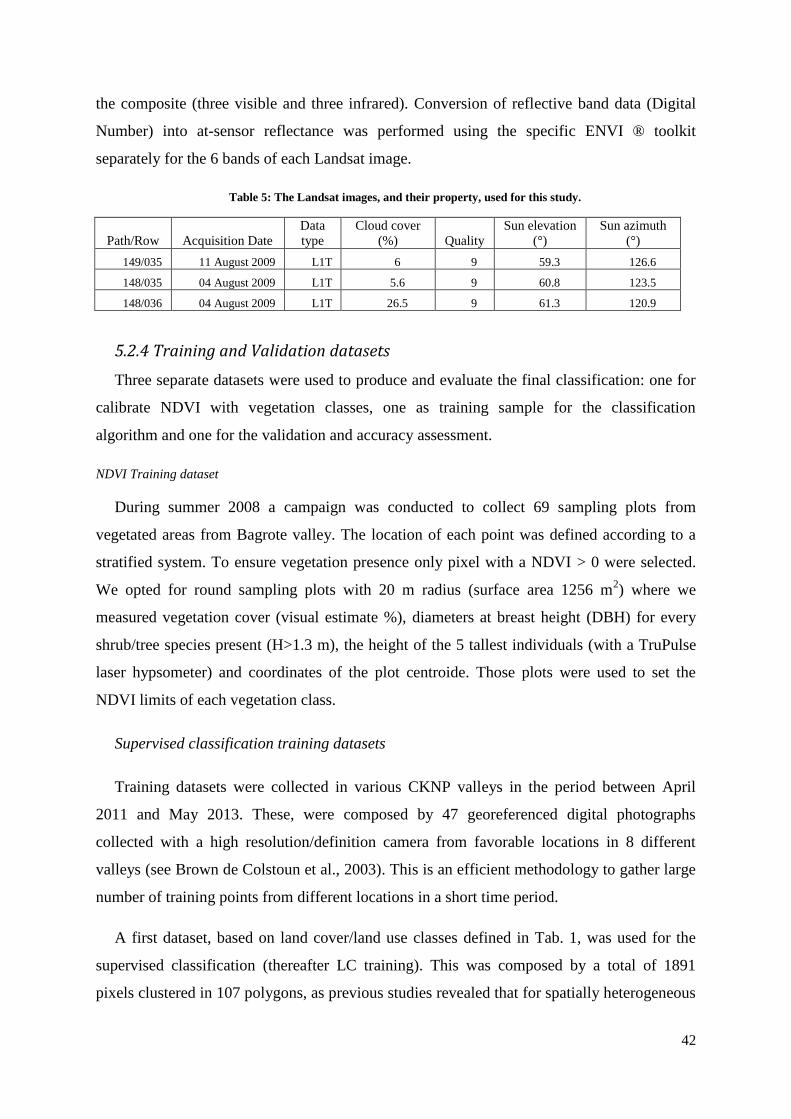
42
the composite (three visible and three infrared). Conversion of reflective band data (Digital
Number) into at-sensor reflectance was performed using the specific ENVI ® toolkit
separately for the 6 bands of each Landsat image.
Table 5: The Landsat images, and their property, used for this study.
Path/Row Acquisition Date
Data
type
Cloud cover
(%) Quality
Sun elevation
(°)
Sun azimuth
(°)
149/035 11 August 2009 L1T 6 9 59.3 126.6
148/035 04 August 2009 L1T 5.6 9 60.8 123.5
148/036 04 August 2009 L1T 26.5 9 61.3 120.9
5.2.4 Training and Validation datasets
Three separate datasets were used to produce and evaluate the final classification: one for
calibrate NDVI with vegetation classes, one as training sample for the classification
algorithm and one for the validation and accuracy assessment.
NDVI Training dataset
During summer 2008 a campaign was conducted to collect 69 sampling plots from
vegetated areas from Bagrote valley. The location of each point was defined according to a
stratified system. To ensure vegetation presence only pixel with a NDVI > 0 were selected.
We opted for round sampling plots with 20 m radius (surface area 1256 m2) where we
measured vegetation cover (visual estimate %), diameters at breast height (DBH) for every
shrub/tree species present (H>1.3 m), the height of the 5 tallest individuals (with a TruPulse
laser hypsometer) and coordinates of the plot centroide. Those plots were used to set the
NDVI limits of each vegetation class.
Supervised classification training datasets
Training datasets were collected in various CKNP valleys in the period between April
2011 and May 2013. These, were composed by 47 georeferenced digital photographs
collected with a high resolution/definition camera from favorable locations in 8 different
valleys (see Brown de Colstoun et al., 2003). This is an efficient methodology to gather large
number of training points from different locations in a short time period.
A first dataset, based on land cover/land use classes defined in Tab. 1, was used for the
supervised classification (thereafter LC training). This was composed by a total of 1891
pixels clustered in 107 polygons, as previous studies revealed that for spatially heterogeneous
43
classes, box of training pixels perform better than single pixels (Chen and Stown, 2002).
Each polygon was located sufficiently far away from the other to reduce spatial
autocorrelation (Foody and Mathur, 2004; Vanonckelen et al., 2013). For each vegetation
class, at least 210 pixels were used as training dataset as is commonly suggested to collect a
number of training pixels equals to 30p per class where p is the number of spectral bands
used (Mather and Koch, 2011).
A second dataset, for the training of the supervised classification of the Decision Tree, was
developed from the same images. Instead of selecting the pixels representative of the
vegetation classes, we selected pixel representative of the main vegetation species: Bare soil,
Artemisia, Juniperus, Conifers, Broadleaves, Grassland (thereafter, SP training dataset).
Validation dataset
A specific validation dataset, composed by 334 ground control points gathered in 10
valleys was used to validate the final map and assess its accuracy. The points were collected
on field, using a GPS device. Mean tree height of the 5 tallest trees (measured with a
TruPulse hypsometer), visual estimation of vegetation cover, vegetation land cover class
definition, location (X,Y), altitude and date of collection were recorded for each point.
5.2.5 Satellite data processing
The project objectives required the mapping process to be relatively simple, based on a
robust methodology, cost-effective and a starting point for the future development of above
ground biomass and increment estimates. Following data acquisition, images have been pre-
processed through topographic correction and snow and clouds masking.
We evaluated two different classification methodologies using the two datasets previously
described. The first was based on well-known and long adopted parametric (Minimum
Distance, MD and Maximum Likelihood, ML) and non-parametric classification algorithms
(Support Vector Machines, SVM). The second, instead, combined in a Decision Tree an
NDVI-based class’s identification with supervised classifications (MD, ML and SVM) and
ancillary data.
44
Pre-processing
The Karakorum strong relief implies large variation in illumination between areas directly
hit by sunlight and areas deeply shaded by orography (i.e. North exposed slopes).
Topographic correction algorithms are widely adopted to reduce those effects, resulting in
higher classification accuracies (Dorren et al., 2003; Hantson and Chuvieco, 2011; Teillet et
al., 1982). We opted for the classic C-Correction firstly introduced by Teillet et al. (1982)
because of its simplicity and its effective improvement of image quality (see Hantson and
Chuvieco, 2011; Vanonckelen et al., 2013 for further details). This is a wavelength dependent
correction method used to calculate new values of corrected reflectances for each pixel. The
first step was to calculate the illumination angle:
Where, represents the incidence angle, the solar zenith angle, slope angle, the
solar azimuth angle and the slope aspect.
New pixels values of corrected reflectances are then computed for each band:
Where is the terrain corrected reflectance, the uncorrected reflectance and c is a
band dependent constant derived from the regression coefficient between illumination angle
and each band reflectances:
The corrected bands were stacked together and a mosaic of the three corrected Landsat
images was created to cover the entire study area. Atmospheric correction, performed on at
sensor radiance and computed through the ENVI Flaash module, was not applied because of
reduced scattering over the image (i.e., high mean elevation, low air moisture and aerosols)
and no improvement on classification accuracy.
45
The Normalize Difference Vegetation Index, calculated as
, was used as an additional band to the 6 Landsat non-
thermal bands to increase classification accuracies (Heinl et al., 2009).
Masking
To reduce classification errors and ease visual image analyses, clouds, snow and ice were
identified and masked. For cloud identification we used Band 1 while for snow and ice we
used NDSI index (Tang et al., 2013): . After visual images
inspection, threshold values of 0.23 and 0.3 were respectively applied to develop a snow and
cloud mask.
5.2.6 Classifications
Supervised classification
Supervised classification algorithms have long been adopted to developed land cover maps
and have been widely covered in the literature (Lu and Weng, 2007). We evaluated the use of
both parametric (MD, ML) and non-parametric classifiers (SVM). The former are based on
statistical assumptions derived from the training dataset: all unclassified pixels are attributed
to the nearest class centroid according to Euclidean distance (as in MD) or taking into
consideration means and covariance (ML) (Jones and Vaughan, 2010; Mather and Koch,
2011). Non-parametric classifiers, on the contrary, are directly trained by the training sample
without assuming normal distribution of data. SVM, in particular, relies on between class
spectral boundary rather than class centroid values and distances and have often been found
to be more accurate than parametric classifiers (Heinl et al., 2009; Otukei and Blaschke,
2010; Paneque-Gálvez et al., 2013). To train the classifier, the LC training dataset was
adopted to directly detect the vegetation classes of Tab. 1.
Decision Tree
A different approach was followed for the second classification. In this case we aimed at
evaluate the feasibility of using a simple vegetation index, with the additional use of ancillary
data (mask and DEM), to separate the land cover classes hierarchically developed according
to vegetation cover (i.e. from bare soil to close forest). NDVI (Rouse et al., 1974) has been
extensively adopted to quantitatively assess vegetation density due to the simple and direct
calculation process, the ability to distinguish between vegetation and soil, the proportionality
46
with chlorophyll content (and therefore LAI and vegetation amount) and the low sensitivity
towards irradiance and other atmospheric disturbances (Jones and Vaughan, 2010; Lu, 2006).
Additionally, where partially vegetated areas are diffuse, NDVI was shown to be more
affected by changes in vegetation cover than by changes in canopy thickness (Solans Vila and
Barbosa, 2010). One of the main limitation in the use of NDVI as a proxy for vegetation
cover is its saturation at high canopy density (Kolios and Stylios, 2013). The low mean
density of CKNP forests (Akbar et al., 2010; Akbar et al., 2011; Hussain et al., 2013) and the
ample vegetation classes adopted in the CKNP land cover partially overcome this problem.
Another limit inherent the use of a vegetation index is that NDVI alone does not differentiate
between various types of land cover classes. For our purposes, instead, it was necessary to
separate the signal of dense vegetation as grassland, agriculture and close forests classes. We
used a mix of supervised classification and ancillary data to separate those classes: an
altitudinal limit, based on field observations and data from the literature (Du, 1998; Eberhardt
et al., 2007; Miehe and Miehe, 1998), was used to set a treeline elevation. Pixels with high
NDVI values lying above 4000 m a.s.l. were automatically classified as grassland. The actual
treeline of close and open forests in CKNP is located at 3800/3900 m a.s.l.. We set higher
altitudinal limit to allow some resolution errors in between the GDEM and the satellite
images. Additionally, we performed a supervised classification with the algorithms (MD, ML
and SVM) trained on the species training dataset. This was used to extract grasslands and
agriculture pixels lying at lower elevation (<4000 m). However, spectral differences between
grassland and agriculture areas are often scarce (i.e. due to the similarity of vegetation growth
form and density) making class detection difficult and reducing final accuracy (Heinl et al.,
2009). We therefore developed an agriculture mask to identify and separate agriculture class.
In CKNP area, fields are mainly located at low elevation along valleys bottom,
surrounded by bare soil. Grasslands, on the contrary, are located above tree line (>4000 m
a.s.l.) or in between patches of forests (Du, 1998). This spatial difference makes the
recognition of agriculture areas relatively simple. The mask was based on the 3000 m contour
line, manually modified on a GIS using a FCC image of the terrain corrected Landsat images.
The final classification was developed through a decision tree (Fig.2). NDVI value thresholds
were set to distinguish bare soil/scattered vegetation/sparse vegetation/open forest/close
forest classes while the supervised classification image and the agriculture mask, were used
to extract, and then separate, agriculture and grassland classes.
47
5.2.7 Validation & Accuracy assessment
The specific validation dataset was used to evaluate the maps accuracy. We performed
error matrix to obtain overall accuracy, producer’s and user’s accuracies, and K coefficient of
agreement (total and per class) through a specific R package (Rossiter, 2004).
5.2.8 Vegetation pattern analyses
Distribution patterns of land cover classes were further evaluated using Standard
Deviation Ellipses through ArcGis ® Spatial Statistics package. This is an efficient
methodology to visually assess the spatial trends of land cover within the study area by
looking at the ellipse centered in the mean geographical center of each class distribution.
Standard distances, separating the classes areas from the mean center for both the x and y
directions are computed and are used to define the length of the two ellipse’s axes (Lefever,
1926). We adopted one standard deviation ellipse which includes approximately 68% of the
total pixels classified in that particular land cover class. Finally, we evaluated the results of
each species distribution according to elevation and aspect using the Aster DEM.
5.3 Results
5.3.1 Land-cover classes definition
The number of classes and their definitions is a tradeoff between the need to precisely
assess ecosystems distribution inside the Park borders and the limits imposed by the satellite
images classification procedure. Additionally, being the land-cover mapping an important
management tool for Park staff, clarity and reduced redundancy are essential characteristic.
Therefore, 8 classes have been developed, enough general to encompass a wide variety of
similar environments and enough different each other to simplify their recognition and
maximize their management usefulness (Tab. 6).
The classes are: Bare soil, scattered vegetation, sparse trees, open forest, closed forest,
grassland, agriculture and snow-ice.
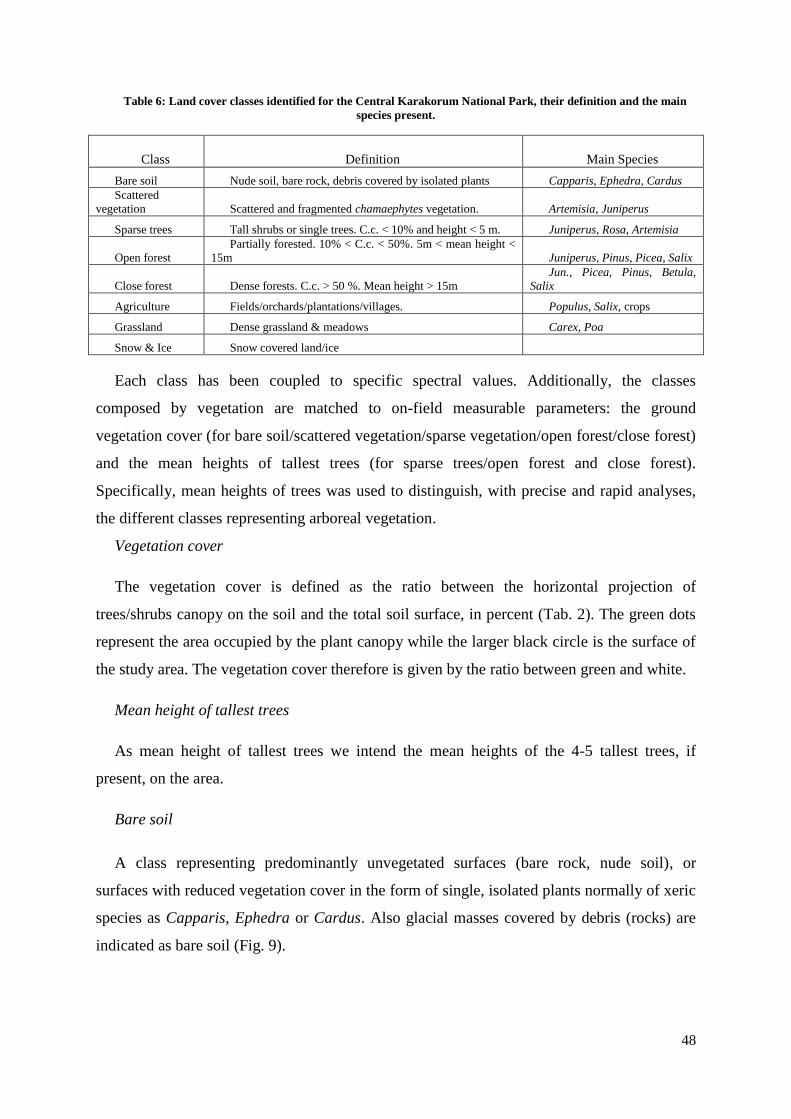
48
Table 6: Land cover classes identified for the Central Karakorum National Park, their definition and the main
species present.
Class Definition Main Species
Bare soil Nude soil, bare rock, debris covered by isolated plants Capparis, Ephedra, Cardus
Scattered
vegetation Scattered and fragmented chamaephytes vegetation. Artemisia, Juniperus
Sparse trees Tall shrubs or single trees. C.c. < 10% and height < 5 m. Juniperus, Rosa, Artemisia
Open forest
Partially forested. 10% < C.c. < 50%. 5m < mean height <
15m Juniperus, Pinus, Picea, Salix
Close forest Dense forests. C.c. > 50 %. Mean height > 15m
Jun., Picea, Pinus, Betula,
Salix
Agriculture Fields/orchards/plantations/villages. Populus, Salix, crops
Grassland Dense grassland & meadows Carex, Poa
Snow & Ice Snow covered land/ice
Each class has been coupled to specific spectral values. Additionally, the classes
composed by vegetation are matched to on-field measurable parameters: the ground
vegetation cover (for bare soil/scattered vegetation/sparse vegetation/open forest/close forest)
and the mean heights of tallest trees (for sparse trees/open forest and close forest).
Specifically, mean heights of trees was used to distinguish, with precise and rapid analyses,
the different classes representing arboreal vegetation.
Vegetation cover
The vegetation cover is defined as the ratio between the horizontal projection of
trees/shrubs canopy on the soil and the total soil surface, in percent (Tab. 2). The green dots
represent the area occupied by the plant canopy while the larger black circle is the surface of
the study area. The vegetation cover therefore is given by the ratio between green and white.
Mean height of tallest trees
As mean height of tallest trees we intend the mean heights of the 4-5 tallest trees, if
present, on the area.
Bare soil
A class representing predominantly unvegetated surfaces (bare rock, nude soil), or
surfaces with reduced vegetation cover in the form of single, isolated plants normally of xeric
species as Capparis, Ephedra or Cardus. Also glacial masses covered by debris (rocks) are
indicated as bare soil (Fig. 9).
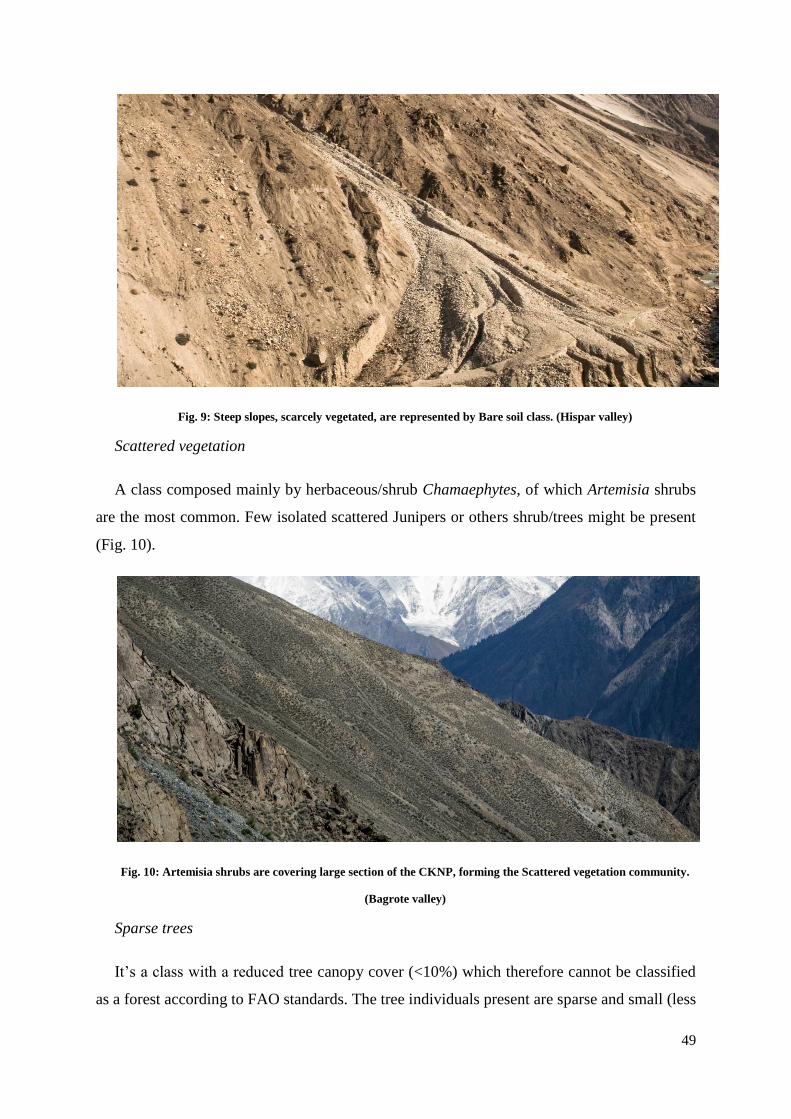
49
Fig. 9: Steep slopes, scarcely vegetated, are represented by Bare soil class. (Hispar valley)
Scattered vegetation
A class composed mainly by herbaceous/shrub Chamaephytes, of which Artemisia shrubs
are the most common. Few isolated scattered Junipers or others shrub/trees might be present
(Fig. 10).
Fig. 10: Artemisia shrubs are covering large section of the CKNP, forming the Scattered vegetation community.
(Bagrote valley)
Sparse trees
It’s a class with a reduced tree canopy cover (<10%) which therefore cannot be classified
as a forest according to FAO standards. The tree individuals present are sparse and small (less
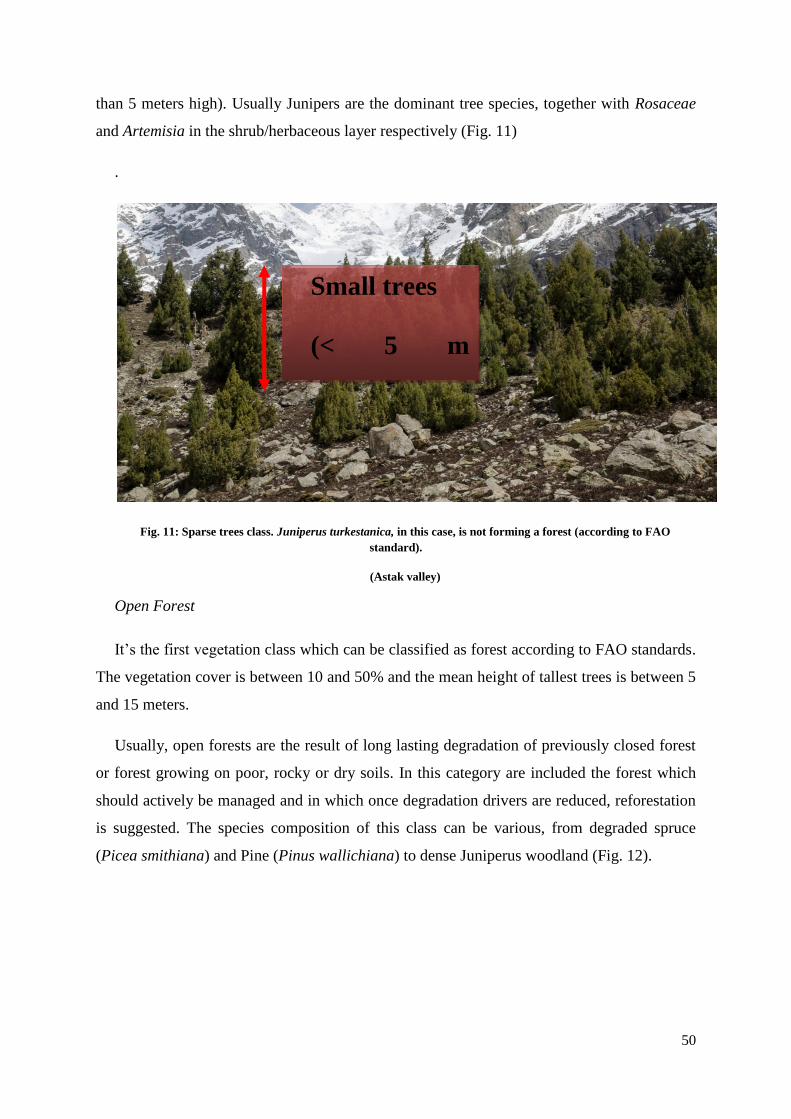
50
than 5 meters high). Usually Junipers are the dominant tree species, together with Rosaceae
and Artemisia in the shrub/herbaceous layer respectively (Fig. 11)
.
Fig. 11: Sparse trees class. Juniperus turkestanica, in this case, is not forming a forest (according to FAO
standard).
(Astak valley)
Open Forest
It’s the first vegetation class which can be classified as forest according to FAO standards.
The vegetation cover is between 10 and 50% and the mean height of tallest trees is between 5
and 15 meters.
Usually, open forests are the result of long lasting degradation of previously closed forest
or forest growing on poor, rocky or dry soils. In this category are included the forest which
should actively be managed and in which once degradation drivers are reduced, reforestation
is suggested. The species composition of this class can be various, from degraded spruce
(Picea smithiana) and Pine (Pinus wallichiana) to dense Juniperus woodland (Fig. 12).
Small trees
(< 5 m
height)
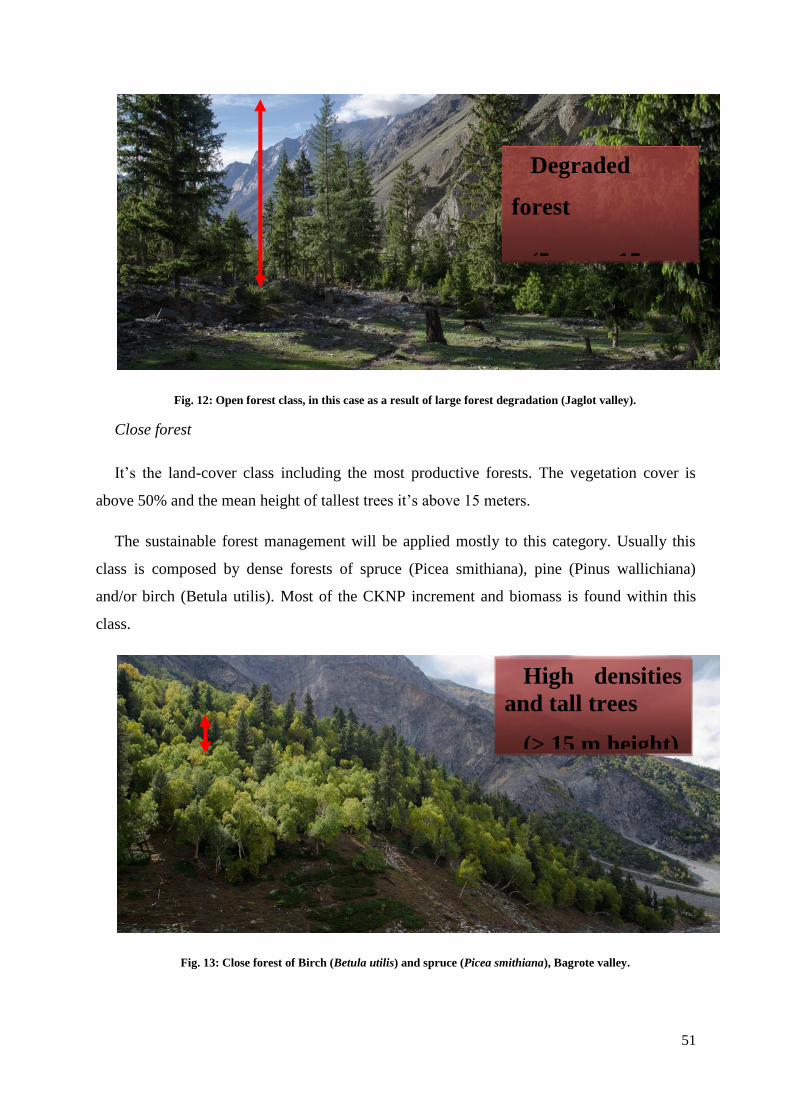
51
Fig. 12: Open forest class, in this case as a result of large forest degradation (Jaglot valley).
Close forest
It’s the land-cover class including the most productive forests. The vegetation cover is
above 50% and the mean height of tallest trees it’s above 15 meters.
The sustainable forest management will be applied mostly to this category. Usually this
class is composed by dense forests of spruce (Picea smithiana), pine (Pinus wallichiana)
and/or birch (Betula utilis). Most of the CKNP increment and biomass is found within this
class.
Fig. 13: Close forest of Birch (Betula utilis) and spruce (Picea smithiana), Bagrote valley.
Degraded
forest
(5 – 15 m
height)
High densities
and tall trees
(> 15 m height)
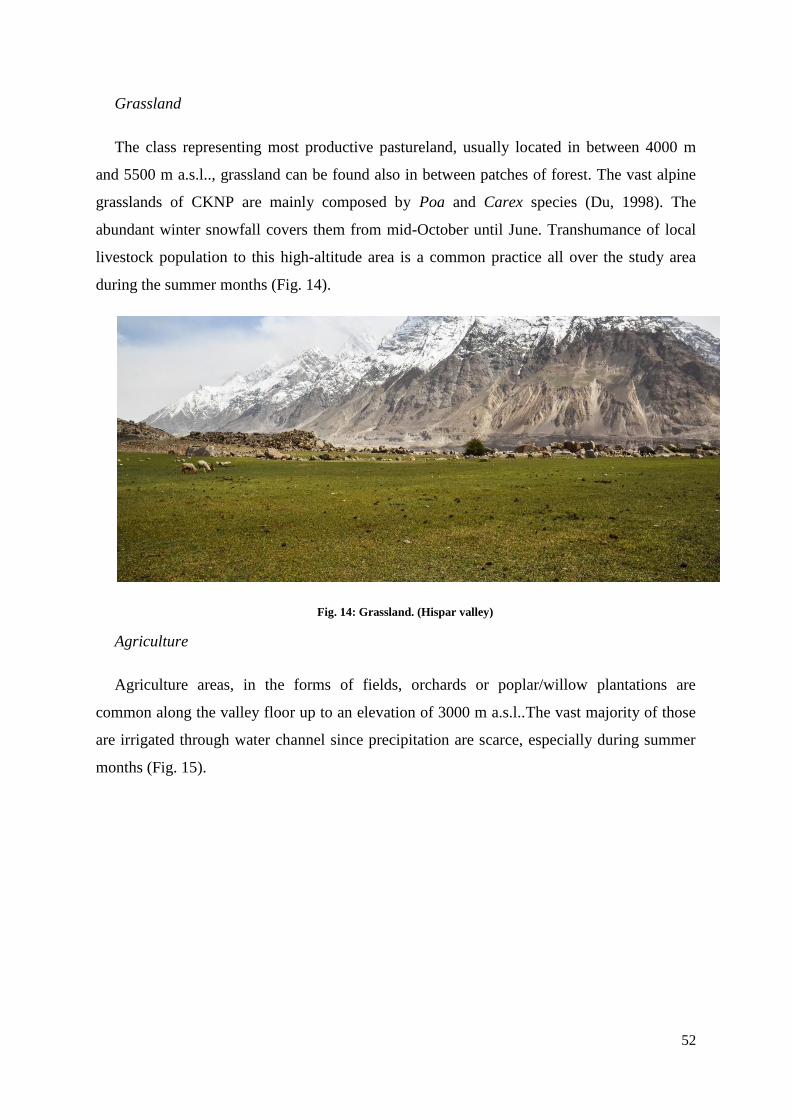
52
Grassland
The class representing most productive pastureland, usually located in between 4000 m
and 5500 m a.s.l.., grassland can be found also in between patches of forest. The vast alpine
grasslands of CKNP are mainly composed by Poa and Carex species (Du, 1998). The
abundant winter snowfall covers them from mid-October until June. Transhumance of local
livestock population to this high-altitude area is a common practice all over the study area
during the summer months (Fig. 14).
Fig. 14: Grassland. (Hispar valley)
Agriculture
Agriculture areas, in the forms of fields, orchards or poplar/willow plantations are
common along the valley floor up to an elevation of 3000 m a.s.l..The vast majority of those
are irrigated through water channel since precipitation are scarce, especially during summer
months (Fig. 15).
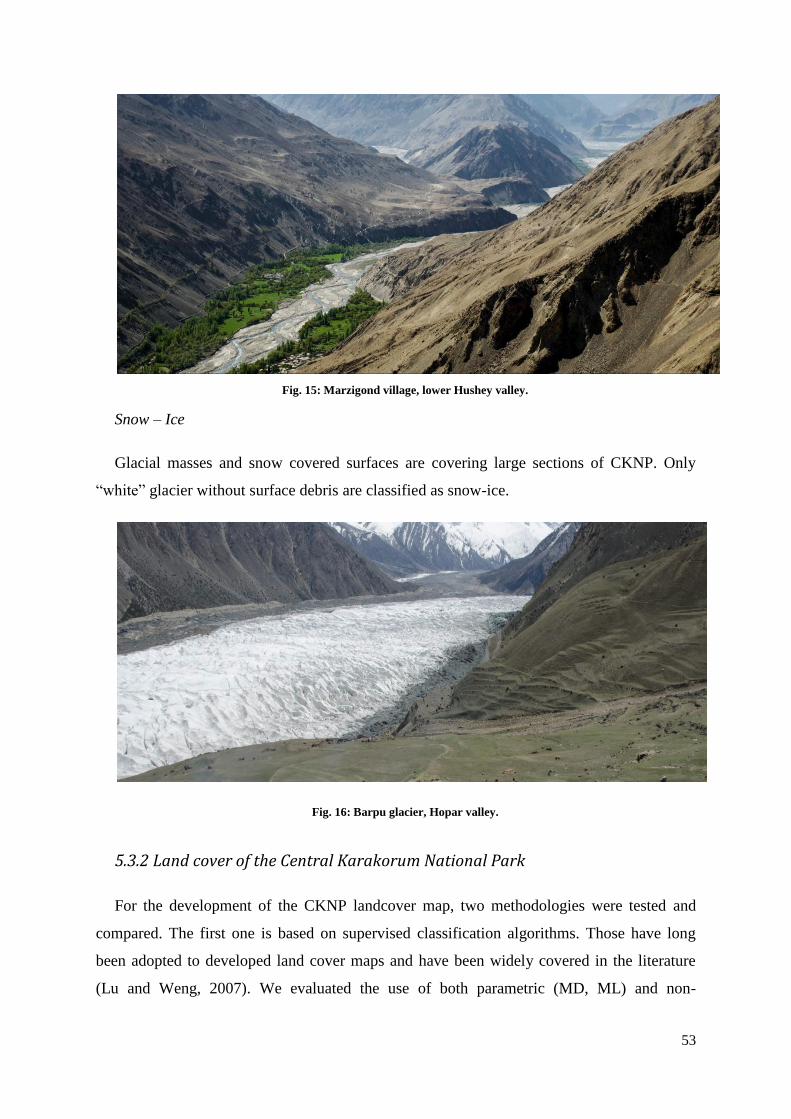
53
Fig. 15: Marzigond village, lower Hushey valley.
Snow – Ice
Glacial masses and snow covered surfaces are covering large sections of CKNP. Only
“white” glacier without surface debris are classified as snow-ice.
Fig. 16: Barpu glacier, Hopar valley.
5.3.2 Land cover of the Central Karakorum National Park
For the development of the CKNP landcover map, two methodologies were tested and
compared. The first one is based on supervised classification algorithms. Those have long
been adopted to developed land cover maps and have been widely covered in the literature
(Lu and Weng, 2007). We evaluated the use of both parametric (MD, ML) and non-
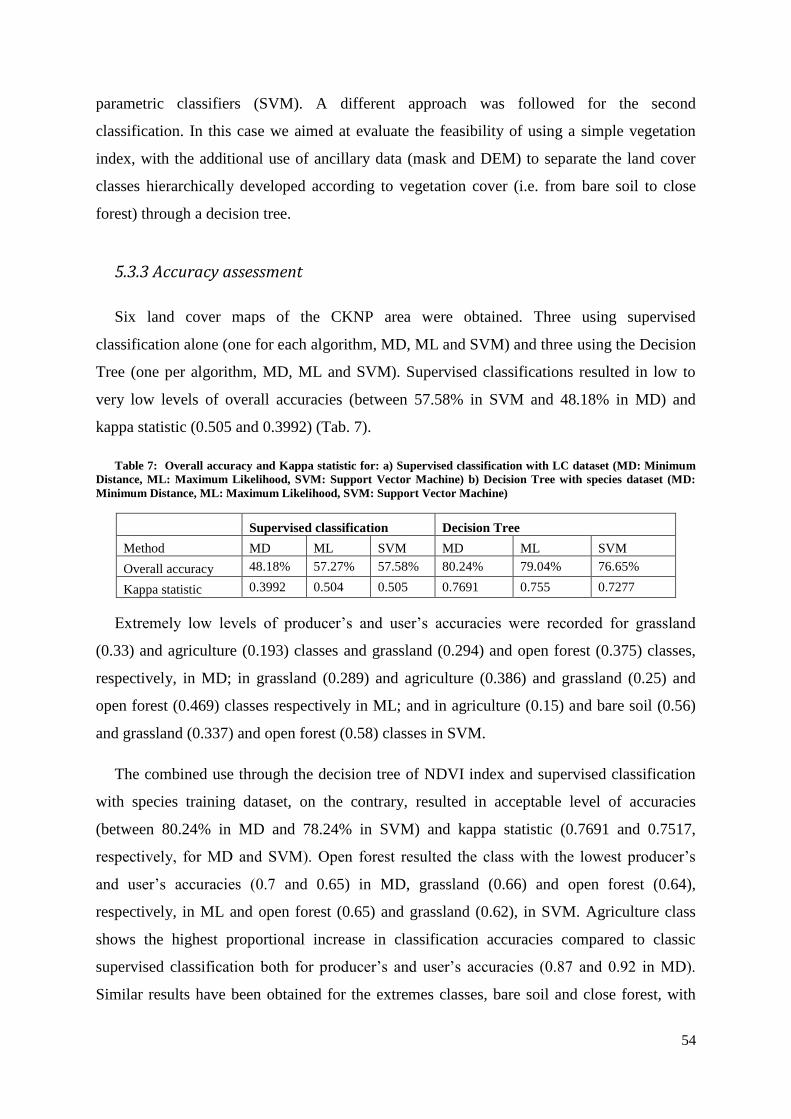
54
parametric classifiers (SVM). A different approach was followed for the second
classification. In this case we aimed at evaluate the feasibility of using a simple vegetation
index, with the additional use of ancillary data (mask and DEM) to separate the land cover
classes hierarchically developed according to vegetation cover (i.e. from bare soil to close
forest) through a decision tree.
5.3.3 Accuracy assessment
Six land cover maps of the CKNP area were obtained. Three using supervised
classification alone (one for each algorithm, MD, ML and SVM) and three using the Decision
Tree (one per algorithm, MD, ML and SVM). Supervised classifications resulted in low to
very low levels of overall accuracies (between 57.58% in SVM and 48.18% in MD) and
kappa statistic (0.505 and 0.3992) (Tab. 7).
Table 7: Overall accuracy and Kappa statistic for: a) Supervised classification with LC dataset (MD: Minimum
Distance, ML: Maximum Likelihood, SVM: Support Vector Machine) b) Decision Tree with species dataset (MD:
Minimum Distance, ML: Maximum Likelihood, SVM: Support Vector Machine)
Supervised classification Decision Tree
Method MD ML SVM MD ML SVM
Overall accuracy 48.18% 57.27% 57.58% 80.24% 79.04% 76.65%
Kappa statistic 0.3992 0.504 0.505 0.7691 0.755 0.7277
Extremely low levels of producer’s and user’s accuracies were recorded for grassland
(0.33) and agriculture (0.193) classes and grassland (0.294) and open forest (0.375) classes,
respectively, in MD; in grassland (0.289) and agriculture (0.386) and grassland (0.25) and
open forest (0.469) classes respectively in ML; and in agriculture (0.15) and bare soil (0.56)
and grassland (0.337) and open forest (0.58) classes in SVM.
The combined use through the decision tree of NDVI index and supervised classification
with species training dataset, on the contrary, resulted in acceptable level of accuracies
(between 80.24% in MD and 78.24% in SVM) and kappa statistic (0.7691 and 0.7517,
respectively, for MD and SVM). Open forest resulted the class with the lowest producer’s
and user’s accuracies (0.7 and 0.65) in MD, grassland (0.66) and open forest (0.64),
respectively, in ML and open forest (0.65) and grassland (0.62), in SVM. Agriculture class
shows the highest proportional increase in classification accuracies compared to classic
supervised classification both for producer’s and user’s accuracies (0.87 and 0.92 in MD).
Similar results have been obtained for the extremes classes, bare soil and close forest, with
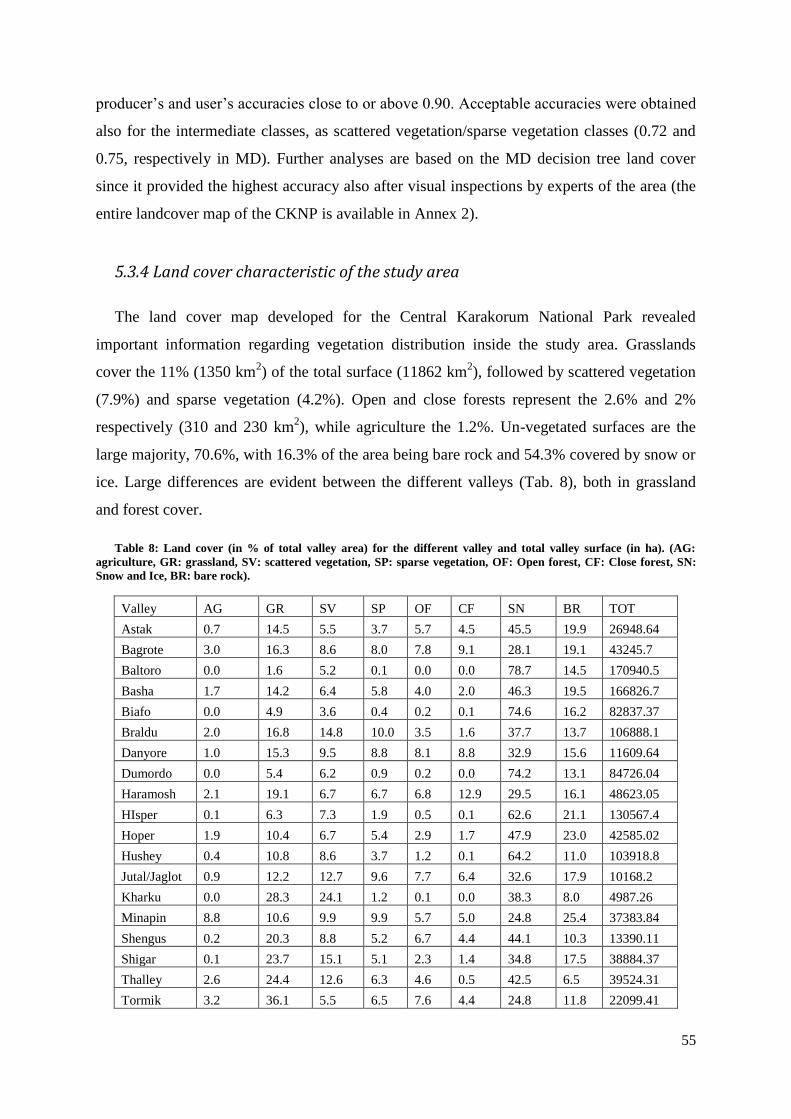
55
producer’s and user’s accuracies close to or above 0.90. Acceptable accuracies were obtained
also for the intermediate classes, as scattered vegetation/sparse vegetation classes (0.72 and
0.75, respectively in MD). Further analyses are based on the MD decision tree land cover
since it provided the highest accuracy also after visual inspections by experts of the area (the
entire landcover map of the CKNP is available in Annex 2).
5.3.4 Land cover characteristic of the study area
The land cover map developed for the Central Karakorum National Park revealed
important information regarding vegetation distribution inside the study area. Grasslands
cover the 11% (1350 km2) of the total surface (11862 km
2), followed by scattered vegetation
(7.9%) and sparse vegetation (4.2%). Open and close forests represent the 2.6% and 2%
respectively (310 and 230 km2), while agriculture the 1.2%. Un-vegetated surfaces are the
large majority, 70.6%, with 16.3% of the area being bare rock and 54.3% covered by snow or
ice. Large differences are evident between the different valleys (Tab. 8), both in grassland
and forest cover.
Table 8: Land cover (in % of total valley area) for the different valley and total valley surface (in ha). (AG:
agriculture, GR: grassland, SV: scattered vegetation, SP: sparse vegetation, OF: Open forest, CF: Close forest, SN:
Snow and Ice, BR: bare rock).
Valley AG GR SV SP OF CF SN BR TOT
Astak 0.7 14.5 5.5 3.7 5.7 4.5 45.5 19.9 26948.64
Bagrote 3.0 16.3 8.6 8.0 7.8 9.1 28.1 19.1 43245.7
Baltoro 0.0 1.6 5.2 0.1 0.0 0.0 78.7 14.5 170940.5
Basha 1.7 14.2 6.4 5.8 4.0 2.0 46.3 19.5 166826.7
Biafo 0.0 4.9 3.6 0.4 0.2 0.1 74.6 16.2 82837.37
Braldu 2.0 16.8 14.8 10.0 3.5 1.6 37.7 13.7 106888.1
Danyore 1.0 15.3 9.5 8.8 8.1 8.8 32.9 15.6 11609.64
Dumordo 0.0 5.4 6.2 0.9 0.2 0.0 74.2 13.1 84726.04
Haramosh 2.1 19.1 6.7 6.7 6.8 12.9 29.5 16.1 48623.05
HIsper 0.1 6.3 7.3 1.9 0.5 0.1 62.6 21.1 130567.4
Hoper 1.9 10.4 6.7 5.4 2.9 1.7 47.9 23.0 42585.02
Hushey 0.4 10.8 8.6 3.7 1.2 0.1 64.2 11.0 103918.8
Jutal/Jaglot 0.9 12.2 12.7 9.6 7.7 6.4 32.6 17.9 10168.2
Kharku 0.0 28.3 24.1 1.2 0.1 0.0 38.3 8.0 4987.26
Minapin 8.8 10.6 9.9 9.9 5.7 5.0 24.8 25.4 37383.84
Shengus 0.2 20.3 8.8 5.2 6.7 4.4 44.1 10.3 13390.11
Shigar 0.1 23.7 15.1 5.1 2.3 1.4 34.8 17.5 38884.37
Thalley 2.6 24.4 12.6 6.3 4.6 0.5 42.5 6.5 39524.31
Tormik 3.2 36.1 5.5 6.5 7.6 4.4 24.8 11.8 22099.41
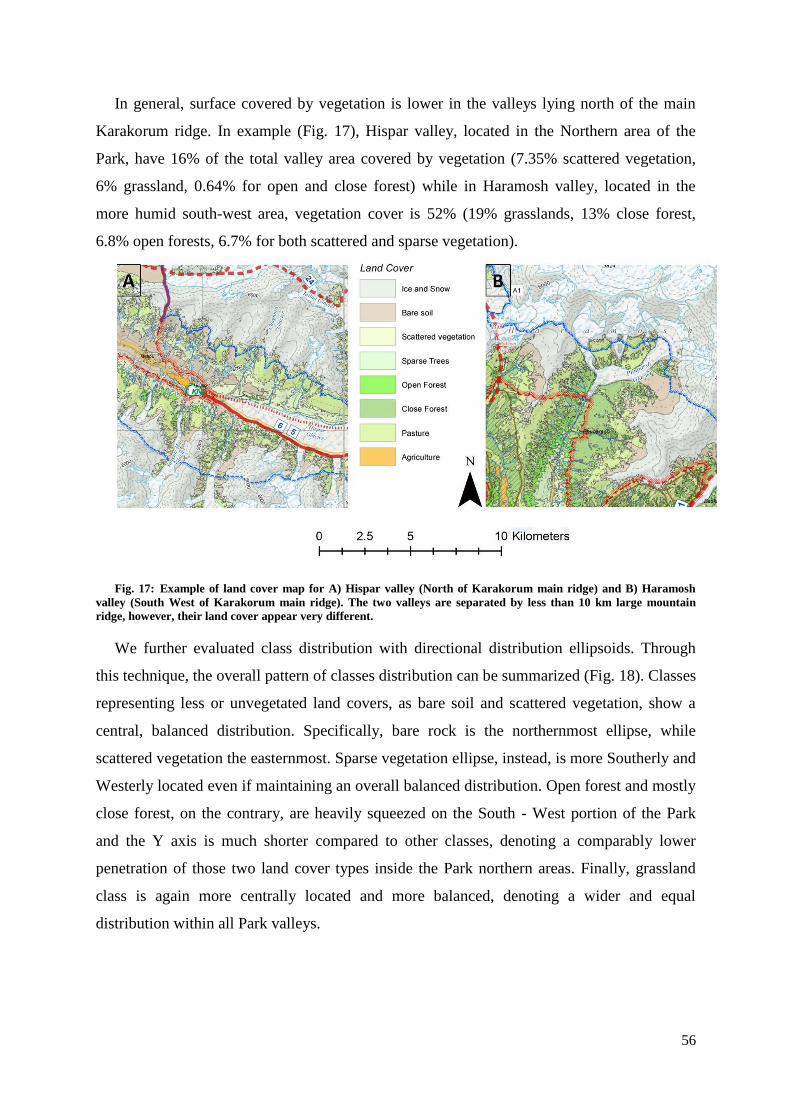
56
In general, surface covered by vegetation is lower in the valleys lying north of the main
Karakorum ridge. In example (Fig. 17), Hispar valley, located in the Northern area of the
Park, have 16% of the total valley area covered by vegetation (7.35% scattered vegetation,
6% grassland, 0.64% for open and close forest) while in Haramosh valley, located in the
more humid south-west area, vegetation cover is 52% (19% grasslands, 13% close forest,
6.8% open forests, 6.7% for both scattered and sparse vegetation).
Fig. 17: Example of land cover map for A) Hispar valley (North of Karakorum main ridge) and B) Haramosh
valley (South West of Karakorum main ridge). The two valleys are separated by less than 10 km large mountain
ridge, however, their land cover appear very different.
We further evaluated class distribution with directional distribution ellipsoids. Through
this technique, the overall pattern of classes distribution can be summarized (Fig. 18). Classes
representing less or unvegetated land covers, as bare soil and scattered vegetation, show a
central, balanced distribution. Specifically, bare rock is the northernmost ellipse, while
scattered vegetation the easternmost. Sparse vegetation ellipse, instead, is more Southerly and
Westerly located even if maintaining an overall balanced distribution. Open forest and mostly
close forest, on the contrary, are heavily squeezed on the South - West portion of the Park
and the Y axis is much shorter compared to other classes, denoting a comparably lower
penetration of those two land cover types inside the Park northern areas. Finally, grassland
class is again more centrally located and more balanced, denoting a wider and equal
distribution within all Park valleys.
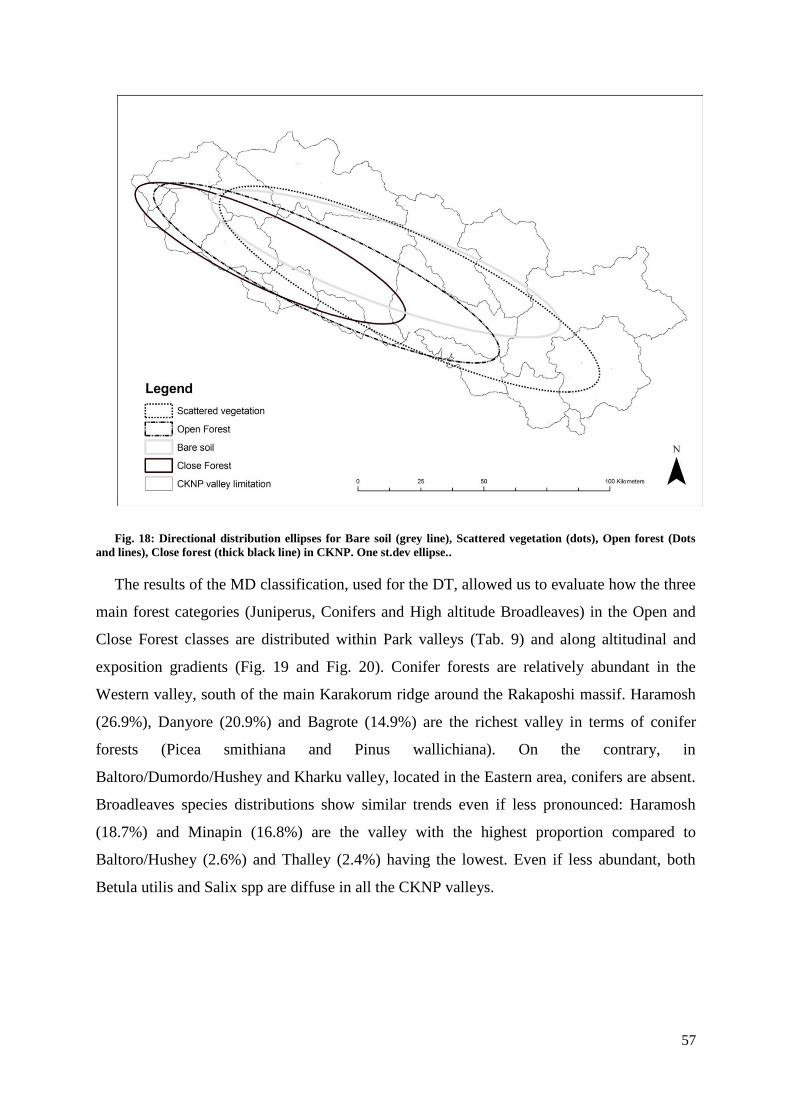
57
Fig. 18: Directional distribution ellipses for Bare soil (grey line), Scattered vegetation (dots), Open forest (Dots
and lines), Close forest (thick black line) in CKNP. One st.dev ellipse..
The results of the MD classification, used for the DT, allowed us to evaluate how the three
main forest categories (Juniperus, Conifers and High altitude Broadleaves) in the Open and
Close Forest classes are distributed within Park valleys (Tab. 9) and along altitudinal and
exposition gradients (Fig. 19 and Fig. 20). Conifer forests are relatively abundant in the
Western valley, south of the main Karakorum ridge around the Rakaposhi massif. Haramosh
(26.9%), Danyore (20.9%) and Bagrote (14.9%) are the richest valley in terms of conifer
forests (Picea smithiana and Pinus wallichiana). On the contrary, in
Baltoro/Dumordo/Hushey and Kharku valley, located in the Eastern area, conifers are absent.
Broadleaves species distributions show similar trends even if less pronounced: Haramosh
(18.7%) and Minapin (16.8%) are the valley with the highest proportion compared to
Baltoro/Hushey (2.6%) and Thalley (2.4%) having the lowest. Even if less abundant, both
Betula utilis and Salix spp are diffuse in all the CKNP valleys.
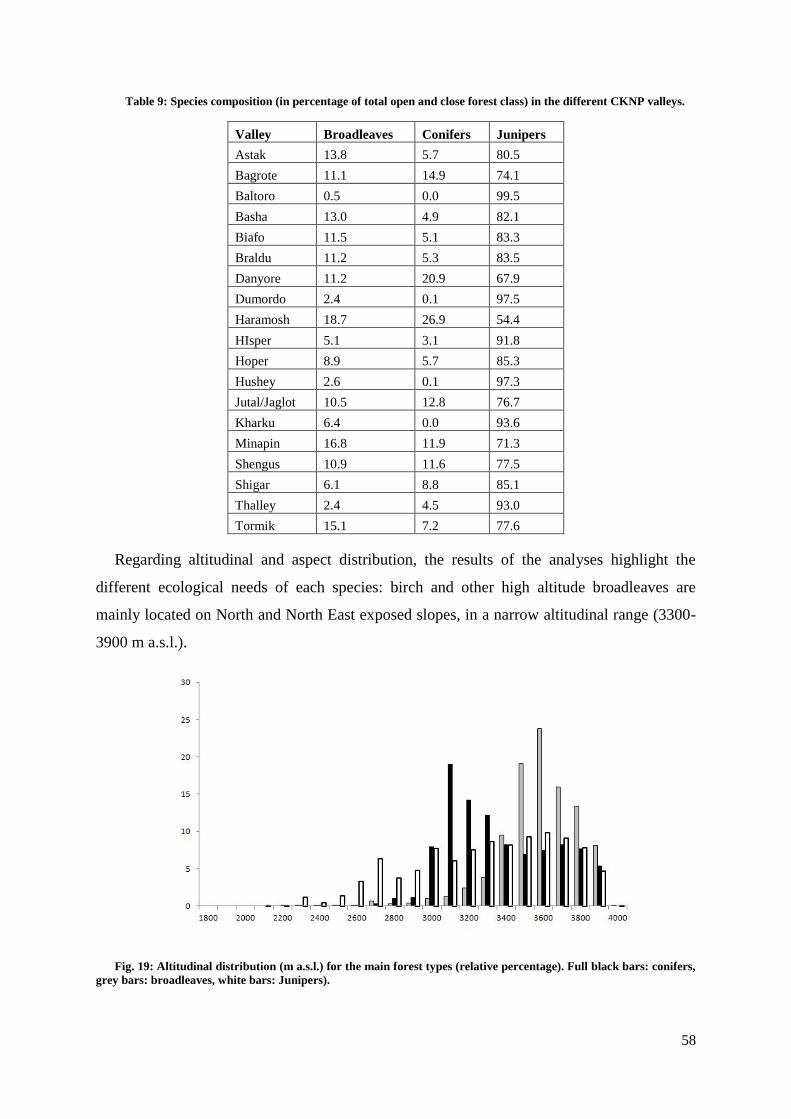
58
Table 9: Species composition (in percentage of total open and close forest class) in the different CKNP valleys.
Valley Broadleaves Conifers Junipers
Astak 13.8 5.7 80.5
Bagrote 11.1 14.9 74.1
Baltoro 0.5 0.0 99.5
Basha 13.0 4.9 82.1
Biafo 11.5 5.1 83.3
Braldu 11.2 5.3 83.5
Danyore 11.2 20.9 67.9
Dumordo 2.4 0.1 97.5
Haramosh 18.7 26.9 54.4
HIsper 5.1 3.1 91.8
Hoper 8.9 5.7 85.3
Hushey 2.6 0.1 97.3
Jutal/Jaglot 10.5 12.8 76.7
Kharku 6.4 0.0 93.6
Minapin 16.8 11.9 71.3
Shengus 10.9 11.6 77.5
Shigar 6.1 8.8 85.1
Thalley 2.4 4.5 93.0
Tormik 15.1 7.2 77.6
Regarding altitudinal and aspect distribution, the results of the analyses highlight the
different ecological needs of each species: birch and other high altitude broadleaves are
mainly located on North and North East exposed slopes, in a narrow altitudinal range (3300-
3900 m a.s.l.).
Fig. 19: Altitudinal distribution (m a.s.l.) for the main forest types (relative percentage). Full black bars: conifers,
grey bars: broadleaves, white bars: Junipers).
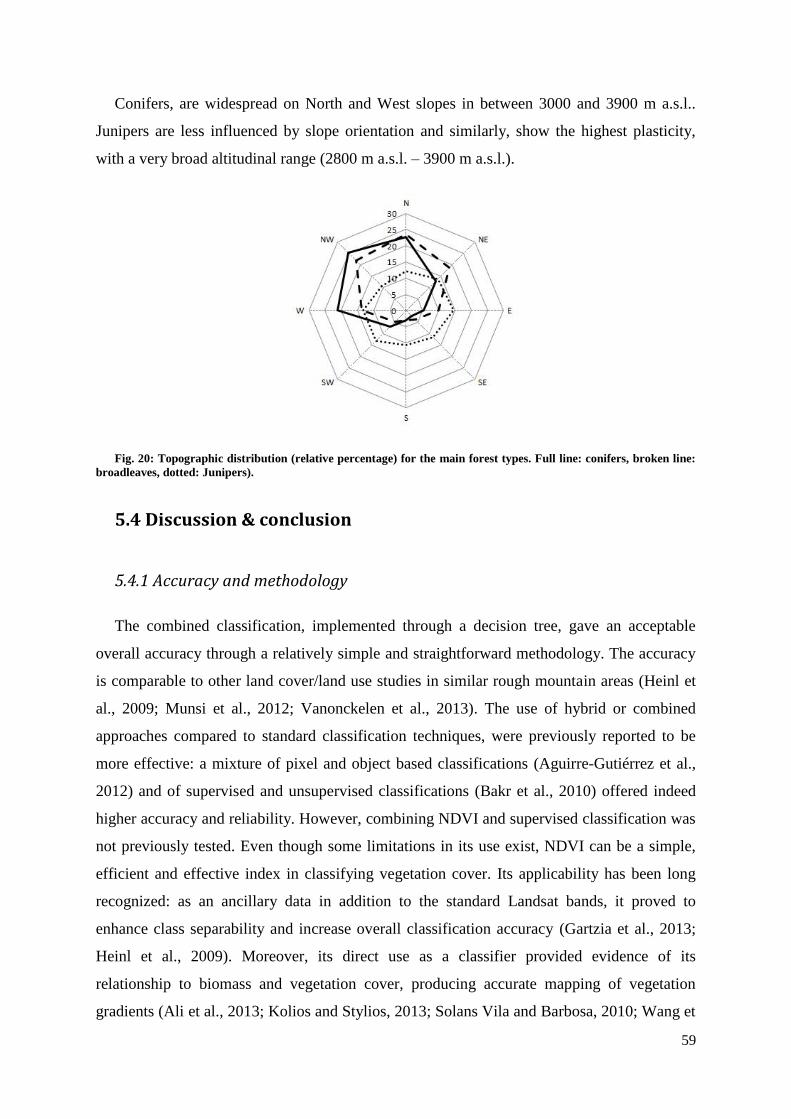
59
Conifers, are widespread on North and West slopes in between 3000 and 3900 m a.s.l..
Junipers are less influenced by slope orientation and similarly, show the highest plasticity,
with a very broad altitudinal range (2800 m a.s.l. – 3900 m a.s.l.).
Fig. 20: Topographic distribution (relative percentage) for the main forest types. Full line: conifers, broken line:
broadleaves, dotted: Junipers).
5.4 Discussion & conclusion
5.4.1 Accuracy and methodology
The combined classification, implemented through a decision tree, gave an acceptable
overall accuracy through a relatively simple and straightforward methodology. The accuracy
is comparable to other land cover/land use studies in similar rough mountain areas (Heinl et
al., 2009; Munsi et al., 2012; Vanonckelen et al., 2013). The use of hybrid or combined
approaches compared to standard classification techniques, were previously reported to be
more effective: a mixture of pixel and object based classifications (Aguirre-Gutiérrez et al.,
2012) and of supervised and unsupervised classifications (Bakr et al., 2010) offered indeed
higher accuracy and reliability. However, combining NDVI and supervised classification was
not previously tested. Even though some limitations in its use exist, NDVI can be a simple,
efficient and effective index in classifying vegetation cover. Its applicability has been long
recognized: as an ancillary data in addition to the standard Landsat bands, it proved to
enhance class separability and increase overall classification accuracy (Gartzia et al., 2013;
Heinl et al., 2009). Moreover, its direct use as a classifier provided evidence of its
relationship to biomass and vegetation cover, producing accurate mapping of vegetation
gradients (Ali et al., 2013; Kolios and Stylios, 2013; Solans Vila and Barbosa, 2010; Wang et
60
al., 2009). According to our results, NDVI can be profitably used as a classifier, especially in
dry environments where land cover/land use classes can be differentiated according to
vegetation cover. In those conditions, NDVI proved to be more reliable than standards
classifications. This is consequence of the difficulties of those algorithms to correctly classify
geologically different bare rocks/soils in classes where soil background has a large effect.
Taking advantage of NDVI ability to distinguish between vegetated and unvegetated areas
can increase considerably land cover accuracy. With the combined use of supervised
classification to detect different types of vegetation, moreover, even the limitation imposed
by NDVI saturation and its inability to spectrally distinguish different vegetation types (Jones
and Vaughan, 2010; Mather and Koch, 2011) can be overcome. The results obtained
demonstrate that this is a feasible and robust approach. Some general suggestions before its
use shall be noted: first, selection of good quality satellite images with reduced cloud and
haze cover is critical to avoid interference with NDVI calculation even if this index is more
stable than standard classification algorithm alone (Jones and Vaughan, 2010; Kozak et al.,
2008). Secondly, knowledge of study area’s flora ecology is an essential precondition to
ensure the capture of full vegetation development at all altitudes. In mountain areas as CKNP,
there might be large differences in seasonality of vegetation growth at different elevations.
This might lead to classification errors and, therefore, reduce final accuracy in the case leaf
development, and therefore chlorophyll content, is not complete (i.e. WWF (2009) land
cover/land use map missing broadleaves forests or, as in Bakr (2010), fallow fields classified
as un-vegetated). Thirdly, knowledge of the area is necessary for the development of
meaningful land cover classes hierarchically defined according to vegetation cover gradients.
5.4.2 Land cover characteristic
The land cover/land use map developed for CKNP represents a valuable source of
information, both for scientists as well as Park managers. It revealed unequally distributed
environmental resources among the different Park valleys. Vegetation cover follows a clear
longitudinal as well as latitudinal gradient: Western valleys are richer in forests and sparse
trees classes compared to the valleys lying in the Eastern sector, where scattered vegetation
and bare rock are dominant. Additionally, forest cover is scarce to absent north of the main
Karakorum ridge. This distributional pattern is probably consequence of a parallel trend in
precipitation in which Western valleys are marginally influenced by summer monsoon and
Westerly dominated low pressures (Treydte et al., 2006) contrary to the Eastern Park area
61
which, hidden by the high ridges of Himalayan range (Nanga Parbat massif), are in a rain
shadow zone.
The distribution patterns observed for single species gives insights about their ecological
needs. Conifers and high altitude broadleaves in open and close forest classes, revealed clear
altitudinal as well as topographical trends depicted in other land cover studies from central
Asian countries (i.e. Mongolia, Bayarsaikhan et al., 2009; Indian Himalaya, Sharma et al.,
2010). The most water exigent species (i.e. Birch) are mainly located on North or East
exposed slopes and at high elevation, where late season snow melting represents an important
additional water reservoir during growing season. Pinaceae are following a similar pattern,
contrary to Junipers which are exhibiting typical character of frugal species as the broad
altitudinal and topographical distribution suggest. The altitudinal distribution of those forest
classes confirms previous findings from the area (Du, 1998; Miehe and Miehe, 1998).
5.4.3 Consequence for Park management
The vegetation map produced provides the Park managers with valuable data to develop
management guidelines. The results clearly suggest that rather than general indications valid
for the whole Park, valley based management approach should be promoted. The
establishment of plantations, often recommended by many governmental and non-
governmental organizations, as a measure to reduce pressure on natural forests, shall be
prioritized according to per valley forest availability, starting from those who revealed a
chronic lack/degradation of wood resources. The distribution of natural forest trees,
additionally, suggests to carefully plan reforestation and enriching seeding according to the
elevation and exposition revealed in this study.
Pakistan faces several problems related to natural resource management, among which
over-exploitation and degradation of forests is one of the main issue (UN, 2012). UN
estimates suggest that the yearly costs related to environmental degradation account for
nearly three per cent of country GDP. Vulnerable populations, living in the valleys of CKNP,
might benefit from improved sustainable environmental management practices, including
livestock and forest management.

63
CHAPTER 6
LYING THE FUNDATION FOR SUSTAINABLE
FOREST MANAGEMENT IN THE REMOTE
VALLEYS OF THE CENTRAL KARAKORUM
NATIONAL PARK
6.1 Introduction
Pakistan is a country with scarce forest cover, a large and increasing population and the
highest deforestation rate in Asia (FAO, 2010). Scattered forests, mainly concentrated in its
northern mountain ranges, Himalaya, Karakorum and Hindu Kush, are increasingly
disappearing due to direct and indirect drivers among which firewood consumptions (Nüsser,
2000), high harvesting rates and mismanagement (Ali et al., 2005; Ali et al., 2006),
reclamation of forest land for agriculture (Qasim et al., 2011). This is resulting in large
emission of greenhouse gases, major threat for biodiversity and scarce resilience of poor local
communities, heavily relying on them (Busch et al., 2011; Shahbaz et al., 2007; van der Werf
et al., 2009). To reduce those adverse human effects, sustainable forest management (SFM)
has long been recognized as one of the key priority (FAO, 2012; UN, 1992a; UN, 1992b).
Many definitions of SFM have been proposed based on broad concepts involving social
economical and environmental issues (Angelstam et al., 2004; Kennedy et al., 2001).
However, from a simplistic and strictly management oriented point of view, SFM can be
summarized as the need to ensure that, over a certain area and in a defined time frame, wood
felling are not overtopping forest yield (Davis et al., 2001; Irland, 2010). This, together with
rational management practices, would ensure the long-term retention of forest stock, without
further reductions in the total amount of wood. In Pakistan northern mountain ranges,
however, lack of forest inventories (Gohar, 2002) make the precise assessment of forest
biomass (AGB) and current annual increment (CAI) particularly difficult. This is especially
64
true in remote locations, where large scale on-ground inventories are time-consuming and
considerably expensive. Thus, remote sensing can be considered the only cost-effective and
appropriate methodology to obtain spatially explicit and comprehensive information about
these two important biophysical forest parameters (Ji et al., 2012; Langner et al., 2012; Lu,
2006). The use of satellite images for AGB estimate has received increasing attentions in the
last decades, especially to evaluate forest carbon stock and its fluxes as a consequence of
recently developed REDD schemes and a wide array of methodologies have been developed
(Avitabile et al., 2012; Dong et al., 2003). Mapping of forest stock, even over large areas, can
today be considered reliable if appropriate techniques are developed (Goetz et al., 2009). This
study focuses on the Central Karakorum National Park (CKNP), Gilgit – Baltistan Province,
Pakistan, a protected area created in 1994 for the protection of valuable communities of
animals and plants. Here, the development of a SFM is considered a priority, in an area where
local communities are heavily dependent on woody biomass for construction (bridges,
houses) and energy (cooking, heating) purposes (IUCN, 2003c; IUCN, 2009) and where
forest degradation is mainly consequence of mismanagement and increased firewood demand
(Ali et al., 2005; Schickhoff, 1998). Additionally, at the moment, there are no feasible
alternative for those living around the Park borders to uncouple their livelihood from forest
products, particularly firewood (Khan and Khan, 2009). Conservation of forests, therefore,
can only be met through a management as respectful of local communities living needs as of
forest reproductive capacity.
This study aims to provide forest managers working in remote mountain areas with scarce
a priori information a methodological framework for the promotion of SFM. In particular, we
aimed at gather information about the basic parameters needed to define appropriate
management guidelines and to prioritize interventions (i.e. efficient wood-stoves and specific
plantation) in the most forest deficient areas. To reach the objective we divided our study in
two main investigations: i) assessment of forest biomass and yield through remote sensing
and field data and ii) assessment of local communities wood needs. The comparison of those
data will reveal how to better iii) prioritize intervention at a village level. Indeed, large
differences exists regarding forest resources availability and uses among valleys and between
villages as previous studies called for village based approaches (Shahbaz et al., 2011). The
work presents the results from case study villages located in 9 valleys of the Central
Karakorum National Park.
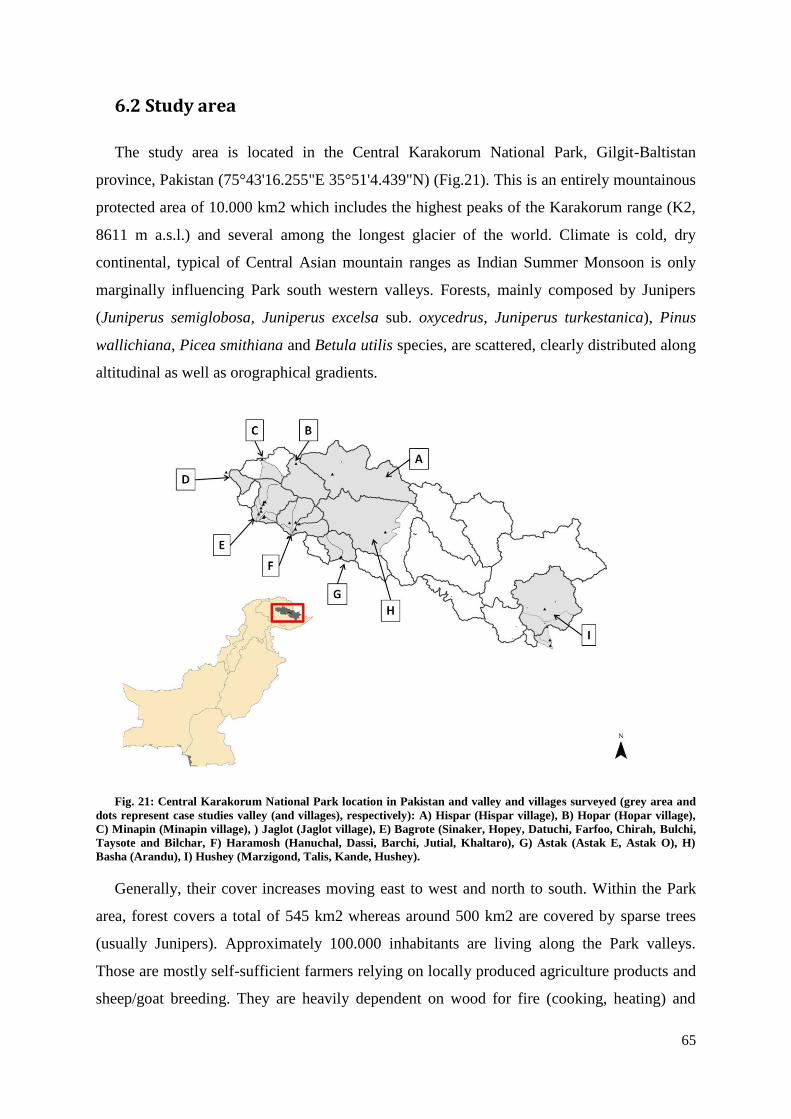
65
6.2 Study area
The study area is located in the Central Karakorum National Park, Gilgit-Baltistan
province, Pakistan (75°43'16.255"E 35°51'4.439"N) (Fig.21). This is an entirely mountainous
protected area of 10.000 km2 which includes the highest peaks of the Karakorum range (K2,
8611 m a.s.l.) and several among the longest glacier of the world. Climate is cold, dry
continental, typical of Central Asian mountain ranges as Indian Summer Monsoon is only
marginally influencing Park south western valleys. Forests, mainly composed by Junipers
(Juniperus semiglobosa, Juniperus excelsa sub. oxycedrus, Juniperus turkestanica), Pinus
wallichiana, Picea smithiana and Betula utilis species, are scattered, clearly distributed along
altitudinal as well as orographical gradients.
Fig. 21: Central Karakorum National Park location in Pakistan and valley and villages surveyed (grey area and
dots represent case studies valley (and villages), respectively): A) Hispar (Hispar village), B) Hopar (Hopar village),
C) Minapin (Minapin village), ) Jaglot (Jaglot village), E) Bagrote (Sinaker, Hopey, Datuchi, Farfoo, Chirah, Bulchi,
Taysote and Bilchar, F) Haramosh (Hanuchal, Dassi, Barchi, Jutial, Khaltaro), G) Astak (Astak E, Astak O), H)
Basha (Arandu), I) Hushey (Marzigond, Talis, Kande, Hushey).
Generally, their cover increases moving east to west and north to south. Within the Park
area, forest covers a total of 545 km2 whereas around 500 km2 are covered by sparse trees
(usually Junipers). Approximately 100.000 inhabitants are living along the Park valleys.
Those are mostly self-sufficient farmers relying on locally produced agriculture products and
sheep/goat breeding. They are heavily dependent on wood for fire (cooking, heating) and
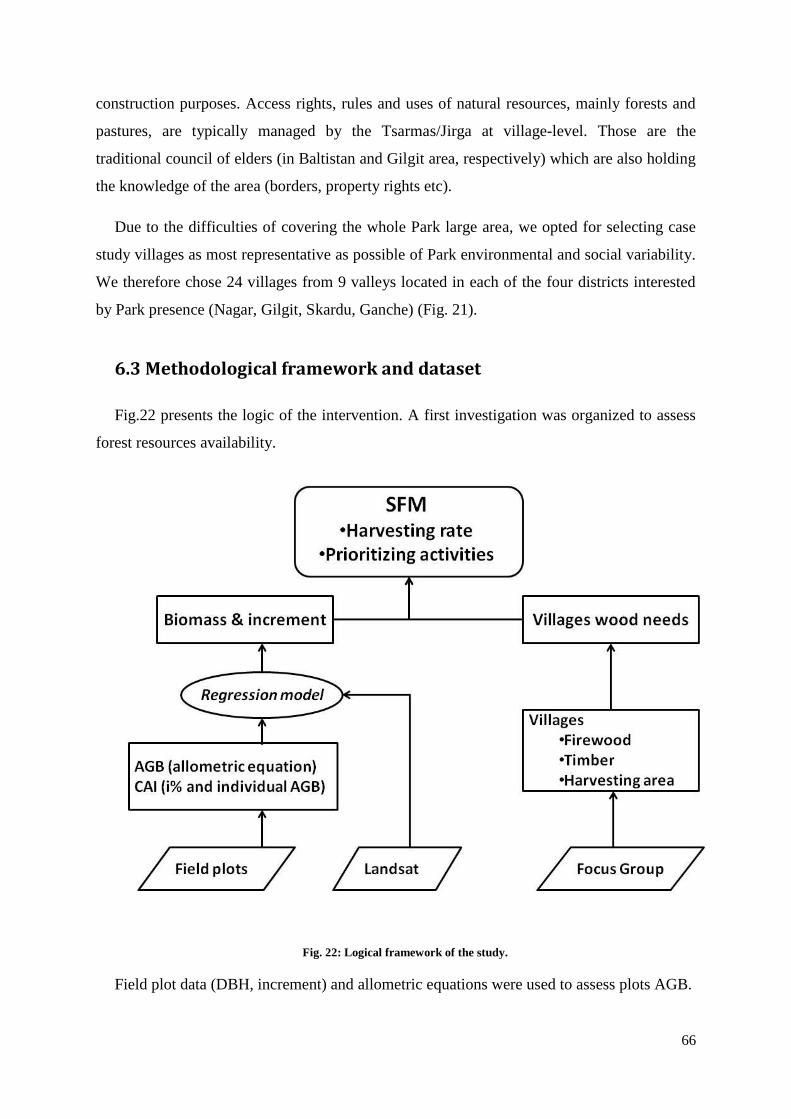
66
construction purposes. Access rights, rules and uses of natural resources, mainly forests and
pastures, are typically managed by the Tsarmas/Jirga at village-level. Those are the
traditional council of elders (in Baltistan and Gilgit area, respectively) which are also holding
the knowledge of the area (borders, property rights etc).
Due to the difficulties of covering the whole Park large area, we opted for selecting case
study villages as most representative as possible of Park environmental and social variability.
We therefore chose 24 villages from 9 valleys located in each of the four districts interested
by Park presence (Nagar, Gilgit, Skardu, Ganche) (Fig. 21).
6.3 Methodological framework and dataset
Fig.22 presents the logic of the intervention. A first investigation was organized to assess
forest resources availability.
Fig. 22: Logical framework of the study.
Field plot data (DBH, increment) and allometric equations were used to assess plots AGB.
67
Those were related, through regression models, to Landsat images derived spectral values.
After best model selection and validation, we predicted AGB values in un-sampled locations.
Subsequently, plot CAI was related to plot AGB through regression and this relation was
used to estimate the total CAI of village’s forests.
The second investigation aimed at assessing the needs of rural communities in terms of
firewood and timber and to define each village use-rights area. Simultaneously this was a
precious occasion to raise community awareness and capabilities regarding forest
management. For this purpose we organized focus group interviews with the representatives
of each village.
6.3.1 Field plots of AGB and CAI measurements
A field campaign was undertaken during summer 2008 in Bagrote valley to examine the
relations between remotely sensed data and AGB. The sampling plots location was defined
according to stratified system on areas with NDVI > 0 to ensure vegetation presence. A
randomly selected sub-sample of 80 plots of 1256 m2 each (r=20 m) was arranged. Those
were located in homogeneous areas (i.e. distant from edges or borders) to reduce errors and
disturbances. In each plot we measured: coordinates of plot centroide with GPS,
orientation/slope/elevation, specie and DBH of all trees with H>1.3 meters and for one tree
every three the height and a 1 cm long increment core. Only plots with trees cover were
retained (58 out of 80).
6.3.2 Satellite data
To cover the Park area, three Landsat 5 TM images with a 30x30 m spatial resolution were
obtained from the Earth Explorer portal at product level 1T (WRS path: 149-035;148-035 and
148-036). We acquired the most cloud-free images, as closest as possible to field campaign
dates, collected in summer months to capture full vegetation development at all elevation
ranges. The three images used are all dating from August 2009. Raw digital numbers (DN) of
the 6 non thermal bands of the composite were converted to at-sensor reflectance. A DEM
derived from the high-spatial-resolution multispectral images of ASTER (GDEM2) was used
to correct satellite images for topographic effect using the C-correction algorithm (Teillet et
al., 1982). Snow and cloud were masked using NDSI and B1 threshold values empirically set
after visual inspection of images composite. We classify the images in vegetation classes by
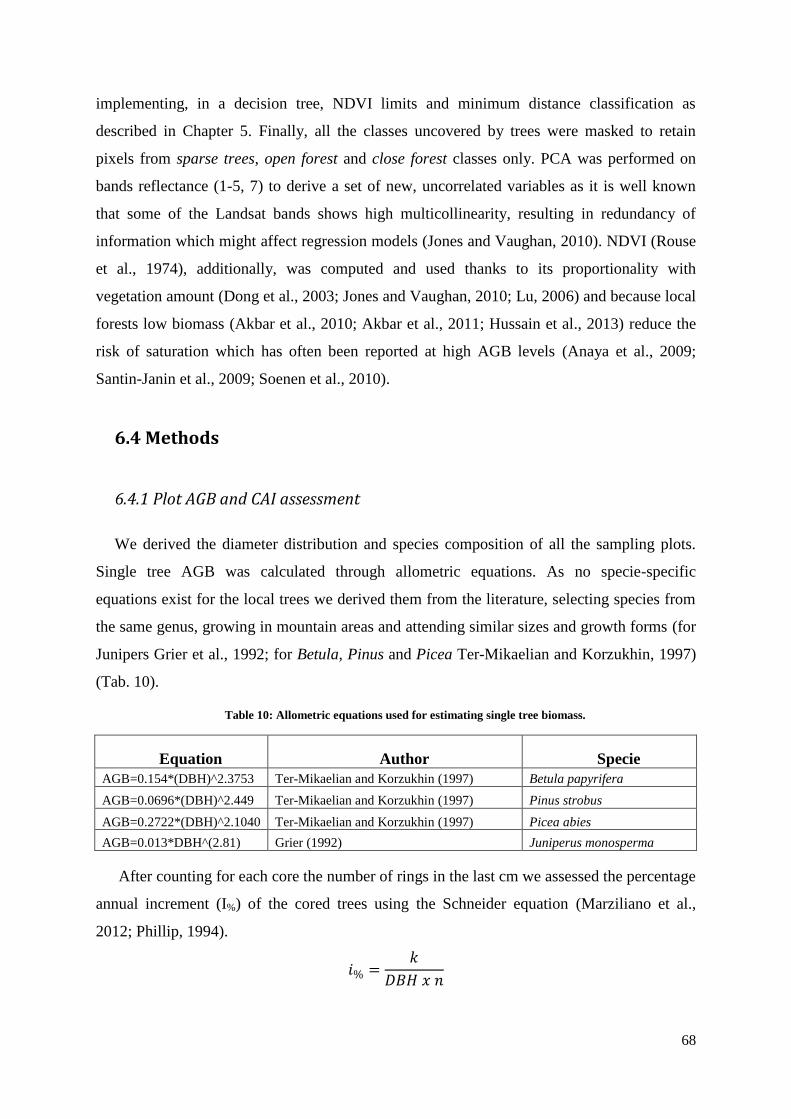
68
implementing, in a decision tree, NDVI limits and minimum distance classification as
described in Chapter 5. Finally, all the classes uncovered by trees were masked to retain
pixels from sparse trees, open forest and close forest classes only. PCA was performed on
bands reflectance (1-5, 7) to derive a set of new, uncorrelated variables as it is well known
that some of the Landsat bands shows high multicollinearity, resulting in redundancy of
information which might affect regression models (Jones and Vaughan, 2010). NDVI (Rouse
et al., 1974), additionally, was computed and used thanks to its proportionality with
vegetation amount (Dong et al., 2003; Jones and Vaughan, 2010; Lu, 2006) and because local
forests low biomass (Akbar et al., 2010; Akbar et al., 2011; Hussain et al., 2013) reduce the
risk of saturation which has often been reported at high AGB levels (Anaya et al., 2009;
Santin-Janin et al., 2009; Soenen et al., 2010).
6.4 Methods
6.4.1 Plot AGB and CAI assessment
We derived the diameter distribution and species composition of all the sampling plots.
Single tree AGB was calculated through allometric equations. As no specie-specific
equations exist for the local trees we derived them from the literature, selecting species from
the same genus, growing in mountain areas and attending similar sizes and growth forms (for
Junipers Grier et al., 1992; for Betula, Pinus and Picea Ter-Mikaelian and Korzukhin, 1997)
(Tab. 10).
Table 10: Allometric equations used for estimating single tree biomass.
Equation Author Specie
AGB=0.154*(DBH)^2.3753 Ter-Mikaelian and Korzukhin (1997) Betula papyrifera
AGB=0.0696*(DBH)^2.449 Ter-Mikaelian and Korzukhin (1997) Pinus strobus
AGB=0.2722*(DBH)^2.1040 Ter-Mikaelian and Korzukhin (1997) Picea abies
AGB=0.013*DBH^(2.81) Grier (1992) Juniperus monosperma
After counting for each core the number of rings in the last cm we assessed the percentage
annual increment (I%) of the cored trees using the Schneider equation (Marziliano et al.,
2012; Phillip, 1994).
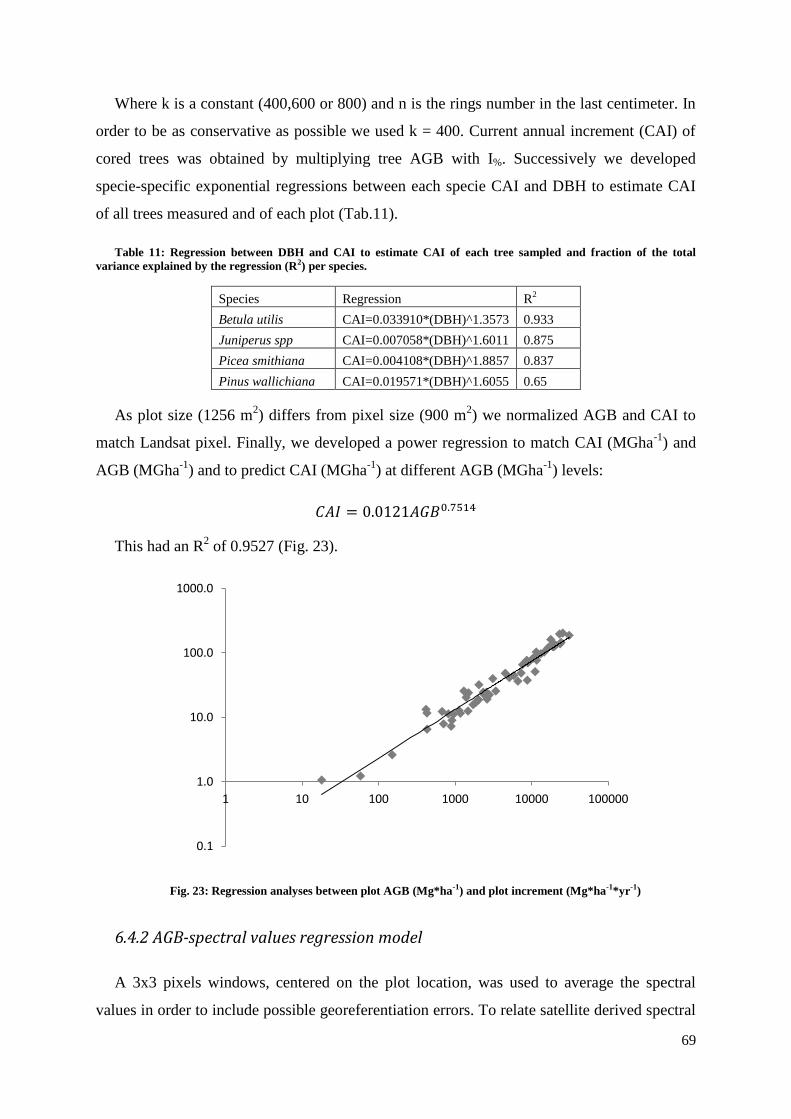
69
Where k is a constant (400,600 or 800) and n is the rings number in the last centimeter. In
order to be as conservative as possible we used k = 400. Current annual increment (CAI) of
cored trees was obtained by multiplying tree AGB with I%. Successively we developed
specie-specific exponential regressions between each specie CAI and DBH to estimate CAI
of all trees measured and of each plot (Tab.11).
Table 11: Regression between DBH and CAI to estimate CAI of each tree sampled and fraction of the total
variance explained by the regression (R2) per species.
Species Regression R2
Betula utilis CAI=0.033910*(DBH)^1.3573 0.933
Juniperus spp CAI=0.007058*(DBH)^1.6011 0.875
Picea smithiana CAI=0.004108*(DBH)^1.8857 0.837
Pinus wallichiana CAI=0.019571*(DBH)^1.6055 0.65
As plot size (1256 m2) differs from pixel size (900 m
2) we normalized AGB and CAI to
match Landsat pixel. Finally, we developed a power regression to match CAI (MGha-1
) and
AGB (MGha-1
) and to predict CAI (MGha-1
) at different AGB (MGha-1
) levels:
This had an R2 of 0.9527 (Fig. 23).
Fig. 23: Regression analyses between plot AGB (Mg*ha-1) and plot increment (Mg*ha-1*yr-1)
6.4.2 AGB-spectral values regression model
A 3x3 pixels windows, centered on the plot location, was used to average the spectral
values in order to include possible georeferentiation errors. To relate satellite derived spectral
0.1
1.0
10.0
100.0
1000.0
1 10 100 1000 10000 100000
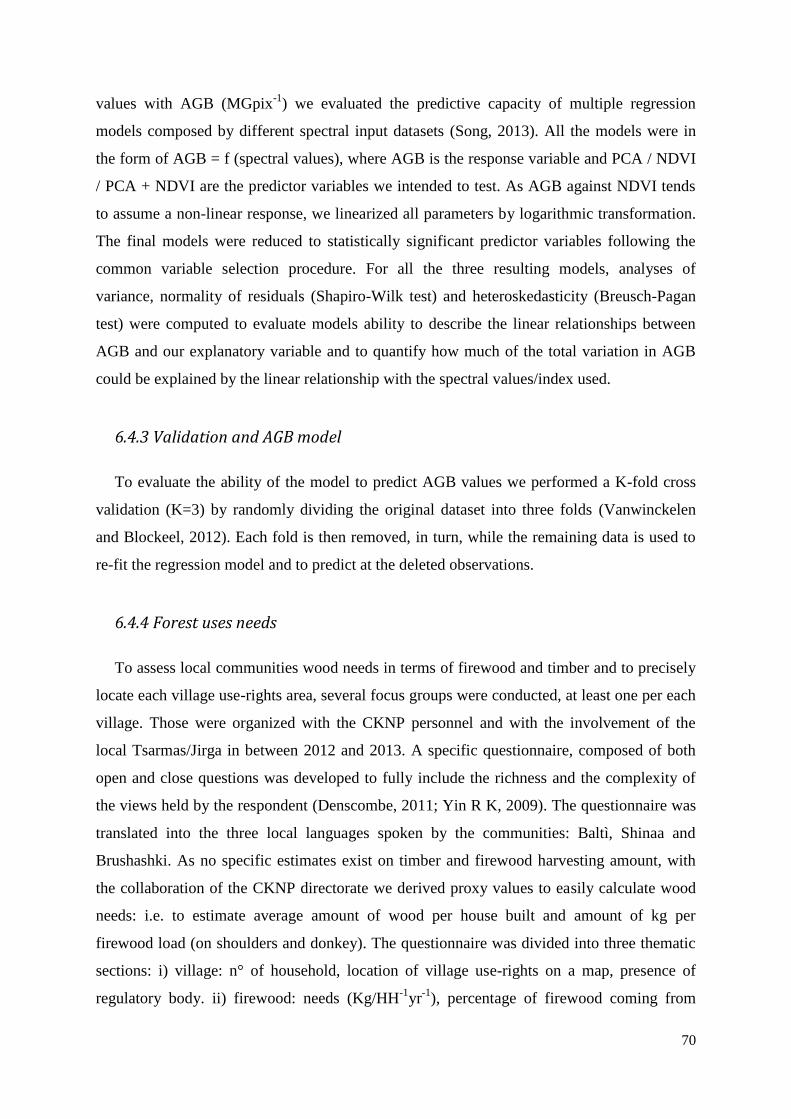
70
values with AGB (MGpix-1
) we evaluated the predictive capacity of multiple regression
models composed by different spectral input datasets (Song, 2013). All the models were in
the form of AGB = f (spectral values), where AGB is the response variable and PCA / NDVI
/ PCA + NDVI are the predictor variables we intended to test. As AGB against NDVI tends
to assume a non-linear response, we linearized all parameters by logarithmic transformation.
The final models were reduced to statistically significant predictor variables following the
common variable selection procedure. For all the three resulting models, analyses of
variance, normality of residuals (Shapiro-Wilk test) and heteroskedasticity (Breusch-Pagan
test) were computed to evaluate models ability to describe the linear relationships between
AGB and our explanatory variable and to quantify how much of the total variation in AGB
could be explained by the linear relationship with the spectral values/index used.
6.4.3 Validation and AGB model
To evaluate the ability of the model to predict AGB values we performed a K-fold cross
validation (K=3) by randomly dividing the original dataset into three folds (Vanwinckelen
and Blockeel, 2012). Each fold is then removed, in turn, while the remaining data is used to
re-fit the regression model and to predict at the deleted observations.
6.4.4 Forest uses needs
To assess local communities wood needs in terms of firewood and timber and to precisely
locate each village use-rights area, several focus groups were conducted, at least one per each
village. Those were organized with the CKNP personnel and with the involvement of the
local Tsarmas/Jirga in between 2012 and 2013. A specific questionnaire, composed of both
open and close questions was developed to fully include the richness and the complexity of
the views held by the respondent (Denscombe, 2011; Yin R K, 2009). The questionnaire was
translated into the three local languages spoken by the communities: Baltì, Shinaa and
Brushashki. As no specific estimates exist on timber and firewood harvesting amount, with
the collaboration of the CKNP directorate we derived proxy values to easily calculate wood
needs: i.e. to estimate average amount of wood per house built and amount of kg per
firewood load (on shoulders and donkey). The questionnaire was divided into three thematic
sections: i) village: n° of household, location of village use-rights on a map, presence of
regulatory body. ii) firewood: needs (Kg/HH-1
yr-1
), percentage of firewood coming from
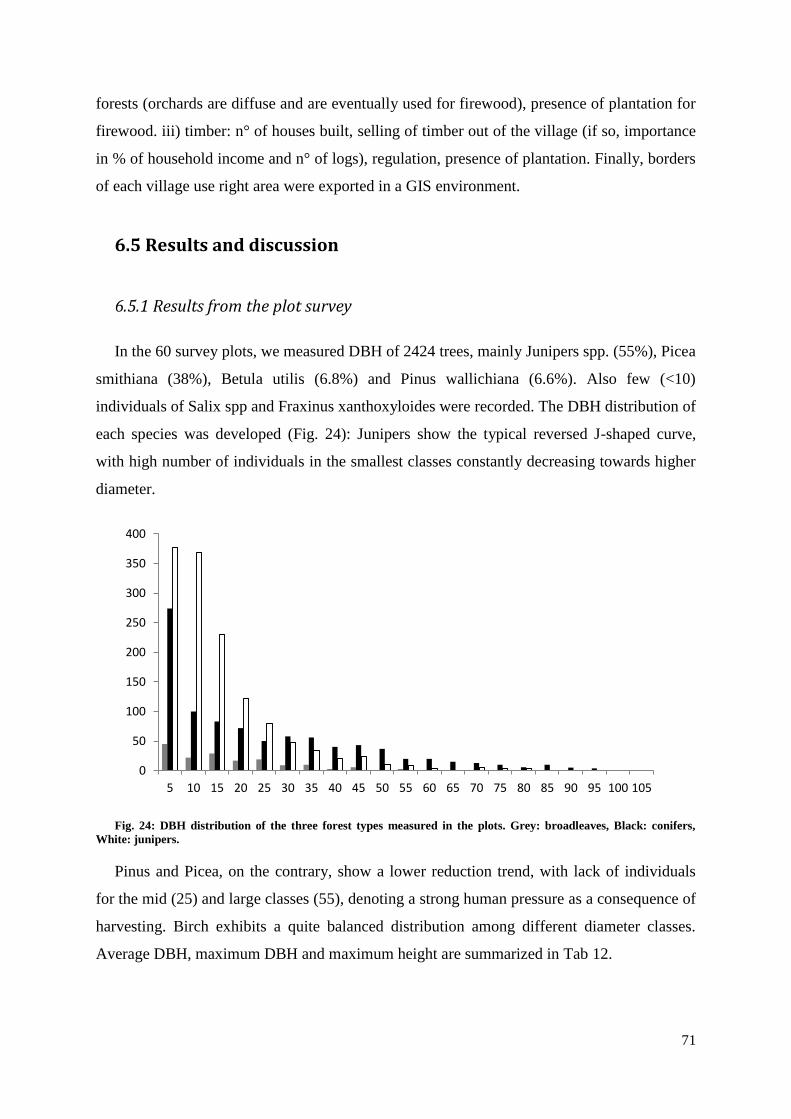
71
forests (orchards are diffuse and are eventually used for firewood), presence of plantation for
firewood. iii) timber: n° of houses built, selling of timber out of the village (if so, importance
in % of household income and n° of logs), regulation, presence of plantation. Finally, borders
of each village use right area were exported in a GIS environment.
6.5 Results and discussion
6.5.1 Results from the plot survey
In the 60 survey plots, we measured DBH of 2424 trees, mainly Junipers spp. (55%), Picea
smithiana (38%), Betula utilis (6.8%) and Pinus wallichiana (6.6%). Also few (<10)
individuals of Salix spp and Fraxinus xanthoxyloides were recorded. The DBH distribution of
each species was developed (Fig. 24): Junipers show the typical reversed J-shaped curve,
with high number of individuals in the smallest classes constantly decreasing towards higher
diameter.
Fig. 24: DBH distribution of the three forest types measured in the plots. Grey: broadleaves, Black: conifers,
White: junipers.
Pinus and Picea, on the contrary, show a lower reduction trend, with lack of individuals
for the mid (25) and large classes (55), denoting a strong human pressure as a consequence of
harvesting. Birch exhibits a quite balanced distribution among different diameter classes.
Average DBH, maximum DBH and maximum height are summarized in Tab 12.
0
50
100
150
200
250
300
350
400
5 10 15 20 25 30 35 40 45 50 55 60 65 70 75 80 85 90 95 100 105
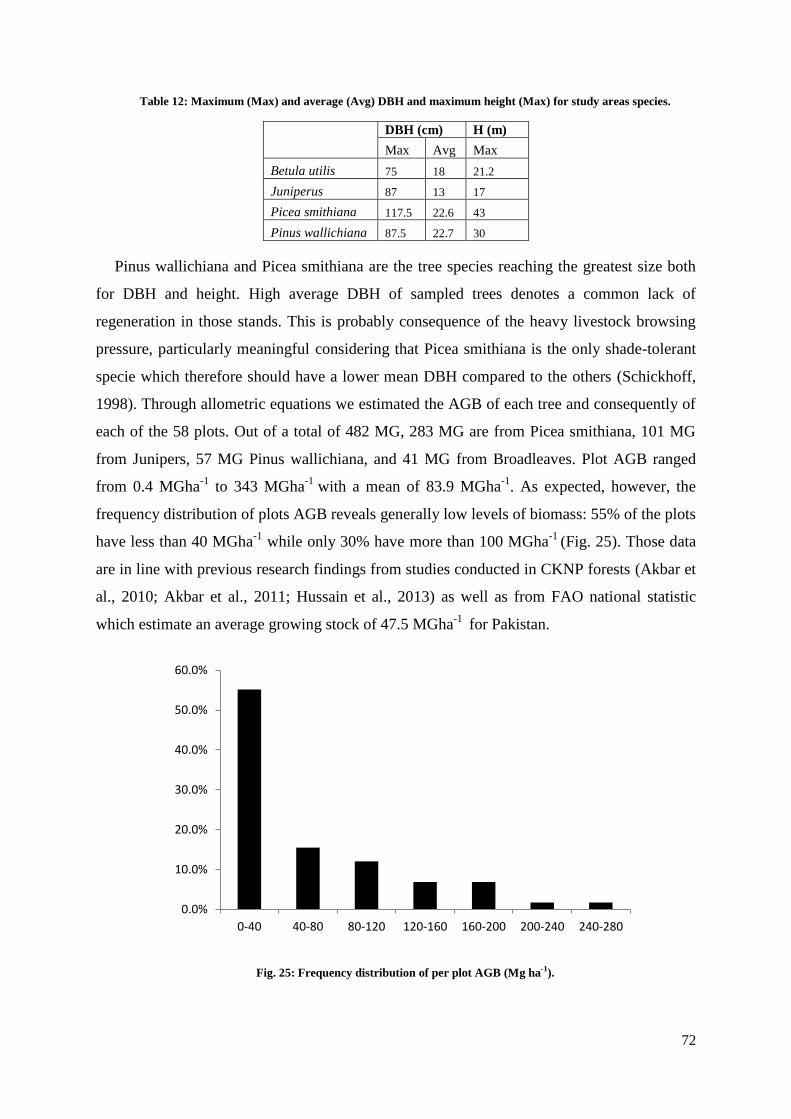
72
Table 12: Maximum (Max) and average (Avg) DBH and maximum height (Max) for study areas species.
DBH (cm) H (m)
Max Avg Max
Betula utilis 75 18 21.2
Juniperus 87 13 17
Picea smithiana 117.5 22.6 43
Pinus wallichiana 87.5 22.7 30
Pinus wallichiana and Picea smithiana are the tree species reaching the greatest size both
for DBH and height. High average DBH of sampled trees denotes a common lack of
regeneration in those stands. This is probably consequence of the heavy livestock browsing
pressure, particularly meaningful considering that Picea smithiana is the only shade-tolerant
specie which therefore should have a lower mean DBH compared to the others (Schickhoff,
1998). Through allometric equations we estimated the AGB of each tree and consequently of
each of the 58 plots. Out of a total of 482 MG, 283 MG are from Picea smithiana, 101 MG
from Junipers, 57 MG Pinus wallichiana, and 41 MG from Broadleaves. Plot AGB ranged
from 0.4 MGha-1
to 343 MGha-1
with a mean of 83.9 MGha-1
. As expected, however, the
frequency distribution of plots AGB reveals generally low levels of biomass: 55% of the plots
have less than 40 MGha-1
while only 30% have more than 100 MGha-1
(Fig. 25). Those data
are in line with previous research findings from studies conducted in CKNP forests (Akbar et
al., 2010; Akbar et al., 2011; Hussain et al., 2013) as well as from FAO national statistic
which estimate an average growing stock of 47.5 MGha-1
for Pakistan.
Fig. 25: Frequency distribution of per plot AGB (Mg ha-1).
0.0%
10.0%
20.0%
30.0%
40.0%
50.0%
60.0%
0-40 40-80 80-120 120-160 160-200 200-240 240-280
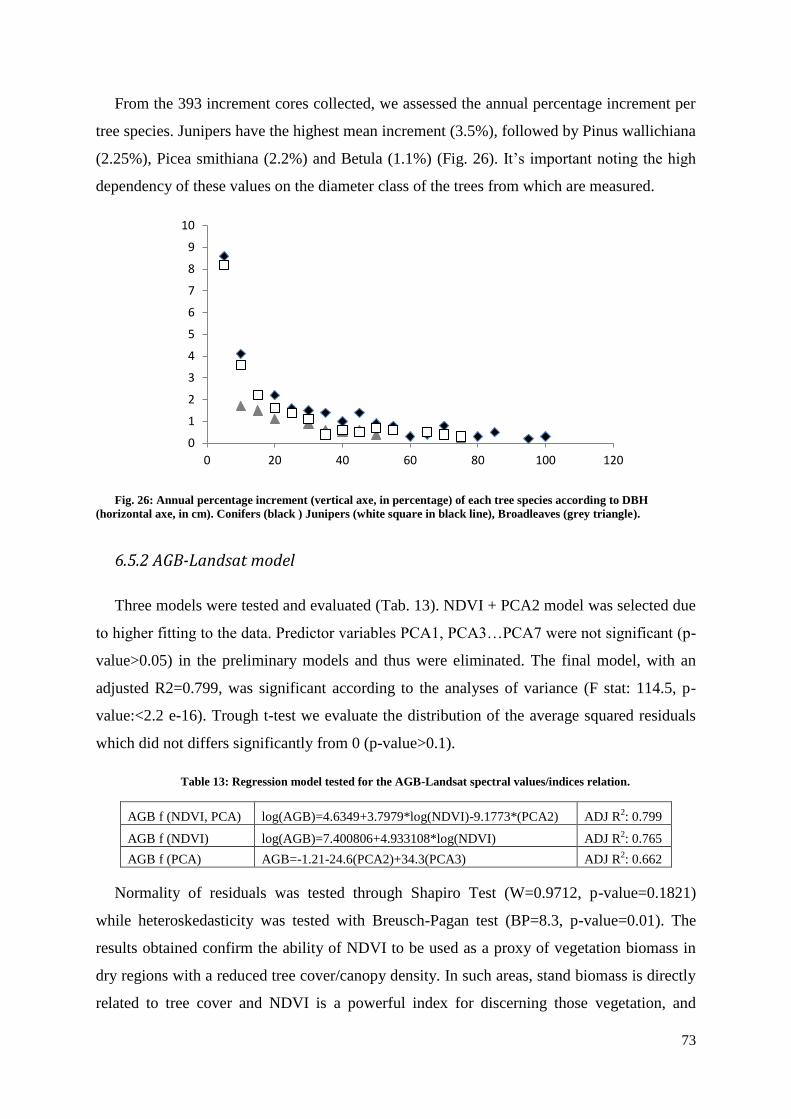
73
From the 393 increment cores collected, we assessed the annual percentage increment per
tree species. Junipers have the highest mean increment (3.5%), followed by Pinus wallichiana
(2.25%), Picea smithiana (2.2%) and Betula (1.1%) (Fig. 26). It’s important noting the high
dependency of these values on the diameter class of the trees from which are measured.
Fig. 26: Annual percentage increment (vertical axe, in percentage) of each tree species according to DBH
(horizontal axe, in cm). Conifers (black ) Junipers (white square in black line), Broadleaves (grey triangle).
6.5.2 AGB-Landsat model
Three models were tested and evaluated (Tab. 13). NDVI + PCA2 model was selected due
to higher fitting to the data. Predictor variables PCA1, PCA3…PCA7 were not significant (p-
value>0.05) in the preliminary models and thus were eliminated. The final model, with an
adjusted R2=0.799, was significant according to the analyses of variance (F stat: 114.5, p-
value:<2.2 e-16). Trough t-test we evaluate the distribution of the average squared residuals
which did not differs significantly from 0 (p-value>0.1).
Table 13: Regression model tested for the AGB-Landsat spectral values/indices relation.
AGB f (NDVI, PCA) log(AGB)=4.6349+3.7979*log(NDVI)-9.1773*(PCA2) ADJ R2: 0.799
AGB f (NDVI) log(AGB)=7.400806+4.933108*log(NDVI) ADJ R2: 0.765
AGB f (PCA) AGB=-1.21-24.6(PCA2)+34.3(PCA3) ADJ R2: 0.662
Normality of residuals was tested through Shapiro Test (W=0.9712, p-value=0.1821)
while heteroskedasticity was tested with Breusch-Pagan test (BP=8.3, p-value=0.01). The
results obtained confirm the ability of NDVI to be used as a proxy of vegetation biomass in
dry regions with a reduced tree cover/canopy density. In such areas, stand biomass is directly
related to tree cover and NDVI is a powerful index for discerning those vegetation, and
0
1
2
3
4
5
6
7
8
9
10
0 20 40 60 80 100 120
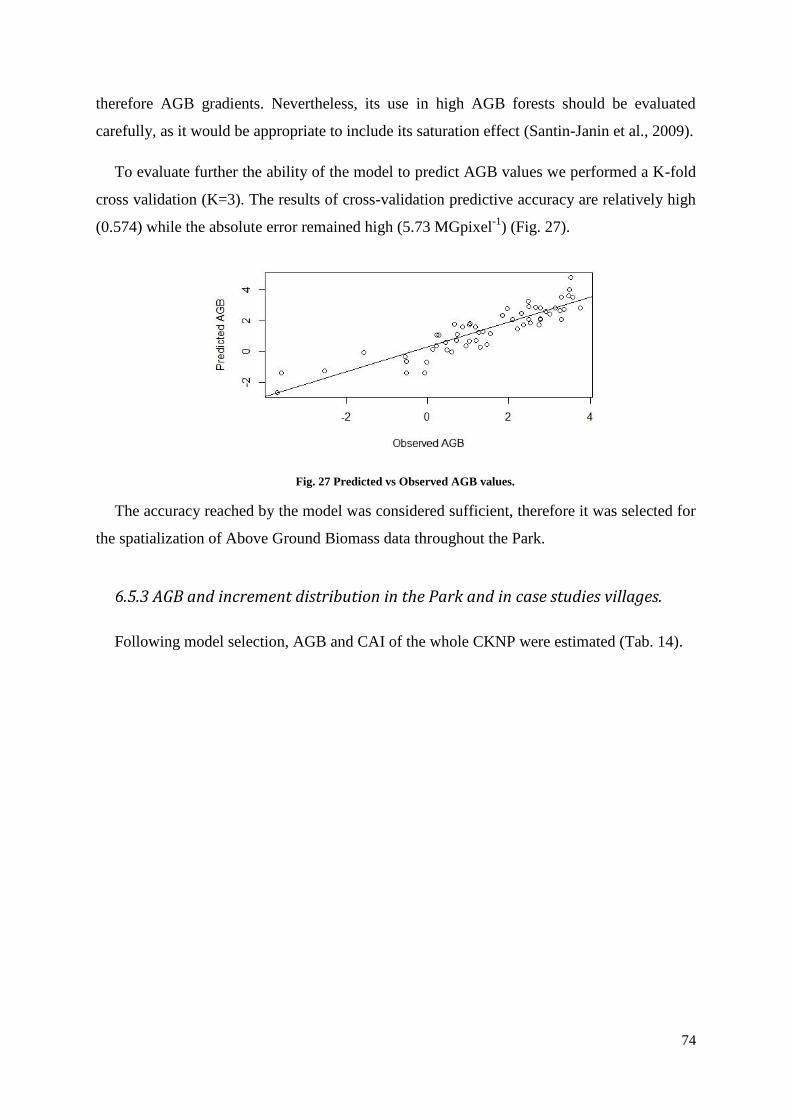
74
therefore AGB gradients. Nevertheless, its use in high AGB forests should be evaluated
carefully, as it would be appropriate to include its saturation effect (Santin-Janin et al., 2009).
To evaluate further the ability of the model to predict AGB values we performed a K-fold
cross validation (K=3). The results of cross-validation predictive accuracy are relatively high
(0.574) while the absolute error remained high (5.73 MGpixel-1
) (Fig. 27).
Fig. 27 Predicted vs Observed AGB values.
The accuracy reached by the model was considered sufficient, therefore it was selected for
the spatialization of Above Ground Biomass data throughout the Park.
6.5.3 AGB and increment distribution in the Park and in case studies villages.
Following model selection, AGB and CAI of the whole CKNP were estimated (Tab. 14).
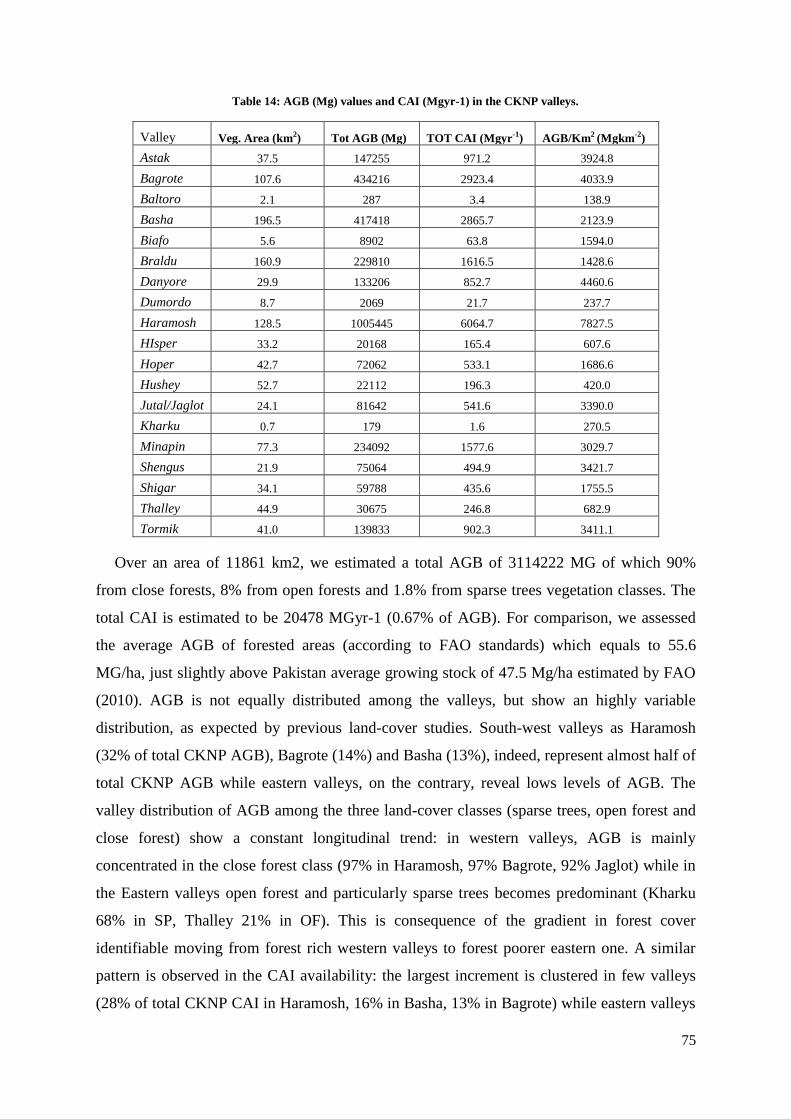
75
Table 14: AGB (Mg) values and CAI (Mgyr-1) in the CKNP valleys.
Valley Veg. Area (km2) Tot AGB (Mg) TOT CAI (Mgyr-1) AGB/Km2 (Mgkm-2)
Astak 37.5 147255 971.2 3924.8
Bagrote 107.6 434216 2923.4 4033.9
Baltoro 2.1 287 3.4 138.9
Basha 196.5 417418 2865.7 2123.9
Biafo 5.6 8902 63.8 1594.0
Braldu 160.9 229810 1616.5 1428.6
Danyore 29.9 133206 852.7 4460.6
Dumordo 8.7 2069 21.7 237.7
Haramosh 128.5 1005445 6064.7 7827.5
HIsper 33.2 20168 165.4 607.6
Hoper 42.7 72062 533.1 1686.6
Hushey 52.7 22112 196.3 420.0
Jutal/Jaglot 24.1 81642 541.6 3390.0
Kharku 0.7 179 1.6 270.5
Minapin 77.3 234092 1577.6 3029.7
Shengus 21.9 75064 494.9 3421.7
Shigar 34.1 59788 435.6 1755.5
Thalley 44.9 30675 246.8 682.9
Tormik 41.0 139833 902.3 3411.1
Over an area of 11861 km2, we estimated a total AGB of 3114222 MG of which 90%
from close forests, 8% from open forests and 1.8% from sparse trees vegetation classes. The
total CAI is estimated to be 20478 MGyr-1 (0.67% of AGB). For comparison, we assessed
the average AGB of forested areas (according to FAO standards) which equals to 55.6
MG/ha, just slightly above Pakistan average growing stock of 47.5 Mg/ha estimated by FAO
(2010). AGB is not equally distributed among the valleys, but show an highly variable
distribution, as expected by previous land-cover studies. South-west valleys as Haramosh
(32% of total CKNP AGB), Bagrote (14%) and Basha (13%), indeed, represent almost half of
total CKNP AGB while eastern valleys, on the contrary, reveal lows levels of AGB. The
valley distribution of AGB among the three land-cover classes (sparse trees, open forest and
close forest) show a constant longitudinal trend: in western valleys, AGB is mainly
concentrated in the close forest class (97% in Haramosh, 97% Bagrote, 92% Jaglot) while in
the Eastern valleys open forest and particularly sparse trees becomes predominant (Kharku
68% in SP, Thalley 21% in OF). This is consequence of the gradient in forest cover
identifiable moving from forest rich western valleys to forest poorer eastern one. A similar
pattern is observed in the CAI availability: the largest increment is clustered in few valleys
(28% of total CKNP CAI in Haramosh, 16% in Basha, 13% in Bagrote) while eastern valleys
76
show relatively low levels of total increment, with the only exception of Braldu (in which
high altitude broadleaves forests are quite abundant). The distribution of forest resources in
term of biomass and increment, therefore, call for a strictly valley based management
approaches, as other studies suggested (Shahbaz et al., 2011).
6.5.4 Local communities’ wood needs.
The communities living around CKNP are heavily dependent on forest resources located
inside and around the park boundary. Forests are essential for covering firewood necessities
(heating and cooking) and for the supplement of timber for construction. Additional they
represent an important grazing ground for local livestock. Generally, harvesting from natural
forests merely satisfies local needs and only in few valleys firewood and timber are sold to
local market cities of Gilgit and Skardu. Firewood consumptions represents almost 75% of
total community needs, those figures, however, are variable from valley to valley and from
village to village (Tab. 15). In particular some general consideration can be made: forests are
managed mostly at village level, and only in two valleys there are examples of co
management between villages (in Astak and Bagrote). The dependency of villages from
forest resources increases as altitude of villages increase. This is consequence of increased
firewood needs, and better accessibility to forest areas. In example, higher villages, located
close to 2700/2800 meters consume around 4 MGHH-1
yr-1
while lower villages (around 2000
meters) consume 2 MGHH-1
yr-1
. Those data are in line with previous estimates from
surrounding regions (Ali and Benjaminsen, 2004; Kumar and Sharma, 2009). Just one
village, Minapin, uses mostly gasoline or LPG for cooking and heating thanks to its favorable
location along Karakorum Highway and the higher income of its inhabitants. For most low
altitude villages, additionally, orchards pruning (especially apricot) is an important source of
firewood (up to 60%) while in drier valleys where forests are almost absent, as in Hushey or
Hispar, yak and cow dung is dried, stored and used for heating and cooking during the winter
months. Regarding timber, instead, villagers from eastern valleys rarely use local Juniper
woods for construction, as plantation of poplar and willow became relatively abundant in the
last two/three decades and are usually enough to satisfy local needs. In western valleys,
instead, rich in Pine and Spruce forests, timbers is frequently cut and in most cases strict rules
exist at village level to manage those highly valuable resources. Illegal harvesting for timber
selling is diffuse in few valleys, as Jaglot/Haramosh/Astak. The logging amount, however, is
usually regulated among households but harvesting rate exceeds by far forest yield. Lack of
77
management guidelines poses additional threats as harvesting is usually on small/medium
sized trees, irrespective of regeneration and without considering any rational silvicultural
prescription. Illegal timber harvesting is possible only if jeepable roads are connecting
villages to the main cities. In example, Khaltaro village, situated in forest-rich Haramosh
valley, due to bad road access is not interested by any large scale timber harvesting. As
previously revealed, those drivers of deforestation are common also in valleys outside of the
national Park: i.e. Basho (Ali et al., 2005; Schickhoff, 1998).
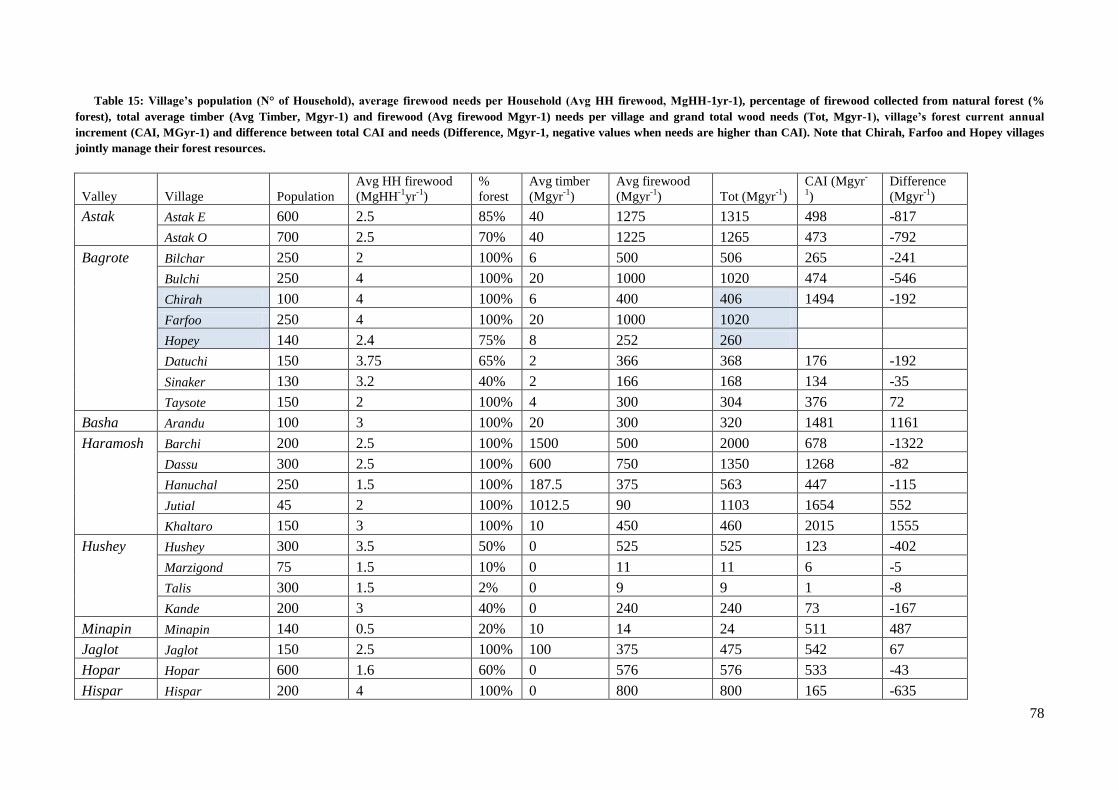
78
Table 15: Village’s population (N° of Household), average firewood needs per Household (Avg HH firewood, MgHH-1yr-1), percentage of firewood collected from natural forest (%
forest), total average timber (Avg Timber, Mgyr-1) and firewood (Avg firewood Mgyr-1) needs per village and grand total wood needs (Tot, Mgyr-1), village’s forest current annual
increment (CAI, MGyr-1) and difference between total CAI and needs (Difference, Mgyr-1, negative values when needs are higher than CAI). Note that Chirah, Farfoo and Hopey villages
jointly manage their forest resources.
Valley Village Population
Avg HH firewood
(MgHH-1
yr-1
)
%
forest
Avg timber
(Mgyr-1
)
Avg firewood
(Mgyr-1
) Tot (Mgyr-1
)
CAI (Mgyr-
1)
Difference
(Mgyr-1
)
Astak Astak E 600 2.5 85% 40 1275 1315 498 -817
Astak O 700 2.5 70% 40 1225 1265 473 -792
Bagrote Bilchar 250 2 100% 6 500 506 265 -241
Bulchi 250 4 100% 20 1000 1020 474 -546
Chirah 100 4 100% 6 400 406 1494 -192
Farfoo 250 4 100% 20 1000 1020
Hopey 140 2.4 75% 8 252 260
Datuchi 150 3.75 65% 2 366 368 176 -192
Sinaker 130 3.2 40% 2 166 168 134 -35
Taysote 150 2 100% 4 300 304 376 72
Basha Arandu 100 3 100% 20 300 320 1481 1161
Haramosh Barchi 200 2.5 100% 1500 500 2000 678 -1322
Dassu 300 2.5 100% 600 750 1350 1268 -82
Hanuchal 250 1.5 100% 187.5 375 563 447 -115
Jutial 45 2 100% 1012.5 90 1103 1654 552
Khaltaro 150 3 100% 10 450 460 2015 1555
Hushey Hushey 300 3.5 50% 0 525 525 123 -402
Marzigond 75 1.5 10% 0 11 11 6 -5
Talis 300 1.5 2% 0 9 9 1 -8
Kande 200 3 40% 0 240 240 73 -167
Minapin Minapin 140 0.5 20% 10 14 24 511 487
Jaglot Jaglot 150 2.5 100% 100 375 475 542 67
Hopar Hopar 600 1.6 60% 0 576 576 533 -43
Hispar Hispar 200 4 100% 0 800 800 165 -635
79
6.5.6 SFM promotion
According to the results of forest inventory and local community survey, natural forests at
the moment do not have always the potential to support the local’s needs. 16 out of 22
villages have unsustainable harvesting rate. In most cases this is consequence of the scarce
growth of local forest resources and the high firewood demands of the local communities.
Generalizing for the whole study area, it seems to be important to encourage out-of-forest
firewood plantation diffusion, through highly productive and easy to maintain short rotation
coppice systems. Those interventions shall be prioritize in the villages located in the eastern
CKNP where CAI is usually very low and at low elevation villages, where with sufficient
watering, production capabilities are higher. Incentives in the adoption of improved cooking
stove, whereas possible and accepted by locals, should be encouraged instead in high altitude
villages. Timber harvesting shall be managed according to sound silvicultural principles as
target diameter, planning of harvesting in time and space, specie-specific treatments for both
Pinus and Picea respectful of the different ecologic needs of those two species. The use of a
participatory approach and the implementation of specific courses to train the locals are
effective ways of integrating community interest and it is well-known that multi-disciplinary
education and training is key to the adoption of a sustainable forest management (Ellis and
Porter-Bolland, 2008; Mendoza and Prabhu, 2005). It is also necessary to identify among the
locals and the forest department employees, people that will be trained and then made
responsible for the implementation and monitoring of all the activities connected with forest
management. Additionally, from our visual inspection it seems important to manage and
monitor grazing pressure. In particular, regenerating areas shall be protected from grazing and
trampling by local livestock (Nüsser, 2000; Schickhoff, 1998). This could be met by
concentrating harvesting of trees in few, selected locations and, in collaboration with local
Jirga/Tsarmas, implement a grazing ban, wherever possible.
80
6.6 Conclusion
CKNP faces a high risk of forest degradation. This is mostly consequence of increased
firewood demand and mismanagement. Unsustainable forest management leads to further
degradation of forests, which affect their ability to deliver products and services to dependent
local communities. In an area characterize by rough topography and unstable geology, this means
also increased soil erosion, slope instability, as well as reduced carbon sequestration and threat for
biodiversity. A co-management between communities and Forest Department shall be prioritized,
as a basis to increase local awareness and capabilities in forest management. Simultaneously,
specific mitigation measures as coppice plantation and improved cooking stoves shall be adopted
to reduce the locals’ needs, especially in terms of firewood. This study, moreover, is one of the
first forest inventories in the area. The reliability of the data suggests its adoption also in the
future monitoring of Park forests resources.
81
CHAPTER 7
CAPACITY BUILDING AND MANAGEMENT
PLAN GUIDELINES
Pakistan is a country which has very little level of participation of local communities in
forest management (Shahbaz et al., 2011). Here, forest department is in charge of taking
forest related decisions at all levels (planning, monitoring, harvesting, etc) and direct
involvement of locals is uncommon (Shahbaz et al., 2007). Communities are being viewed as
the source of deforestation and forest degradation rather than an important stakeholder that,
with proper involvement, can improve forests conservation and management. If this belief is
partially congruent with the observations made in Central Karakorum National Park, the
current strict regulations applied to the forest sector did not halt or reduce the deforestation
rate anywhere in the country (FAO, 2012).
The top-down, centralized governance system, typical of former British colonies is one of
the main reasons behind those unsuccessful attempts, despite large founding and efforts both
from the Government and NGOs sectors (Ali and Benjaminsen, 2004; Ali and Nyborg, 2010;
Knudsen, 2011).
Contrary to other former colonial countries of South-Asia, as India, Nepal or Bhutan,
where participatory forest management is a reality since the 1980s, in Northern Pakistan little
improvement towards a less rigid governance system has been made (Rasul and Karki, 2007).
Generally, participation of communities in forest management is considered at three levels
(Ostrom, 1990; Rasul and Karki, 2007):
participation in the programming phase,
participation in the decision making process and
participation in the protection/management of forests .
82
Through the activities implemented in the CKNP during the thesis work, it was our aim to
develop awareness about forest importance and to increase communities participation at all
three levels. However, the strong rigidity in the local institutions, especially when dealing
about forest management in protected areas, heavily limited our “space of maneuver”.
This chapter describe the main measures which have been implemented during the last
three years to increase locals participation in forest management.
Specifically, the first subchapter (7.1) relates to the capacity building measures aimed at
providing skills in reforestation activities among locals and CKNP personnel. Those have
been undertaken in 2 valleys.
The last subchapter (7.2), contains the management plan guidelines developed after the
consultative process with local communities: in this phase, communities participation to the
decision making process was proactive and positive, but to involve them directly in the
management a proper legislative framework, of rights and duties, is needed. Regarding this
issue, recently, a progress towards a more flexible and comprehensive approach to forest
management in protected areas, through a relaxation of existing rules and regulation, gives
hope for future’s improvement.
This is not to mention that participatory processes are a long and continuous work, which
cannot be completed in a short/medium time span of only three years. Results, therefore, are
still at their preliminary phase. Indeed, the size of the Park, economic and time constraints has
forced us to limit the mitigation actions at just two valleys. However, the involvement of
locals and their positive attitude, makes it an important example which we hope might benefit
the development of a provincial-based change in governance system.
7.1 Capacity building and mitigation measures
In the Central Karakorum National Park there is large need of forest restoration activities.
The few example carried out by the provincial forest department, indeed, had often scarce
success since planting materials, species and site selections were poor. Additionally lack of
involvement of locals resulted in little acceptance and sense of ownership. This lead to heavy
browsing of seedlings by livestock (due to uncontrolled grazing, as in Jaglot valley),
destruction by land-owners (as in Haramosh), low survival rate of seedlings.
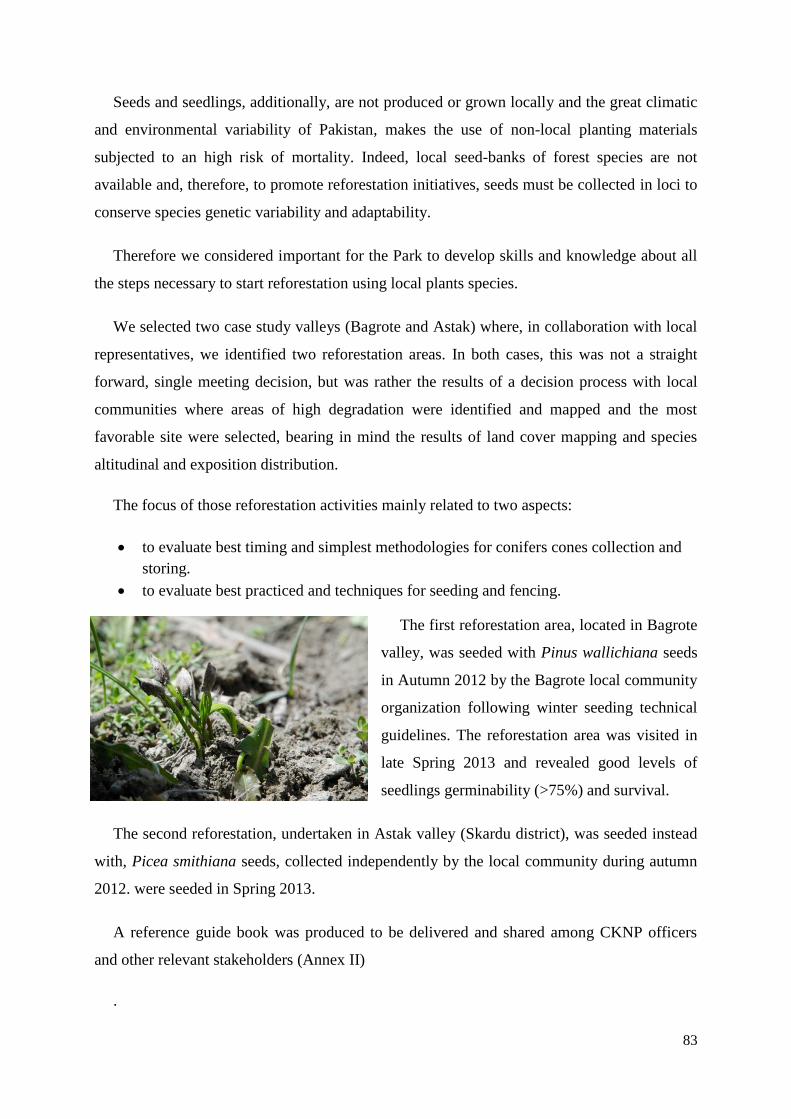
83
Seeds and seedlings, additionally, are not produced or grown locally and the great climatic
and environmental variability of Pakistan, makes the use of non-local planting materials
subjected to an high risk of mortality. Indeed, local seed-banks of forest species are not
available and, therefore, to promote reforestation initiatives, seeds must be collected in loci to
conserve species genetic variability and adaptability.
Therefore we considered important for the Park to develop skills and knowledge about all
the steps necessary to start reforestation using local plants species.
We selected two case study valleys (Bagrote and Astak) where, in collaboration with local
representatives, we identified two reforestation areas. In both cases, this was not a straight
forward, single meeting decision, but was rather the results of a decision process with local
communities where areas of high degradation were identified and mapped and the most
favorable site were selected, bearing in mind the results of land cover mapping and species
altitudinal and exposition distribution.
The focus of those reforestation activities mainly related to two aspects:
to evaluate best timing and simplest methodologies for conifers cones collection and
storing.
to evaluate best practiced and techniques for seeding and fencing.
The first reforestation area, located in Bagrote
valley, was seeded with Pinus wallichiana seeds
in Autumn 2012 by the Bagrote local community
organization following winter seeding technical
guidelines. The reforestation area was visited in
late Spring 2013 and revealed good levels of
seedlings germinability (>75%) and survival.
The second reforestation, undertaken in Astak valley (Skardu district), was seeded instead
with, Picea smithiana seeds, collected independently by the local community during autumn
2012. were seeded in Spring 2013.
A reference guide book was produced to be delivered and shared among CKNP officers
and other relevant stakeholders (Annex II)
.
84
7.2 Management plan guidelines
The following management indications aim at setting the basis for participatory and
sustainable forest management in the Central Karakoram National Park. This is a long lasting
and continuous process, where technical skills, community awareness and training of civil
society, forest department and park rangers are all necessary ingredients for the delivery of an
effective and successful plan. The management plan guidelines can be seen as the conclusion
of this thesis work. Three years are not a sufficient amount of time to develop an effective and
comprehensive Sustainable Forest Management for the CKNP. However, precious
progressions towards its implementation have been made. All those guidelines have been
discussed and decided through a consultative process with the representative of each local
communities. The time-frame for the adoption of those guidelines through the Park area have
been estimated in 5 years. Simultaneously, a
Forest management indication 1 – Constitute forest committees at valley level
and community based forest management
Description
In the valleys where they have not been already constituted, CKNP should promote the
establishment of forest committees at valley level. The forest committees should become the
reference party for the CKNP forest management on the territory, organizing the different
actions planned (i.e. reforestation, plantation, etc.) and monitoring the forest threats &
degradation drivers. Forest committees, moreover, are the pillars of community based forest
management, in which, as the word is suggesting, communities are independently managing
their forests with additional assistance by the Forest Department or the CKNP staff.
Additionally forest committees together with CKNP staff should:
Estimate local communities’ wood necessities and harvesting areas: precisely, using the
questionnaire which has been developed by EV-K2-CNR and University of Padova and
locating harvesting areas on the maps developed for the CKNP. A team, composed by the
local forest committee members and local CKNP staff will organize open interviews with
elders of each village, or, in larger valleys, with a representative sample. This will be a
precious occasion also to raise awareness about forest resources conservation and importance.
85
Report about drivers of forest degradation inside the CKNP buffer area: for each valley a
report should clarify if, and in that case, which are the most important factors affecting
deforestation and forest degradation (illegal harvesting, firewood necessities, timber
harvesting, lack of management guidelines, etc.).
For the SW valleys, where Pinus wallichiana (Kail – Tangshin) or Picea smithiana (Spruce
– Katwul – Stak) forests are present: forest committee should be in charge for the collection
of cones from those two species. [2.5 kg of Pinus wallichiana (Kail – Tangshin) seeds and/or
1 kg of Picea smithiana (Spruce – Katwul – Stak) seeds - depending on species presence in
local forests - would be sufficient to guarantee assisted artificial regeneration in harvested
areas (see forest management indication 3).]
Forest management indication 2 –Sustainable Forest Management Plan per
valley level (SFMP)
Description
Each forest committee shall prepare a simple Sustainable Forest Management Plan at
valley level. This document should include a brief description of the following topics:
Harvesting area: locate, on a valley map, the areas used by each community to
harvest firewood and, eventually, timber.
Estimation of local community wood necessities: through questionnaire (see
management indication 1), the annual wood consumption of local people should be
estimated per village (or groups of villages) level.
Highlight degraded areas: eventually locate on a map the forest areas heavily
degraded and the motivation (if possible).
Regulation already in practice: describe if some regulation have already been set
(e.g. limitation on access, ban on harvesting etc) and for which area are valid.
Forest prescription: in the document all the prescriptions which the forest
committee has established should be clearly stated.
The sustainable forest management plan shall be approved, at least, by the forest
committee and the CKNP.
86
Forest management indication 3 – Timber harvesting in mountain dry temperate
forest.
Description
According to University of Padova, inside CKNP buffer area some forests is eligible for
organized timber harvesting. Those are stands which are classified as “closed forest” of Pinus
wallichiana (Kail, Himalayan Blue Pine) and/or Picea smithiana (Katwul, Morinda spruce).
Similarly to what is performed in Europe and North America, harvesting of green trees
should be allowed if degradation status is limited (but first a change in Northern Area current
forest legislation is needed).
The specific management prescriptions will be defined in the sustainable forest
management plan (SFMP).
General guidelines, set by forest committee, should include:
To adopted a “target diameter” management prescription, for which only the trees
which reach or exceed a certain diameter (60/ 80 cm – 23/30 inch, depending on
specific site and fertility) can be cut while all the trees smaller than this threshold
should be left to grow. These management guidelines (that shall be defined in
detail) ensure a correct diameter composition of the forest stands.
Define the entire forest area eligible for felling and locate it on a map.
Divide this area into parcel, with an average size of 50 hectares (120 acres) and
easily identifiable and understandable borders (ridge, rivers, roads, etc.). Around 10
parcels shall be identified.
Each year, harvest timber (and eventually firewood) only from a certain parcel,
selecting the trees to be cut with the target diameter system: an average cutting
cycle of 10 years shall be allowed.
The area interested by the felling should be left to natural regeneration with
additional assisted artificial regeneration (if necessary) provided by the above
mentioned seed harvesting (see Forest management indication 1).
Avoid grazing, as much as possible, in regeneration areas eventually by building
fence with thorny shrubs (i.e. sea-buckthorns) to prevent goat and sheep feeding on
87
young seedlings. In any case, a collaboration with shepherds should be promoted in
order to avoid unattended grazing.
Support a complete utilization of the wood residuals following tree harvesting (e.g.
branches, stump,...) also for firewood purposes.
Forest management indication 4 – Firewood collection
Description
Firewood collection, being an essential practice for the community living around the
CKNP borders, cannot be limited if alternative energy resources are not found. Moreover, in
the short-term-future we do not foresee any feasible possibility for a significant reduction of
firewood needs of local communities. Nevertheless, actions raising local communities
awareness about the (often) unsustainable long term effects of the current firewood collection
practices should be implemented.
Most of firewood necessities are actually met using a wide array of different forest
resources according to village location: Juniperus is the most common harvested species,
followed by riparian vegetation and other minor shrubs (like Artemisia) in drier and more
continental valleys (NE CKNP).
In principle, even the firewood collection activity should be included in the SFMP, with
simple prescriptions discussed and approved by the forest committee, local community and
CKNP (e.g. reduce collection in heavily degraded areas for a certain time period).
Management indication for firewood collection, which might be considered by the forest
committees include:
Juniperus trees: we recommend to do not harvest complete individuals but rather
cut single branches. Juniperus trees, indeed, show a rather strong resilience and are
able to sprout new branches the following years.
Regarding riparian vegetation: for coppice plants like sea-buckthorns or willows we
suggest to cut single basal shoots from each plant to preserve its root system. Doing
so new shoots can re-grow rapidly producing new biomass to be harvested.
88
Shrubs: for coppice plants we suggest to partially cut the basal shoots trying to
avoid, if possible, the cutting of whole individuals. In these cases, local knowledge
and traditional management system should be emphasized and taken into
consideration.
Forest management indication 5 – Firewood plantation
Description
In those areas were firewood from local forests is hardly sufficient to cover the needs of
local communities, or where forest degradation have depleted above ground biomass to
extremely low amounts, specific actions should be implemented to increase wood availability
from non-forest areas. Plantation of trees (poplar, willow, sea buckthorn) to be managed as
coppices for the production of firewood, therefore, should be promoted as an effective tool to
reduce the pressure on natural forests. Those activities shall be directed particularly to those
valleys where forest cover is naturally scarce.
Forest management indication 6 - Training forests
Description
Inside the buffer areas, training forest could be promoted for each valley (if supported by
local communities). The objective of training forest is to train local park rangers and members
of the forest committees in different forest management practices. Different types of cuttings
can be adopted and effect on forest regeneration monitored, in time. Those would be ideal
areas also for evaluating the regeneration capabilities of forests in time. One training forest
shall be identified for each most common forest typology present in the valley.

89
Annex II: Reforestation guide book
Seed collection timing:
Table 16: Best timing for Pinus and Picea cones harvesting.
Species Timing
Pinus wallichiana Early October
Picea smithiana Late September/ Early October
Storing of cones
Once cones of conifers species (Pinus wallichiana and/or Picea smithiana) have been
collected, they should:
- Placed in large sacks
- Fill the sacks with cones only up to one –half to avoid heat buildup
- Ensure that filled sacks are tied at the top to allow for cone expansion
- Store the filled cone sacks on their side not upright.
- Change sacks if they get wet.
- Store the sacks in a dry, cool and ventilated place.
Generally, freshly picked cones are very moist, and is essential to reduce the moisture
gradually to prevent fungi spread and mimic, at the same time, the natural maturation process.
Try to avoid, if possible, the picking of cones during wet weather. Alternatively, reduce the
number of cones per sack to promote uniform and faster drying.
It’s important to keep the bags not in direct contact with soil to avoid soil moisture to
spread into the sacks. After 2/3 weeks the cones will dry and ultimately they will open,
making seeds extraction simpler.
Seeds extraction
First it’s important to evaluate if cones dryness is sufficient to allow a complete extraction
of the held seeds:
90
- Check that the cones scales are sufficiently open to allow an easy extraction of seeds
on all (or most) of the cones length.
- Check more than one cone per sacks to evaluate the dryings process status.
From each cone a careful extraction of seeds is mandatory to avoid damages. Seeds shall
be extracted on a fine knitted towel by gently shaking the cones. Spruce seeds are comparably
smaller than pine one and should be handled with more care. In particular:
- Avoid seed’s extraction in open environment to prevent seeds dispersion by wind
gusts.
If possible, try to clean the seeds from the debris and eventually take the seed wings off by
gently pressing it. This will facilitate the seeding process.
Storing of seeds
Once extracted, seeds shall be preserved inside sacks and stored in a dry and cool location
(Temperature shall be equal to or below 5°C). Seed can be satisfactorily stored in this
condition until the following spring, provided it is kept cool, in sealed sacks. Make particular
attention on selecting the location for the seed storing: try to avoid as much as possible places
which can be reached by rodents (mice, squirrels, etc). Place barriers or hang the sacks on the
roof to make it harder to reach. Ideally, seed storing location should be close to the area
selected for reforestation or at least at a similar altitude. This is important to couple local
climate with seeds, making them ready to germinate.
Pre-seeding treatment
This section deal with the most important activity to perform before seeding. Seeding can
be done in late autumn-early winter (Winter seeding) or in spring time when snow melts
(Spring seeding).
A) Winter seeding: winter seeding shall be preferred whenever possible if the following
conditions are met:
- reforestation location already chosen
- fence/protection of young seedlings from livestock browsing already built (or in the
case if it is not needed).
91
- Seeds extraction completed before snow accumulation on reforestation ground.
Treatment of seeds: no particular treatment is needed to increase seeds germinability. The
seeds dormancy will be naturally broken when warmer temperatures and water availability
increase as snow melts in spring time.
B) Spring seeding: if winter seeding is not possible, an additional treatment shall be
performed:
- Stratification: seeds shall be placed in a box filled with sand and kept wet with cold
water (5°C) for at least 4/5 days. This treatment is necessary to break the dormancy
and allow a fast germination once the seeds are sowed.


93
ACKNOWLEDGMENT
This research was developed within the framework of SEED Project (Social Economic and
Environmental Development in the CKNP Region, Northern Areas, Pakistan), funded by the
Governments of Italy and Pakistan in collaboration with Ev-K2-CNR Committee and
Karakorum International University.
Special thanks goes to my supervisor, Professor Tommaso Anfodillo, who fully-trusted my
capabilities and have, through specific and precise suggestions, helped the development not
only of this thesis, but also of me as a person.
I want to clearly state my gratitude to all the people which I have been working with at the
Ev-K2 CNR Committee. Thank you for your “hidden” organizational skills, providing me
with all the necessities and all the support needed while I was spending those marvelous 7
months in Pakistan’s Karakorum. All this have been truly appreciated! Your passion and
genuine interests for the mountains, their people and their nature has been a daily source of
inspiration and a great example to follow.
I want to thank Professor Maria Teresa Melis from University of Cagliari, for her patience
and suggestions while I was working on remote sensing and for showing me the best parts of
Cagliari (and its restaurant!).
Maurizio Gallo, for being my first guide in the Karakorum, for his amazing humor which
everybody enjoyed and for the passion and involvement which he is delivering in all his
activities, 365 days per year!
During these 3 years I have been working with many special persons, all of them
fundamental for making this result possible. You are too many to be mentioned all!
In a typical Italian way, I would like to thank my mom, my dad and my sister for their
continuous, never-lasting support and for accepting my need to travel. More recently, also for
tolerating the back-to-Trento invasion of their son. Without complaining! Thank you.
The communities residing in the Central Karakorum National Park opened my eyes
towards new worlds and new lifestyles. The memory of those moments spent with You, those

94
landscapes, those forests and the discussions about religion will be impressed forever in my
mind and eyes. Simple people with big hearts, able to share everything they have with “the
English man” coming from Rome.
Last but not least, all the friends and colleagues in Padova and Trento, who have supported
and sustained the Nerd-side-of-me for many years.
Finally you get rid of me (maybe), thank you again!
95
CHAPTER 8
BIBLIOGRAPHY
Adam W. The Future of Sustainability: Re-thinking Environment and Development in the Twenty.first
Century. In: IUCN Renowned Thinkers Meeting--IUCN, ed. (2006) New York.
Aguirre-Gutiérrez J, Seijmonsbergen AC, Duivenvoorden JF. Optimizing land cover classification
accuracy for change detection, a combined pixel-based and object-based approach in a
mountainous area in Mexico. Applied Geography (2012) 34:29-37.
Ahmed M, Husain T, Sheikh A, Hussain S, Siddiqui M. Phytosociology and structure of Himalayan
forests from different climatic zones of Pakistan. Pakistan Journal of Botany (2006) 38:361-
383.
Akbar M, Ahmed M, Afzal M, Choudhary F, Zafar Usama M, Hussain A. Phytosociology and
Structure of Some Forests of Skardu district of Karakorum Range of Pakistan. American-
Eurasian Journal of Agricolture & Environmental Science (2010) 9:576-583.
Akbar M, Ahmed M, Hussain A, Zafar Usama M, Khan M. Quantitative forests description from
Skardu, Gilgit and Astore districts of Gilgit-Baltistan, Pakistan. Fuuast Journal of Biology
(2011) 1:149-160.
Ali A, et al. Mapping land cover gradients through analysis of hyper-temporal NDVI imagery.
International Journal of Applied Earth Observation and Geoinformation (2013) 23:301-312.
Ali J, Benjaminsen T, Hammad A, Dick O. The road to deforestation: An assessmnet of forest loss and
its causes in Basho Valley, Northern Pakistan. Global Environmental Change (2005) 15:370-
380.
Ali J, Benjaminsen TA. Fuelwood, Timber and Deforestation in the Himalayas. Mountain Research
and Development (2004) 24:312-318.
Ali J, Nyborg ILP. Corruption or an Alternative System? Re-Assessing Corruption and the Role of the
Forest Services in the Northern Areas, Pakistan. International Forestry Review (2010) 12:209-
220.
Ali T, Shahbaz B, Suleri A. Analyses of Myths and Realities of Deforestation in Northwest Pakistan:
Implication for Forestry Extension. International Journal of Agricolture & Biology (2006)
8:107 - 110.
Anaya JA, Chuvieco E, Palacios-Orueta A. Aboveground biomass assessment in Colombia: A remote
sensing approach. Forest Ecology and Management (2009) 257:1237-1246.
Angelstam P, Persson R, Schlaepfer R. The sustainable forest management vision and biodiversity:
barriers and bridges for implementation in actual landscapes. Ecological Bullettins (2004)
51:29-49.
96
Archer DR, Fowler HJ. Spatial and temporal variations in precipitation in the Upper Indus Basin,
global teleconnections and hydrological implications. Hydrology and Earth System Sciences
(2004) 8:47-61.
Avitabile V, Baccini A, Friedl MA, Schmullius C. Capabilities and limitations of Landsat and land
cover data for aboveground woody biomass estimation of Uganda. Remote sensing of
Environment (2012) 117:366-380.
Bakr N, Weindorf DC, Bahnassy MH, Marei SM, El-Badawi MM. Monitoring land cover changes in a
newly reclaimed area of Egypt using multi-temporal Landsat data. Applied Geography (2010)
30:592-605.
Bayarsaikhan U, Boldgiv B, Kim K-R, Park K-A, Lee D. Change detection and classification of land
cover at Hustai National Park in Mongolia. International Journal of Applied Earth Observation
and Geoinformation (2009) 11:273-280.
Brown de Colstoun EC, Story MH, Thompson C, Commisso K, Smith TG, Irons JR. National Park
vegetation mapping using multitemporal Landsat 7 data and a decision tree classifier. Remote
sensing of Environment (2003) 85:316-327.
Busch J, Godoy F, Turner WR, Harvey CA. Biodiversity co-benefits of reducing emissions from
deforestation under alternative reference levels and levels of finance. Conservation Letters
(2011) 4:101-115.
Champion S, Seth G, Khattak G. Forest types of Pakistan. (1965) Peshawar: Pakistan Forest Institute.
Chen D, Stown D. The effect of training strategies on supervised classification at different spatial
resolutions. Photogrammetric Engineering & Remote Sensing (2002) 68:1155-1161.
CKNP. Central Karakoram National Park Integrated Management Plan. (2012) Gilgit.
Davis L, Johnson K, Bettinger P, Howard T. Forest management: to Sustain Ecological, Econmic, and
Social Values. (2001) New York: McGraw-Hill.
DeFries R, et al. Reducing Greenhouse Gas Emissions from Deforestation in Developing Countries:
Considerations for Monitoring and Measuring In: GTOS Report No. 46--26 G-GRN, ed.
(2006) Rome: GTOS. 30.
Dellasala DA, et al. Priority Actions for Sustainable Forest Management in the International Year of
Forests. Conservation Biology (2012) 26:572-575.
Denscombe M. The good research guide. (2011) New York: Open University Press.
Desio A. Karakorum Mountains. Geological Society (1974) 4:255-266.
Dhakal B, Bigsby H, Cullen R. Socioeconomic Impacts of Public Forest Policies on Heterogeneous
Agricultural Households. Environ Resource Econ (2012) 53:73-95.
Dong J, et al. Remote sensing estimates of boreal and temperate forest woody biomass: carbon pools,
sources, and sinks. Remote sensing of Environment (2003) 84:393-410.
Dorren LKA, Maier B, Seijmonsbergen AC. Improved Landsat-based forest mapping in steep
mountainous terrain using object-based classification. Forest Ecology and Management (2003)
183:31-46.
Du Z. A comparative study on the Altitudinal belts in the Karakorum mountains. In: Karakorum -
Hindukush - Himalaya: Dynamics of Change--Ed. IS, ed. (1998) Tubingen: Rudiger Koppe
Verlag. 127 - 147.
97
Eberhardt E, Dickorè W, Miehe G. Vegetation map of the Batura valley (Hunza Karakorum, North
Pakistan). Erdkunde (2007) 61:93-112.
Ellis EA, Porter-Bolland L. Is community-based forest management more effective than protected
areas?: A comparison of land use/land cover change in two neighboring study areas of the
Central Yucatan Peninsula, Mexico. Forest Ecology and Management (2008) 256:1971-1983.
EV-K2-CNR. Central Karakorum National Park - Integrated Management Plan (2009) Gilgit: Ev K2
CNR.
FAO. Country Report: Pakistan. In: Global Forest Resources Assessment 2010 (2010) Rome. 50.
FAO. Mountain Forest in a changing World--Price MF, Gratzer G, Duguma LD, Kohler T, Maselli D,
Romeo R, eds. (2011a) Rome: FAO.
FAO. State of the World's Forest--FAO, ed. (2011b) Rome.
FAO. South Asian Forests and Forestry. In: Subregional report --Commission A-PF, ed. (2012)
Bangkok: FAO.
Fisher R. Devolution and Decentralization of Forest Management in Asia and the Pacific. Unasylva
(1999) 50.
Flury B. Livehoods and Natural Resource Management in the Central Karakorum National Park--CNR
EK, ed. (2012) Islamabad: EV K2 CNR. 46.
Foody GM, Mathur A. Toward intelligent training of supervised image classifications: directing
training data acquisition for SVM classification. Remote sensing of Environment (2004)
93:107-117.
Friedl MA, et al. Global land cover mapping from MODIS: algorithms and early results. Remote
sensing of Environment (2002) 83:287-302.
Gansser A. Geology of the Himalayas. (1964) London: Interscience Publishers.
Gartzia M, Alados CL, Pérez-Cabello F, Bueno CG. Improving the Accuracy of Vegetation
Classifications in Mountainous Areas. Mountain Research and Development (2013) 33:63-74.
Geiser U, Steimann B. State actors' livelihoods, acts of translation, and forest sector reforms in
northwest Pakistan. Contemporary South Asia (2004) 13:437-448.
Gibson CC, Ostrom E, Ahn TK. The concept of scale and the human dimensions of global change: a
survey. Ecological Economics (2000) 32:217-239.
Goetz S, et al. Mapping and monitoring carbon stocks with satellite observations: a comparison of
methods. Carbon Balance Manage (2009) 4:2.
Gohar A. Competing Interests and Institutional Ambiguities: Problems of Sustainable Forest
Management in the Northern Areas of Pakistan. (2002) Bath: University of Bath. 299.
Government of Pakistan. National Forest Policy Review (2001) Islamabad.
Grier CC, Elliott KJ, McCullough DG. Biomass distribution and productivity ofPinus edulis—
Juniperus monosperma woodlands of north-central Arizona. Forest Ecology and Management
(1992) 50:331-350.
Hammi S, et al. Can traditional forest management buffer forest depletion? Dynamics of Moroccan
High Atlas Mountain forests using remote sensing and vegetation analysis. Forest Ecology
and Management (2010) 260:1861-1872.
98
Hantson S, Chuvieco E. Evaluation of different topographic correction methods for Landsat imagery.
International Journal of Applied Earth Observation and Geoinformation (2011) 13:691-700.
Hasan L. An anatomy of State failures in the Forest Management in Pakistan. The Pakistan
Development Review (2007) 46:1189-1203.
Heinl M, Walde J, Tappeiner G, Tappeiner U. Classifiers vs. input variables—The drivers in image
classification for land cover mapping. International Journal of Applied Earth Observation and
Geoinformation (2009) 11:423-430.
Hussain A, Ahmed M, Shaukat S, Akbar M, Zafar Usama M. Future trends of the vegetation from
Central Karakoram National Park, Gilgit-Baltistan, Pakistan. Science Technology and
Development (2013) 32:165-181.
ICIMOD. Climate Change in the Hindu Kush - Himalayas - The state of Current Knowledge (2011)
Kathmandu: ICIMOD.
Irland L. Assessing sustainability for global forests: a proposed pathway to fill critical data gaps.
European Journal of Forest Research (2010) 129:777-786.
IUCN. Assessing Northern Areas Progress towards Sustainability--IUCN-Pakistan, ed. (2003a). 38.
IUCN. Forestry. In: Northern Areas Strategy for Sustainable Development--IUCN-Pakistan, ed.
(2003b) Gilgit.
IUCN. Northern Areas State of Environment & Development--Pakistan I, ed. (2003c) Karachi. 348.
IUCN. Central karakoram Conservation Complex - Management Planning Framework. In: HKKH-
Technical Paper--HKKH-Partnership, ed. (2009). 62.
Ji L, et al. Estimating aboveground biomass in interior Alaska with Landsat data and field
measurement. International Journal of Applied Earth observation and Geoingormation (2012)
18:451-561.
Jones H, Vaughan R. Remote sensing of vegetation: principle techniques and application. (2010)
Oxford: Oxford University Press.
Kahya O, Bayram B, Reis S. Land cover classification with an expert system approach using Landsat
ETM imagery: a case study of Trabzon. Environ Monit Assess (2010) 160:431-438.
Karki MB, Shrestha AB, Winiger M. Enhancing Knowledge Management and Adaptation Capacity
for Integrated Management of Water Resources in the Indus River Basin. Mountain Research
and Development (2011) 31:242-251.
Kennedy JJ, Thomas JW, Glueck P. Evolving forestry and rural development beliefs at midpoint and
close of the 20th century. Forest Policy and Economics (2001) 3:81-95.
Khan SR, Khan SR. Assessing poverty–deforestation links: Evidence from Swat, Pakistan. Ecological
Economics (2009) 68:2607-2618.
Knudsen A. Deforestation and Entrepreneurship in the North-West Frontier Province, Pakistan. In:
State, Society and the Environment in South Asia--Madsen ST, ed. (1999) Richmond, USA:
Nordic Institute of Asian Studies.
Knudsen A. Logging the ‘Frontier’: Narratives of Deforestation in the Northern Borderlands of British
India, c. 1850–1940. Forum for Development Studies (2011) 38:299-319.
Kolios S, Stylios CD. Identification of land cover/land use changes in the greater area of the Preveza
peninsula in Greece using Landsat satellite data. Applied Geography (2013) 40:150-160.
99
Kozak J, Estreguil C, Ostapowicz K. European forest cover mapping with high resolution satellite
data: The Carpathians case study. International Journal of Applied Earth Observation and
Geoinformation (2008) 10:44-55.
Kreutzmann H. Pastoral Practices and their transformation in the North-Western Karakoram. Nomadic
Peoples (2004) 8:54-88.
Kumar M, Sharma CM. Fuelwood consumption pattern at different altitudes in rural areas of Garhwal
Himalaya. Biomass and Bioenergy (2009) 33:1413-1418.
Langner A, Samejima H, Ong RC, Titin J, Kitayama K. Integration of carbon conservation into
sustainable forest management using high resolution satellite imagery: A case study in Sabah,
Malaysian Borneo. International Journal of Applied Earth Observation and Geoinformation
(2012) 18:305-312.
Lefever DW. Measuring Geographic Concentration by Means of the Standard Deviational Ellipse.
American Journal of Sociology (1926) 32:88-94.
Leverington F, Costa K, Pavese H, Lisle A, Hockings M. A Global Analysis of Protected Area
Management Effectiveness. Environmental Management (2010) 46:685-698.
Lu D. The potential and challenge of remote sensing-based biomass estimation. International Journal
of Remote Sensing (2006) 27:1297 - 1328.
Lu D, Weng Q. A survey of image classification methods and techniques for improving classification
performance. Int. J. Remote Sens. (2007) 28:823-870.
Maikhuri RK, Nautiyal S, Rao KS, Chandrasekhar K, Gavali R, Saxena KG. Analysis and resolution
of protected area–people conflicts in Nanda Devi Biosphere Reserve, India. Environmental
Conservation (2000) 27:43-53.
Margules CR, Pressey RL. Systematic conservation planning. Nature (2000) 405:243-253.
Marziliano P, Menguzzato G, Scuderi A, Corona P. Simplified methods to inventory the current
annual increment of forest standing volume. iForest - Biogeosciences and Forestry (2012)
5:276-282.
Masozera MK, Alavalapati JRR, Jacobson SK, Shrestha RK. Assessing the suitability of community-
based management for the Nyungwe Forest Reserve, Rwanda. Forest Policy and Economics
(2006) 8:206-216.
Mather P, Koch M. Computer processing of Remotely - Sensed Images. (2011) Oxford: Wiley-
Blackwell.
McShane TO, et al. Hard choices: Making trade-offs between biodiversity conservation and human
well-being. Biological Conservation (2011) 144:966-972.
Mendoza GA, Prabhu R. Combining participatory modeling and multi-criteria analysis for
community-based forest management. Forest Ecology and Management (2005) 207:145-156.
Miehe S, Miehe G. Vegetation Patterns as Indicators of Climatic Humidity in the Western Karakorum.
In: Karakorum - Hindukush - Himalaya: Dynamics of Change--Ed. IS, ed. (1998) Tubingen:
Rudiger Koppe Verlag. 101 - 126.
Minora U, et al. 2010 glacier changes in the Central Karakoram National Park: a contribution to
evaluate the magnitude and rate of the "Karakoram anomaly". The Cryosphere Discuss.
(2013) 7:2891-2941.
100
Munsi M, Areendran G, Joshi PK. Modeling spatio-temporal change patterns of forest cover: a case
study from the Himalayan foothills (India). Reg Environ Change (2012) 12:619-632.
Nagendra H, Karmacharya M, Karna B. Evaluating forest management in Nepal: views across space
and time. Ecology and Society (2005) 10:24.
Naughton-Treves L, Holland MB, Brandon K. THE ROLE OF PROTECTED AREAS IN
CONSERVING BIODIVERSITY AND SUSTAINING LOCAL LIVELIHOODS. Annual
Review of Environment and Resources (2005) 30:219-252.
Nüsser M. Change and Persistence: Contemporary Landscape Transformation in the Nanga Parbat
Region, Northern Pakistan. Mountain Research and Development (2000) 20:348-355.
Ostrom E. Governing the Commons. Evolution of Institutions for Collective Action. (1990)
Cambridge: Cambridge University Press.
Otukei JR, Blaschke T. Land cover change assessment using decision trees, support vector machines
and maximum likelihood classification algorithms. International Journal of Applied Earth
Observation and Geoinformation (2010) 12, Supplement 1:S27-S31.
Paneque-Gálvez J, et al. Enhanced land use/cover classification of heterogeneous tropical landscapes
using support vector machines and textural homogeneity. International Journal of Applied
Earth Observation and Geoinformation (2013) 23:372-383.
Phillip M. Measuring Trees and Forests. (1994) UK: CAB International.
Qasim M, Hubacek K, Termansen M, Khan A. Spatial and temporal dynamics of land use pattern in
District Swat, Hindu Kush Himalayan region of Pakistan. Applied Geography (2011) 31:820-
828.
Rasul G, Karki M. Participatory Forest management in South Asia: a comparative analysis of policies,
institutions and approaches. (2007) Kathmandu: ICIMOD.
Rolland Y, Mahèo G, Guillot S, Pecher A. Tectono-metamorphic evolution of the Karakorum
Metamorphic complex (Dassu-Askole area, NE Pakistan): exhumation of mid-crustal HT-MP
gneisses in a convergent context. Journal of Metamorphic geology (2001) 19:717-737.
Rossiter D. Technical note: Statistical methods for accuracy assesment of classified thematic maps. In:
Technical Report ITC (2004) Enschede, NL.
Rouse J, Haas R, Schell J. Monitoring the vernal advancement and retrogradation (greenwave effect)
of natural vegetation. (1974) College Station: Texas A and M University.
Sam T, Shepherd G. Community Forest Management. In: United Nations Forum on Forest Secretariat-
-UNFF9: Forests for People LaPE, ed. (2011) New York.
Santin-Janin H, Garel M, Chapuis JL, Pontier D. Assessing the performance of NDVI as a proxy for
plant biomass using non-linear models: a case study on the Kerguelen archipelago. Polar Biol
(2009) 32:861-871.
Schickhoff U. Socio-Economic Background and Ecological Effects of Forest Destruction in Northern
Pakistan. In: Karakorum-Hindukush-Himalaya: Dynamics of Change--Stellrecht I, ed. (1998)
Tubingen, Germany: Rudiger Koppe Verlag Koln. 287-302.
Shahbaz B, Ali T, Suleri AQ. Dilemmas and challenges in forest conservation and development
interventions: Case of Northwest Pakistan. Forest Policy and Economics (2011) 13:473-478.
101
Shahbaz B, Ali T, Suleri Q. A critical analysis of forest policies of Pakistan: implication for
suistainable livelihoods. Mitigation and Adaptation Strategies for Global Change (2007)
12:441-453.
Sharma CM, Baduni NP, Gairola S, Ghildiyal SK, Suyal S. Effects of slope aspects on forest
compositions, community structures and soil properties in natural temperate forests of
Garhwal Himalaya. Journal of Forestry Research (2010) 21:331-337.
Soenen SA, Peddle DR, Hall RJ, Coburn CA, Hall FG. Estimating aboveground forest biomass from
canopy reflectance model inversion in mountainous terrain. Remote sensing of Environment
(2010) 114:1325-1337.
Solans Vila JP, Barbosa P. Post-fire vegetation regrowth detection in the Deiva Marina region
(Liguria-Italy) using Landsat TM and ETM+ data. Ecological Modelling (2010) 221:75-84.
Song C. Optical remote sensing of forest leaf area index and biomass. Progress in Physical Geography
(2013) 37:98-113.
Tambe S, Arrawatia ML, Sharma N. Assessing the Priorities for Sustainable Forest Management in
the Sikkim Himalaya, India: A Remote Sensing Based Approach. J Indian Soc Remote Sens
(2011) 39:555-564.
Tang B-H, et al. Determination of snow cover from MODIS data for the Tibetan Plateau region.
International Journal of Applied Earth Observation and Geoinformation (2013) 21:356-365.
Teillet PM, Guindon B, Goodenough DG. On the slope-aspect correction of multispectral scanner
data. (1982).
Ter-Mikaelian MT, Korzukhin MD. Biomass equations for sixty-five North American tree species.
Forest Ecology and Management (1997) 97:1-24.
Treydte K, et al. The twentieth century was the wettest period in northern Pakistan over the past
millennium. Nature (2006) 440:1179 - 1182.
UN-ECE, FAO. Forest reources of Europe, CIS, North America, Australia, Japan and New Zeland
(Industrialized Temperate/Boreal Countries). In: Contribution to the Global Forest Resources
Assessment (2000) New York. 445.
UN. Agenda 21: Earth Summit In: The United Nations Conference on Environment & Development
(1992a) Rio de Janerio, Brazil.
UN. Convention of Biological Diversity--UN, ed. (1992b): UN.
UN. Pakistan One United Nations Programme 2013 - 2017--UN, ed. (2012).
UNCED. Principles for a global consensus on the management, conservation and sustainable
development of all types of forests. In: United Nation General Assembly (1992) Rio de
Janeiro.
UNDP. United Nations Millenium Declaration - Resolution 55/2 (2000).
van der Werf GR, et al. CO2 emissions from forest loss. Nature Geosci (2009) 2:737-738.
Vanonckelen S, Lhermitte S, Van Rompaey A. The effect of atmospheric and topographic correction
methods on land cover classification accuracy. International Journal of Applied Earth
Observation and Geoinformation (2013) 24:9-21.
Vanwinckelen G, Blockeel H. On estimating model accuracy with repeated cross-validation. Presented
at the Proceedings of the 21st Belgian-Dutch Conference on Machine Learning (2012) Ghent

102
Veldkamp A, Fresco LO. CLUE: a conceptual model to study the Conversion of Land Use and its
Effects. Ecological Modelling (1996) 85:253-270.
Wang T, Skidmore AK, Toxopeus AG, Liu X. Understory Bamboo discrimination using a winter
image. Photogrammetric Engineering & Remote Sensing (2009) 75:37-47.
Wells M, Brandon K, Hannah L. People and Parks: Linking Protected Areas Management with Local
Communities. (1992) Washington, DC: World Bank/World Wildlife Fund/U.S. Agency for
International Development.
World Bank. Pakistan - Gilgit-Baltistan Economic Report : Broadening the Transformation (2010)
Washington DC.
Yin R K. Case study research: design and method. (2009) Thousands Oak.